Saipem 2017 Results and Strategy Update 2017 Results and... · 6 As disclosed to the market by...
54
2017 RESULTS AND STRATEGY UPDATE PRESENTATION 6 March 2018
Transcript of Saipem 2017 Results and Strategy Update 2017 Results and... · 6 As disclosed to the market by...
2017 RESULTS
AND STRATEGY UPDATE
PRESENTATION
6 March 2018

2
FORWARD-LOOKING STATEMENTS
Forward-looking statements contained in this presentation regrading future events and future results are based oncurrent expectations, estimates, forecasts and projections about the industries in which Saipem S.p.A. (the“Company”) operates, as well as the beliefs and assumptions of the Company’s management.These forward-looking statements are only predictions and are subject to known and unknown risks, uncertainties,assumptions and other factors beyond the Company’ control that are difficult to predict because they relate toevents and depend on circumstances that will occur in the future. These include, but are not limited to: forex andinterest rate fluctuations, commodity price volatility, credit and liquidity risks, HSE risks, the levels of capitalexpenditure in the oil and gas industry and other sectors, political instability in areas where the Group operates,actions by competitors, success of commercial transactions, risks associated with the execution of projects(including ongoing investment projects), in addition to changes in stakeholders’ expectations and other changesaffecting business conditions.
Therefore, the Company’s actual results may differ materially and adversely from those expressed or implied in anyforward-looking statements. They are neither statements of historical fact nor guarantees of future performance.The Company therefore caution against relying on any of these forward-looking statements. Factors that mightcause or contribute to such differences include, but are not limited to, economic conditions globally, the impact ofcompetition, political and economic developments in the countries in which the Company operates, and regulatorydevelopments in Italy and internationally. Any forward-looking statements made by or on behalf of the Companyspeak only as of the date they are made. The Company undertakes no obligation to update any forward-lookingstatements to reflect any changes in the Company’s expectations with regard thereto or any changes in events,conditions or circumstances on which any such statement is based. Accordingly, readers should not place unduereliance on forward-looking statements due to the inherent uncertainty therein.
The Financial Reports contain analyses of some of the aforementioned risks.
Forward-looking statements neither represent nor can be considered as estimates for legal, accounting, fiscal orinvestment purposes. Forward-looking statements are not intended to provide assurances and/or solicitinvestment.

3
2
3
TODAY’S PRESENTATION
5
FY2017 RESULTS
GROUP STRATEGY UPDATE AND BACKLOG
CLOSING REMARKS AND 2018 GUIDANCE
1 OPENING REMARKS
4 DIVISIONS

4
2017: READY FOR THE FUTURE
FY 2017 performance: E&C Offshore sound margins underpinned by cornerstone projects
• Volumes softening in 4Q17 mainly due to shift of activities to 2018 E&C Onshore profitability recovery on track, excluding LPG arbitration Drilling Offshore resilient margins backed by long term contracts High utilisation in Drilling Onshore outside South America
Strong 4Q awards of €2.4bn and €12.4bn year-end backlog
Net Debt reduced to €1.3bn
Settlement in Algeria reopens a strategic market
2018 Guidance
Strategy Update: Divisional reorganisation fully implemented Focus on core business: disposal of maritime works business Continued de-risking

FY 2017 RESULTS

6
As disclosed to the market by Saipem with a press release dated March 5, 2018(available on the Company's website in the "Media - Press Release" section), Consobdeclared with resolution no. 20324 of 2 March 2018 (the "Resolution") the "non-compliance of Saipem's 2016 consolidated and statutory financial statements with therules governing their preparation", as stated by Saipem in the aforementioned pressrelease of March 5, 2018 to which complete reference is made.The Board of Directors of Saipem, in disagreement with the Resolution of Consob,resolved on March 5, 2018 to propose an appeal against it in the competent judicialoffices.

7
FY 2017 RESULTS
YoY COMPARISON (€ mn)
Adjusted EBITDARevenues Adjusted Net Result
46
226
FY17FY16FY17FY16 FY17FY16
8,9999,976
1,266
964
12.7% 10.7%margin
8
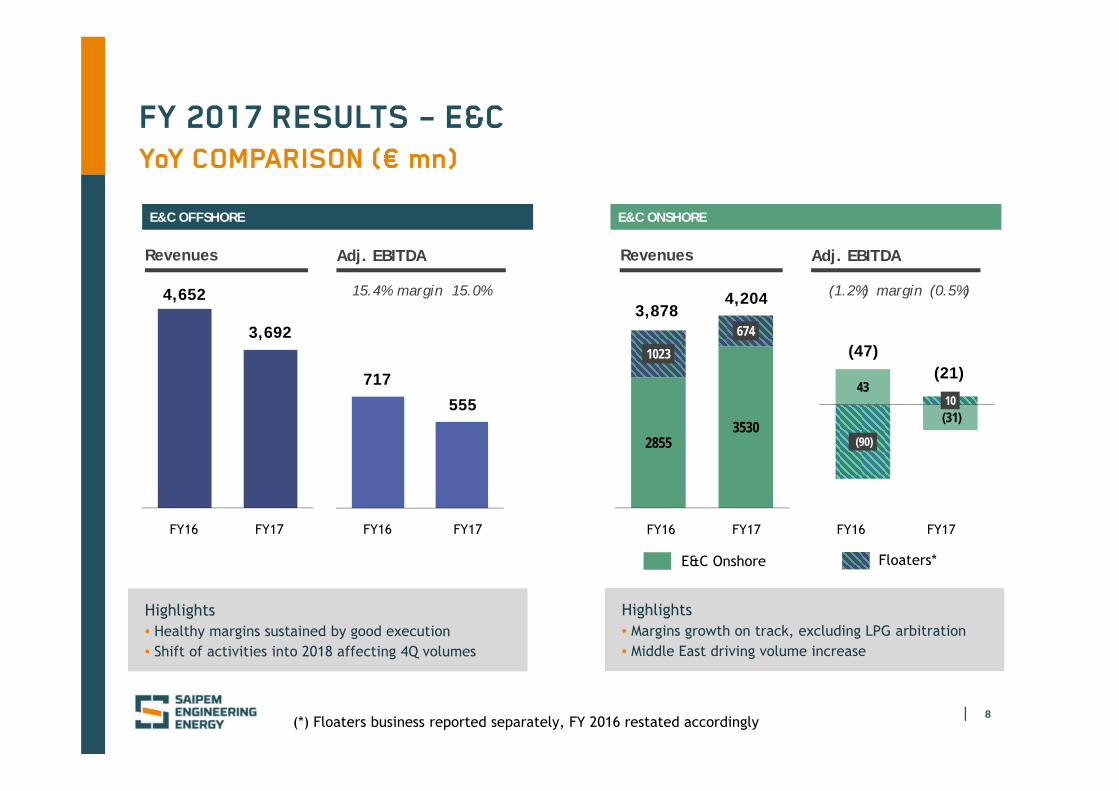
FY 2017 RESULTS – E&C
YoY COMPARISON (€ mn)
(*) Floaters business reported separately, FY 2016 restated accordingly
E&C Onshore Floaters*
Adj. EBITDARevenues
FY17FY16FY17FY16
28553530
1023674
Highlights• Healthy margins sustained by good execution• Shift of activities into 2018 affecting 4Q volumes
Highlights• Margins growth on track, excluding LPG arbitration • Middle East driving volume increase
3,8784,204
FY17FY16FY17FY16
E&C OFFSHORE E&C ONSHORE
3,692
4,652
Adj. EBITDARevenues
15.4% 15.0%margin
555
717
(1.2%) (0.5%)margin
43
(31)
(90)
10
(47)(21)
9
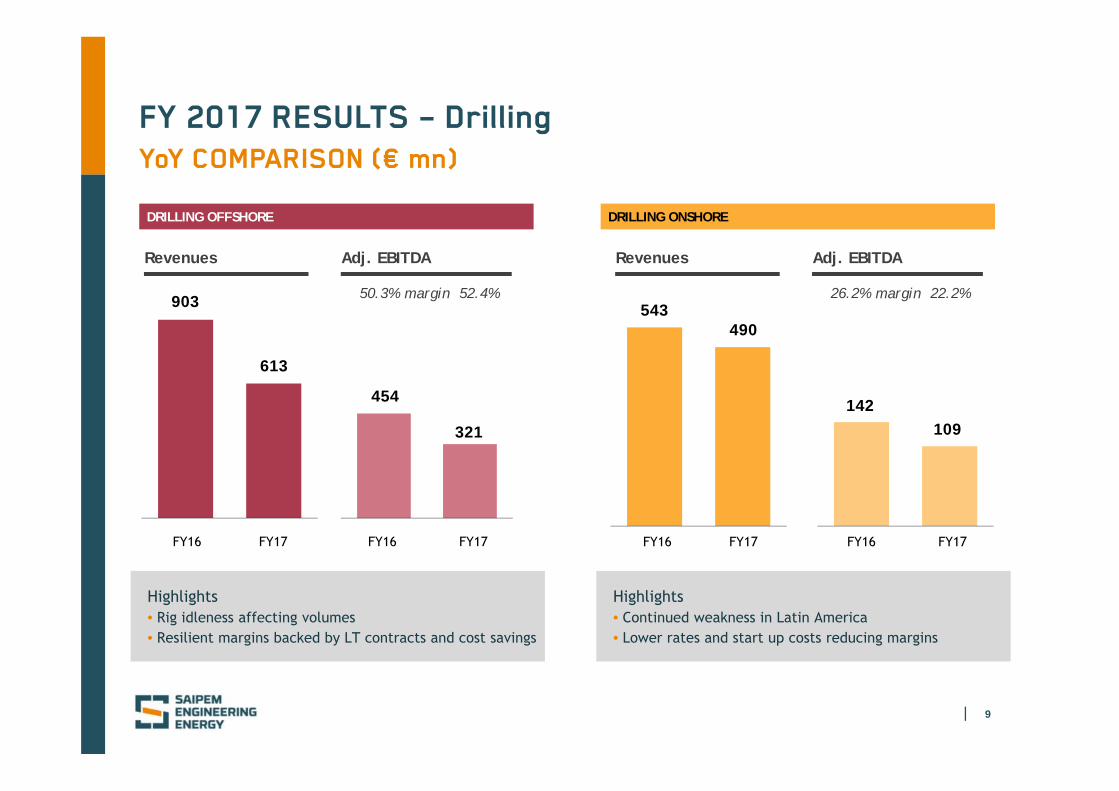
FY 2017 RESULTS – Drilling
YoY COMPARISON (€ mn)
Adj. EBITDARevenues
FY17FY16FY17FY16
Highlights• Rig idleness affecting volumes• Resilient margins backed by LT contracts and cost savings
613
903
321
454
Adj. EBITDARevenues
Highlights• Continued weakness in Latin America• Lower rates and start up costs reducing margins
543490
142109
FY17FY16FY17FY16
DRILLING OFFSHORE DRILLING ONSHORE
50.3% 52.4%margin 26.2% 22.2%margin

10
FY17Adjusted
Net provisions for redundancies
Tax settlement FY17Reported
46(43)
(79)
(328)
SPECIAL ITEMS
Assetswrite-downs
(252)
FY 2017 NET RESULT
RECONCILIATION BETWEEN ADJUSTED AND REPORTED (€ mn)
Net Result

11
FY 2017 RESULTS - FROM EBITDA Adjusted TO NET RESULT
D&A
TAX RATE
FINANCE CHARGES
Tax rate 2017 impacted mainly by LPG arbitration
Witholding taxes and unused deferred tax assets in short/medium term
220 17889
197
684
122 133 73196
524
OffshoreDrilling
OnshoreDrilling
E&COnshore*
E&COffshore
TotalD&A
FY2016
FY2017
(*) Floaters businessincluded in E&COnshore, FY 2016restated accordingly
D&A€ mn
125
39
59
Financing costs Project hedgingcosts
One-off forexgain/losses
Total FinanceCharges
2017 € mn
223
Normalised long-term tax rate c.30% or lower

12
FY 2017 NET DEBT EVOLUTION
(€ bn)
Adj. Cash Flow(Adj. N.P.+ D.&A.)
CapexNet Debt @Dec. 31, 2016
Net Debt @Dec. 31, 2017
Δ Working Capital and
Others
1.301.30(0.57)(0.57)
0.260.26
0.340.34
1.451.45
(0.18)(0.18)
Non-recurring items*
Net Debt target met despite non-recurring items
(*) Non-recurring items include: project-related JV cash distribution and tax settlement

13
500 500 500 500
35 64 64
75 60 60
60
76
50
375 75
25 25
62
147439
139
600 585560
60
576
286
Liquidity 2018 2019 2020 2021 2022 2023 2024 2025+
Bonds ECA Facilities Bank Facilities Other Debt
CAPITAL STRUCTURE AS OF DECEMBER 31, 2017
(€ mn)
Debt maturity profile
3,153
New €500mn Eurobond issued in 4Q’17 with maturity January 2025 Term Loan fully pre-paid Average debt maturity extended to 4.3 years. Overall financing interest rate c.4% including treasury hedging Undrawn committed cash facilities totalling c.€1.8bn, in addition to c.€0.3bn of uncommitted facilities Available cash and equivalent c. €1.4bn**
1,367
Undrawn RCF*
Undrawn ECA* Facilities (GIEK and Atradius)
1,500
Available Cash and equiv.**
(*) Committed
(**) Not including additional trapped cash c.€0.5bn
NEW BOND

14
NEW IFRS – IMPACT RESTRICTED TO IFRS16
• Asset “Right-of-Use” in capital employed and depreciated (D&A) • Lease obligations increasing net debt• Financial charges applied over lease debt
Very preliminary estimates
Increase of financial debt estimated ranging from €650mn to €800mn, depending upon contractual options
Increase of EBITDA estimated by c.€100mn, mostly in E&C Offshore
IFRS 16 – LEASE ACCOUNTINGFROM JANUARY 1, 2019
FE
AT
UR
ES
IMP
AC
TS
• No material impact
IFRS 15 – REVENUE RECOGNITION and IFRS 9 – FINANCIAL INSTRUMENTSFROM JANUARY 1, 2018

GROUP STRATEGY UPDATE
AND BACKLOG

16
MARKET OUTLOOK
Increasing brownfields and tie-back demand Resilience in gas projects and Middle East Integrated service opportunities, across all segments
Offshore E&C
Early signs of demand increase Recovery in dayrates expected in the medium term
Offshore Drilling
Significant and stable Middle East demand Robust North America market, South American market still weak
Onshore Drilling
Engineering activity increases in 2018, anticipating E&C recovery in the mid term Early engagement to exploit future recovery
XSIGHT
Onshore E&C Competition remains intense, resilient Middle East market Few but significant LNG initiatives, more opportunities in regasification Refining and petrochemical activities in Middle East and Asia-Pacific
Oil fundamentals volatile but improving Global E&P spending flat, offshore segments still under pressure E&P Industry focused on US unconventional, gas and cash generation Renewables providing new opportunities
2018 scenario
17
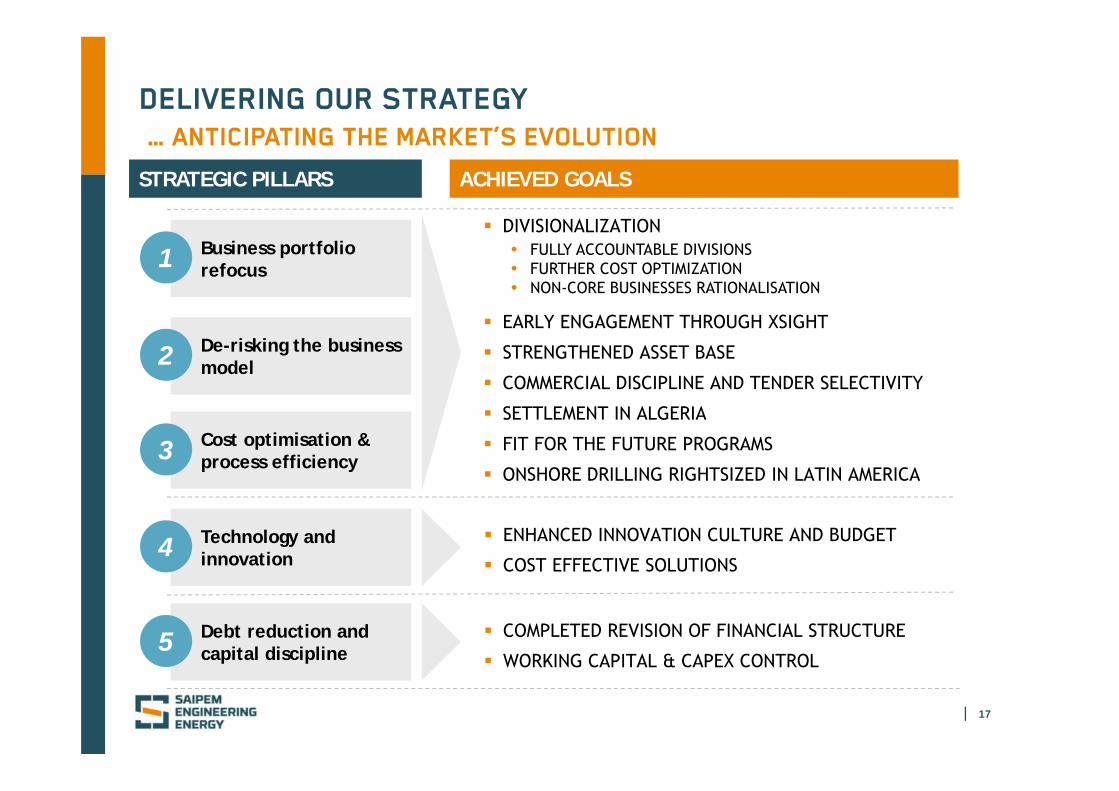
DELIVERING OUR STRATEGY
… ANTICIPATING THE MARKET’S EVOLUTION
Cost optimisation & process efficiency3
Technology and innovation4
Debt reduction and capital discipline5
De-risking the business model2
STRATEGIC PILLARS
Business portfolio refocus1
ACHIEVED GOALS
ENHANCED INNOVATION CULTURE AND BUDGET
COST EFFECTIVE SOLUTIONS
COMPLETED REVISION OF FINANCIAL STRUCTURE
WORKING CAPITAL & CAPEX CONTROL
• FULLY ACCOUNTABLE DIVISIONS• FURTHER COST OPTIMIZATION• NON-CORE BUSINESSES RATIONALISATION
DIVISIONALIZATION
STRENGTHENED ASSET BASE
COMMERCIAL DISCIPLINE AND TENDER SELECTIVITY
EARLY ENGAGEMENT THROUGH XSIGHT
SETTLEMENT IN ALGERIA
ONSHORE DRILLING RIGHTSIZED IN LATIN AMERICA
FIT FOR THE FUTURE PROGRAMS

18
• SURF• SUBSEA FACTORY• LIFE OF FIELD• PIPELINES• DECOMMISSIONING• RENEWABLES
• DECOMMISSIONING• SURF • LIFE OF FIELD• SUBSEA FACTORY• PIPELINES
• SURF• LIFE OF FIELD• SUBSEA FACTORY• PIPELINES
MID/LONG TERM BUSINESS FOCUS
• LNG• PIPELINES
GAS MONETIZATION
FLOATERS
PIPELINES
• GAS MONETIZATION• POWER• LNG• FLOATERS• PETROCHEMICAL
• REFINING• LNG
• GAS MONETIZATION• RENEWABLES• FLOATERS
• LNG• REFINING• INFRASTRUCTURES• UPSTREAM
• REFINING• GAS MONETIZATION
INFRASTRUCTURES
• SURF• IMR• LIFE OF FIELD• PIPELINES• DECOMMISSION.
• SURF• IMR• PIPELINES
• CONVENTIONAL DEVELOP.
• PIPELINES
• SURF• LIFE OF FIELD• PIPELINES• DECOMMISSIONING• CONVENTIONAL
DEVELOPMENTS
• PIPELINES• SURF
E&C OFFSHORE
E&C ONSHORE
E&C & DRILLING OFFSHORE
E&C & DRILLING ONSHORE
LEGEND
DRILLING ONSHORE
REFINING
• UPSTREAM• PIPELINES• REFINING• RENEWABL.
• SURF

19
TECHNOLOGICAL INNOVATION
DRIVERS
SHORT RANGE REACTIVE SOLUTIONS AND NOVEL CONCEPTS TO SECURE MEDIUM/LONG TERM COMPETITIVE EDGE
LONG TERM (DRIVEN BY ENERGY SCENARIO)SHORT TERM (DRIVEN BY PROJECTS)
Reduce cost and schedule of O&G projects
Diversification inside and outside of the O&G market
PROTECTING ENVIRONMENT...
“Offset Installation Equipment” delivery
Oil spill warning data collection platform
Guarantee full exploitation of energy resources
TARGET DECARBONISATION
CO2 separation at the source (also subsea)TransportationRe-injection / re-use
Increase productivity Offer new valuepropositions
xDIMTM
Pilot project on Small scale LNG EPC process improvement
Digital Site (IoT)
DIGITAL TRANSFORMATION
ENVIRONMENT
BUSINESS

20
UNBILLED REVENUES ARBITRATIONS/COURT DISPUTES*
Dec. 31, 2017
0.8
Dec. 31, 2016 Dec. 31, 2017Dec. 31, 2015
>0.4
<0.3
c.0.1
>0.7
Dec. 31, 2014
UNBILLED REVENUES AND ARBITRATIONS/COURT DISPUTES
(€ bn)
Dec. 31, 2016
0.7
(*) Gross of the amount of €0.25bn already received on a without prejudice basis
SONATRACH FINAL SETTLEMENT ON 14 FEBRUARY, 2018
REMAINING ONGOING ARBITRATIONS/COURT DISPUTES IN AUSTRALIA, CANADA , RUSSIA, ALGERIA

21
FFF2.0 – OPTIMISATION PROGRAMME
>900
2017A 2018E 2019E
450
>1,000>1,200
Achieved
March '18 Additional Releases>900 >1,100
ADDITIONAL REDUNDANCIES INCREASING RELEASES TO C.1,250 FTE €10mn INCREMENTAL SAVINGS
CUMULATIVE HEADCOUNT REDUCTION (FTE)
RUN RATEc.1,250 FTE
July '17 Redundancy Plan
YEARLY COSTS (€mn) 60 60 50 €190mn* TOTAL COST
(*) Including €15mn in 2016 and residual costs related to 2020
(**) Including €10mn from vessel scrapping in 1H 2017
NEW DIVISIONAL INITIATIVES INCREASING TARGET SAVINGS TO €150mn
100100
CUMULATIVE SAVINGS (€mn) 20 65 110 €110mn RUN RATE SAVINGS
NEW DIVISIONAL INITIATIVES INCREASING YEARLY SAVINGS TO c. €40mn**
South America right-sizing
Vessels performance improvement program
Corporate optimization
22
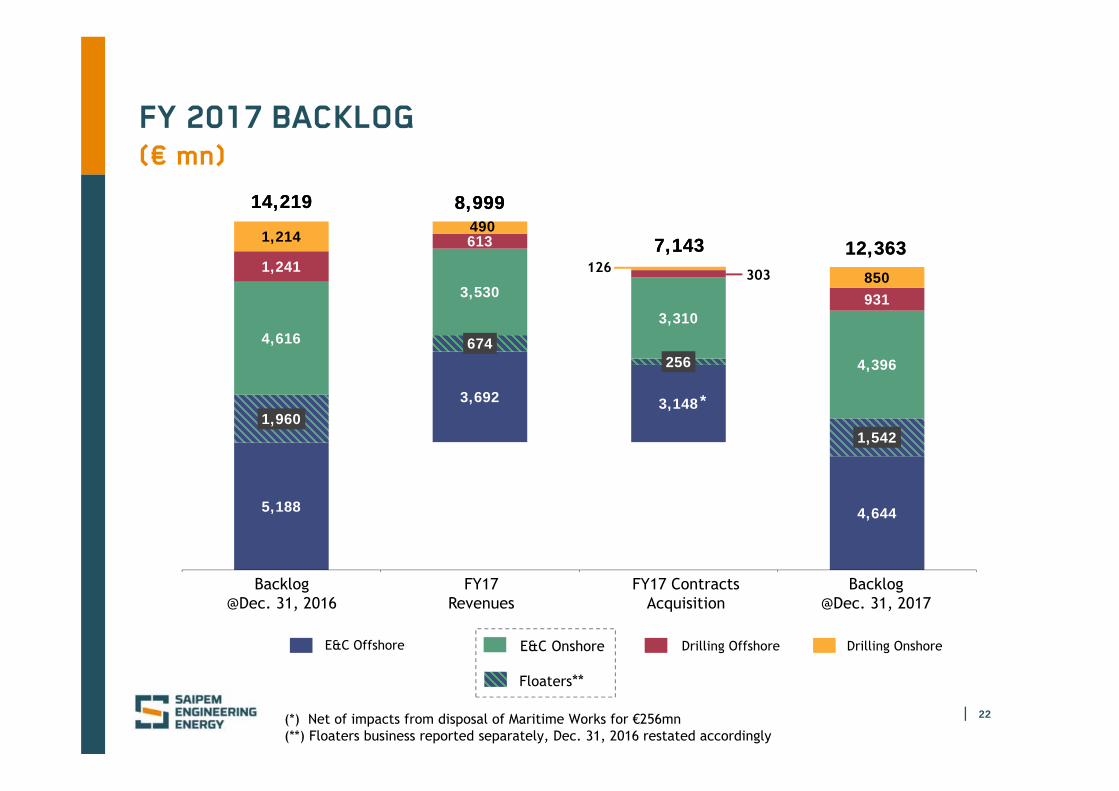
FY 2017 BACKLOG
Drilling OffshoreE&C Offshore Drilling Onshore
(€ mn)
Backlog@Dec. 31, 2017
Backlog @Dec. 31, 2016
FY17Revenues
FY17 Contracts Acquisition
5,188
3,692 3,148
4,644
1,960
674256
1,542
4,616
3,530
3,310
4,396
1,241
613
931
1,214490
850
8,9998,999
12,36312,363
14,21914,219
E&C Onshore
Floaters**
(*) Net of impacts from disposal of Maritime Works for €256mn (**) Floaters business reported separately, Dec. 31, 2016 restated accordingly
7,1437,143
*

23
BACKLOG BY YEAR OF EXECUTION
(€ mn)
2018 2019 2020+
Drilling OffshoreE&C Offshore Drilling OnshoreE&C Onshore
Floaters*
(*) Floaters business reported separately
2,863
966 815
538
212 792
2,129
1,297970
409
208314
428
291 1312,9742,974
6,3676,367
3,0223,022

DIVISIONS
XSIGHT

25
WE BRING ABOUT OUR CLIENTS’ VISION, INSIGHTFULLY
ENGAGE EPCI EXPERIENCE IN EARLY PHASE DEFINITION DISRUPT TRADITIONAL LESS EFFICIENT PROCESSES AND SOLUTIONS INNOVATE ALONG THE ENTIRE LIFE OF THE ASSET
EPCI COMPETENCES REASSEMBLED UNDER A NEW EFFICIENT OPERATING MODEL
TECHNOLOGIES AND SERVICES SYNERGIC DEVELOPMENT
FOCUS ON EFFICIENCY OF EXECUTION AND VALUE CREATION
CONCEIVE ARCHITECT DEVELOP ENHANCE

26
PRODUCTS AND SERVICES
BALANCED PORTFOLIO OF PRODUCTS AND SERVICES:• 30 different clients• Over 50 ongoing projects
Breakdown of activities by product
High Tech Floater
Offshore Full FieldDevelopmentUpstream and LNG
Refinery
Petrochemical
Syngas and Fertilizer
Green Technology andRenewable
INTEGRATE TECHNOLOGY INNOVATION WITH PROCESS KNOW HOW
LEVERAGE ON XDIM™ COLLABORATIVE PLATFORM TO INCREASE EFFICIENCY AND INTEGRATE TECHNOLOGY
EXPANSION TO NEW COUNTRIES TO ENLARGE CLIENT PROXIMITY

DIVISIONS
E&C ONSHORE

28
E&C ONSHORE - MAIN ONGOING PROJECTS
Ital Gas Storage
Spence growth
Tangguh
Star Refinery
Dangote fertilizers Okpai Phase II
Power Plant (*)
Southern swamp
DOWNSTREAM
UPSTREAM
DOWNSTREAM
PIPELINES
LNG
MIDSTREAM
DOWNSTREAM
UPSTREAM
DOWNSTREAM
Jazan PK1-2
Khurais expansion
Al Zour PK4
PIPELINESKOC- Feed Pipelines for new refinery-
Kaombo floatersFLOATERS
UPSTREAM TCO future growth WPM
PIPELINES SCPX pipeline
(*) E&P works started based on a Limited Notice to Proceed
29
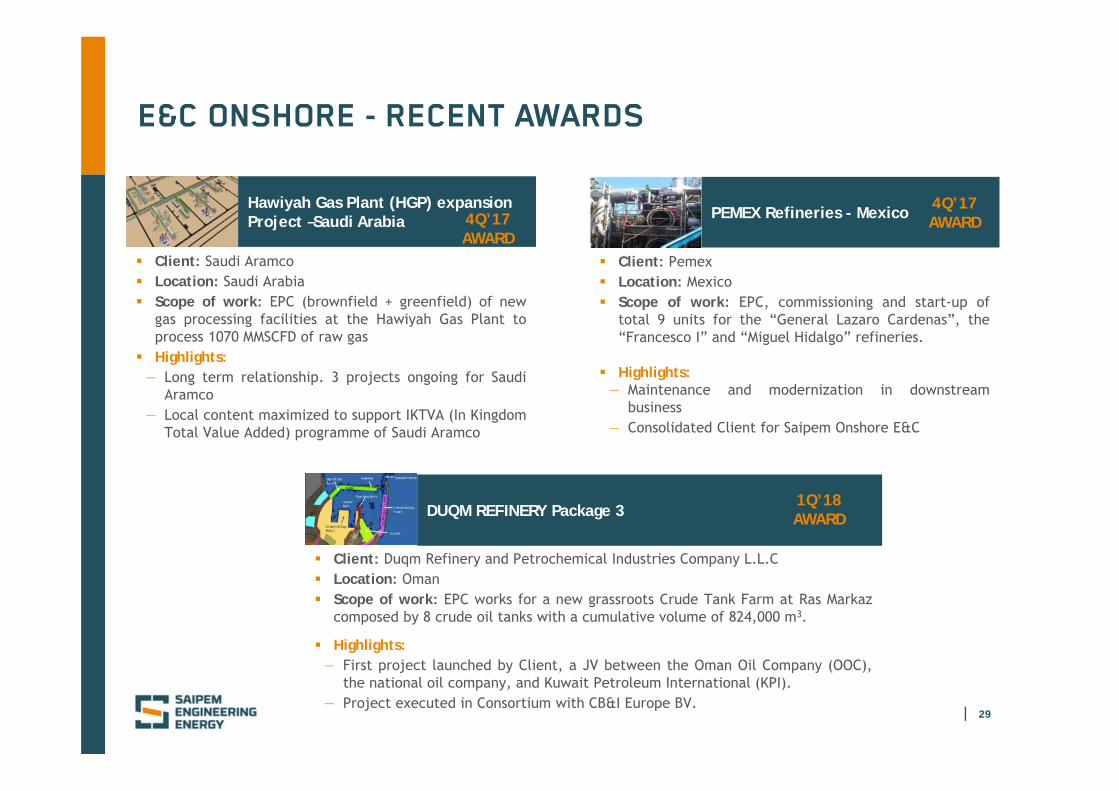
E&C ONSHORE - RECENT AWARDS
Hawiyah Gas Plant (HGP) expansion Project –Saudi Arabia
Client: Saudi Aramco Location: Saudi Arabia Scope of work: EPC (brownfield + greenfield) of new
gas processing facilities at the Hawiyah Gas Plant toprocess 1070 MMSCFD of raw gas
Highlights:— Long term relationship. 3 projects ongoing for Saudi
Aramco— Local content maximized to support IKTVA (In Kingdom
Total Value Added) programme of Saudi Aramco
Client: Pemex Location: Mexico Scope of work: EPC, commissioning and start-up of
total 9 units for the “General Lazaro Cardenas”, the“Francesco I” and “Miguel Hidalgo” refineries.
Highlights:— Maintenance and modernization in downstream
business— Consolidated Client for Saipem Onshore E&C
DUQM REFINERY Package 3
PEMEX Refineries - Mexico
Client: Duqm Refinery and Petrochemical Industries Company L.L.C Location: Oman Scope of work: EPC works for a new grassroots Crude Tank Farm at Ras Markaz
composed by 8 crude oil tanks with a cumulative volume of 824,000 m3.
Highlights:— First project launched by Client, a JV between the Oman Oil Company (OOC),
the national oil company, and Kuwait Petroleum International (KPI).— Project executed in Consortium with CB&I Europe BV.
1Q’18 AWARD
4Q’17 AWARD4Q’17
AWARD

30
E&C ONSHORE - OPPORTUNITIES
KEY SEGMENTS
DOWNSTREAM
RENEWABLES
PIPELINES
Americas
Ferrostaal Pacific NW Ammonia Plant –downstream
Pemex Refineries H-OIL – downstream CEP Imperia Valley 1 – renewables New Quebrada Blanca Ph. II – pipelines New Codelco Water Supply – pipelines New
West and North Africa
FLOATERS
LNG
INFRASTRUCT.
BP Tortue - FPSO – floaters Zaba Zaba - FPSO - floaters NLNG train 7 (FEED) – LNG New High Speed Railway in Egypt – infrastructures
New
East Africa
LNG
DOWNSTREAM
Exxon/Eni Onshore – LNG
Anadarko Onshore – LNG
Fauji/Ferrostaal Fertilizer – downstream
Europe/ CIS and Central Asia
INFRASTRUCT.
RENEWABLES
PIPELINES
FLOATERS
RFI TAV Brescia Verona – infrastructures High Speed Railway Moscow – Kazan –
infrastructures Alfa Mediterranean Solar Thermal Power
Plant – renewables New Klemetsrud CCS – environmental New TAPI gas Pipeline Project – pipelines New Novatek ALNG2 GBS Package – floaters New
Middle East
DOWNSTREAM
UPSTREAM
PIPELINES
OTTCO Ras Markaz Crude Oil Park Project –downstream
Takreer GAP (Gasoline Aromatic Proj.) –downstream New
KIPIC Petrochemical Refinery Integration AlZour – downstream New
ExxonMobil West Qurna major tie-ins DS6 Facilities– upstream
Aramco Marjan Increment project – upstream New
Aramco Gas Compression Plants Pipelines (NGCP, SaGCP, SGCP) – pipelines New
Asia Pacific
DOWNSTREAM
LNG
RENEWABLES
FLOATERS
RDA Pentland Bio Enery Project Phase 1 –renewables
Dung Quat Refinery Expansion Project -downstream New
ThaiOil Clean Fuel – downstream Pertamina Balikpapan Refinery – downstream
New PTTLNG Nong Fab receiving terminal – LNG Masela – Onshore LNG&FPU - floaters New Eni Merakes Tie In – LNG/floaters New

31
• NEW MARKETS: targeting Russia, North America, South East Asia, East Africa
• PORTFOLIO DIVERSIFICATION: enhance non-Oil and Renewables segments
• TRADITIONAL MARKETS maintain presence in Middle East
PORTFOLIO/
GEOGRAPHIES
• CO2 MANAGEMENT: high-CO2 natural gas reservoirs debottlenecking solutions and re-use of CO2 in urea (methanol) plants
• LNG VALUE CHAIN: small scale modular solutions, also for floating applications
TECHNOLOGY
• TECHNOLOGICAL ORIENTED: to support renewables segment entry and strengthen collaborations
• MARKETS ORIENTED: open attitude to new local strategic partnerships
ALLIANCES/
PARTNERSHIP
E&C ONSHORE - FUTURE GOALS AND ACTIONS

DIVISIONS
E&C OFFSHORE

33
E&C OFFSHORE - MAIN ONGOING PROJECTS
BPMiller
Saudi AramcoLTA Projects
BPShah Deniz ph. 2
ExxonMobilLiza ph.1
ENIWest Hub
ØrstedHornsea
PetrobelZohr ORU
TotalEgina
TAPTap
BPTangguh
OFFSHORE WIND DECOMMISSION.
PIPELINES
SUBSEA
SUBSEA
SUBSEA
FIXED FACIL.
SUBSEA
FIXED FACILIT.
PIPELINES
FIXED FACILIT.
PIPELINES
Nord Stream 2 German Landfall
PIPELINES
PIPELINES
StatoilJohan Sverdrup
PIPELINES

34
E&C OFFSHORE – ZOHR: A FIRST TIME EVER
July2016
August2015
December 2017
• Demanding Technical Requirements
• Tight Schedule
• Involvement of a Large Specialised Naval Spread
Fast Track Shared Approach
Early Engagement and Integrated Team Work
Optimised Vessels Utilisation
Local Content Environment as Enabler
Technical and Technological Solutions
… tackled with Saipem ingredients
17 MONTHS TO 1st GAS
Discovery Award First Gas
A challenging recipe….
A NEW WIN-WIN MODEL

35
Manifa Water Injection System Upgrade – Saudi Arabia
West Hub Vandumbu - Angola
E&C OFFSHORE – 4Q 2017 AWARDS
Client: Eni Location: Angolan waters, 350 km north west of Luanda Scope of work: Engineering, Procurement, Construction
and Installation required for the development of theVandumbu subsea field
Main Saipem Vessels to be utilized: Saipem FDS Project Highlights
• Deepwater depths up to to 1500 metres• Realisation of two production pipelines made of special material
Client: Saudi Aramcounder Saudi Aramco LTA Developments
Location: Arabian Gulf Scope of work: Engineering, Procurement and
Construction of a new offshore pipeline replacing theexisting one and other activities
Main Saipem Vessels to be utilized: Castoro II
Saipem FDS

36
E&C OFFSHORE - OPPORTUNITIES
KEY SEGMENTS
ConocoPhillips Barossa Field Dev. –subsea/pipelines
ONGC KG-98/2 – subsea (URF+SPS)
Africa and Brazil
Far East
North Europe, North Sea and Baltic
Middle East
East Africa
SUBSEA FIXED
FACILITIES PIPELINES
North Atlantic Ocean
SUBSEA
SUBSEA
MMO
FIXED FACILITIES
PIPELINES
OFFSHORE WIND
FIXED FACILITIES
DECOMMIS-SIONING
PIPELINES SUBSEA
FIXED FACILITIES
PIPELINES SUBSEA
PIPELINES
Eni Amoca-Mitzon Field – fixed facilities
ExxonMobil Liza future dev. – subsea
Eni Shorouk (Zohr) future dev. –subsea/pipelines
Eni Zabazaba – subsea
CEC Phase 2 Open Cycle – MMO
SNE Development Phase 1 – subsea New
Petrobras Libra Development – subsea
Shell Bonga South West Aparo - subsea New
EDF Fecamp Offshore Windfarm – renewables
EDF Courseulles Offshore Windfarm –renewables
ENGIE Eoliennes en Mer – renewables New
Statoil Garantiana– subsea
ConocoPhillips LOGGS - decommissioning
S. Aramco LTA development – fixed facilities Rasgas Barzan Subsea Pipelines – pipelines
Eni Mamba – subsea Anadarko Golfinho – subsea
Mediterranean, Black and Caspian
IMR
PIPELINES
SUBSEA
BP Shah Deniz IMR – inspection, maintenance & repair
ExxonMobil Neptune – pipelines/subsea

37
INNOVATION for GLOBAL SOLUTIONS
STRATEGIC MARKETS ASSETS
DIVERSIFIEDOFFERING
New field architectures byextending subsea services
Enhancing efficiency throughprocess & equipment innovation
Offshore WindfarmsLate Asset Management and Decommissioning
HEATED PiP
Long Tie-Backs
SPRINGS®
Seabed Processing
Life Of Field Services
New Welding and Testing Processes
Materials
New IstallationEquipment and Methods
TECHNOLOGY
HYDRONE
PLASMA WELD.
PLASTIC LINED
ANTIFLOODING
E&C OFFSHORE – STRATEGIC TECHNOLOGY TARGETS

DIVISIONS
OFFSHORE DRILLING

39
OFFSHORE DRILLING - RECENT AWARDS
1Q 2018 awards4Q 2017 awards
Scarabeo 8 – North Sea Norwegian sector
Client: Shell Location: offshore Norway Terms: one well plus one well option
with start in June ‘18
Perro Negro 8 – Arabian Gulf
Client: ADNOC - NDC Location: offshore UAE Terms: 10 months activity (started end
December ‘17)
Scarabeo 8 – North Sea Norwegian sector
Client: Shell Location: offshore Norway Terms: option for second well exercised
Saipem TAD - Congo
Client: Total Location: offshore Congo Terms: 5 firm wells (started in early
February ‘18) + up to 5 optionalwells

40
OFFSHORE DRILLING - FLEET CONTRACTS
2017 2018 2019 2020
* ON STACKING MODE - TOTALLY WRITTEN OFF
Operative Stand-by Termination fee Optional period
EniCyprus-Maroc-
Portugal-Mozamb.
Eni Egypt
JV Eni-Partner Black Sea
Eni - Shell Norway
Eni Indonesia
- -
NDC UAE
Saudi Aramco Saudi Arabia
Saudi Aramco Saudi Arabia
Petrobel Egypt
- -
TENDER ASSISTED Eni - Total Congo
SHAL
LOW
-WAT
ER HI
SPEC
STA
ND
AR
D
ULT
RA
DEEP
-WA
TER
and
H
ARSH
EN
V.
DEEP
-W
ATER
Saipem 12000
Saipem 10000
Scarabeo 9
Scarabeo 8
Scarabeo 7
Scarabeo 5*
Perro Negro 8
Perro Negro 7
Perro Negro 5
Perro Negro 4
Perro Negro 2*
TAD
2017 2018 2019 2020
Preparation for Mozambique
TO 2022>
TO 2024>
New Contract

41
OFFSHORE DRILLING – FLEET IMPROVEMENT
Modification of Scarabeo 9 allowing to cross theBosphorus and access new market
Saipem 12000 with 2nd BOP: fully aligned to latestrequirements
Application of new digital solutions undergoing: Smart rig (digital rig, smart maintenance) Virtual rig (training) Smart HSE
Scarabeo 8 digital twin well undergoing, assessmentongoing on rest of the fleet

42
OFFSHORE DRILLING– STRATEGY UPDATE
Focus on clients base expansion
From long-term model to short-term commitments
Further improvement of efficiency: operations, supply chain, assetsintegrity, digitalization
Plug&Abandonment and drilling integrated services
Evaluation of possible partnerships

DIVISIONS
ONSHORE DRILLING

44
UPDATE ON ONSHORE DRILLING FLEET
ONSHORE FLEET @ Dec. 31, 2017: 84 RIGS*
LATIN AMERICA48 RIGS
UTILISATION RATE 23%MIDDLE EAST
30 RIGS
UTILISATION RATE 100%
REST OF THE WORLD6 RIGS
UTILISATION RATE 58%
(*) 17 RIGS REMOVED FROM THE FLEET BECAUSE COLD STACKED AND TOTALLY WRITTEN OFF
UTILISATION RATE FY 2017: 58%

45
ADMINISTRATIVE OPERATIVE
ONSHORE DRILLING - FOCUS ON LATIN AMERICA RIGHT-SIZE
DERISKED & LEANER OPERATIONS READY TO CAPTURE MARKET UPSWING
Fit for the future + «Bullet train»
• Right-size the business• Cost Structure Optimization• Logistic optimization
Strategy
• Hold/grow select Countries• Derisk and decentralize• Branch increased autonomy
El Tigre
Ojeda
Bogota.. Yopal
Quito .
. .
El Coca.
Lima .
Talara . Iquitos.
Pucallpa.
. Santa Cruz
. Neuquén
. Punta Arenas
RIGHTSIZE
HOLD
GROW
GROW
XXXX
XX
XNew reduced office
VenezuelaColombia
Ecuador
PeruBolivia
Chile
Argentina
Office
Logistic Base/Yard
Regional Head Office
RIGHTSIZERIGHTSIZE
RIGHTSIZE

46
ONSHORE DRILLING - STRATEGY UPDATE
PURSUE CUSTOMER INTIMACY AND EXTEND INTO ADJACENCIES RELIABILITY OF LONG TERM CUSTOMER SUCCESSFUL RELATIONSHIP SHALE OIL & GAS + PAD DRILLING GEOTHERMAL
SYSTEMS FULL POTENTIAL
GLOBAL REACH WITH NEW TARGET COUNTRIES
RESTORE PRESENCE IN ALGERIA NORTH AFRICA FURTHER PENETRATION SELECT MIDDLE EAST COUNTRIES
GEOGRAPHICAL EXPANSION
MARGIN ENHANCEMENT AND IDLENESS REDUCTION TARGET BEST-IN-CLASS HSE & OPERATIONS (c.1% NPT) REVISED RIG KPI’s LATIN AMERICA RIGHT SIZE
OPERATIONS EXCELLENCE
INTEGRATED + DIGITAL DRILLING
INTEGRATED DRILLING + DIGITAL SOLUTIONS INTEGRATED SERVICES CONDITION MONITORING DATA MANAGEMENT

CLOSING REMARKS AND
2018 GUIDANCE

48
NEW SAIPEM GROUP STRATEGY BY DIVISION
Engage EPCI experience in early phase definition, for innovative and more efficient processes and solutions.
SHAPING DIVISIONAL OFFERING TO CAPTURE UPSIDE
Expand service offering in Subsea markets and enhance diversification. Leverage technology and innovation.
Enhance portfolio diversification and target new geographical markets. Maintain long-term presence in Middle East. Focus on LNG and regas.
Client base expansion and short term commitments. Performance improved by new technologies. Opportunities for new integrated services offering.
OFFSHOREDRILLING
ONSHORE DRILLING
E&C OFFSHORE
E&C ONSHORE
Enhance margins through operational efficiency. New geographical markets and segments. Re-establish Algeria franchise, rightsize in Latin America.

49
2018 GUIDANCE
Metrics FY 2018
Revenues
CAPEX
Net financial position
c. €8bn
EBITDA Adjusted % margin >10%
c. €300mn
c. €1.1bn

50
2017: READY FOR THE FUTURE
2017 ROBUST PERFORMANCE IN A STILL CHALLENGING ENVIRONMENT
2018 GUIDANCE BACKED BY OPERATIONAL EFFICIENCY AND BACKLOG
ENHANCED ACCOUNTABILITY OF DIVISIONS, NEW BUSINESS OPPORTUNITIES AND
FURTHER COST EFFICIENCY
STRENGTHENED FINANCIAL PROFILE
REGAINED ACCESS TO ALGERIAN MARKET

APPENDIX

52
4Q 2017 RESULTS
QoQ TREND (€ mn)
(105)
59
4Q173Q174Q173Q17 4Q173Q17
2,1262,283
271
169
Adjusted EBITDARevenues Adjusted Net Result
12.9% 7.9%margin

53
4Q 2017 RESULTS – E&C
QoQ TREND (€ mn)
(*) Floaters business reported separately, 4Q 2016 restated accordingly
E&C Onshore Floaters*
Adj. EBITDARevenues
8251043
160
176985
1,219
E&C OFFSHORE E&C ONSHORE
646
1026
Adj. EBITDARevenues
12.0% 24.1%margin
156123
3.8% (7.8%)margin
24
(104)
13
9
37
(95)
4Q173Q174Q173Q17 4Q173Q174Q173Q17

54
4Q 2017 RESULTS – Drilling
QoQ TREND (€ mn)
4Q173Q174Q173Q17 4Q173Q174Q173Q17
Adj. EBITDARevenues
137153
8183
Adj. EBITDARevenues
119 124
28 27
DRILLING OFFSHORE DRILLING ONSHORE
54.2% 59.1%margin 23.5% 21.8%margin