FIRST HALF 2019 RESULTS PRESENTATION - Saipem
33
25 July 2019 FIRST HALF 2019 RESULTS PRESENTATION
Transcript of FIRST HALF 2019 RESULTS PRESENTATION - Saipem

25 July 2019
FIRST HALF 2019
RESULTS PRESENTATION

2
FORWARD-LOOKING STATEMENTS
Forward-looking statements contained in this presentation regrading future events and future results are based oncurrent expectations, estimates, forecasts and projections about the industries in which Saipem S.p.A. (the“Company”) operates, as well as the beliefs and assumptions of the Company’s management.These forward-looking statements are only predictions and are subject to known and unknown risks, uncertainties,assumptions and other factors beyond the Company’ control that are difficult to predict because they relate toevents and depend on circumstances that will occur in the future. These include, but are not limited to: forex andinterest rate fluctuations, commodity price volatility, credit and liquidity risks, HSE risks, the levels of capitalexpenditure in the oil and gas industry and other sectors, political instability in areas where the Group operates,actions by competitors, success of commercial transactions, risks associated with the execution of projects(including ongoing investment projects), in addition to changes in stakeholders’ expectations and other changesaffecting business conditions.
Therefore, the Company’s actual results may differ materially and adversely from those expressed or implied in anyforward-looking statements. They are neither statements of historical fact nor guarantees of future performance.The Company therefore caution against relying on any of these forward-looking statements. Factors that mightcause or contribute to such differences include, but are not limited to, economic conditions globally, the impact ofcompetition, political and economic developments in the countries in which the Company operates, and regulatorydevelopments in Italy and internationally. Any forward-looking statements made by or on behalf of the Companyspeak only as of the date they are made. The Company undertakes no obligation to update any forward-lookingstatements to reflect any changes in the Company’s expectations with regard thereto or any changes in events,conditions or circumstances on which any such statement is based. Accordingly, readers should not place unduereliance on forward-looking statements due to the inherent uncertainty therein.
The Financial Reports contain analyses of some of the aforementioned risks.
Forward-looking statements neither represent nor can be considered as estimates for legal, accounting, fiscal orinvestment purposes. Forward-looking statements are not intended to provide assurances and/or solicitinvestment.

3
AGENDA
2 1H 2019 RESULTS
1 OPENING REMARKS
3 BUSINESS UPDATE
4 GUIDANCE AND CLOSING REMARKS

4
OPENING REMARKS
1H 2019
Solid results across the divisions, in trend with FY 2019 targets
▪ E&C Offshore: solid operational performance
▪ E&C Onshore: turnaround continues
▪ Drilling: growing volumes, margins adjusting to current environment
Major LNG award in Mozambique worth $6bn
Book-to-bill above 2x in 1H
Backlog above €17bn
Visibility improving, award momentum to continue
Net debt improved at €1bn
New year-end net debt guidance: below €0.8bn

25 July 2019
1H 2019 RESULTS

6
531
75
1H 2019 RESULTS
YoY COMPARISON (€ mn)
Adjusted EBITDA*Revenues Adjusted Net Result*
1H191H181H191H18
1H191H18
4,519
483
6063,798
IFRS 16 Impact
(*) Not including special items, details in slide 9
65
-5
60
6
12.6% margin 11.8% - pre IFRS 16
13.4% - IFRS 16

7 7
• Higher volumes in Middle and Far East, West Africa and
Caspian
• Margin expansion confirming turnaround
274
54
328
259
1H 2019 RESULTS – E&C
(*) E&C Onshore including Floaters business and XSight
1,622
2,000
1H191H181H191H18 1H191H181H191H18
E&C OFFSHORE E&C ONSHORE*
1,990
1,750
92
17
51
109
Adjusted EBITDARevenues Adjusted EBITDARevenues
YoY COMPARISON (€ mn)
• Higher volumes in Middle East and North Africa
• Solid margin underpinned by good execution
14.8% 13.8% pre IFRS 16
16.5% IFRS 16
margin 3.1% 4.6% pre IFRS 16
5.5% IFRS 16
margin
IFRS 16 Impact

8
1H 2019 RESULTS – DRILLING
YoY COMPARISON (€ mn)
DRILLING OFFSHORE DRILLING ONSHORE
1H191H181H191H18
256
221
100
2
102107
65
2
246
273
66 67
1H191H181H191H18
Adjusted EBITDARevenues Adjusted EBITDARevenues
• Higher volumes driven by SC8, S12000, Pioneer (leased)
• Phasing out of past projects reflects on EBITDA margin
• Growth driven by activity in Saudi Arabia and Latin
America
• Broadly stable margins QoQ
IFRS 16 Impact
8
48.4% margin 39.1% pre IFRS 16
39.8% IFRS 1626.8% margin 23.8% pre IFRS
24.5% IFRS 16

9
1H 2019 NET RESULT
RECONCILIATION ADJUSTED-REPORTED
65 60
14 14
1H19
Adjusted
pre IFRS16
1H19
ReportedProvisions for
redundancies
SPECIAL ITEMS
Write-down*
Net Result (€ mn)
IFRS 16
Impact
1H19
Adjusted
post IFRS16
(5)
(25)
(21)
(*) Write-down of jackup Perro Negro 5 and related working capital

10
1H 2019 NET DEBT EVOLUTION
(€ bn)
DELEVERAGE PROGRESSING FURTHER
1.04(0.31)
0.05
1.160.14
1.71 0.55
0.53 1.57
Cash Flow
(N.P.+ D&A)
CapexNet Debt
Dec.31, 2018
Net Debt
June 30, 2019
Others includ.
Δ Working
Capital
FY18
IFRS 16
Restatement
Net Debt 1H19
IFRS 16
Impact
Net Debt
June 30, 2019
MANAGEMENT VIEW IFRS VIEWIFRS VIEW
Dec.31, 2018
Restated

11
DERISKED WORKING CAPITAL
▪ Gladstone arbitration in Australia positively resolved in line with expectations
▪ Commercial discipline, de-risking actions and settlements reduced unbilled revenues to
negligible level
UNBILLED REVENUES LINKED TO LEGAL DISPUTES
€ mn
June 30, 2019Dec. 31, 2016
c.800
c.50

25 July 2019
BUSINESS UPDATE

13
A NEW FRONTIER
MOZAMBIQUE
▪ First natural gas discovery in Area 1 in 2010
▪ Significant natural gas reserves, estimated at
+2,000bn m3
▪ Various fields under development by major players
KEY ENERGY RESOURCES
▪ Strong expertise and know-how in executing
large/complex projects in remote areas and deep
water
▪ Developing a key role in energy transition
▪ Established presence and strong track record in
Sub-Saharan Africa
OUR VALUE PROPOSITION
▪ Part of Maritime Silk Road
▪ Privileged Commercial Hub of India and China for
African Market
▪ Significant infrastructure development envisaged
STRATEGIC POSITIONING

14
MAIN RECENT AWARDS: ANADARKO MOZAMBIQUE LNG
LNG MOMENTUM CONFIRMED
▪ Client: Anadarko Petroleum Corporation
▪ Location: Mozambique
▪ Scheme: JV among Saipem (leader), McDermott
and Chiyoda
▪ Scope of Work: Engineering, Procurement and
Construction of two Natural Gas Liquefaction
(LNG) trains, with a total capacity of 12.9 MTPA,
as well as all necessary associated infrastructure,
storage tanks and export jetty facilities
▪ Project Value - Saipem share: $6bn
PROJECT DETAILS
HIGHLIGHTS
➢ Major award for Saipem
➢ Remote frontier area with limited infrastructure
➢ Focus on execution and local supply chain
➢ Technologically and logistically complex
FOCUS ON GAS VALUE CHAIN

15
MAIN RECENT AWARDS
E&C – 2Q 2019
MOSCOW REFINERY
▪ Client: JSC GazpromNeft
▪ Location: Russia
▪ Scope of work: EPC for new Sulphur recovery unit (SRU) encompassing 6 trains, among
which 2 trains of 280 MTA of Sulphur Claus and TGTU with Liquid and Solid Sulphur
handling
HIGHLIGHTS:
Reduction of sulphur emissions, complying with highest levels of environmental and safety
standards
Positioning to benefit from potential new investments in the refinery
SERBIA PIPELINE
▪ Client: Infrastructure Development and Construction (IDC)
▪ Location: Serbia
▪ Scope of work: design and construction of approx. 150 km of gas pipeline and engineering
of compressor station
HIGHLIGHTS:
Part of the 400 km interconnector gas pipeline in Serbia
Construction activities performed on a direct hire base with Saipem specialized equipment
LTA 43 – BERRI DOWNSTREAM PIPELINES
▪ Client: Saudi Aramco
▪ Location: Kingdom of Saudi Arabia
▪ Scope of work: EPC of pipelines for crude and condensates, interconnecting Abu Ali gas-oil
separation plant with Khursaniyah gas plant
HIGHLIGHTS:
Award falling under Long Term frame Agreement, consolidating presence in the Middle East

16
MAIN RECENT AWARDS CONT’D
E&C – POST 2Q 2019
BERRI - PKG-01 EXPAND ABU ALI CRUDE & KGP GAS FACILITIES
▪ Client: Saudi Aramco
▪ Location: Kingdom of Saudi Arabia
▪ Scope of work: EPC for new units for the Abu Ali oil-gas separation
plant and the Khursaniyah gas treatment plant
MARJAN – PKG-10 GAS TREATMENT AND SULFUR RECOVERY
▪ Client: Saudi Aramco
▪ Location: Kingdom of Saudi Arabia
▪ Scope of work: EPC for new units for gas treatment and the recovery
of acid gases for sulfur production
HIGHLIGHTS:
Recognition of expertise in large/complex projects further strengthens client relationship
Supporting Saudi Aramco in complying with CO2 emission standards

17
MAIN RECENT AWARDS
DRILLING OFFSHORE
SEA LION 7 - NEW LEASED JACKUP
▪ Client: Saudi Aramco
▪ Location: Saudi Arabia
▪ Terms: 3 years firm period + 1-year option; expected to start in 4Q 2019
HIGHLIGHTS:
Additional leased rig joining Saipem fleet, in line with our asset-light strategy
Hi-spec jackup
SCARABEO 8
▪ Client: Repsol Norge AS
▪ Location: Norway
▪ Terms: 1 well; starting in 4Q 2019
SCARABEO 9
▪ Client: GSP
▪ Location: Romania
▪ Terms: 1 wells; starting in 3Q 2019
HIGHLIGHTS:
Back in the Black Sea, rig under preparation for bridge crossing
PERRO NEGRO 8
▪ Client: ADNOC
▪ Location: United Arab Emirates
▪ Terms: 4 years contract + 1-year option in continuation from previous engagement
HIGHLIGHTS:
Extension of activity, long term contract
HIGHLIGHTS:
New client in Drilling Offshore

18
OFFSHORE DRILLING FLEET
* ON STACKING MODE
** LEASED VESSEL
Committed Optional periodNew awards in 2Q19 and 3Q19 to-date
CLIENT AREA
Eni Pakistan-Mozamb.
Eni Egypt
Eni - GSP Egypt-Romania
AkerBP - Vår Ener.
Repsol-WintershallNorway
Eni Indonesia
- -
ADNOC UAE
Saudi Aramco Saudi Arabia
Eni Mexico
Saudi Aramco Saudi Arabia
Saudi Aramco Saudi Arabia
Petrobel Egypt
- -
TENDER ASSISTED
SHALLO
W-W
ATER
STA
ND
AR
D
ULTRA
DEEP-W
ATER a
nd
HARSH
EN
V.
DEEP-
WATER
HI
SPEC
Saipem 12000
Saipem 10000
Scarabeo 9
Scarabeo 8
Scarabeo 7
Scarabeo 5*
Perro Negro 8
Perro Negro 7
Pioneer**
Sea Lion 7**
Perro Negro 5 \New Vessel**
Perro Negro 4
Perro Negro 2*
TAD
2019 2020 2021
TO 2024>
TO 2022>
TO 2023>
TO 2022>
PN5 NEW LEASE
TO 2023>
19
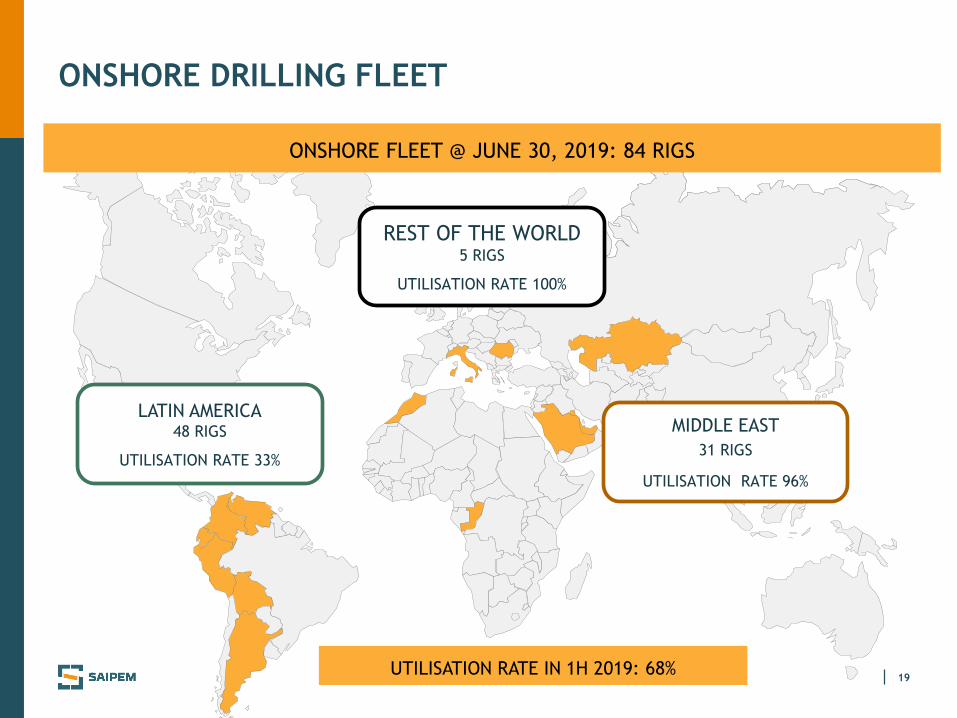
ONSHORE DRILLING FLEET
ONSHORE FLEET @ JUNE 30, 2019: 84 RIGS
LATIN AMERICA48 RIGS
UTILISATION RATE 33%
MIDDLE EAST
31 RIGS
UTILISATION RATE 96%
REST OF THE WORLD5 RIGS
UTILISATION RATE 100%
UTILISATION RATE IN 1H 2019: 68%

20
1H 2019 BACKLOG
(€ mn)
Backlog
@June 30, 2019
Backlog
@Dec. 31, 2018
1H19
Revenues
1H19 Contracts
Acquisition
4,981
1,990 2,102
5,093
6,323
2,000
6,821
11,144
716 256
354 814
599273
260586
4,519
17,6379,537
12,619
E&C Onshore* Drilling OffshoreE&C Offshore Drilling Onshore
(*) E&C Onshore including Floaters business and XSight
(€ mn) 1,798
NON-CONSOLIDATED BACKLOG @ June 30, 2019

21
1H 2019 BACKLOG BY YEAR OF EXECUTION
(€ mn)
E&C Onshore* Drilling OffshoreE&C Offshore Drilling Onshore
(*) E&C Onshore including Floaters business and XSight
2019 2020 2021+
NON-CONSOLIDATED BACKLOG BY YEAR OF EXECUTION
2019 2020 2021+
€ mn 174 546 1,078
1,714 1,684 1,695
1,428
3,376
6,340
245
323
246
187
178
221
5,561
3,574
8,502

22
E&C BACKLOG BREAKDOWN EVOLUTION
BACKLOG MAINLY DRIVEN BY GAS
(*) Estimate YTD includes: 1) E&C backlog at end of June 2019 for €16.2bn and 2) E&C order intake post-2Q to-date for c.€3.1bn
E&C BACKLOG € bn(END OF PERIOD)
Dec-2016 Dec-2017 Dec-2018 2019 estimate YTD*
50% 49% 40%
50%51% 60%
66%11.810.6
11.3
19.3*
34%
POST 2Q
AWARDS
POST 2Q
AWARDS
NON-OIL
OIL

23
E&C OFFSHORE OPPORTUNITIES
GOOD VISIBILITY ON €8 BILLION NEAR-TERM INITIATIVES
Africa
Europe/ CIS and Central Asia
Middle East
➢ SUBSEA
➢ PIPELINES
Americas
Asia Pacific
➢ SUBSEAApprox. value of
opportunities: €2.2bn
Approx. value of
opportunities: €1.6bn
➢ RENEWABLES
➢ FIXED FACILITIES
➢ DECOMMISSIONING
➢ PIPELINES
Approx. value of
opportunities: €1.5bn
➢ FIXED FACILITIESApprox. value of
opportunities: €2.1bn
➢ PIPELINESApprox. value of
opportunities: €0.4bn

25 July 2019
GUIDANCE AND
CLOSING REMARKS

25
2019 GUIDANCE UPDATE
PRE IFRS 16
Metrics FY 2019
Revenues
CAPEX
Net debt (updated)
Adjusted EBITDA % margin
▪ c. €9bn
▪ >10%
▪ c. €500mn
▪ <€0.8bn
26
VISIBILITY REMAINS GOOD ON SELECTED NEAR TERM E&C OPPORTUNITIES
ACCELERATING DELEVERAGE, NET DEBT 2019 GUIDANCE IMPROVED AT BELOW €0.8bn
CLOSING REMARKS
ROBUST ORDER INTAKE DRIVES BACKLOG ABOVE €17bn, IMPROVING
MEDIUM-TO-LONG TERM VISIBILITY
GOOD OPERATIONAL RESULTS ON TREND WITH YEARLY GUIDANCE

25 July 2019
APPENDIX

28
238
293
36
39
2Q 2019 RESULTS
QoQ TREND (€ mn)
Adjusted EBITDA*Revenues Adjusted Net Income*
2Q191Q192Q191Q19
2Q191Q19
2,363
274
332
margin
2,156
33 32
3129
IFRS 16 Impact
(*) Not including special items
(4)
11.0% Pre IFRS16 12.4%
12.7% IFRS 16 14.0%
(1)

29
2Q 2019 RESULTS
QoQ TREND (pre IFRS 16 - € mn)
(*) E&C Onshore including Floaters business and XSight
2Q191Q192Q191Q19
Adjusted EBITDARevenues
E&C OFFSHORE
2Q191Q192Q191Q19
E&C ONSHORE*
2Q191Q192Q191Q19
Adjusted EBITDARevenues
DRILLING OFFSHORE
2Q191Q192Q191Q19
DRILLING ONSHORE
9681,032
34
58
116
140
4654
134 139
32 33
1,076
914
118
156
Adjusted EBITDARevenues
Adjusted EBITDARevenues
12.9% 14.5%margin 3.5% 5.6%margin
38.6% 39.7%margin 23.9% 23.7%margin

30
51 5921
100
231
53 6136
148
298
53 57
19
99
228
OffshoreDrilling
OnshoreDrilling
E&COnshore*
E&COffshore
TotalD&A
1H 2019 RESULTS – D&A, FINANCE CHARGES AND TAX RATE
D&A
TAX RATE
FINANCE
CHARGES57
88 101
31 13
Financing costs Project hedging
costs
Finance Charges
pre IFRS
IFRS16 Impact Finance Charges
post IFRS
1H 2019 € mn
D&A€ mn
(*) Floaters business
included in E&C Onshore
▪ Tax rate* at c.46%, significantly improving year-on-year
1H 2019
IFRS 16 impact
1H 2019
pre IFRS16
1H 2018
(*) Calculated on adjusted net income
▪ 2019 tax rate* expected at around 40%

31
IFRS 16 IMPACT
RECONCILIATION
Depreciation
Net Debt
Adjusted EBITDA
Adjusted Net Income
Financial Charges
1H 2019 €mn
231 298 67
1,043 1,574 531
531 606 75
65 60 5
1H 2018€mn
228
1,325
483
6
80 88 101 13
pre IFRS 16 IFRS 16 IMPACT
2Q 2019€mn
IFRS 16 IMPACT
150 34
332 39
31 1
47 6

32
CAPITAL STRUCTURE AS OF JUNE 30, 2019
LIQUIDITY AND MATURITY PROFILE (€ mn)
500 500 500 500
33 66
77 62 62
62
81
125 112
63 63 38
93 10
251188
639 625 600
62
581
223
Liquidity 2019 2020 2021 2022 2023 2024 2025+
Bonds ECA Facilities Bank Facilities Other Debt
SOUND FINANCIAL STRUCTURE
▪ Average debt maturity c.3.2 years. Overall financing interest rate c.4%, including treasury hedging
▪ Undrawn committed cash facilities totalling c.€1.2bn, in addition to c.€0.2bn of uncommitted facilities
▪ Available cash and equivalent c.€1.4bn**
(*) Committed (**) Not including trapped cash and marketable securities/other credit for c.€0.5bn
2,593
1,370
Undrawn RCF*
Undrawn ECA* Facility (GIEK)
1,000
Available Cash
and equiv.**

33
E&C ONSHORE OPPORTUNITIES
GOOD VISIBILITY ON €13.5 BILLION NEAR-TERM INITIATIVES
Africa
Europe/ CIS and Central Asia
Middle East
➢ FLOATERS
➢ PIPELINES
Americas
Asia Pacific
➢ LNG
➢ DOWNSTREAM
Approx. value of
opportunities: €8.1bn
Approx. value of
opportunities: €1.2bn
➢ LNG
➢ DOWNSTREAM
Approx. value of
opportunities: €2.3bn
➢ DOWNSTREAM
➢ UPSTREAM
Approx. value of
opportunities: €0.9bn
➢ DOWNSTREAMApprox. value of
opportunities: €1.0bn