
Risk Assessment - iafss.orgiafss.org/publications/fss/5/41/view/fss_5-41.pdf · General principles...
18
Invited Lecture Risk Assessment SVEN ERIK MAGNUSSON Department of Fire Safety Engineering Lund Institute of Technology, Lund University Box 118, S-221 00 Lund, Sweden ABSTRACT The link between performance based fire safety design and risk assessment is outlined. Present risk assessment methods in areas outside fire safety engineering as well as some of the more important existing risk assessment studies of building fires are briefly reviewed. An attempt is made to link various risk assessment methods, such as the analytical, single- scenario safety index fi method and the multi-scenario, event-tree evaluation approaches, to different levels of fire safety design. Uncertainties, sensitivity and importance are central issues in the utilization of risk assessment results. Methods of uncertainty analysis are summarized and linked to practical design formats. The paper concludes by demonstrating some available results and by summarizing some of the advantages and limitations of risk assessment in fire safety engineering. KEYWORDS: Building fires, risk assessment, reliability index, safety index, Monte Carlo simulations, design methods, acceptance critera. 1. INTRODUCTION General principles and guidelines for building fire safety design based on calculations have been published during the last few years by a number of national and international standards bodies, examples are [I] - [4]. Two quite different general methods are indicated for verification or safety checking of a proposed design. In the first of these methods, it is assumed that the design can be based on a single specified scenario and on a single analytical FIRE SAFETY SCIENCE-PROCEEDINGS OF THE FIFTH INTERNATIONAL SYMPOSIUM, pp 41 -58 41 Copyright © International Association for Fire Safety Science
Transcript of Risk Assessment - iafss.orgiafss.org/publications/fss/5/41/view/fss_5-41.pdf · General principles...

Invited Lecture
Risk Assessment
SVEN ERIK MAGNUSSON Department of Fire Safety Engineering Lund Institute of Technology, Lund University Box 118, S-221 00 Lund, Sweden
ABSTRACT
The link between performance based fire safety design and risk assessment is outlined. Present risk assessment methods in areas outside fire safety engineering as well as some of the more important existing risk assessment studies of building fires are briefly reviewed. An attempt is made to link various risk assessment methods, such as the analytical, single- scenario safety index fi method and the multi-scenario, event-tree evaluation approaches, to different levels of fire safety design.
Uncertainties, sensitivity and importance are central issues in the utilization of risk assessment results. Methods of uncertainty analysis are summarized and linked to practical design formats. The paper concludes by demonstrating some available results and by summarizing some of the advantages and limitations of risk assessment in fire safety engineering.
KEYWORDS: Building fires, risk assessment, reliability index, safety index, Monte Carlo simulations, design methods, acceptance critera.
1. INTRODUCTION
General principles and guidelines for building fire safety design based on calculations have been published during the last few years by a number of national and international standards bodies, examples are [I] - [4]. Two quite different general methods are indicated for verification or safety checking of a proposed design. In the first of these methods, it is assumed that the design can be based on a single specified scenario and on a single analytical
FIRE SAFETY SCIENCE-PROCEEDINGS OF THE FIFTH INTERNATIONAL SYMPOSIUM, pp 41 -58 41
Copyright © International Association for Fire Safety Science

limit state equation or deterministic computer program. Here, a major weakness is that none of the guidelines gives any practical advice regarding how to choose safety factors (also called partial coefficients, uncertainty factors, etc) in order to achieve a specified level of safety; usually the guidelines contain an unprecise statement that safety factors should be selected with regard to the circumstances. The Australian guidelines contain the following formulation
"Under such levels of uncertainty (either for the models or the data) it is usual, as a minimum, that adequate factors of safety should be applied to represent the level of uncertainty and to ensure a conservative result is obtained."
The second main method for safety checking assumes that life safety risk (individual or societal) is calculated on the basis of a large number of scenarios, usually structured as an event-tree, and evaluated using risk assessment methods similar to those employed e.g. in the chemical process industry. Also for this method, the guidelines are imprecise as how to perform calculations in practice and how to interpret the results.
Lack of risk assessment guidelines reflects the fact that although a number of substantial research efforts have been made in the fire risk assessment area, the diversity in methods and approaches has not permitted a consolidated and generally accepted method to emerge so far. In this situation, a possible way forward is to review risk assessment methods in other engineering areas with a more extensive and practical experience and with the objective of establishing a knowledge data base for the future development of building fire risk assessment methods.
Performing such a review, two basic approaches emerge the single scenario, analytical safety index P-method originally derived for structural engineering purposes but spreading to new applications in e.g. hydraulic and environmental engineering the multi-scenario, event-tree approach developed for complex technological systems
One purpose of the review will be to summarily describe the calculation, presentation and practical application of risk estimates produced by these two general methods. An additional purpose will be to demonstrate their use in the area of fire safety engineering. A third objective will be to shortly discuss some of the research and development work necessary for risk assessment gaining wide credibility and acceptance. A crucial point in this discussion will concern the standardization work needed to improve consistency and quality.
The link of these methods to uncertainty analysis in general and to random numerical simulation (Monte Carlo) procedures will be explored.
Risk assessment may be divided into two main parts: determination of frequency of initiating event and determination of consequences of initiating event occurring. The emphasis of this review will be uncertainty analysis of consequence calculations, not of frequency estimation methods. A number of approaches will be summarized, other (neural networks, stochastic network modelling. fuzzy sets: state transition modelling, etc) will have to be neglected due to lack of space. An attempt will be made to link design and probabilistic analysis and to

illustrate how various approaches can be applied to the same practical assessment problem. But we will start by introducing the fundamental concepts.
2. FUNDAMENTAL CONCEPTS. FIVE DIFFERENT RISK ASSESSMENT APPROACHES
2.1 The single scenario or limit state equation case
We are considering the very important practical case with a single limit state described by an analytical expression.
The analytical equation could basically be of two kinds: (a) physically derived (and preferably non-dimensional) correlation. Examples could be
mass flow in plumes, smoke-filling times, radiation from flames (b) response surface equations describing output from a computer program
The design problem can be formulated in terms of the limits state function G as
The parameters X, are stochastic parameters describing the system, for example fire growth rate and response time of occupants. The goal is to find a solution to this problem with the constraint that
The design can be performed on different levels depending on the amount of information available [5] - [7]. On level 1, safety checking or design is performed employing pre-selected design values of the stochastic parameters. Usually the code prescribes the design values as the product of a characteristic value and a partial coefficient [4]. These code parameters are derived with the objective of obtaining a specified reliability for a class of scenarios and/or buildings [4]. In a level 2 method, reliability is calculated using the first two statistical moments of the parameters (mean and standard derivation) and by a first order linearization of the limit state equation [S]. Hence the term FOSM-method (First Order Second Moment). The actual form of the statistical distribution is considered only in deriving the first two moments. A level 3 procedure uses the complete information about the parameter distribution as well as the joint probability functions. A method on a lower level can only be verified by a higher level method. "Characteristic" values and partial coefficient on level 1 should ideally be derived using the method on level 2.
Conceptually, solution to Eq l a and Ib is simple. In practice, the problems are formidable. The reliability of the design 1 - P,,,,, may be expressed as
1 - P ,,,,, = 1 - 11 j...J G,Y ;.. x,, (x,. . .x,,)4.. .&,, G(X, .... X,) I 0

where G,, .. . xn (xi .. .x, ) is the joint probability density function for the n variables X,.
Two practical problems are immediately apparent when evaluating the multi-dimensional integral. In real design, there will be insufficient data to satisfactorily describe the joint probability density function. In the unrealistic case that this function is known, there will be no analytical solutions available and numerical evaluations will be prohibitively time- consuming. In practice, and as will be demonstrated, these difficulties are overcome either by use of level 2 methods or by use of numerical random sampling procedures.
2.2 The multi-scenario case 2.2.1 Outline of methodology Quantified risk assessment based on event-tree methods, has evolved over the last 20 years mainly in the aerospace, electronics, nuclear power and chemical process industries [14, 151. As can be expected, the variation is considerable, both in methodology and practical application, over this range of industries. But the basic framework remains unchanged and can be described by the following steps
define the scope of study identify hazards. Define and enumerate scenarios (chain of incidents) select incidents and incident outcome cases quantify risks (estimate consequences and probabilities) assess acceptability reconfigure system and recalculate risk
2.2.2 Event-tree analysis Event tree analysis is commonly used to analyze complex fire scenarios in which several safety systems or emergency procedures are in place to respond to specific initiating events.
An event tree is a graphical logical model that identifies and quantifies possible outcomes following an initiating event and provides a systematic coverage of the time sequence of event propagation. At each heading or node, two or more alternatives are analyzed until a final outcome is obtained for each node. Each heading corresponds to a conditional probability of some outcome if the preceding event has occurred. The frequency of each outcome may be determined by multiplying the initiating event frequency with the conditional probabilities along each path leading to that outcome.
Kaplan-Garrick [9] defined risk as a set R of ordered triplets
R = {E,, pEi, c E,, i = 1 ... n} (2)
where the first element E, in each triplet designates a specific scenario, pE, is an estimate of the conditional probability for E, to occur and c E, consists of a vector of the consequences of E, occurring. The event tree may be seen as visualization of the ordered triplet representation.
In effect, the set R answers the following three fundamental questions: What can go wrong (by hazard identification)?

How likely is this to happen (by frequency analysis)? What are the consequences (by consequence analysis)?
The most common procedure to represent the information in the R-set and obtained by a event tree analysis is a complementary cumulative distribution function (CCDF). The CCDF provides a display of the information contained in the probabilities pE and the consequences cE (a risk profile). An extremely simplified example will illustrate the procedure [lo]. The study of the analysis is the available safe egress time (ASET) margin for a fire in a assembly room building. The scenario event tree outlines the various outcome cases for functioninglnon-functioning fire alarms, sprinklers and emergency doors. The event tree indicates the routes by which the initial event (including evacuation) can develop. At each branch, a question is posed related to the development of the event and branch probabilities are assigned, based on statistical data. Each path through the event tree defines a scenario, and accordingly the event tree in Fig 1 defines eight scenarios 1-8.
Emergency door blocked
Sonnkler fmluie YES - Scenano 1
~ i m falure 1 no - Scenano 2
1 yes no yes - Scenano3
i n i t i fire 1 I no Scenhno 4 - - Scsnano 7
,, 0. t Included polnt - Excluded polnr i
- Scenana 8 cE Consequence value
FIGURE 1. Event tree describing the eight scenarios FIGURE 2. Conshuction of a CCDF [lo]
Assume that all uncertainties are negligible and all branch probabilities are fixed. The eight consequence results cE,, i = 1, ... 8. may be ordered so that cE, 5 cE ,+,. The associated CCDF is shown in Fig 2. The CCDF answers the question "How likely is it to be this bad or worse", the frequency of exceedance.
Figs 1 and 2 illustrate the assessment problem for what is essentially a one-room scenario. For assessing life safety for a multi-room building, the IS0 framework document describes [4] risk to life RL,,, as
where S = number of source locations F = number of fire scenarios T = number of target locations

RL(s, f, t) = risk to life for a given source, scenario and target location
Indicative event-tree formulations of the time-line based developments of fire scenarios on one hand and occupant response and behaviour on the other can be found in [2]. As these will have to be combined separately and with the S number of source locations and T number of target locations the potential for very large number of scenarios and an unmanageable calculation load is obvious and requires a procedure for selection of the main and most important scenarios [1-41.
2.3 Uncertainty analysis in general
Uncertainty, sensitivity and importance are central, some would say the central, issues in the utilization of risk assessment results. Uncertainty analysis is used to estimate the effect of data and model uncertainties on the risk estimate; sensitivity analysis estimates the effect on risk estimate of varying the individual imput data; and importance analysis quantifies and ranks the relative contribution from single component uncertainties to the total system uncertainty. We will begin our uncertainty analysis by looking at main uncertainty components and the steps of an uncertainty analysis for a single scenario.
The factors affecting the reliability of an event tree evaluation have been identified as belonging to five distinct categories [I 11: (1) Uncertainty due to improper definition and conceptualization of the assessment problem
or scenario (2) Uncertainty due to improper formulation of the conceptual model (3) Uncertainty involved in the formulation of the computational model (4) Uncertainty inherent within the estimation of parameter values, and ( 5 ) Calculational and documentation errors in the production of results.
Other standard references usually refer to three generic sources of uncertainty: model uncertainty, data or parameter uncertainty, general quality uncertainty with general quality uncertainty denoting the combined influence of categories (I), (2) and (5) above.
One can distinguish between two types of uncertainties: knowledge uncertainty (fundamental, epistemic) due to lack of fundamental knowledge and variability (stochastic uncertainty, randomness) in a population. The former can be reduced by additional fundamental information; the latter can be reduced in principle by exhaustive study. The two types of uncertainties, however, can be measured by the same method (probability). When dealing with a single element in the population, both types of uncertainty become the same (lack of knowledge) and the risk is characterized by one probability (e.g., of failure) that represents both types of uncertainty for decision-making purposes. Knowledge uncertainty reflects a lack of knowledge that is described by a probability distribution. Variability represents heterogeneity across some dimension (population, time, space, etc.) that is represented by a frequency distribution [l 11.
In this review, the uncertainty analysis will be assumed to be structured mainly as follows:

Identify the important sequences of events (scenarios) and respective mathematical submodels. Identify type of uncertainty inherent in input parameters. Use available data, expert opinion or subjective judgement to derive the corresponding subjective distribution functions. Estimate model variability. Perform analysis of total uncertainty, importance analysis and sensitivity analysis by using Monte Carlo simulation techniques combined with response surface methodology or by using analytical variance propagation method.
We will first consider the single scenario example.
2.4 Uncertainty propagation for a single scenario 2.4.1 Monte Carlo methods Monte Carlo methods may be used for at least two purposes: approximate calculation of the multi-dimensional integral in Eq 1 and for propagation of uncertainty. We assume that the basic variables Xi in Eq 1 are statistically independent with known distribution functions. When applied to Eq 1, a random number generator produces independent sample values xi for each of the basic variables and the corresponding deterministic value g of the limit state function G. This process is repeated a large number of times n and P,,,,, determined from
= P(G 5 0 ) = lim k l n n+ m
(4)
where k is the number of trials where g(x, ... x,) 5 0.
To propagate uncertainties through the calculation model to produce a distribution of model prediction, a number of analytical an numerical sampling (Monte Carlo) procedures are available.
In each "trial" of a Monte Carlo simulation, the computer selects a random value from a prespecified distribution for each variable or uncertain parameter, and uses the results to calculate one or more outcome quantities of interest. The distribution of the outcome parameter is thereby determined as the result of the combined effects of multiple sources of variability or multiple sources of uncertainty [l 11.
In the one-phase simple random sampling procedure outlined above the final result is a CCDF for the model prediction. The procedure does not distinguish uncertainty due to variability from knowledge uncertainty. In a modified procedure, a two-phase sampling procedure is introduced, the first phase handling knowledge uncertainty, the second stochastic uncertainty [lo]. The result is a distribution of CCDF's, allowing a distinction between uncertainty which, at least in theory can be eliminated (knowledge uncertainty) and variability which always will be present. An example will be given later.

2.4.2 Analytical models, variance propagation and importance studies Analytical expressions exists for variance propagation through an algebraic equation. For simple additive or multiplicative models the results are exact (in terms of means and variances). For a general expressions g the total variance can be approximated by a first order method as
which allows the decomposition of the total variance into components. The fraction of variance caused by the i-th variable, x,, is,
Alternative analytical methods for propagation of variance are described in [l 11.
2.5 Design and safety checking for the single scenario case 2.5.1 The reliability index P As mentioned above, safety checking using Eq 1 direct (level 3 design) is normally not possible. Resort has to be taken to level 2 (FOSM) methods. In present level 2 methods, the failure surface G(x, ... x,) = 0 is approximated by a tangent hyper plane at the point of the failure surface closest to the origin (= most probable point of failure). The distance is called the safety index P. Use of a level 2 method implies that the safety level in a design process can be described by the parameter, P, also called reliability index. This index contains information about the margin of safety in the limit state function as well as the uncertainty of the parameters in the limit state function. For illustrative purposes consider a limit state equation calculating the margin M = T - Q where T and Q are independent stochastic parameters and described by means and standard deviations. The parameter T can be interpreted as a strength variable and Q as a load variable. The system is functioning if the margin is positive i.e. the strength is higher than the load. The mean and standard deviation of the margin can be described as
p~ = p~ - PQ and o~ = .lo$ + o $
One very early version of reliability index PC was defined by Cornell [12] as
If the parameters T and Q are normally distributed the margin M will also be normally distributed. The parameter (M - y,)/o, is N(0,l) and the probability of failure p , can then be calculated as
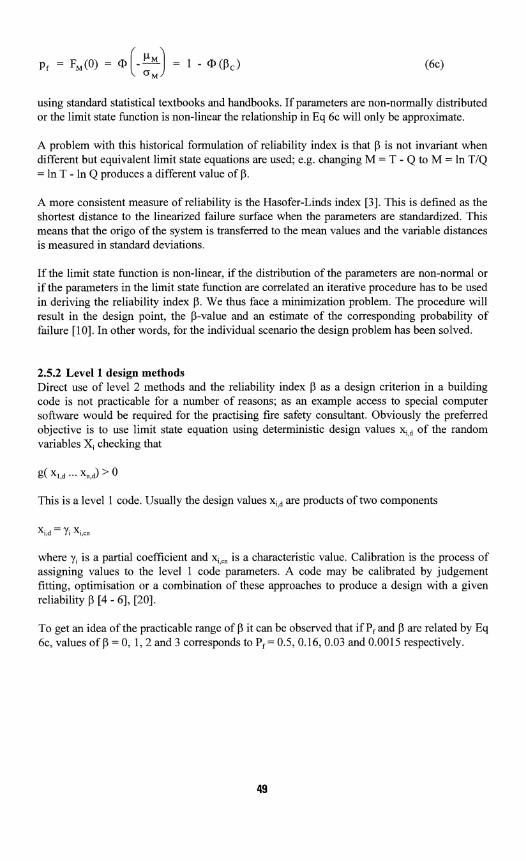
using standard statistical textbooks and handbooks. If parameters are non-normally distributed or the limit state hnction is non-linear the relationship in Eq 6c will only be approximate.
A problem with this historical formulation of reliability index is that P is not invariant when different but equivalent limit state equations are used; e.g. changing M = T - Q to M = In TIQ = ln T - In Q produces a different value of P.
A more consistent measure of reliability is the Hasofer-Linds index [3]. This is defined as the shortest distance to the linearized failure surface when the parameters are standardized. This means that the origo of the system is transferred to the mean values and the variable distances is measured in standard deviations.
If the limit state function is non-linear, if the distribution of the parameters are non-normal or if the parameters in the limit state function are correlated an iterative procedure has to be used in deriving the reliability index 0. We thus face a minimization problem. The procedure will result in the design point, the p-value and an estimate of the corresponding probability of failure [lo]. In other words, for the individual scenario the design problem has been solved.
2.5.2 Level 1 design methods Direct use of level 2 methods and the reliability index 0 as a design criterion in a building code is not practicable for a number of reasons: as an example access to special computer software would be required for the practising fire safety consultant. Obviously the preferred objective is to use limit state equation using deterministic design values x,, of the random variables X, checking that
This is a level 1 code. Usually the design values xi, are products of two components
where y, is a partial coefficient and x,,,, is a characteristic value. Calibration is the process of assigning values to the level 1 code parameters. A code may be calibrated by judgement fitting, optimisation or a combination of these approaches to produce a design with a given reliability p [4 - 61, [20].
To get an idea of the practicable range of 0 it can be observed that if P, and are related by Eq 6c, values of = 0, 1; 2 and 3 corresponds to P, = 0.5, 0.16, 0.03 and 0.0015 respectively.

2.6 Risk representation for the event tree description
The CCDF curve in Fig 2 is deterministic in the sense that probability only enter in the form of fixed branch probabilities. Consequence calculations are based on pre-determined (design) values of input parameters. In a real problem, both branch probabilities and input parameters will be characterized by an uncertainty or a variability, most often described by a statistical distribution.
As in the case for the two-phase Monte-Carlo simulation, risk will be represented by a distri- bution of CCDF's, see Fig 7 illustrating the result from simulating the event-tree in Fig 1 1000 times by simple random Monte-Carlo sampling. The consequence on the horizontal axis denotes number of persons unable to evacuate safely; i.e. values > 0 denote unsafe outcome. We will return to this figure later.
2.7 The concept of acceptable risk
A common unit of measure is needed to estimate and communicate risk. Based on the number of calculated fatalities, a number of measures have been introduced to indicate risk. Among these are risk indices, individual risk measures and societal risk measures, c.f. chapter 8 in reference 15. Lack of space prohibits any discussion on the most suitable measure for building fire risk. We will limit ourselves to define a societal risk measure, the so called F-N curve: A graph of the cumulative probability of events (CCDF-curve) causing N or more fatalities ver- sus N, the number of fatalities.
Risk acceptance is a multi-dimensional concept, comprising numerically calculated values as well as risk perception and risk communication issues. Various authorities have established numerical safety goals which for the maximum individual has in the range 1 0 ' ~ - per year, depending on source of exposure and characterization of the exposed [I 51.
An example of an acceptable societal risk curve is given in Fig 8. The literatures is extensive, c.f. references 14-16.
2.8. Five methods for quantitative risk assessment
The preceeding section have outlined five different variations of a quantitative risk assessment study.
Method 1: A fully probabilistic method for the single scenario example, employing analytical methods for propagation of uncertainty and introducing the concept of reliability index P. Method 2: The single scenario example treated by a one-phase, simple random sampling Monte Carlo simulation study. Method 3: The same case treated by a two-phase Monte Carlo simulation procedure. Method 4: Multi-scenario event tree evaluated deterministically (but described by (a distribu- tion of) CCDF-curves). Method 5: Multi-scenario event tree evaluated with an uncertainty analysis included.

3. SOME MAJOR EXISTING RISK ASSESSMENT MODELS IN FIRE SAFETY ENGINEERING
A considerable amount of work has for the last two decades been devoted to risk assessment studies, production and application of assessment models, as a glance through the proceedings from the four first IAFSS symposia will readily tell. Another yardstick of the amount of effort invested in this area can be found in the SFPE Handbook, where the entire last section "Fire Risk Analysis" is dedicated to a comprehensive survey, covering twelve chapters [26].
The risk assessment methods demonstrated in the SFPE Handbook exhibit a considerable diversity in approach and practical applicability. Some models are developed for a specified purpose, others are of a more general nature. Intercomparisons are next to impossible and we will in this paper restrict ourselves to a summary mention of some major efforts. Most of the approaches have been published extensively and readers are urged to consult the references mentioned above for a more complete introduction and list of publications.
An engineering procedure to evaluate fire performance has been evolving for over two decades at Worcester Polytechnic Institute [17]; often denoted the Building Firesafety Engineering Method or simply the "Method".
The framework of the method organizes the complete firesafety system so that interactions, interdependencies, and time relationships for any site specific building may be incorporated into the evaluation. Although the framework has some ancestry in system analysis, risk analysis, and common fire protection practices, it is not any of these separately. The framework coordinates an engineering analysis within fault/success tree and event tree structures.
Quantification is based on deterministic analyses that use the state of the art of fire science and engineering. Performance is described as a probabilistic degree of belief that encodes the available information and acquired knowledge of the building. The method can be used with any code and standard regulatory system and is appropriate for buildings, ships, tunnels, and mass transit systems.
The risk assessment originally developed in cooperation between National Research Council of Canada and Victoria University of Technology in Australia has been extensively published [IS]. The model assesses the expected risk to life to the occupants in a building as a result of all probable fire scenarios over the design life of the building. As well, the model assesses the fire protection costs (capital and maintenance) and expected fire losses. By comparison to the performance required in a performance-based code, or the implied performance of a reference design as specified in a prescriptive-based code, the model can assess whether a proposed design meets the performance requirements, or is equivalent in life risk performance to the reference design. In addition, the model can assess the fire costs to see whether the proposed design has the lowest fire costs of all acceptable designs, and, hence, is a cost-effective design. The basic structure of the model follows the approach outlined by Eq 3.
The model CRISP I1 [I91 developed by Fire Research Station, UK is an object oriented software developed for deterministic simulation of fire hazards. The basic structure is that of a

zone-model based on interaction between objects such as burning items, hot and cold gas layers, vents, walls, rooms; alarms occupant behaviour. The model will be extended to cover random aspects and be used in Monte Carlo studies to estimate fire risk in a given building.
A number of other quantitative approaches, as well as qualitative and semi-quantitative methods for fire risk ranking are described in section 5 of the SFPE Handbook.
4. SOME RISK QUANTIFICATION CALCULATIONS USING METHODS FROM CHAPTER 2
4.1 General principles
In a long term project started some three years ago, the application of some of the mainstream risk assessment methods mentioned in section 2 to the building fire safety engineering area has been extensively studied. A number of reports have been published, covering basic methodologies [lo], safety factors and reliability based design [20], determination of model uncertainty [21], risk levels inherent in current or past prescriptive regulations [22], reliability based fire safety design for health care facilities and hotel buildings [23], [24]. In an additional project, limits of applicability and confidence limits for the equations and other mathematical treatments in the UK Draft Guide [25] have been reviewed.
The general objectives and guidelines for the project could be formulated to explore the potential of the methods summarized in chapter 2 for risk assessment of building firesafety to derive assessment procedures that are as transparent, verifiable and repeatable as possible to explore the possible need for international standardization both in general methodology and in characterization of parameter and calculation model uncertainty
Input data uncertainty was described by distributions derived from limited data and subjective judgement, model uncertainty quantified (in some cases) by statistical analysis and output from computer models approximated by response surface equations.
4.2 Calculation scenario
We will illustrate principles and methods by showing results from the most simplified problem, evacuation life safety from a public assembly building [lo], see Fig 1.
The escape time margin is used as the definition of safety. The limit state function is expressed as
S =time to reach critical conditions in the room M, = model uncertainty

D = detection time of the fire R = response and behaviour time of the occupants E = movement time out of the room.
The time to reach critical conditions is derived using the CFAST model. A set of combinations of floor area, room height and fire growth rate is used to calculate the time t critical conditions for each combination. With all the combinations and times a regression analysis was performed to get a metamodel predicting the time to critical conditions as a function of fire growth rate, a , floor area, A and room height, H. The fire is characterized as an at2-fire. The regression equation for time to critical conditions is for scenario 6
The same procedure was made for the detection time using the Detact-t2 model, resulting in
The movement time is calculated as
where N is the number of occupants per square metre W is the door width F is the specific flow of occupants through the doorway
The parameters in the limit state function are all random variables except the door width and the specific flow constant. The door width is the design parameter and the specific flow constant is set to 1 persodm.~.
Distribution functions for main variables are: a : uniform (0.001, 0.1) kW/s2 H: uniform (3, 12) m Area: uniform (300, 300)s N: triangular (0.1,01.8, 1 .O) person/m2 M,: normal (1.35, 0.1)
The model uncertainty for the CFAST model was derived as N(1.35, 0.1) [21] where N denotes normal distribution.
4.3 A few illustrative results
The figures shown below represent a small fraction of the calculated results; for more information see references. Observe that all results except those in Fig 8 are based on the assumption that a fire has actually started and develops according to the a t2 - expression.

Method 1, the safety index D-method The procedure produces the safety index (3, an approximate value of the probability of failure P, and the design values of stochastic parameters. Fig 3 gives safety index (3 for the 8 scenarios, Fig 4 an example of decomposition of total uncertainty into component variances.
Methods 4 and 5. evaluation of event-trees Fig 7 gives the distribution of CCDF's obtained by Monte Carlo simulation (simple random sampling) applied to the event-tree in Fig 1. The number of simulations is 1000, each simulation producing a CCDF. When translated into the number of persons not being able to evacuate and drawn on a logaritmic scale the F-N curve in Fig 8 is obtained. The results in Fig 8 are based on the assumption that fire initiation frequency = 0.001lyear.
scenario 1
scenano 2
sceoarlo 3
scenario 4
scenarla 5
scenario 6
scenario 7
scenarlo 8
merged
A1 =an. So =an 1 I 040
0.942
1 0.247 Al.=off, Sp =an
j 0.369
1 0.468 Ai.=aff So =on
j 0 531
I 0 673 A =an, Sp =off
j 0.870
1 0 901
0.0 0.5 1 0 I 5 2 0
safe$, Index :-i
FIGURE 3. Safety index for the 8 scenarios in Fig 1 [lo]
u FIGURE 4. Total uncertainty divided into
compartment uncertainties, scenario 6 [lo]
scenarlo no 6 (A1 =an. Sp =OH. Doar=Clear)
Method 2 and 3, Monte-Carlo simulation techniclues Fig 5 gives the distribution of CCDF's for scenario 6 resulting from a two-phase sampling procedure, Fig 6 the median value of probability of failure P, as well as the 90-percentile interval for all 8 scenarios in Fig 1. Observe that the method produces a distribution of P , not only a point estimate.
-1000 -800 -800 -400 -200 0 200 400 600 800 1000 negatlve margin -g[sl
FIGURE 5. Two phase Monte Carlo simulation applied to scenario 6 [lo]
ftrst order sensltlvihi rscerarlo 6)
MD MEalpha
Area
N 1

4.4 Some conclusions from the Lund project
A number of tentative, general
scenarlo 1
scenarlo 2
scenarlo 3
scenario 4
CI median
scenario 5
scenano 6
scenaila 7
scenaila 8
merged
conclusions can be drawn from the presented project. Some main ones:
(1) Point estimates versus description by use of confidence intervals Compared to simple random sampling, the two phase sampling procedure produces more information that is clearly valid
0% 20% 40% 60% 80% '0°" and of importance for the probabllly o i fallure ($61
decisionmaking. FIGURE 6. Probabilities of failures for the 8 scenarios.
Mean and 90 percentile interval [lo] (2) Range and level of P One relevant result from our study is that using our selected
F - N - CUNB. Assembly room probability distributions, we arrive
-1600 -800 -600 -400 -200 0 200 400 600 800 Number of aflected persons
FIGURE 7. CCDF's obtained by Monte Carlo simulation of the event-tree in Fig 1 [29]
at surprisingly high values of P, and low values of p. Another important result is that the range of fi over a number of scenarios (absenceipresence of various protection systems) is smaller than one perhaps intuitively thinks.
(3) Risk levels inherent in buildings designed according to prescriptive methods It was demonstrated in [22] that risk levels in existing buildings (and designed with the Icelandic prescriptive code as a base) exhibits an unacceptable degree of variation and hetrogenity.
(4) Calculation of safety factors It has been demonstrated that partial coefficients or safety factors can be derived for hand calculation design equations by optimization studies [20].

Dutch limit
F - N - C U N ~ . Assembly room 80 %-t~le (5 ) Quantification of model l o 3 I uncertainty
I
statistical terms. It must be
i observed that this uncertainty forms only a part of the overall 4 model uncertainty [Zl].
1
1 o 4
+%h (6) Safety Design factors methods may be rationally
derived [20]. Design formats could be based on basic variables,
t I directly on the derived terms in Eq i ~ j 1 [28] or, conceivably in the so
, l o t o
, , , called load and resistance factor 10" 10' 1 02
Number of atfected persons 10' design (LRFD) format [27].
1 described and quantified in 1
FIGURE 8. F-N curve obtained for the evacuation problem outlined in Fig 1. Straight line indicates acceptable higher limit according to Dutch guide-lines 1151
- ,
(7) In order to achieve a level of professional concensus, work should be started on an international guidance document, reflecting good practices in selection and utilization of risk assessment techniques. A general standard for technological systems may be found in [30], a discussion on the issue of international standards and risk assessment is given in chapter 13 of [151.
Model uncertainties can be
5. SOME FINAL COMMENTS
- _ _ )
There are some basic advantages for the use of risk assessment procedures in fire safety design. It provides a rational and scientific foundation for risk management and a systematic framework for choosing a risk reduction strategy and the allocation of resources. Underlying uncertainties are explicitly addressed, resulting in a plausible and credible range for the risk estimates. Probabilistic risk calculations allow an estimate of the sensitivity of the result to changes in input data and of the importance of single parameters for the total uncertainty.
No concensus exists on the methodology or on the interpretation of results. The approaches vary from one engineering area to another as demonstrated by comparing standard calculation procedures in e.g. environmental, chemical process, offshore and nuclear engineering. Data are often inadequate and has to be derived by subjective expert opinion elicitation procedures. A risk assessment of even a simplified and restricted practical case have produced risk estimates that differ by two or three orders of magnitude. In addition, risk assessments are difficult to explain and understand. Linked to this problem is the fact that the public often evaluate and rank risks differently to the calculated risks. Factors affecting risk perception include catastrophic potential, voluntariness of exposure, familiarity, dread, and clarity of

benefits. As a consequence, calculated risk is just one factor in the public's judgement of risk acceptability. Risk assessment often do not explicitly address the link between system performance and human behaviour.
Lastly [28], many failure types are not at all addressed by the kind of analysis discussed in this review.
In the final analysis, fire safety engineering will follow other engineering areas in recognizing risk assessment as an irreplaceable and invaluable tool in the total risk management process.
REFERENCES
Draft British Standard guide to the application of fire safety engineering vrincivles to fire safety in building. BSI 1995. Fire Engineering guidelines, draft 5,O. Fire Code Reform Centre, Australia, 1995. Nordic Committee for Building Regulation: Performance Based Fire-safety Requirements and Technical Guidelines for the Calculation Process. Working Report 1994:07. ISOiWD 13387 Fire Safety Engineering - The Avvlication of Fire Performance Concevts to Design Objectives, ISOITC92ISClIWG1, 1996. Thoft-Christensen, P., Baker, M.J., Structural Reliability Theory and Its Avvlications. Springer-Verlag, Berlin 1982. Madsen, H.O., Krenk, S., Lind, N.C., Methods of Structural Safety. Prentice-Hall, Engelwood Cliffs, 1986. Ang, A. H-S., Tang, W.H., Probability Concevts in Engineering Planning and Design, Volume 11, John Wiley & Sons. 1994. Magnusson, S.E., Frantzich, H.. Karlsson, B. and Sardqvist. S., Determination of Safety Factors in Design Based on Performance. Fire Safety Science - Proceedings of the 4'" Intern'l Symp IAFSS, pp 937-948, Gaithersburg, 1994. Kaplan, S. and Garrick, B.J., On the Quantitative Definition of Risk, Risk Analysis, Vol 1 No 1, 1981. Magnusson, S.E., Frantzich, H., Harada, K., Fire Safetv Desien Based on Calculations, Uncertainty Analysis and Safetv Verification, Report 3078, Dept of Fire Safety Engineering. Lund University, Lund 1995. Also to be published in Fire Safety Journal. IAEA Safety Series No 100 Evaluating the Reliability of Predictions Mode Using Environmental Transfer Models IAEA, Vienna 1989. ISBN- 92-0-124089-9. Comell, C.A., First Order Analysis of Model and Parameter Uncertainty. Proc. Int. Symp. On Uncertainties in Hydrol. Water Resours. Syst., University of Arizona, Vol 2, pp 1245-1275,1972. Hasofer, A.M. and Lind, N.C., An Exact and Invarient First Order Reliability Format. Proc. ASCE, J. Eng. Mech. Div., pp 11 1-121, 1974. Guidelines for Chemical Process Quantitative Risk Analysis. Center for Chemical Process Safety of the American Institute of Chemical Engineers. New York 1989. Kolluru, R. et al., Risk Assessment and Management Handbook for Environmental Health and Safetv Professionals. McGraw-Hill 1996.

Rasbash, D.J., Criteria for Acceptability for Use with Quantitative Apvroaches to Fire Safetv Journal vol 8, pp 141-158. Fitzgerald, R.W., Pietroforte, R., Nadeau, D.R. and Wojzik, J.J., Building Fire Performance Evaluations, International Conference on Performance-Based Codes and Fire Safety Design Methods, 22-24 Sept 1996, Ottawa. Yung, D. and Beck, V.R., Building Fire Safety Risk Analysis, SFPE Handbook of Fire Protection Engineering, National Fire Protection Association, Quincy, MA, 1995, pp 5- 95 to 5-101. Fraser-Mitchell, J.N., An Object-Oriented Simulation (Crisv 11) for Fire Risk Assessment, Fire Safety Science Proceedings of the Fourth International Symposium, Ottawa 1994. Frantzich, H., Holmquist, B., Lundin, J., Magnusson, S.E. and Ryden, J., Derivation of Partial Safetv Factors for Fire Safetv Evaluation Using the Reliability Index D Method. This Symposium. Bragason, F., Holmquist, B., Lundin; J. and Magnusson, S.E., Determination of Modeling Uncertainty for CFAST, Dept of Fire Safety Engineering, Lund University, 1996. Kristjansson, G.K., On Probabilistic Assessment of Life Safetv in Buildings on Fire. Faculty of Engineering, University of Iceland and Dept of Fire Safety Engineering, Lund University, 1996. Frantzich, H., Fire Safetv Risk Analysis of a Health Care Facility. Report 3085, Dept of Fire Safety Engineering, Lund University, Lund 1996. Frantzich, H., Fire Safetv Risk Analysis of a Hotel, Draft revort, Dept of Fire Safety Engineering, Lund University, 1996. Magnusson, S.E., Review of BSI Guide, Extra-mural contract, EMC 95-1 12, Report to DOE UK 96-06-27, submitted to Fire Safety Journal for possible publication as a special issue. SFPE Handbook of Fire Protection Engineering, NFPNSFPE 1995. Lucht, D.A., Public Policy and Performance-Based Engineering, International Conference on Performance-Based Codes and Fire Safety Design Methods, Ottawa 24- 26 Sept 1996. Magnusson, S.E., How to Derive Safety Factors, International Conference on Performance-Based Codes and Fire Safety Design methods, Ottawa 24-26 Sept 1996. Frantzich, H., Draft Ph.D. thesis, 1997. International standard IEC 300-3-9. Dependability Management, part 3: Application Guide - Section 9. Risk Analysis of Technological Systems. Reference umber CEIIIEC 300-3-9: 1995.