Rhode Island Greenhouse Gas Emissions Reduction Plan
89
Rhode Island Greenhouse Gas Emissions Reduction Plan December 2016
Transcript of Rhode Island Greenhouse Gas Emissions Reduction Plan

1
Rhode Island Greenhouse Gas Emissions Reduction Plan
December 2016

2
Table of Contents
ACKNOWLEDGEMENTS .......................................................................................................................................... 3
LETTER FROM THE CHAIR ....................................................................................................................................... 4
ABOUT THIS PLAN .................................................................................................................................................. 6
PROCESS AND METHODOLOGY .......................................................................................................................................... 6
EC4 AND THE RESILIENT RHODE ISLAND ACT ....................................................................................................................... 7
GHG SOURCES AND PROJECTIONS ......................................................................................................................... 8
CURRENT GHG PROFILE .................................................................................................................................................. 8
BUSINESS-AS-USUAL GHG PROJECTIONS ............................................................................................................................ 9
GHG MITIGATION PATHWAYS ............................................................................................................................. 10
MAJOR GHG MITIGATION OPTIONS ................................................................................................................................ 10
SCENARIO MODELING FINDINGS...................................................................................................................................... 12
POLICY AND IMPLEMENTATION ........................................................................................................................... 14
1) BUILD ON STATE SUCCESS ......................................................................................................................................... 14 Energy Efficiency ......................................................................................................................................................... 15 VMT Reductions .......................................................................................................................................................... 17 Clean Energy ............................................................................................................................................................... 17 Electric Heat ................................................................................................................................................................ 19 Biofuel Heat ................................................................................................................................................................ 19 Electric Vehicles .......................................................................................................................................................... 20 Transportation Biofuels .............................................................................................................................................. 21 Land Use Conservation ............................................................................................................................................... 21 Other Mitigation Options ............................................................................................................................................ 22
2) ENABLE MARKETS AND COMMUNITIES......................................................................................................................... 22 Grow Clean Economy Jobs .......................................................................................................................................... 22 Empower Citizens and Communities .......................................................................................................................... 22 Foster a More Dynamic Utility Regulatory Model ...................................................................................................... 23 Lead by Example ......................................................................................................................................................... 23
3) LEVERAGE REGIONAL COLLABORATION ........................................................................................................................ 24 Regional Greenhouse Gas Initiative ............................................................................................................................ 24 Transportation and Climate Initiative ......................................................................................................................... 25 New England Governors/Eastern Canadian Premiers ................................................................................................. 25 Other Regional Work .................................................................................................................................................. 25
MONITORING PROGRESS ..................................................................................................................................... 26
THE PATH FORWARD ........................................................................................................................................... 27
APPENDIX 1 – REFERENCE CASE ASSUMPTIONS AND RESULTS ............................................................................ 28
APPENDIX 2 – SCENARIO MODELING ASSUMPTIONS AND RESULTS .................................................................... 57

3
ACKNOWLEDGEMENTS
The Executive Climate Change Coordinating Council (EC4) would like to thank all those who helped contribute to
the development of this Plan:
State Project Management Team
Danny Musher – Office of Energy Resources
Elizabeth Stone, Frank Stevenson – Department of Environmental Management
Caitlin Greeley – Division of Planning
Meredith Brady – Department of Transportation
NESCAUM GHG Study Team
Paul Miller, Jason Rudokas – Northeast States for Coordinated Air Use Management (NESCAUM)
Taylor Binnington, Jason Veysey, Charlie Heaps – Stockholm Environment Institute-US (SEI-US)
Michelle Manion, Claire Zarakas, David Cooley – Abt Associates
EC4 GHG Study Technical Committee
Invited Member* Alternate Member* Affiliation
Sue AnderBois Northeast Clean Energy Council (NECEC)
Leah Bamberger Dino Larson City of Providence
Todd Bianco Rhode Island Public Utilities Commission (RIPUC)
Josh Brumberger Chris Lekkas Utilidata
Abel Collins Town of South Kingstown
Al Dahlberg Brown University
Roberta Fagan Oil Heat Institute of Rhode Island (OHI)
John Flaherty Grow Smart RI
Sarah Ingle Rhode Island Public Transit Authority (RIPTA)
Tricia Jedele Conservation Law Foundation
Leslie Malone Acadia Center
Butch Roberts The Energy Council of Rhode Island (TEC-RI)
Brigid Ryan Emerald Cities
Rob Sherwood Jon Dember CLEAResult
Ian Springsteel Sandy Taft National Grid
*Members listed attended at least one meeting of the Technical Committee between December 2015 and December 2016.

4
LETTER FROM THE CHAIR
To: The Honorable Gina M. Raimondo, Governor
The Honorable M. Teresa Paiva Weed, President of the Rhode Island Senate
The Honorable Nicholas A. Mattiello, Speaker of the Rhode Island House of Representatives
In accordance with the provisions of Rhode Island General Laws §42-6.2-2(2), I am pleased to provide you with the
following “EC4 Greenhouse Gas Emissions Reduction Plan,” which includes strategies, programs, and actions to
meet the targets for greenhouse gas (GHG) emissions reductions as established in the Resilient Rhode Island Act.
As a coastal state vulnerable to the impacts of climate change, the need for Rhode Island to take bold action to
reduce greenhouse gas emissions is clear. Although climate change presents us with formidable challenges, we
also face an unprecedented opportunity to capitalize on technology advances, industry growth opportunities, and
innovation as we work to lower our carbon footprint. In transforming our energy systems, we can achieve climate
change goals, while unlocking economic opportunity and improving the environmental and public health of our
citizens and communities. For example, the quantitative modeling underpinning our State Energy Plan indicates
that it is feasible to achieve mid-term GHG reduction targets while diversifying our energy portfolio and creating
net benefits to our economy as a whole.
The Resilient Rhode Island Act charged the Executive Climate Change Coordinating Council (EC4) with developing a
Plan to meet the GHG reduction targets laid out in the law. This Plan, based on the best available data and
grounded in quantitative analysis and modeling, demonstrates that viable pathways exist for Rhode Island to
achieve the Act’s targets. In fact, thanks to the leadership of the Administration and General Assembly, Rhode
Island is already poised to meet and exceed the Act’s near-term
GHG reduction target of 10% below 1990 levels by 2020. This
achievement is due in no small part to your steadfast support
for Rhode Island’s nationally-recognized programs in energy
efficiency (the Least-Cost Procurement mandate) and
renewable energy (including the nation’s first offshore wind
project).
As illustrated in the Plan’s findings, Rhode Island is well-
positioned to leverage near-term successes into a sustained,
long-term effort to transform our energy economy. Although
our existing suite of policies enable us to meet the 2020 GHG
reduction target, achieving the 2035 and 2050 GHG reduction targets will entail major, economy-wide energy
transformations, both at a state and regional level. The Plan demonstrates that widespread adoption of clean
energy technologies and practices would be necessary to meet these long-term targets, including significant
electrification of heating and transportation energy use, powered by a nearly-completely clean energy-supplied
electric grid. Additional key mitigation strategies, including sustained commitment to least-cost energy efficiency,
increased focus on the reduction of vehicle-miles-traveled (VMT), growth in biofuel use, and land use strategies to
preserve forests will play a critical role as well. The good news is that Rhode Island can draw on our state’s unique
strengths and accomplishments to date to advance our long-term progress in GHG mitigation.
The Plan recommends three areas of opportunity for decision-makers to consider:
This Plan demonstrates that viable
pathways exist for Rhode Island to achieve
the Act’s targets. In fact, thanks to the
leadership of the Administration and
General Assembly, Rhode Island is already
poised to meet and exceed the Act’s near-
term GHG reduction target of 10% below
1990 levels

5
Build on State Success: Rhode Island has existing policies and proven models to address nearly all
mitigation options, creating a strong foundation the State can build upon to reach our goals.
Enable Markets and Communities: Rhode Island’s best resources are our people and communities – with
the right support, we can remove barriers to clean energy market growth, consumer education and
engagement, partnership of utilities, and public sector leadership.
Leverage Regional Collaboration: Rhode Island has a fruitful history of working cooperatively with
neighbors to seek scalable, cost-effective solutions to mutual challenges; climate change mitigation is one
such area that is ripe for strong regional partnerships.
As we move on to the next step of Plan implementation, the EC4 would like to highlight three major
considerations. First, the following Plan responds to the charge of the Act to evaluate the technical feasibility of
mitigation pathways toward GHG targets; however, policymakers must also consider ways to achieve goals that
optimize the economic, environmental, and health benefits to Rhode Island. The EC4 notes that such impacts could
significantly vary depending on the timing, magnitude, and types of mitigation options prioritized by policymakers.
To that end, the EC4 emphasizes the need to further evaluate costs and benefits, including macroeconomic,
environmental, and health impacts, in 2017 to help shed light on where the best opportunities lie to optimize
outcomes based on the best available current market data and projections.
Second, the EC4 would like to emphasize that this document is the beginning, not the end, of an ongoing
conversation to advance Rhode Island’s GHG mitigation priorities, policies and actions. As per the Act, this
document is intended to be used as a high-level reference for policymakers in the Administration and the General
Assembly, not as a detailed implementation guide or work plan. Therefore, EC4 has crafted a Plan that frames the
discussion, but intentionally defers detailed program and implementation discussion to appropriate working
groups, agency initiatives, and stakeholder collaborations.
Finally, the EC4 acknowledges that planning is an exercise in uncertainty. Just as clean energy markets and
technologies have evolved in unforeseen ways in past years, new solutions and options for GHG mitigation will
emerge in the future. The EC4 recognizes that the tools at our disposal will change over time, and new technology
and innovation will be a key ingredient to meeting our goals. We must plan and act now with today’s knowledge,
but understand that future opportunities will aid our long-term efforts to reach our objectives.
Climate change is one of the central challenges confronting our state. Fortunately, Rhode Island is ready to rise to
the occasion and lead. We have the tools and strengths to succeed, a proven track record, and momentum to carry
us forward. Indeed, the change in the political climate at the federal level reinforces the importance and power of
work and progress at the state and regional levels.
We look forward with enthusiasm to working with you as we chart our path forward to implementing solutions
and achieving Rhode Island’s GHG goals.
Sincerely,
Janet Coit
Department of Environmental Management, Director
Executive Climate Change Coordinating Council, Chair

6
ABOUT THIS PLAN
This Plan is organized according to five sections, and two appendices:
GHG Sources and Projections: This section describes Rhode Island’s current GHG emissions profile,
including major sources, and expected changes under “business-as-usual” (BAU) future conditions.
GHG Mitigation Pathways: This section describes the major findings of EC4’s modeling to determine
technically-viable pathways towards meeting the Resilient Rhode Island GHG reduction targets.
Policy and Implementation: This section describes policy and implementation options that could be
pursued to achieve the Resilient Rhode Island targets.
Monitoring Progress: This section describes procedures Rhode Island will take to monitor progress
toward achieving the GHG targets.
The Path Forward: This section describes the EC4’s vision for GHG mitigation implementation and next
steps to move from planning to action.
Appendix 1: Reference Case Assumptions and Results: This appendix provides technical documentation
for the “business-as-usual” reference case developed for use in this Plan’s GHG mitigation modeling.
Appendix 2: Scenario Modeling Assumption and Results: This appendix provides technical
documentation for the scenario modeling used to inform the development of this Plan.
PROCESS AND METHODOLOGY
The EC4 commissioned a Rhode Island Greenhouse Gas Emissions Reduction Study (the Study) to inform the
development of this Plan. The EC4 retained Northeast States for Coordinated Air Use Management (NESCAUM) to
develop the Study. The EC4 established a Project Team to oversee management of the Study development
composed of staff from the Rhode Island Department of Environmental Management (DEM), the Rhode Island
Office of Energy Resources (OER), the Rhode Island Department of Transportation (DOT) and the Rhode Island
Division of Planning (DOP). Finally, the EC4 established a Technical Committee to participate in the development of
the Study and provide feedback on key draft work products and deliverables. The Technical Committee consisted
of a targeted group of climate and energy stakeholders with subject matter expertise and experience in their
respective areas. The Technical Committee met six times over the course of 2016 to provide ongoing input into the
Study development.
Major components of the Study included:
1) Development of a baseline projection of GHG emissions out to 2050, assuming continuation of “business-
as-usual” market and policy conditions;
2) Identification of “major mitigation options” that could substantially reduce GHG emissions if widely
adopted, and upper bound estimates of mitigation option implementation rates over time, designed to
represent deployment of technologies at their economic or technical potential; and
3) Scenario modeling of technically-viable GHG mitigation pathways that could achieve the Resilient Rhode
Island GHG reduction targets, conducted using LEAP: the Long-range Energy Alternatives Planning System,
a widely-used software tool for energy policy analysis and climate change mitigation assessment.1
1 For details on LEAP, please see: www.energycommunity.org/LEAP/.

7
Results of the Study, including supporting analysis and sources of information, are included in appendices to this
Plan. Wherever appropriate, footnotes and references direct the reader to supplemental information contained in
these appendices.
EC4 AND THE RESILIENT RHODE ISLAND ACT
The 2014 Resilient Rhode Island Act established the EC4, and furthermore directed it to develop a plan to meet
targets for greenhouse gas emissions reductions. Specifically, the statute charged the EC4 with the following duty:
“No later than December 31, 2016, submit to the governor and general assembly a plan that
includes strategies, programs, and actions to meet targets for greenhouse gas emissions
reductions as follows:
(i) Ten percent (10%) below 1990 levels by 2020;
(ii) Forty-five percent (45%) below 1990 levels by 2035;
(iii) Eighty percent (80%) below 1990 levels by 2050;
(iv) The plan shall also include procedures and metrics for periodic measurement, not less
frequently than once every five (5) years, of progress necessary to meet these targets and
for evaluating the possibility of meeting higher targets through cost-effective measures.”
Table 1 displays the GHG reduction targets for 2020, 2035, and 2050 based on Rhode Island’s 1990
economy-wide emissions.2
Table 1. Resilient Rhode Island Act GHG Emissions Reduction Targets
Year GHG Reduction Target GHG Emissions Target (Million Metric Tons CO2 equivalent / year)
1990 N/A 12.48 (historical)3
2020 10% below 1990 levels 11.23
2035 45% below 1990 levels 6.86
2050 80% below 1990 levels 2.50
2 Rhode Island’s economy-wide GHG inventory covers emissions from all major sources and sinks, including (in order from largest contribution to smallest contribution): transportation, electric power consumption, residential, commercial, and industrial. Notably, there are two options for accounting for GHG emissions from the electric power sector: a “generation-based” or “consumption-based” methodology. “Generation-based” accounting considers all GHG emissions emitted by fossil fuel electricity generation occurring within the state. “Consumption-based” accounting considers GHG emissions associated with electricity used within the state. Because electricity in New England is provided through a regional transmission grid, the cross-border export and import of electricity is common. Therefore, an individual state’s “generation-based” GHG emissions are often different from that same state’s “consumption-based” emissions. The EC4 formally adopted the use of a consumption-based emission accounting because this method more realistically comports with the regional nature of New England’s electric grid and is consistent with the approaches taken by neighboring states. It can also be a more informative metric for state-level policymaking because many policy instruments available to states have more influence on electricity consumption than electricity generation.
3 See Appendix 1 for more information on the development of Rhode Island’s 1990 GHG baseline.

8
GHG SOURCES AND PROJECTIONS
This section provides background on Rhode Island’s current GHG emissions profile, including major sources, and
expected changes under “business-as-usual” future conditions.
CURRENT GHG PROFILE
What are the major sources of greenhouse gas emissions today in Rhode Island?4 As shown in Figure 1, Rhode
Island’s most significant GHG source sectors are, in order: transportation, electric power consumption, residential,
commercial, and industrial.5 Transportation-related GHG emissions are caused by fuel consumption in on-road
vehicles (e.g., light-duty cars and
trucks, short- and long-haul
trucking, and buses) and off-road
sources (e.g., marine vessels,
aircraft, construction and
agricultural equipment, and rail).
Electric consumption-related
emissions are caused by electricity
usage in all sectors, for applications
such as lighting, air conditioning,
appliances and devices, and
space/water heating.6 Residential,
commercial, and industrial GHG
emissions are caused by fuel
consumption in buildings, primarily
for space and water heating (as well
as cooking), and for process heat
generation and mechanical
assembly in industrial applications.
In 2015, Rhode Island’s greenhouse
gas emissions are estimated at
11.33 million metric tons CO2e.7
4 The scope of this Plan is limited to direct GHG emissions associated with: 1) the consumption of fossil fuels or electricity in equipment, devices, and processes (e.g., appliances, heating systems, vehicles, and industrial uses) and 2) non-energy sources such as direct emissions from solid waste (i.e., landfill methane emissions), changes in land use (e.g., deforestation), and industrial uses (e.g., from the use of hydrofluorocarbons). It should be noted that there are additional GHG emissions beyond these direct emissions. These include emissions associated with upstream impacts of energy resource extraction, processing, and transport (e.g., methane leaks in natural gas production), as well as emissions associated with “embodied energy” in everyday products. Embodied energy is the sum of all energy inputs to produce goods and services on a full “lifecycle” basis. This includes emissions associated with the mining and processing of raw materials, and product manufacturing, transport, storage, use and disposal. With the exception of lifecycle GHG reductions for biofuels, this Plan does not consider emissions associated with upstream impacts of energy resources or embodied energy.
5 See Appendix 1 for details on Rhode Island’s major GHG source sectors. Figure 1 displays projected emissions from the LEAP model for 2015; the last year of available historical emissions data for Rhode Island is 2013.
6 See Footnote 2 for explanation of consumption-based GHG emissions accounting for the electricity sector.
7 Carbon dioxide equivalent (CO2e) is a measure used to express the global warming potential of different greenhouse gases (e.g., carbon dioxide, methane, nitrous oxide) in a common unit.
Transportation40%
Electricity Consumption
20%
Residential19%
Commercial8%
Industrial7%
Solid Waste3%
Other3%
Rhode Island GHG Source Sectors (2015)
*Other includes transmission/distribution, wastewater, agricultural, and land use/land use change/forestry
Figure 1. Rhode Island GHG Source Sectors (2015)

9
BUSINESS-AS-USUAL GHG PROJECTIONS
How is Rhode Island’s GHG profile anticipated to change over time, absent the introduction of new federal, state,
or local GHG mitigation policies? Forecast results show that Rhode Island’s “business-as-usual” economy-wide
GHG emissions are anticipated to decline in the near term from 11.33 million metric tons CO2e in 2015 to 9.83
million metric tons in 2024, and subsequently rise steadily, reaching 10.19 million metric tons by 2050 (Figure 2).8
Under BAU conditions, Rhode Island is anticipated to meet the Resilient Rhode Island 2020 target for GHG
reductions, but not meet the 2035 or 2050 targets.
Major policy and market drivers of the BAU trend include:
Energy Efficiency: Rhode Island Least-Cost Procurement energy efficiency programs in effect until 2024
Regional Electric Power: Market- and policy-driven shifts in the New England market from oil and coal to
natural gas and renewable energy for power generation
Residential Energy Consumption: Slight decrease in demand due to combination of factors
Commercial Energy Consumption: Steady growth in demand due to combination of factors
Transportation Energy Consumption: Steady demand due to federal passenger vehicle GHG emissions
standards offset by projected modest VMT growth across all vehicle types
Other Emissions: Slight increase in GHGs due to combination of factors affecting land use change and
waste; these sectors transition from a net emissions sink to a net emissions source
Figure 2. Rhode Island Business-As-Usual GHG Emissions Projection
8 See Appendix 1 for more information on the “business-as-usual” reference case forecast.

10
GHG MITIGATION PATHWAYS
The EC4 evaluated scenario pathways for achieving the Resilient Rhode Island GHG emissions reduction targets.
The scenarios considered the impact of aggressive deployment of GHG mitigation options (e.g., clean energy
technologies) on the state’s future GHG emissions profile. The modeling results indicate that achieving the
Resilient Rhode Island targets will require major changes to Rhode Island’s energy economy. Meeting the 2050
reduction target – an 80% reduction in GHGs below 1990 levels – would entail a wholesale transformation of
energy production and use on both a state and regional level. At a high level, Rhode Island would need to address
the following four categories of mitigation in order to transition to the very low-carbon future envisioned under
the 2050 target (Table 2):
Table 2. Categories for Deep GHG Mitigation
Category Description Applicable Sectors
Energy Efficiency Significant improvements in energy efficiency (using less energy to provide the same outputs or services) are critical in the buildings, transportation, and industrial sectors. These can include changes in practices by consumers or businesses, such as reducing travel by single-passenger vehicles, as well as technological improvements that increase efficiency, such as energy efficient appliances or lighting.
Buildings Transportation
Electrification Electrifying energy end uses (converting from fossil fuels to electricity, such as with efficient electric heat pump systems or electric vehicles) maximizes the mitigation benefit of clean electricity.
Buildings Transportation
Decarbonization of Electricity
The GHG intensity of electric power can be reduced by increasing the role of renewables, no-to-low carbon energy resources (such as large hydropower), nuclear power, and carbon capture and storage.
Electricity
Decarbonization of Other Fuels
In addition to electricity, other fuels must be replaced by low-carbon alternatives to the extent feasible, such as substituting biogas for conventional natural gas or cellulosic ethanol for gasoline.
Buildings Transportation
MAJOR GHG MITIGATION OPTIONS
To explore potential pathways to meeting the Resilient Rhode Island targets, the EC4 identified a set of ten major
mitigation options within the categories identified above that could each reduce GHG emissions. The mitigation
options address all major GHG source sectors in the state and each relies on commercially available technologies.
For each mitigation option, assumptions for a “high penetration” deployment scenario were developed, in order to
represent the maximum feasible implementation potential that can reasonably be imagined for each option. Table
3 displays the mitigation options considered, and the penetration levels modeled to reach 2035 and 2050
reduction targets.
It should be noted that the following options represent GHG mitigation strategies available to us today. Additional
technology innovation in future years is unknown at present, but will likely supply further solution sets that
markets and policymakers can deploy to achieve the deep cuts in emissions necessary to meet aggressive long-
term targets.

11
Table 3. Major GHG Mitigation Option Scenario Penetration Levelsa
Major Mitigation Option
2035 2050
1. Energy Efficiency
Newly added savings of electricity, natural gas and heating oil (respectively) reach 1.5%, 1.5% and 0.5% of 2009 sales
Newly added savings of electricity, natural gas and heating oil (respectively) reach 2.7%, 2.3% and 0.9% of 2009 sales
2. VMT Reductionsb
2% reduction in passenger car and truck VMT
10% reduction in passenger car and truck VMT
3. Utility-Scale Renewable Energyc
67% renewable installed capacity 72% carbon-free generation
98% renewable installed capacity 99% carbon-free generation
4. Distributed Generationd
No change from reference case No change from reference case
5. Clean Energy Imports
Two new 1090 MW interconnections with Canada
Unchanged from 2035
6. Nuclear Re-Licensing
No change from reference case Millstone 2 and 3 are not retired in 2036
7. Electric Heat 33% of residential and 30% of commercial main heating load met with electric heat pump systems
81% of residential and 67% of commercial main heating load met with electric heat pump systems
8. Biodiesel / Biomass Heate
No change from reference case No change from reference case
9. Electric Vehicles 34% of on-road VMT electrified 62% of rail transport electrified
76% of on-road VMT electrified 97% of rail transport electrified
10. Transport Biofuels
10% biodiesel in diesel 28% cellulosic ethanol in ethanol 10% ethanol and cellulosic ethanol in gasoline
31% biodiesel in diesel 78% cellulosic ethanol in gasoline
a Table reflects results from Scenario 2. See Appendix 2 for details. b Relative to 2014. c Percentage of carbon-free generation excludes imports and demand resources. d The Distributed Generation mitigation option is mutually exclusive with “Utility-Scale Renewable Energy.” Deployment of
this option is explored in an alternate scenario. See Appendix 2 for details. e The “Biodiesel/Biomass Heat” mitigation option is mutually exclusive with “Transport Biofuels.” Deployment of this option is
explored in an alternate scenario. See Appendix 2 for details.
Figure 3 shows the cumulative impact of deploying all ten major mitigation options, demonstrating that all options
are needed to achieve the 2050 GHG target.9
9 See Appendix 2 for details on modeling results and additional scenarios that were analyzed for this Plan.

12
Figure 3. Rhode Island GHG Mitigation Scenario Pathway
SCENARIO MODELING FINDINGS
Scenario modeling of GHG mitigation pathways demonstrates that achieving the Resilient Rhode Island GHG
reduction targets would likely require deployment of all major mitigation options.10
An 80% GHG reduction by 2050 would likely require a near-zero carbon grid coupled with significant
electrification of residential/commercial space heating and on-road vehicles.
o Scenario modeling results indicate that the long-term GHG reduction target contemplated by the
Resilient Rhode Island Act would allow for only a very limited budget of GHG emissions across
the economy in 2050.
o Therefore, extensive GHG mitigation would be required in all major GHG source sectors to
achieve GHG reduction targets.
o As displayed in Table 3 above, scenario modeling results show that achieving the 2050 target
would likely require 99% carbon-free regional power generation; 81% of residential and 67% of
commercial main heating load met with electric heat pumps; and 76% of on-road VMT electrified
and 97% of rail transport electrified.
o In addition to significant penetration of clean energy and heating/transportation electrification,
model results suggest that implementation of additional strategies including deep energy
efficiency, VMT reduction, biofuel deployment, and land use conservation would likely be need
to achieve GHG reduction targets.
10 Summary of major findings reflect results from Scenario 2. See Appendix 2 for details on modeling results and additional scenarios that were analyzed for this Plan.

13
Achieving GHG reduction targets has implications for stock turnover of fossil fuel-consuming equipment
and infrastructure.
o Reaching the levels of GHG reduction in 2050 implied by the Act would require existing stocks of
conventional technologies (e.g., fossil fuel generating resources, heating equipment, and
vehicles) to be largely replaced with alternative, carbon-free technologies by 2050.
o Decarbonization of the electric grid could be achieved system-wide through strategies such as
regional market pricing mechanisms in order to gradually phase out more carbon-intensive
resources and increase clean resources, whereas achieving substantial electrification of heating
and transportation would require strategies to incentivize individual purchase decisions.
o Scenario modeling suggests that even with substantial increases in adoption rates of alternatives,
some proportion of conventional heating systems and vehicles could need to be replaced before
the end of their useful lives in the years leading up to 2050 in order to achieve the necessary
2050 penetration levels of heating and vehicle electrification.
Advanced biofuels may be a resource-limited option and could be prioritized for use in the heating or
the transportation sector.
o The future availability of advanced biofuels is uncertain and will ultimately be largely determined
by federal policies and regional and national market conditions.
o Scenario modeling for Rhode Island GHG mitigation pathways adopted an assumption that future
advanced biofuels will have net zero-carbon lifecycle emissions, which has not yet been
demonstrated in practice.
o Advanced biofuel supplies could be used for GHG mitigation in the heating or the transportation
sector.
o Scenario modeling for Rhode Island directed biofuel resources to the transportation sector
because fewer other viable technologies are commercially available at present to reduce heavy
duty long-haul trucking fleet GHG emissions.
New technologies are likely to play an important role in meeting the long-term target of 80% GHG
reduction by 2050.
o Scenario modeling only considered existing, commercially-available technologies.
o Certain sectors such as the heavy duty long-haul trucking fleet do not have clear, viable existing
mitigation alternatives to fossil fuels at scale.
o New technologies and innovation in the upcoming years are likely to increase the suite of
available, viable, and cost-effective solutions to meet long-term, deep emissions reductions.

14
POLICY AND IMPLEMENTATION
Thanks to the leadership of State policymakers, Rhode Island is already poised to meet and exceed the 2020
Resilient Rhode Island GHG reduction target. Achieving the 2035 and 2050 targets, however, will require much
deeper cuts in emissions throughout all major GHG source sectors. The EC4 recommends that Rhode Island
policymakers consider the following mix of strategies, programs, and actions to meet targets for greenhouse gas
emissions reductions in Rhode Island:
1) Build on State Success
2) Enable Markets and Communities
3) Leverage Regional Collaboration
Per the Resilient Rhode Island statute, this Plan is intended to be used as a high-level reference for policymakers in
the Administration and the General Assembly. Therefore, the actions presented below are described in terms of a
broad framework to achieve the Resilient Rhode Island GHG reduction targets. Detailed aspects of program design
and implementation are not discussed here; such conversations are intended to be delegated to appropriate
working groups, agency initiatives, and stakeholder collaborations.
Furthermore, the EC4 notes that GHG mitigation planning is by nature an iterative exercise. No crystal ball can
predict the future; new technologies and solutions are expected to emerge in decades to come. The policies and
actions proposed below are based on our current knowledge, and as markets evolve and conditions change,
planners will adapt policy tools accordingly.
1) BUILD ON STATE SUCCESS
Rhode Island has already enacted a suite of effective policies to increase adoption of technologies and practices
that reduce GHG emissions. For example, Rhode Island’s nationally-recognized electric and natural gas energy
efficiency programs have been ranked as the top in the country.11 Although the existing policies have
demonstrated success, they are not sufficient on their own to drive Rhode Island to the Resilient Rhode Island
targets. They do, however, provide a robust foundation on which the State can build to promote further progress
toward the GHG goals. In practice, this means policymakers should support these programs and focus on filling
gaps where needed to address as-of-yet untapped emissions abatement in key sectors such as transportation, and
in the long-term, extending or expanding existing policies to reach the 2035 and 2050 targets. Below is a list of
major GHG mitigation options Rhode Island would need to pursue to achieve the Resilient Rhode Island GHG
targets, associated major existing state policies, and changes to policy that would likely be required to meet the
GHG targets (Table 4).
11 http://aceee.org/sites/default/files/pdf/state-sheet/2016/rhode-island.pdf
15
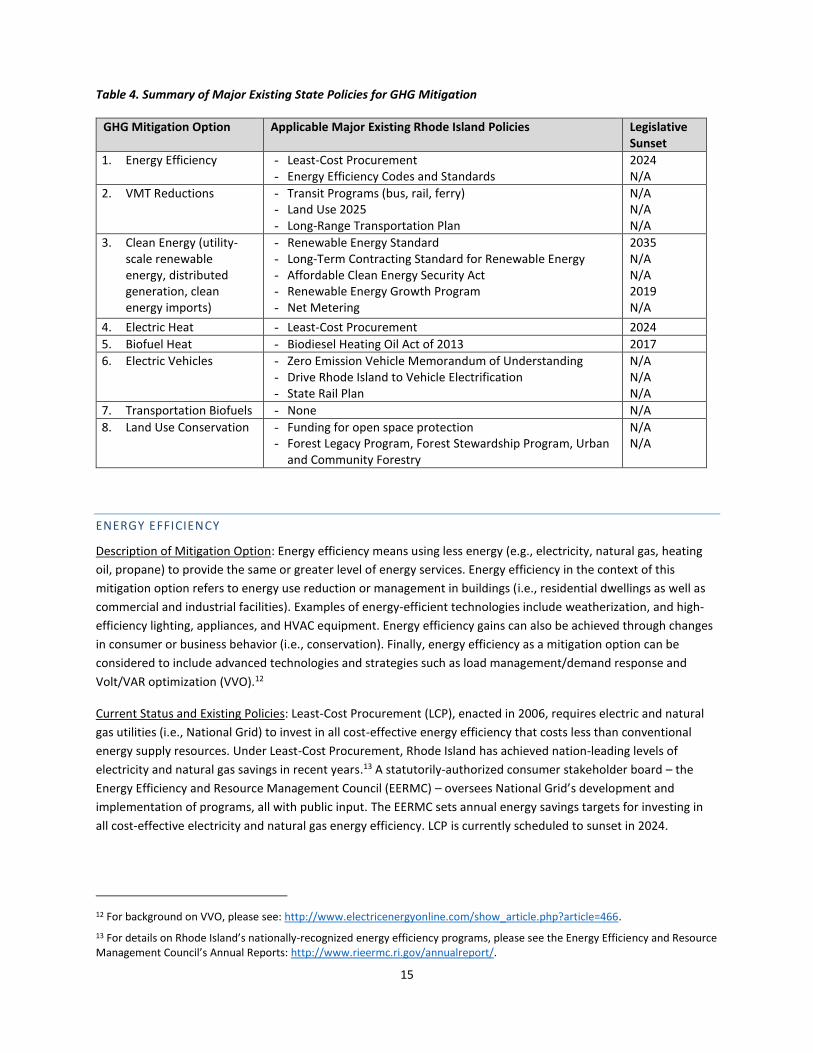
Table 4. Summary of Major Existing State Policies for GHG Mitigation
GHG Mitigation Option Applicable Major Existing Rhode Island Policies Legislative Sunset
1. Energy Efficiency - Least-Cost Procurement - Energy Efficiency Codes and Standards
2024 N/A
2. VMT Reductions - Transit Programs (bus, rail, ferry) - Land Use 2025 - Long-Range Transportation Plan
N/A N/A N/A
3. Clean Energy (utility-scale renewable energy, distributed generation, clean energy imports)
- Renewable Energy Standard - Long-Term Contracting Standard for Renewable Energy - Affordable Clean Energy Security Act - Renewable Energy Growth Program - Net Metering
2035 N/A N/A 2019 N/A
4. Electric Heat - Least-Cost Procurement 2024
5. Biofuel Heat - Biodiesel Heating Oil Act of 2013 2017
6. Electric Vehicles - Zero Emission Vehicle Memorandum of Understanding - Drive Rhode Island to Vehicle Electrification - State Rail Plan
N/A N/A N/A
7. Transportation Biofuels - None N/A
8. Land Use Conservation - Funding for open space protection - Forest Legacy Program, Forest Stewardship Program, Urban
and Community Forestry
N/A N/A
ENERGY EFFICIENCY
Description of Mitigation Option: Energy efficiency means using less energy (e.g., electricity, natural gas, heating
oil, propane) to provide the same or greater level of energy services. Energy efficiency in the context of this
mitigation option refers to energy use reduction or management in buildings (i.e., residential dwellings as well as
commercial and industrial facilities). Examples of energy-efficient technologies include weatherization, and high-
efficiency lighting, appliances, and HVAC equipment. Energy efficiency gains can also be achieved through changes
in consumer or business behavior (i.e., conservation). Finally, energy efficiency as a mitigation option can be
considered to include advanced technologies and strategies such as load management/demand response and
Volt/VAR optimization (VVO).12
Current Status and Existing Policies: Least-Cost Procurement (LCP), enacted in 2006, requires electric and natural
gas utilities (i.e., National Grid) to invest in all cost-effective energy efficiency that costs less than conventional
energy supply resources. Under Least-Cost Procurement, Rhode Island has achieved nation-leading levels of
electricity and natural gas savings in recent years.13 A statutorily-authorized consumer stakeholder board – the
Energy Efficiency and Resource Management Council (EERMC) – oversees National Grid’s development and
implementation of programs, all with public input. The EERMC sets annual energy savings targets for investing in
all cost-effective electricity and natural gas energy efficiency. LCP is currently scheduled to sunset in 2024.
12 For background on VVO, please see: http://www.electricenergyonline.com/show_article.php?article=466.
13 For details on Rhode Island’s nationally-recognized energy efficiency programs, please see the Energy Efficiency and Resource Management Council’s Annual Reports: http://www.rieermc.ri.gov/annualreport/.

16
Existing statutes in Rhode Island set minimum energy efficiency standards for appliances and buildings.14 As of
December 2016, Rhode Island had adopted the 2012 International Energy Conservation Code (IECC) with Rhode
Island-specific amendments for both residential and commercial buildings.15 A 2016 white paper commissioned by
National Grid recommended aspirational goals of establishing a Zero Energy Building (ZEB) residential and
commercial building energy code by 2035
(either mandatory or through voluntary stretch
codes), with 100% of new construction to be
ZEB after 2035, and 10% of existing buildings to
be retrofitted to ZEB by 2035.16 For appliance
standards, Rhode Island is allowed under
federal law to set standards for products not
covered by federal standards.
Mitigation Policy Considerations: Scenario
modeling results indicate that continued
investments in all cost-effective energy
efficiency represent an important component
to achieving the Resilient Rhode Island GHG
targets. To ensure maximized investment in
this least-cost resource, policymakers could
extend the LCP policy beyond 2024.
Additionally, policymakers could address a
critical gap in existing programs – limited
energy efficiency services for delivered fuels
(heating oil and propane) customers, a group
comprising over one-third of all heating
customers. A sustainable funding and/or
financing solution is needed for these users to
enjoy full and equal access to energy efficiency
programs.17
For appliance standards, policymakers could
continually screen additional technologies for
inclusion under the state appliance efficiency
standards. For building codes, policymakers
could ensure that Rhode Island stays current
with the latest IECC standards, at a minimum,
and could also formally adopt the
recommendations of the ZEB whitepaper.
Furthermore, policymakers could ensure that
14 For details on energy policy considerations relative to appliance standards and building codes, please see Energy 2035: Rhode Island State Energy Plan: http://www.energy.ri.gov/energyplan (Page 100).
15 The 2015 IECC with Rhode Island-specific amendments is currently being evaluated for adoption by the State.
16 https://www.nationalgridus.com/Trade/Rhode-Island-Zero-Energy-Building-Task-Force
17 For details on market and policy issues related to delivered fuels energy efficiency in Rhode Island, please see the Thermal Working Group Report: http://www.energy.ri.gov/efficiency/thermal/.
Rhode Island is a nationally-recognized leader in energy
efficiency and was ranked the fourth most energy efficient
state in the country in 2016. (The state has ranked in the
top ten for nine years in a row.) The State’s commitment
to energy efficiency not only saves customers money, but
also drives significant job growth—in 2015, 1,009
companies were involved with delivering energy efficiency
services, with 79% of those companies located in Rhode
Island. Since 2008, Rhode Island has invested $489 million
in energy efficiency and consumers have realized $2.67
billion in economic benefits; since 2006, our energy
efficiency programs will avoid seven million metric tons of
CO2.
The Town of North Providence celebrates participation in
National Grid's Rhode Island Energy Challenge. (Photo Credit:
National Grid)
SPOTLIGHT ON ENERGY EFFICIENCY
17
energy efficiency is made visible to the marketplace – through strategies such as building and appliance labeling,
and energy education – so energy costs become a common variable in all customers’ decision-making processes.
VMT REDUCTIONS
Description of Mitigation Option: Reducing VMT is the transportation equivalent of energy conservation. Potential
strategies to reduce VMT include: (1) decreasing the absolute number of single-occupancy vehicle trips by
promoting and investing in alternative modes of transportation (e.g., rail, bus, ridesharing, biking, walking), and (2)
reducing the absolute length of single-occupancy vehicle trips by encouraging higher-density patterns of
development or changes in behavior.
Current Status and Existing Policies: The Rhode Island Division of Planning currently maintains the State Guide Plan
(SGP), which directs the long-term growth and development of the state. A component of the SGP, Land Use 2025,
guides land use decisions and directs growth and development to areas within the Urban Services Boundary.
Transportation 2035, another component of the State Guide Plan, guides investment of federal transportation
dollars at the local level. Strategies in this plan include reducing VMT through use of alternative travel modes, ride-
sharing, and integration of bicycle and pedestrian facilities. The plan includes targets to reduce single occupancy
vehicle commuting and increase transit mode share of work trips from 2.5% in 2000 to 2.8% in 2010, 3.0% in 2020
and 3.2% in 2030. Existing transit programs administered through RIPTA (bus), the MBTA (commuter rail), and
RIDOT (ferry) encourage transit ridership. Finally, Rhode Island General Laws §36-6-21.1 establishes the State
Employee Transportation Guide Plan and sets VMT reduction goals for State employees.
Mitigation Policy Considerations: Scenario modeling results indicate that a ~10% reduction in passenger vehicle
and truck VMT by 2050 relative to 2014 would contribute to meeting the Resilient Rhode Island GHG targets. Use
of public transit in Rhode Island today falls below the national average rate of 5.9% transit mode share. A 10%
reduction in VMT would bring Rhode Island above the national average by 2050. The State will update its Long
Range Transportation Plan starting in 2017 and should consider setting more aggressive mode share targets than
in the current plan to aid in reducing GHG emissions through VMT reductions. Integrated land use and
transportation decisions to bolster the effectiveness of transportation policy and investments (e.g., development
or redevelopment of transit stations) as identified through the Long Range Transportation Plan could be
considered. Investing in alternatives to solo driving, such as public transit, biking, walking and carpooling, and using
pricing incentives to manage traffic and parking are also potential policy solutions for VMT reduction. Finally,
implementation of VMT reduction strategies will result in a decline in Rhode Island gas tax revenues; the
replacement of these lost revenues for transportation infrastructure improvements needs to be an important
policy consideration for decision makers to address in coming years.
CLEAN ENERGY
Description of Mitigation Option: No-to-low carbon electricity sources (such as wind, solar, and hydropower) offer
GHG reductions in the electricity sector by displacing higher-emitting generating resources reliant on fossil fuels,
including coal, oil, and less efficient natural gas plants. Because Rhode Island is part of a larger integrated regional
power grid, electricity flows across state borders, and power generated in one state may be consumed in another.
Rhode Island is using a consumption-based accounting method for electric sector power emissions, which means

18
that this mitigation option is defined by the regional
adoption of clean energy, not just deployment within
state borders.18
Current Status and Existing Policies: Rhode Island has a
number of existing policies in place to promote the use
of renewable and clean energy:
The Renewable Energy Standard (RES) requires
electricity providers to supply an increasing
percentage of their retail electric sales from
renewable resources. Rhode Island’s RES is
currently set at 38.5% by 2035.
The Long-Term Contracting Standard for
Renewable Energy (LTC) requires National Grid
to solicit proposals from renewable energy
developers and enter into long-term contracts
with terms of up to 15 years. The LTC provides
for 90 megawatts (MW) of contracts and for
up to 150 MW of a utility-scale offshore wind
farm.
The Affordable Clean Energy Security Act
(ACES) authorizes National Grid to participate
in multi-state or regional efforts to procure
large hydropower and/or renewable energy
resources.
The Renewable Energy Growth Program (REG)
requires National Grid to enroll a total of 200
MW19 of local renewable energy projects by
2019.
Net Metering requires National Grid to credit
power supplied by renewable energy projects
onto the grid. Net metered projects must be
located on-site, with certain exceptions for
public sector projects, farms, affordable
housing, and residential projects.
Mitigation Policy Considerations: Scenario modeling
results indicate that achieving the Resilient Rhode
Island GHG targets could likely require a ~99% clean
regional grid by 2050. Due to Rhode Island’s
consumption-based accounting for electric power
emissions, achieving GHG reductions in this sector
18 See Footnote 2. In other words, the calculation of GHG reductions from the electricity sector is: (Rhode Island electric consumption) * (GHG emissions factor of the New England-wide power grid).
19 Includes 40 MW from the Distributed Generation Standard Contracts Program (2011-2014).
The five-turbine, 30 megawatt Block Island Wind
Farm became the first offshore wind farm in the
U.S. this year. The wind farm became a national
model for successful coordination between state
and federal agencies, including the development
and implementation of the Ocean Special Area
Management Plan (SAMP). The Ocean SAMP was
completed by the University of Rhode Island and
Coastal Resources Management Council, and
evaluates siting for offshore wind in both state
and federal waters. Additionally, more than 300
local workers were involved in building the wind
farm, and four Rhode Island ports were used to
complete construction and staging of the
turbines. The project became commercially
operational in December 2016. The island’s
decades-old diesel generators were recently shut
down with the offshore wind project now
producing and delivering power to the island and
mainland. The Block Island Wind Farm will be
operational for the next 20 years and will help
Rhode Island meet its renewable energy goals,
which include a 38.5% Renewable Energy
Standard by 2035.
Construction on the Block Island Wind Farm finished this
year. (Photo Credit: Deepwater Wind)
SPOTLIGHT ON OFFSHORE WIND

19
requires action outside of the State’s direct control (i.e., deployment of clean energy throughout the New England
grid). Rhode Island can, however, work over the long-term to align in-state renewable energy policy and
deployment targets to be consistent with the broader goal of a 99% clean regional grid by 2050. As part of this
consideration, policymakers would need to weigh the comparative costs and benefits of different pathways (e.g.,
local versus regional renewables, the role of different technologies, and the need for incremental distribution or
transmission investments).
ELECTRIC HEAT
Description of Mitigation Option: High-efficient electric cold climate heating systems (i.e., air source heat pumps
(ductless mini-split or central systems) or ground-source heat pumps) offer GHG reductions in the thermal sector
by displacing emissions from fossil fuel heating systems (i.e., natural gas furnaces and oil boilers). Electric heat
pump systems produce a GHG reduction benefit due to the inherent efficiency of the heating technology as well as
the relatively cleaner emissions profile of New England’s power grid supply compared to that of natural gas or oil
heating systems. This GHG reduction benefit increases over time as the electricity supply shifts toward a more
decarbonized resource mix.
Current Status and Existing Policies: Recent years have seen rapidly growing market adoption of electric heat pump
systems, which are valued by customers for their highly efficient cooling and – increasingly – heating features.
Under Least-Cost Procurement, energy efficiency programs have incentivized the installation of higher-efficient
heat pumps systems, especially those that can heat at cold winter temperatures, where they are replacing older,
inefficient heat pumps or electric resistance systems.
Mitigation Policy Considerations: Scenario modeling results indicate that achieving the Resilient Rhode Island GHG
targets could likely require electrification of ~70-80% of residential and commercial heating.20 At present, Least-
Cost Procurement energy efficiency programs do not incentivize heat pumps in situations where they would
replace a fossil fuel heating system. Although this would result in a decrease of fossil fuel usage and therefore
could result in net carbon reductions, it would also result in an increase in electric usage, which runs contrary to
the current structure of energy efficiency programs. Further policy guidance is needed to allow electrification of
heating to fully qualify as an activity under the State’s energy efficiency program or another energy program.21
BIOFUEL HEAT
Description of Mitigation Option: Biofuels are liquid fuels derived from renewable organic substances (e.g.,
recycled cooking grease, plant residues, animal fats, and other renewable feedstocks). Biofuel can offer GHG
reductions in the thermal sector by displacing lifecycle emissions22 from fossil fuel heating systems using heating
oil.
Current Status and Existing Policies: The 2013 Biodiesel Heating Oil Act established a 5% bioblend requirement for
all heating oil sold in the state by July 1, 2017.
20 Implemented concurrently with aggressive decarbonization of the power grid.
21 For details on policy issues related to electrification of heating, please see the Systems Integration Rhode Island (SIRI) Vision Document: http://www.energy.ri.gov/siri (Page 54).
22 EPA requires that biomass-based biodiesel eligible under the federal Renewable Fuel Standard must achieve a 50% reduction in lifecycle GHG emissions: https://www.epa.gov/renewable-fuel-standard-program/proposed-renewable-fuel-standards-2017-and-biomass-based-diesel.

20
Mitigation Policy Considerations: Rhode Island’s ability to replace existing heating fuels with biofuels will be
constrained by supply, which will be largely determined by federal policies and regional and national market
conditions. In Rhode Island, available biodiesel supplies could be used in the heating sector (i.e., to displace #2
home heating oil), the transportation sector (i.e., to displace transportation diesel fuel), or both. In the heating
sector, Rhode Island could increase the existing statewide bioblend standard in a manner consistent with
mitigating any potential equipment performance issues associated with higher biodiesel content.
ELECTRIC VEHICLES
Description of Mitigation Option: Battery electric or plug-in hybrid electric vehicles offer GHG reductions in the
transportation sector by displacing emissions from conventional gasoline- and diesel-powered vehicles. Electric
vehicles produce a GHG reduction benefit due to the inherent efficiency of the motor and drivetrain as well as the
relatively cleaner emissions profile of New England’s power grid supply compared to that of traditional
transportation fuels (i.e., gasoline and diesel). This GHG reduction benefit increases over time as the electricity
supply shifts toward higher clean energy penetration.
Current Status and Existing Policies: Rhode Island is a signatory to the multi-state Zero Emission Vehicle
Memorandum of Understanding (ZEV MOU), with a goal of deploying 43,000 ZEVs on Rhode Island roadways by
2025. To advance progress toward this goal, Rhode Island has invested in a statewide network of publicly-
accessible electric vehicle charging stations, initiated an electric vehicle rebate incentive program (Driving Rhode
Island to Vehicle Electrification, or DRIVE), and established a ZEV Working Group.23 The Rhode Island State Rail Plan
contains goals, objectives, policies, and implementation actions for Rhode Island’s passenger and freight rail
transportation system.24 RIPTA provides 9.6 million miles of fixed route bus service annually, with a fleet
comprised of 27% hybrid-electric vehicles.
Mitigation Policy Considerations: Scenario modeling results indicate that achieving the Resilient Rhode Island GHG
targets could likely require ~75% of on-road VMT to be served by electric vehicles by 2050, along with ~97% of rail
transport.25 As of December 31, 2015, there were 538 electric vehicles registered in Rhode Island, out of a total of
approximately 670,000 light duty vehicles in the state. Further initiatives to incentivize the adoption of electric
vehicles and charging infrastructure would be needed to achieve the aggressive market penetration levels
necessary to meet long-term GHG reduction targets. Future planning for the state’s passenger and freight rail
transportation system could also evaluate electrification as a strategy aligned with long-term GHG reduction
targets. RIPTA could be encouraged to reflect the Resilient Rhode Island GHG reduction goals in its fleet planning
efforts and transition to a zero-emissions fleet by 2050. Finally, increased adoption of electric vehicles will result in
a decline in Rhode Island gas tax revenues; the replacement of these lost revenues for transportation
infrastructure improvements needs to be an important policy consideration for decision makers to address in the
coming years.
23 For more details on ZEV policies and programs in Rhode Island, please see the Rhode Island ZEV Action Plan: http://www.energy.ri.gov/Transportation/drive/index.php.
24 For more details on the Rhode Island State Rail Plan, please see: http://www.planning.ri.gov/documents/trans/Rail_Plan_12_18_13.pdf.
25 Implemented concurrently with aggressive decarbonization of the power grid.

21
TRANSPORTATION BIOFUELS
Description of Mitigation Option: Biofuels are liquid fuels derived from renewable organic substances (e.g.,
recycled cooking grease, plant residues, animal fats, and other renewable feedstocks). Biofuel can offer GHG
reductions in the transportation sector by displacing lifecycle emissions26 from motor vehicles using conventional
petroleum fuels (i.e., biodiesel can displace diesel fuel and cellulosic ethanol can displace corn ethanol and
petroleum-based gasoline).
Current Status and Existing Policies: There are no current policies in Rhode Island promoting the use of
transportation biofuels.
Mitigation Policy Considerations: As mentioned above, Rhode Island’s ability to replace existing heating fuels with
biofuels will likely be constrained by supply, which will be largely determined by federal policies and regional and
national market conditions. In Rhode Island, available biodiesel supplies could be used in the heating sector (i.e., to
displace #2 home heating oil), the transportation sector (i.e., to displace transportation diesel fuel), or both. In the
transportation sector, Rhode Island could explore the feasibility of establishing a statewide bioblend standard
similar to the requirement that exists for #2 home heating oil.
LAND USE CONSERVATION
Description of Mitigation Option: Land use conservation strategies preserve natural systems and environments
that provide carbon dioxide “sinks,” helping to reduce the state’s net GHG footprint. Strategies include protecting
existing forest acreage, reforestation, conservation of riparian buffers, enhanced forest management programs (on
both private and public lands), reductions in soil erosion to minimize losses in soil carbon storage, coastal wetland
protection (e.g., blue carbon), and enhanced urban tree canopies.
Current Status and Existing Policies: Approximately 22% of Rhode Island is in permanent conservation status, and
55% of Rhode Island is forested; however, our forest resource is being lost and fragmented by a wide variety of
development pressures. Existing programs like the Forest Legacy Program, the Forest Stewardship Program, and
Urban and Community Forestry help reduce those pressures and allow forest land to be preserved and utilized as a
carbon sink. Continued public support for funding open space protection continues to be a critical component of
the State’s land protection efforts.27 Additionally, the State can minimize loss of existing forest acreage by
prioritizing investments to support new growth within the existing Urban Services Boundary (as delineated in Land
Use 2025) and in State-approved growth centers.
The Rhode Island Coastal Resources Management Council (CRMC) and its partners have developed Sea Level
Affecting Marshes Model (SLAMM) maps for the coastal wetlands in all 21 Rhode Island coastal communities. The
SLAMM maps demonstrate how coastal wetlands – which serve as important carbon sinks – will be impacted by
different sea level rise scenarios.28 State and local community planning efforts are beginning to incorporate
SLAMM maps into decision making processes about coastal wetland conservation and migration. Ensuring the
survival of Rhode Island’s wetlands is an important component of GHG and resiliency/adaptation priorities.
26 See Footnote 21.
27 Rhode Island voters approved the 2012 Environmental Management Bond, the 2014 Clean Water, Open Space and Healthy Communities Bond, and the 2016 Green Economy Bond by 69.8%, 71.2%, and 67.6%, respectively.
28 For more details on SLAMM and projected salt marsh losses, see the SLAMM project summary report: http://www.crmc.ri.gov/maps/maps_slamm.html.
22
Mitigation Policy Considerations: Scenario modeling results indicate that achieving the Resilient Rhode Island GHG
targets could likely require no net future loss of forest or cropland. Policymakers could aim to align future local and
state conservation policies with this broader goal, and adoption of a “no net-loss of forests” policy, which other
states in the region have endorsed, could be explored.
OTHER MITIGATION OPTIONS
The above list comprises the most significant mitigation options available to Rhode Island to address major GHG
source sectors based on currently available technology. Other strategies may likely be required to meet the
Resilient Rhode Island GHG targets, including, but not limited to:
Natural Gas Leaks: Continuation of National Grid’s gas infrastructure repair and replacement program to
address fugitive methane leaks in the state’s gas distribution system.29
Energy Storage: Pursuit of policies to promote energy storage, which can provide many types of system
benefits, including integrating clean energy resources in a more cost-effective manner.
Solid Waste: Strategies to reduce methane emissions from the Central Landfill.
2) ENABLE MARKETS AND COMMUNITIES
In addition to the technology-specific incentive programs and mandates considered above, a series of
complementary focus areas to address key barriers to technology deployment would help spur progress toward
achieving the Resilient Rhode Island GHG targets. Establishing strong markets for clean energy requires a trained
workforce, robust consumer demand, a more dynamic and flexible utility regulatory model, and public sector
leadership. Rhode Island policymakers should prioritize the following actions to ensure that the state facilitates as
well as reaps the benefits of a smooth and efficient transition to a low-carbon economy.
GROW CLEAN ECONOMY JOBS
The transition to a clean energy economy offers significant opportunities for economic development and job
creation in Rhode Island.30 The vast majority of current expenditure on fossil fuels exits our state because no
natural gas or petroleum is produced or refined in the region. With a shift to a greater use of local and regional
clean energy resources, however, Rhode Island can keep more energy dollars and jobs in-state. State policymakers
should continue to place a priority on fostering nascent local clean energy industries, supporting innovation in
clean energy, providing workforce training, and assisting incumbent fossil fuel industries (e.g., the delivered fuels
industry) and disadvantaged communities with resources to excel in the burgeoning clean energy marketplace.
EMPOWER CITIZENS AND COMMUNITIES
Many of the GHG mitigation options necessary to meet the Resilient Rhode Island GHG targets rely on individual
purchase decisions by consumers and communities to adopt new technologies (e.g., heating systems, personal
vehicles). The State must continue to work with industry, local governments, and NGOs to build on progress to
date to remove barriers to adoption including, but not limited to: low customer awareness and confidence in
previously unfamiliar products; access to and availability of financing solutions; soft costs related to permitting and
regulatory hurdles; technical assistance for municipalities to implement solutions. Such efforts can bolster the
29 For details on addressing natural gas leaks, please see Energy 2035: Rhode Island State Energy Plan: http://www.energy.ri.gov/energyplan (Page 135).
30 For details on Rhode Island’s growing clean energy economy, please see: http://www.energy.ri.gov/cleanjobs/.

23
market for clean energy services and stimulate consumer demand. Policymakers should give particular attention to
engaging with low-income and vulnerable communities to ensure that all citizens have opportunities to participate
in and benefit from the new clean energy economy. In the long-term, by educating and empowering citizens and
communities to take energy decisions into their own hands, Rhode Island could help spur a grassroots trend
toward meeting the Resilient Rhode Island GHG targets.
FOSTER A MORE DYNAMIC UTILITY REGULATORY MODEL
Achieving the levels of GHG reduction targeted through the Resilient Rhode Island Act would necessitate much
higher levels of renewable energy, as well as substantial electrification of the heating and transportation sectors.
These trends hold significant implications for the way utilities plan, operate, and invest in the electric grid.31 State
policymakers and utility regulators will continue initial efforts already underway to consider thoughtful changes to
utility planning, business models, performance
incentives, and rate design in order to enable a
transition to the future grid that values, integrates,
and plans for growth in clean energy and carbon-free
resources, while maintaining a safe and reliable
electric system.
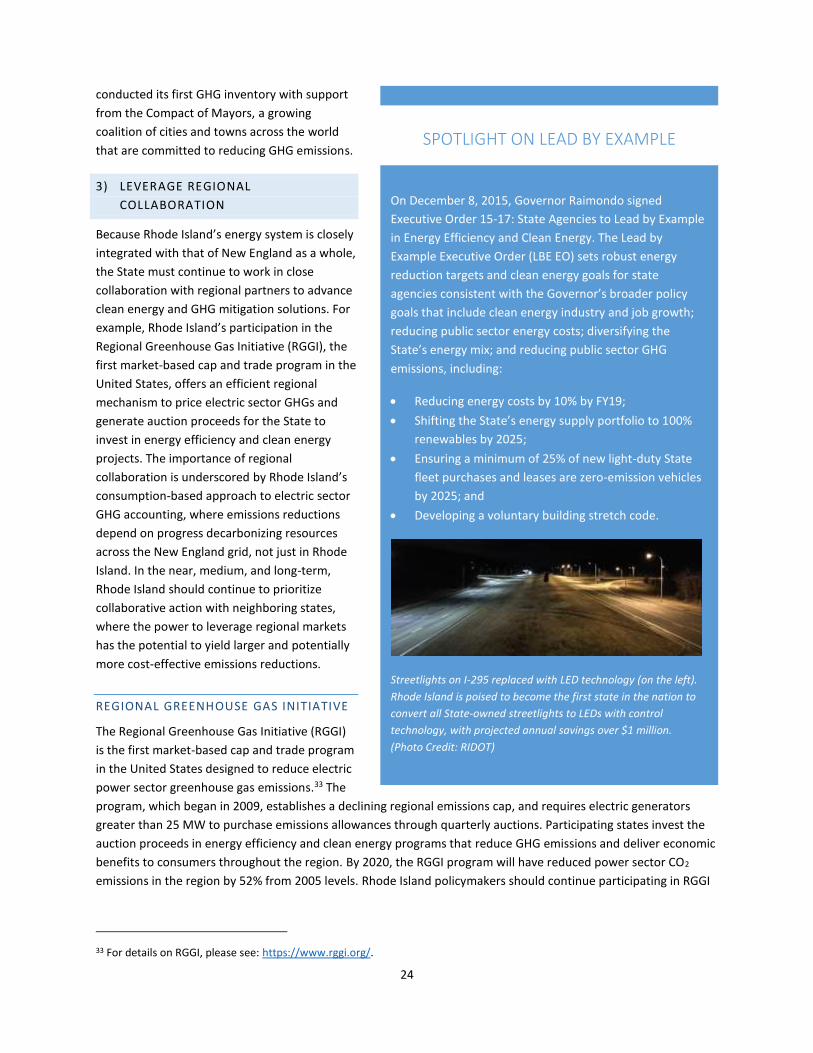
LEAD BY EXAMPLE
Under Executive Order 15-17, Governor Raimondo
ordered state agencies to Lead by Example in energy
efficiency and clean energy by setting the following
goals: reducing energy costs by 10% by FY19; shifting
the State’s energy supply portfolio to 100%
renewables by 2025; ensuring a minimum of 25% of
new light-duty State fleet purchases and leases are
zero-emission vehicles by 2025; and developing a
voluntary building stretch code.32 Over the medium-
and long-term, State policymakers could consider
building on this commitment by state government to
serve as an early adopter to demonstrate the benefits
of GHG mitigation and clean energy solutions. At the
local level, cities and towns can play an important role
in achieving state GHG targets by integrating
mitigation into community planning efforts, setting
their own reduction goals, investing in clean energy
projects, and directly engaging with diverse
community voices. For example, Mayor Jorge Elorza
recently committed the City of Providence to
becoming a carbon neutral city by 2050 and
31 For details on policy issues related to the future utility system, please see the Systems Integration Rhode Island (SIRI) Vision Document: http://www.energy.ri.gov/siri.
32 For details on the Lead by Example initiative, please see: http://www.energy.ri.gov/leadbyexample/.
Rhode Island’s clean energy economy is becoming
a powerful engine for job creation and business
development. Strong State support for energy
efficiency and renewable energy policies have
stimulated a robust market for clean energy goods
and services, making Rhode Island home to a new,
growing clean energy industry. Rhode Island's 2016
Clean Energy Jobs Report found that employment
in Rhode Island’s clean economy increased by a
staggering 40% over 2015, far exceeding the
projected growth of 17%. Clean energy jobs now
support about 14,000 workers across the state,
representing 3% of statewide employment.
Clean energy jobs grew 40% in Rhode Island over 2015.
(Source: 2016 Clean Energy Jobs Report)
SPOTLIGHT ON CLEAN ENERGY JOBS
24
conducted its first GHG inventory with support
from the Compact of Mayors, a growing
coalition of cities and towns across the world
that are committed to reducing GHG emissions.
3) LEVERAGE REGIONAL
COLLABORATION
Because Rhode Island’s energy system is closely
integrated with that of New England as a whole,
the State must continue to work in close
collaboration with regional partners to advance
clean energy and GHG mitigation solutions. For
example, Rhode Island’s participation in the
Regional Greenhouse Gas Initiative (RGGI), the
first market-based cap and trade program in the
United States, offers an efficient regional
mechanism to price electric sector GHGs and
generate auction proceeds for the State to
invest in energy efficiency and clean energy
projects. The importance of regional
collaboration is underscored by Rhode Island’s
consumption-based approach to electric sector
GHG accounting, where emissions reductions
depend on progress decarbonizing resources
across the New England grid, not just in Rhode
Island. In the near, medium, and long-term,
Rhode Island should continue to prioritize
collaborative action with neighboring states,
where the power to leverage regional markets
has the potential to yield larger and potentially
more cost-effective emissions reductions.
REGIONAL GREENHOUSE GAS INITIATIVE
The Regional Greenhouse Gas Initiative (RGGI)
is the first market-based cap and trade program
in the United States designed to reduce electric
power sector greenhouse gas emissions.33 The
program, which began in 2009, establishes a declining regional emissions cap, and requires electric generators
greater than 25 MW to purchase emissions allowances through quarterly auctions. Participating states invest the
auction proceeds in energy efficiency and clean energy programs that reduce GHG emissions and deliver economic
benefits to consumers throughout the region. By 2020, the RGGI program will have reduced power sector CO2
emissions in the region by 52% from 2005 levels. Rhode Island policymakers should continue participating in RGGI
33 For details on RGGI, please see: https://www.rggi.org/.
On December 8, 2015, Governor Raimondo signed
Executive Order 15-17: State Agencies to Lead by Example
in Energy Efficiency and Clean Energy. The Lead by
Example Executive Order (LBE EO) sets robust energy
reduction targets and clean energy goals for state
agencies consistent with the Governor’s broader policy
goals that include clean energy industry and job growth;
reducing public sector energy costs; diversifying the
State’s energy mix; and reducing public sector GHG
emissions, including:
Reducing energy costs by 10% by FY19;
Shifting the State’s energy supply portfolio to 100%
renewables by 2025;
Ensuring a minimum of 25% of new light-duty State
fleet purchases and leases are zero-emission vehicles
by 2025; and
Developing a voluntary building stretch code.
Streetlights on I-295 replaced with LED technology (on the left).
Rhode Island is poised to become the first state in the nation to
convert all State-owned streetlights to LEDs with control
technology, with projected annual savings over $1 million.
(Photo Credit: RIDOT)
SPOTLIGHT ON LEAD BY EXAMPLE

25
and advocate for long-term reductions in the regional cap consistent with achieving the Resilient Rhode Island
GHG targets.
TRANSPORTATION AND CLIMATE INITIATIVE
The Transportation and Climate Initiative (TCI) is a regional collaboration of 11 Northeast and Mid-Atlantic
states and the District of Columbia that seeks to develop the clean energy economy and reduce oil dependence
and GHG emissions from the transportation sector.34 Recognizing that nearly one-third of all GHG emissions come
from the transportation sector, participating states have started taking action in four core areas: clean vehicles and
fuels, sustainable communities, freight efficiency, and information and communication technologies. Rhode Island
policymakers should continue to seek regional solutions for addressing transportation GHG emissions consistent
with the Resilient Rhode Island GHG targets through TCI.
NEW ENGLAND GOVERNORS/EASTERN CANADIAN
PREMIERS
In accordance with Resolution 39-1 (A Resolution
Concerning Climate Change) adopted by the New England
Governors and Eastern Canadian Premiers (NEG/ECP) in
August 2015, the Governors and Premiers are currently
conducting an inclusive, collaborative process among the
NEG/ECP jurisdictions, to be completed by August 2017.35
The goal is to identify environmental, transportation, and
energy strategies, policies, and measures whose
implementation at the regional level will make possible
the economy-wide GHG reductions needed for the
NEG/ECP region to achieve the 2030 GHG emissions
reduction marker range of 35 to 45% below 1990 levels as
well as the 2050 target (75 to 85% below 2001 levels). This
work will result in a Regional Climate Change Action Plan
to be presented to the NEG/ECP in August of 2017.
OTHER REGIONAL WORK
Additional areas of opportunity exist to muster scale and
unite adjacent markets through coordinated regional
action. Such potential areas include clean energy
procurement and carbon pricing. For example, Rhode
Island recently worked in collaboration with National Grid,
Connecticut and Massachusetts state agencies, and other
regional utilities to develop a Request for Proposals that
could identify clean energy and/or clean energy
transmission projects that offer the potential for the
34 For details on TCI, please see: http://www.transportationandclimate.org/.
35 For details on NEG/ECP, please see: http://www.coneg.org/negecp. Resolution 39-1 is accessible at: http://coneg.org/Data/Sites/1/media/39-1-climate-change.pdf.
The Regional Greenhouse Gas Initiative (RGGI),
the nation’s first market-based cap and trade
program to reduce electric-sector carbon
dioxide emissions, is demonstrating concrete
results. An independent report by the Analysis
Group found that in its first three years, RGGI
generated macroeconomic benefits to the
regional economy, including the creation of
over 16,000 jobs and $1.6 billion in total
economic growth.a Between 2008 and 2014,
the program avoided 1.7 million tons of CO2
(the equivalent of taking 319,000 cars off the
road), while generating $618.1 million in
energy bill savings for customers across the
region.b By 2020, the RGGI program will have
reduced power sector CO2 emissions in the
nine participating states by 52% from 2005
levels.
ahttp://www.analysisgroup.com/uploadedfiles/content/insi
ghts/publishing/economic_impact_rggi_fact_sheet.pdf
bhttps://www.rggi.org/docs/ProceedsReport/RGGI_Procee
ds_Report_2014.pdf
SPOTLIGHT ON RGGI

26
procuring states to meet their shared clean energy goals in a cost-effective manner consistent with individual,
state-specific procurement statutes.36 Carbon pricing is another strategy that might be considered by policymakers
for application on a coordinated, regional – or national – basis. Carbon pricing is aimed at accounting for the
broader environmental and societal impacts of GHG pollution (i.e., externalities), and is currently being explored
by a broad stakeholder group in Rhode Island and other jurisdictions in the region.
MONITORING PROGRESS
The Resilient Rhode Island Act requires the EC4 to recommend “procedures and metrics for periodic
measurement, not less frequently than once every five (5) years, of progress necessary to meet [GHG reduction]
targets and for evaluating the possibility of meeting higher targets through cost-effective measures.” Per the
statute, the EC4 provides the following recommendation for state agencies to monitor progress toward the
Resilient Rhode Island targets on an ongoing basis:
1. Monitor progress using a triennial schedule of GHG reductions based on the Resilient Rhode Island GHG
targets.
Table 5 provides triennial targets for GHG emissions, derived by
interpolating between the 2020, 2035, and 2050 reduction targets.
2. DEM will develop a triennial GHG emissions inventory for Rhode Island
and report on progress towards meeting Resilient Rhode Island GHG
targets.
DEM will develop a triennial GHG emissions inventory, consistent with the
methodology used in this Plan.37 The GHG emissions inventory will be
compared on a triennial basis to the emissions reduction schedule
presented here, with a triennial report of the results presented to the EC4
and posted on the DEM website.
3. DEM will evaluate the possibility of meeting higher targets through cost-
effective measures in the triennial report.
In the triennial report assessing progress toward the Resilient Rhode
Island GHG targets, DEM will evaluate the possibility of meeting higher
targets through cost-effective measures after consulting with the EC4.
36 For details on the Multi-State Clean Energy RFP, please see: https://cleanenergyrfp.com/.
37 See Appendix 1 for details on GHG inventory methodology.
Table 5. Resilient Rhode
Island Act GHG Emissions
Reduction Schedule
YearMillion Metric
Tons CO2e*
2017 11.29
2020 11.23
2023 10.36
2026 9.48
2029 8.61
2032 7.73
2035 6.86
2038 5.99
2041 5.12
2044 4.24
2047 3.37
2050 2.50
*2015 GHG emissions are
estimated at 11.33
million metric tons CO2e

27
THE PATH FORWARD
The EC4 is energized to move forward from planning to action. Confronting and mitigating the effects of climate
change is critical to ensuring a healthy future for Rhode Island, and will require coordinated action on multiple
fronts. As this Plan demonstrates, the magnitude of our task is daunting, but the opportunities to our state are
clear. Responding to this challenge demands our focused attention and is achievable with sustained leadership,
strategic investment, and smart policies. In the near-term, we can spur progress toward our goals by leveraging a
suite of successful existing policy tools; mobilizing the innovation and participation of businesses, utilities,
communities, and citizens; and partnering with our neighboring states to advance key policy priorities. Over the
long-term, new, enhanced technologies and market shifts are anticipated to open additional paths forward to the
goals. As stated, EC4 believes this is the beginning – not the end – of a critical ongoing conversation in which
Rhode Island decision-makers and stakeholders will continue to engage during the coming months, years, and
decades.
The EC4 envisions initiating a discussion in 2017 around near-term opportunities for leadership in GHG mitigation
consistent with the framework established in this Plan. These may include opportunities for immediate state and
local action, areas requiring further study, or strategies requiring regional cooperation. They also may include
identification of existing regulations, policies, or other obstacles that pose barriers to implementing GHG
mitigation solutions and reaching goals. The following implementation actions and focus areas represent a
launching point for this conversation, which EC4 intends to vet and improve through stakeholder input and
feedback:
Support further evaluation of the costs and benefits of GHG mitigation pathways, including
macroeconomic, environmental, and health impact analyses.
Develop a state-of-the-art 2018-2020 Three-Year Energy Efficiency Procurement Plan, with special focus
on expanded access to delivered fuels (oil and propane) heating customers, opportunities to drive toward
new demand response strategies, and expanded financing mechanisms to leverage capital toward the
achievement of robust savings goals.
Initiate an effort to escalate clean energy adoption in Rhode Island, elevating our state’s position as an
emerging leader in renewable energy and building off of recent momentum from the nation’s first
offshore wind farm.
Explore state and regional mechanisms for promoting clean transportation solutions consistent with
addressing the state’s largest GHG source sector.
Craft a framework for addressing utility, rate, and regulatory modernization to position Rhode Island on
the cutting-edge of power sector transformation activities and demonstrate our state as a proof-of-
concept testbed for integrating clean energy, empowering customers, and improving the resiliency of our
electric grid.
Pursue regional approaches where they promise to enhance progress toward GHG goals, either through
existing collaborations such as RGGI or through newly emerging ones.
The EC4 looks forward to the opportunity to collaborate with the Governor and General Assembly and advance
these priorities as a part of a “no-regrets” strategy to drive Rhode Island toward our GHG reduction goals. Our
current path supports green jobs and a healthier Rhode Island; more work is needed to realize our long-term goals.
As time progresses and new opportunities and technologies emerge, the EC4 stands ready to work with
stakeholders and policymakers to continually adapt our state’s GHG mitigation strategy to achieve Rhode Island
GHG reduction targets at maximum benefit to our communities and citizens.

28
APPENDIX 1 – REFERENCE CASE ASSUMPTIONS AND RESULTS

Rhode Island Greenhouse Gas (GHG) Emissions Reduction Study
Developing the Reference Case in the Long-range Energy Alternatives Planning (LEAP)
Framework
December 30, 2016
This memorandum describes how the reference case scenario is developed for the Rhode Island
GHG Emissions Reduction Study. The reference case incorporates historical and projected
energy supply and demand data as well as data on non-energy GHG emissions to create a
baseline against which GHG mitigation scenarios can be evaluated. The reference case modeling
is implemented using the Long-range Energy Alternatives Planning system, or LEAP (Heaps
2016), which is developed by the Stockholm Environment Institute. LEAP is a flexible, widely-
used integrated modeling tool that can track energy consumption, production and resource
extraction in all sectors of an economy and account for the dependencies between energy
demand and supply.
1 Final Energy Demand
1.1 Historical Energy Consumption
Historical energy consumption for all fuels consumed in Rhode Island’s residential, commercial,
industrial, and transportation sectors is taken from the U.S. Energy Information Administration’s
(EIA’s) State Energy Data System (SEDS) (U.S. Energy Information Administration 2015c).
Covering the period 2000 – 2013, these data present a “top-down” view of energy consumption
for each fuel with no technological detail. They are used for calibration purposes and to establish
historical energy intensities for comparison with projected intensities, as necessary.
1.2 Projected Energy Consumption
Projections of energy consumption for all fuels in the residential, commercial and industrial
sectors are based on EIA’s Annual Energy Outlook (AEO) 2015 “Reference Case” and
incorporate the technological and subsectoral detail1 provided in the National Energy System
Model (or NEMS, which underlies the AEO) (U.S. Energy Information Administration 2015g).
NEMS provides a highly detailed technology-based (“bottom-up”) characterization of energy
service requirements, together with a description of the technologies which are used to satisfy
these service demands. The AEO Reference Case prescribes a “business-as-usual trend estimate,
given known technology and technological and demographic trends” (ibid) through the year
2040.
The primary drivers of Rhode Island’s energy use trends are Rhode Island’s Least-Cost
Procurement mandate for electricity and natural gas, continued dependence on natural gas (and
fuel-switching to natural gas), federal motor vehicle fuel economy standards, renewable energy
1 There are many technologies satisfying many end-uses in a variety of subsectors. Examples of (heating, for
example) technologies include natural gas furnaces, oil boilers, etc. Examples of (industrial, for example) subsectors
include cement and lime, metal fabrication, etc.

30
policy mandates, and participation in the Regional Greenhouse Gas Initiative (RGGI) (Rhode
Island Division of Planning 2015a). In the electric generation sector, energy reductions reflect
investments from Rhode Island’s Least-Cost Procurement mandate in electric energy efficiency,
while overall supply continues to remain heavily reliant on natural gas. Increased renewable
generation, including offshore wind, continue to provide only a relatively small portion of the
generation supply. Participation in RGGI provides funding for increased energy efficiency and
renewable energy resources. In the thermal sector, natural gas efficiency investments from the
Least-Cost Procurement mandate help reduce future projected energy demand for heating in
homes and buildings. For the transportation sector, federal Corporate Average Fuel Economy
(CAFE) standards are the most significant driver of future fuel demand.
The following tables show how the various subsectors, end-uses, technologies and/or fuels which
are found in NEMS have been included in the Rhode Island LEAP model. Each table may be
read from left to right, with macroscopic subsectors or categories on the left, and specific fuel
consumption or technologies on the right. Detail is provided for key end-uses only - other end-
uses terminate only in fuels (italicized, understood to be a list of fuels consumed within the
category) or technologies (understood to be a list of technologies which consume fuel within the
category).
Table 1: Structure of Household Demand
Residential
Single Family, Multi-Family or Mobile Homes
HVAC
Heating
Air Source Heat Pump
Electric Furnace
Fuel Oil Boiler
Fuel Oil Furnace
Ground Source Heat Pump
Kerosene Furnace
LPG Furnace
Natural Gas Boiler
Natural Gas Furnace
Natural Gas Heat Pump
Wood Stove
Biodiesel Boiler
Biodiesel Furnace
Secondary Heating Fuels
Cooling Technologies
All Other
Lighting Various End-Uses Technologies
Computing and Networking
Fuels Cooking
Clothes Washing and Drying
Dish Washing

31
Other Appliances
Refrigeration and Freezing
Television and Video
Water Heating
Table 2: Structure of Commercial and Service Sector Demand
Commercial
Assembly, Education, Food
Sale, Food Service, Health Care,
Lodging, Large Office, Small
Office, Mercantile and Service,
Warehouse, Other
HVAC
Heating
Rooftop Air-Source Heat Pump
Commercial Ground-Source Heat Pump
Electric Boiler
Electric Residential Heat
Gas Boiler
Gas Furnace
Residential-type Gas Heat Pump
Oil Boiler
Oil Furnace
Wood Boiler
Biodiesel Boiler
Biodiesel Furnace
Cooling
Technologies
Ventilation
All Other
Lighting
Water Heating
Cooking
Refrigeration
Non-PC Office Equipment
Fuels PC Office Equipment
Other
Unspecified
Non-Building (i.e. cell towers, street lighting) Fuels
Table 3: Structure of Industrial Demand
Industrial
Manufacturing (Food Products, Paper and Allied Products, Bulk Chemicals, Glass and Glass Products, Cement and Lime, Iron
and Steel, Aluminum, Metal Fabrication, Machinery, Computer and Electronics, Transport Equipment, Electrical Equipment and
Appliances, Wood Products, Plastics and Rubber, Balance of Manufacturing)
Process and Assembly
Various End-Uses
Fuels

32
Buildings Fuels
Non-Manufacturing (Crop Agriculture, Other Agriculture, Coal Mining, Oil and Gas Mining, Metallic and Non Mineral Mining,
Construction) Process and Assembly Fuels
Projections of energy consumption for all fuels in the transportation sector are based on the
MOtor Vehicle Emission Simulator (MOVES) model (U.S. Environmental Protection Agency
2016a). MOVES is the U.S. Environmental Protection Agency (EPA) accepted mobile source
emission model for state air quality planning and emissions inventory development under the
Clean Air Act. The MOVES runs for the Rhode Island LEAP reference case were developed
using input data specific to Rhode Island for projecting state vehicle-miles traveled (VMT) and
energy consumption by vehicle type, out to 2050. VMT growth rates were obtained from the
Rhode Island Statewide Model Update (Rhode Island Division of Planning 2016). All key
vehicle classes and transport modes are represented, and are listed in Table 4. Total VMT across
on-road vehicle types in the reference case were projected to grow about 0.2% annually from
2015 through 2050. Again, italicized items denote detailed lists of end-uses, fuels or
technologies which have been excluded from the table for brevity.
Table 4: Structure of Transport Demand
Transportation
On-Road
Motorcycle
Fuels
Passenger Car
Passenger Truck
Light Commercial Truck
Intercity Bus
Transit Bus
School Bus
Refuse Truck
Single Unit Short-Haul
Single Unit Long-Haul
Motor Home
Combination Short-Haul
Combination Long-Haul
Off Road
Construction
Commercial
Industrial
Rail Support
Air Support
Agriculture
Recreational

33
Pleasure Craft
Logging
Lawn
Air Travel
Rail Passenger
Fuels Freight
Navigation International Shipping
Fuels Domestic Shipping
Final energy consumption is calculated using an “activity analysis” in the Rhode Island LEAP
model. This is a simple technique which represents final energy demands (for each fuel or
technology within a particular subsector or end-use) as the product of two numbers: the activity
level, or number of units which require energy services, and the energy intensity, the amount of
energy consumed per unit of activity. The activity level and energy intensity for each major
demand sector are taken from high-level demographic and economic projections, which are
listed below in Table 5. Energy intensities may further be specified in two variants: as a final
energy intensity, providing the total quantity of energy required for each activity unit, or as a
useful energy intensity, from which total energy requirements for each activity unit can be
calculated from the desired energy service requirement and the efficiency of devices which
provide the service. The selection of modeling methodology in LEAP is directly related to the
nature of results which are found in NEMS outputs. Useful energy requirements are given for
heating and cooling end-uses, while final energy requirements are provided for other categories
of energy demand.

34
Table 5: Major Data Input Sources for Demand Sectors
Sector Primary Data Sources Unit of Activity
Characterization2 of End-Uses and Technologies/Fuel
Consumption for each Unit of Activity
Residential
AEO 2015 outputs (U.S. Energy Information Administration 2015f) and
(U.S. Census Bureau 2015)
Number of households by housing type (single family, multi-family, mobile) and
Square footage per household for heating and cooling end-uses
(U.S. Energy Information Administration 2014c)
Commercial AEO 2015 outputs (U.S. Energy Information Administration 2015d)
Commercial square footage by business type
(U.S. Energy Information Administration 2014a)
Industrial AEO 2015 outputs (U.S. Energy Information Administration 2015e)
Dollars of output by industrial sector or Physical commodity production (paper and allied products, glass and glass products, cement, iron and steel, aluminum only)
(U.S. Energy Information Administration 2014b)
On Road Transportation & Off Road Equipment
RI-specific MOVES run and Rhode Island Statewide Model Update
Vehicle-miles traveled, Number of devices
(U.S. Environmental Protection Agency 2016a) (Rhode Island Division of Planning 2016)
Rail, Aviation & Shipping
AEO 2015 outputs (U.S. Energy Information Administration 2015f)
Total energy consumption (MMBTU)
(U.S. Energy Information Administration 2015)
Since NEMS generates only regionally-aggregated results for New England (and other groups of
states), data and outputs from AEO must be downscaled appropriately before they can be entered
into the Rhode Island LEAP model. In particular, activity data which are projected in NEMS are
reduced using proportionality factors appropriate for Rhode Island, while energy intensities are
left intact. The activity downscaling approach is briefly described for each major demand sector
in Table 6.
Following the downscaling procedure, two additional modifications are performed.
2 Documents cited in this column are for the 2014 AEO, as the U.S. Energy Information Administration had not yet
updated NEMS documentation for the 2015 AEO at the time of the Reference Case development. However, having
carefully reviewed the updated AEO 2015 assumptions as of September 2015 (U.S. Energy Information
Administration 2015i), the authors concluded that little of the methodology had changed, therefore the 2014
documentation remained current.

35
1) Useful service demands for household and commercial building heating are reduced to
account for the shorter heating season in Rhode Island when compared with the New
England average. An analysis of the average number of heating degree days in Rhode
Island implies an 11% reduction in useful heat requirements per square foot, relative to
the service demand described by AEO 2015.
2) The mix of residential heating fuels and technologies is adjusted using the state’s heating
market segmentation analysis (Meister Consultants Group, n.d.), relative to the average
regional mix seen in AEO 2015 projections.
AEO generates projections through 2040 only. These projections must therefore be extrapolated
through 2050 for key variables to cover the full planning horizon for the Rhode Island LEAP
model, using annual average growth rates (AAGR) established through 2040. An overview of
techniques and variables which are extrapolated is given in Table 6. All other activity level and
energy intensity data which are not mentioned explicitly in this table are held constant through
2050 at AEO-projected 2040 levels.
Table 6: Modifications to Annual Energy Outlook for Rhode Island LEAP Demands
Sector Unit of Activity Activity Downscaling
Methodology
2040 - 2050 Extrapolation Methodology
Residential
Number of households by housing type (single family, multi-family, mobile) and
Square footage per household for heating and cooling end-uses
Number of households by housing type provided for RI from US Census Bureau
Heating service demands and technology/fuel mix adjusted for RI as described above
Total households extrapolated using 2009 – 2040 AAGR. Useful heating and cooling requirements extrapolated using 2025 – 2040 AAGR.Energy intensity for all other devicesextrapolated using 2025 – 2040 AAGR.
Commercial Commercial square footage by business type
Total RI square footage = (Total New England square footage) * (Commercial GDP in RI / Commercial GDP in New England)
Useful heating, cooling, water-heating, cooking and refrigeration requirements extrapolated using 2025 – 2040 AAGR.Energy intensity for all other devicesextrapolated using 2025 – 2040 AAGR.
Industrial
Dollars of output by industrial sector or Physical commodity production (paper and allied products, glass and glass products, cement, iron and steel, aluminum only)
RI output = (New England output) * (Sector GDP in RI / Sector GDP in New England)
Energy intensity for all fuels extrapolated using 2025 – 2040 AAGR.
Transportation Vehicle miles traveled
MOVES outputs are already RI specific – no need to downscale
No extrapolation required.

36
When using two different sources of data for different time periods (historical 2001 – 2013
consumption from SEDS, AEO-projected consumption from 2014 onwards), it becomes
necessary to calibrate the two sources of data to ensure a continuous transition in the first
projected year. Calibration is performed by adjusting the average efficiency or energy intensity
for all technologies which consume the same fuel within each sector, to recover the sector’s total
consumption of that fuel observed in 2013 from SEDS.
2 Energy Supply
The reference case modeling of energy supply for Rhode Island covers the electric power sector,
indigenous production of primary renewable energy, and imports of other primary and secondary
fuels. The LEAP representation of the power sector is a downscaled model of the ISO New
England (ISO-NE) power system from which Rhode Island draws electricity. This permits a
consumption-based accounting approach to be used, where each megawatt-hour of electricity
consumed in Rhode Island is served by the average mix of resources projected for ISO-NE as a
whole. Several types of resources are represented in the electric power model, including:
a) Currently existing generating capacity in Rhode Island. Plants with a total capacity of at
least 1 MW are represented individually, while other capacity is aggregated by
technology. Behind-the-meter (BTM) solar and wind capacities (comprised of all net-
metered capacity as well as capacity which is both less than 25 kW and installed under
the state’s Renewable Energy Growth program) are distinguished from front-of-the-meter
(FTM) capacities.
b) Existing generating capacity within the ISO-NE control area, but outside Rhode Island.
Each plant is grouped with other like technologies, in one of 24 distinct classifications.
c) Potential future generating capacity in ISO-NE (represented by 16 generation
technologies).
d) ISO-NE demand resources inside and outside Rhode Island, including on-peak and
seasonal peak passive demand resources, real-time demand response, and real-time
emergency generation.
e) Imports from adjoining control areas (New Brunswick, New York, and Québec).
2.1 Current or Historical Capacity and Electricity Generation
Existing generating capacity is derived from EIA Form 860 (U.S. Energy Information
Administration 2015a), Rhode Island Office of Energy Resources (2016), and ISO-NE (2015b).
Generators labeled industrial or commercial according to EIA-860 are excluded from the power
model because they are assumed to be implicitly contained in the AEO 2015 demand
projections3. The same argument is applied to a fraction of BTM capacity, which is assumed to
be embedded in the AEO-based total demand projections and in load duration curves taken from
ISO-NE (ISO New England 2015b). Finally, any capacity which was decommissioned before
3 Industrial and commercial distributed generation capacity that qualifies as an ISO-NE demand resource is excepted
from this exclusion for the sake of consistency with how other demand resources are modeled. The amount of
capacity in question is small (approximately 61 MW in 2015).

37
2014 is also excluded because it is not required by the LEAP software in order to recreate
historical electricity generation. The effective capacity from demand resources and imports is
taken from ISO-NE documentation (ISO New England 2016b; ISO New England 2016a; ISO
New England 2015b; ISO New England 2015a).
Historical generation of electricity and associated consumption of various feedstock fuels for
2001-2014 is calculated using EIA’s 900-series forms (U.S. Energy Information Administration
2015b). Historical imports are from ISO-NE (2016e).
Table 7: Summary of each technology or resource represented in LEAP for 2014, the most
recent historical year available from EIA sources
Existing Resources in 2014
Location Plant, Technology or Resource Capacity (MW)
Rhode Island
Blackstone Tupperware 1.6
Block Island 7.7
Entergy Gas 596.0
Forbes Street Solar 3.0
Johnston Landfill Gas 34.0
Manchester Street NGCC* 515.0
Ocean State Power I 254.2
Ocean State Power II 254.2
Pawtucket 68.8
Pawtucket Blackstone 1.6
Providence Solar 1.7
Ridgewood 6.4
Thundermist 1.2
Tiverton NGCC* 272.5
WED North Kingstown Green 1.5
West Davisville Solar 2.0
West Greenwich Solar 1.9
BTM Onshore Wind 8.3
BTM Solar PV** 2.3
Other FTM Onshore Wind 0.01
Other FTM Solar PV** 5.6
Other Run of River Hydro 1.8
Real Time Demand Response 85.1
On Peak Energy Efficiency 87.5
On Peak Distributed Generation 4.6
Outside Rhode Island
Reservoir Hydro 654.9
Run of River Hydro 1,112.4

38
BTM Solar PV** 505.3
FTM Solar PV** 198.3
Conventional Steam Coal 2,083.8
Conventional Steam Coal CHP*** 102.6
Landfill Gas 52.1
Municipal Solid Waste 532.1
Natural Gas Combined Cycle 10,863.8
Natural Gas Combined Cycle CHP*** 839.2
Natural Gas Combustion Turbine 760.4
Natural Gas Fuel Cell 16.0
Natural Gas ICE**** 8.5
Natural Gas ICE**** CHP*** 7.6
Natural Gas Steam 730.6
Pilgrim and Seabrook 1,912.0
Millstone 2 909.9
Millstone 3 1,253.0
Onshore Wind 665.7
Oil Combined Cycle 478.0
Oil Combustion Turbine 2,192.5
Oil Combustion Turbine CHP*** 20.0
Oil ICE**** 158.0
Oil Steam 4,646.6
Other 31.3
Wood and Wood Waste 513.8
Imports New Brunswick 1,000.0
Imports New York 1,730.0
Imports Québec 2,217.0
Real Time Demand Response 1,425.7
On Peak Energy Efficiency 1,010.5
On Peak Distributed Generation 53.2
Seasonal Peak Energy Efficiency 298.8
Seasonal Peak Load Management 52.7
ISO-NE
Real Time Emergency Generation 915.4
Imports New Brunswick 1,000.0
Imports New York 1,730.0
Imports Québec 2,217.0 *Natural gas combined cycle.
**Photovoltaic.
***Combined heat and power.
****Internal combustion engine.

39
Consumption-based electricity modeling
Since the geographic scope of the analysis covers only electricity demand which arises within
territorial Rhode Island, implementing a consumption-based modeling approach in the power
sector means that each megawatt of capacity and megawatt-hour of electricity generated in the
ISO-NE control area must be downscaled to a miniaturized representation of the New England
grid. This “fictitious” electrical grid must be sized appropriately to meet Rhode Island’s
electrical requirements (and a pro-rated share of exports to outside the ISO-NE area). The
technique ensures that the set of generating technologies represented in the LEAP model will be
dispatched in the same way that they would be dispatched if meeting electricity demand for all
New England. A multiplicative downscaling factor 𝑐, loosely defined as the ratio of Rhode
Island’s electrical demand to that of the whole ISO-NE control area, is applied to the capacity
and historical electricity production of each process. The downscaling factor can be defined for
every historical year using the following ratio:
𝒄 = 𝒅 − 𝑽(𝟏 − 𝒍)
𝑮(𝟏 − 𝒍) − 𝑬 + 𝟖𝟕𝟔𝟎(𝟏 − 𝒍)𝚺𝒊𝑩𝑻𝑴𝑪𝒊𝑪𝑭𝒊
In the numerator, in-state electricity demand 𝑑 is reduced using the Rhode Island demand
resource “on-peak energy efficiency,”4 which is quantified as the megawatt-hours of demand
reduction 𝑉 (ISO New England 2014a), adjusted to account for transmission losses. The
parameter 𝑙 is the electrical loss incurred from production to consumption, expressed as a
fraction of power generated. The average transmission and distribution loss factor is held at 8%
in all years (ISO New England 2014b). The expression’s denominator includes on-grid
generation and imports from outside ISO-NE (collectively represented by 𝐺) and total export
requirements from ISO-NE 𝐸. It also includes electricity produced by behind-the-meter (BTM)
processes as well as the ISO-NE demand resource “on-peak distributed generation,” each with
capacity 𝐶 and average capacity factor 𝐶𝐹 (ibid). For all projected years, the downscaling factor
𝑐 is held at its most recently calculated 2014 historical value of 7.23%.
Various other technical characteristics of power resources, such as heat rates and capacity
factors, are derived from the previously cited sources and AEO documentation.
2.2 Projected Capacity Expansion and Electrical Dispatch
Reference case projections in the electric power sector are driven by Rhode Island’s
requirements for electricity. To represent the electric power sector through the year 2050, two
processes must be modeled: the expansion of generating capacity including power plants,
technologies and other resources (such as electricity imports and demand resources), as well as
the operation (or dispatch) of these resources to meet electric load.
4 The ISO-NE on-peak energy efficiency demand resource is assumed to be distinct from efficiency which is
achieved under the current least-cost procurement statute.

40
Capacity Expansion
Capacity expansion includes all necessary capacity growth to maintain the reliability of the grid
as aging power plants retire, as demand increases, or as grid characteristics change. Expansion
plans that are explicitly described in ISO-NE’s current Interconnection Request Queue (ISO New
England 2016c) are included in the reference case using the downscaling method described in the
preceding section, after applying a multiplicative attrition rate to all planned capacity increases.
For wind, the attrition rate is 82% of planned capacity5 additions while other projects are
assigned at attrition rate of 85%. Both attrition rates were calculated from historical data in the
Interconnection Queue. Retirements of existing plants are assumed to occur after each plant’s
useful lifetime, using commissioning dates given in EIA-860 (U.S. Energy Information
Administration 2015a) and lifetimes taken from a variety of sources (Tidball et al. 2010;
Schlömer et al. 2014; International Energy Agency 2012).6
Additional capacity may also be added in order to maintain the planned system reserve margin of
16.1%, dropping to 14.4% by 2020 (calculated from ISO-NE's installed capacity requirements,
ISO New England 2015c). Each unit or resource contributes its Seasonal Claimed Capability
(SCC, ISO New England 2016d) towards meeting this reserve target. These types of capacity
additions do not explicitly appear in ISO-NE documents – instead they are constructed whenever
they are needed from a list of pre-selected “endogenous” technologies. Endogenous technology
options are chosen so that new capacity maintains the same ratio as newly added technologies
observed in the Interconnection Queue since 2008, factoring in historical attrition rates.
5 A lower attrition rate for wind of 41% is used initially, reaching 82% by 2025. This was found to be necessary to
ensure that the required renewable portfolio standard was being met during the first ten years of the scenario (refer
to Section 4 for a description of how various renewable portfolio standards are handled in the model). 6 In cases where aging power plants were seen to continue operating in 2014 already beyond their expected
lifetimes, their expected decommissioning dates were pushed back.

41
Table 8 shows the list of plants or technologies which may be added endogenously in the
reference case, as well as those existing plants or resources whose capacities are projected using
explicit expansion or retirement plans.
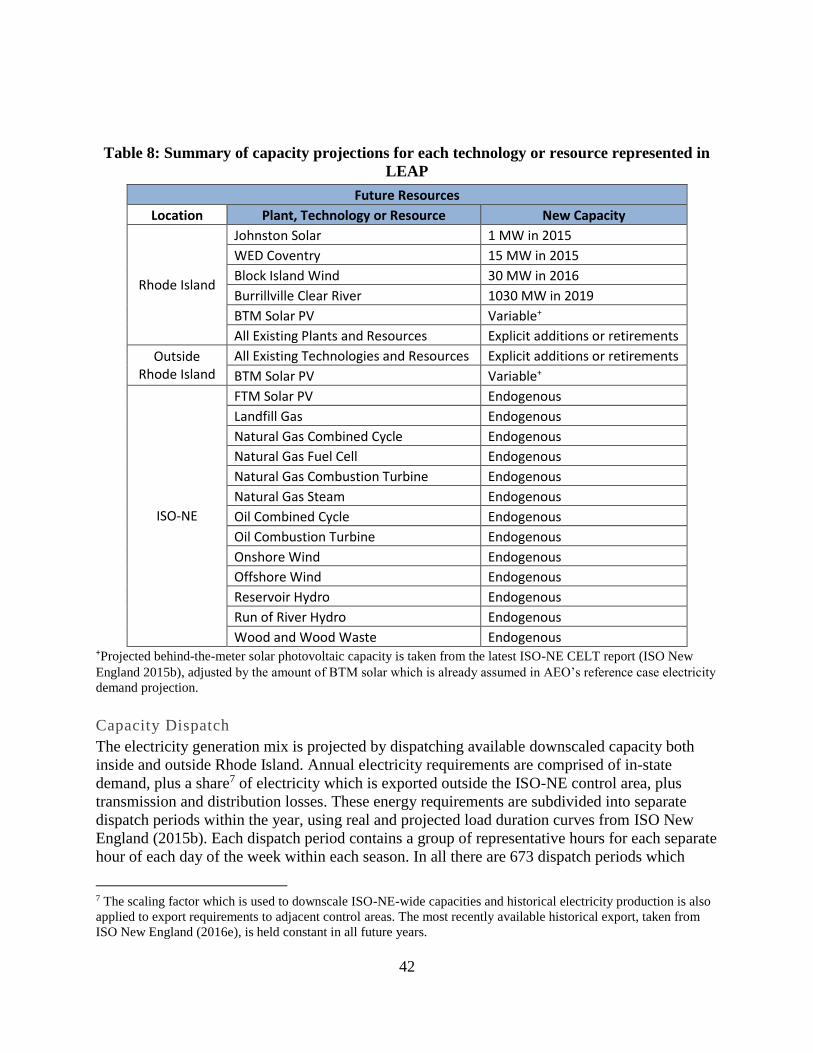
42
Table 8: Summary of capacity projections for each technology or resource represented in
LEAP
Future Resources
Location Plant, Technology or Resource New Capacity
Rhode Island
Johnston Solar 1 MW in 2015
WED Coventry 15 MW in 2015
Block Island Wind 30 MW in 2016
Burrillville Clear River 1030 MW in 2019
BTM Solar PV Variable+
All Existing Plants and Resources Explicit additions or retirements
Outside Rhode Island
All Existing Technologies and Resources Explicit additions or retirements
BTM Solar PV Variable+
ISO-NE
FTM Solar PV Endogenous
Landfill Gas Endogenous
Natural Gas Combined Cycle Endogenous
Natural Gas Fuel Cell Endogenous
Natural Gas Combustion Turbine Endogenous
Natural Gas Steam Endogenous
Oil Combined Cycle Endogenous
Oil Combustion Turbine Endogenous
Onshore Wind Endogenous
Offshore Wind Endogenous
Reservoir Hydro Endogenous
Run of River Hydro Endogenous
Wood and Wood Waste Endogenous +Projected behind-the-meter solar photovoltaic capacity is taken from the latest ISO-NE CELT report (ISO New
England 2015b), adjusted by the amount of BTM solar which is already assumed in AEO’s reference case electricity
demand projection.
Capacity Dispatch
The electricity generation mix is projected by dispatching available downscaled capacity both
inside and outside Rhode Island. Annual electricity requirements are comprised of in-state
demand, plus a share7 of electricity which is exported outside the ISO-NE control area, plus
transmission and distribution losses. These energy requirements are subdivided into separate
dispatch periods within the year, using real and projected load duration curves from ISO New
England (2015b). Each dispatch period contains a group of representative hours for each separate
hour of each day of the week within each season. In all there are 673 dispatch periods which
7 The scaling factor which is used to downscale ISO-NE-wide capacities and historical electricity production is also
applied to export requirements to adjacent control areas. The most recently available historical export, taken from
ISO New England (2016e), is held constant in all future years.

43
make up each year, including one period for those hours during which the top 1% of system load
occurs. The electricity generation mix is then projected by dispatching each power plant,
technology option or resource to meet electricity requirements within each separate dispatch
period and within each year of the scenario. Each dispatchable resource is assigned a priority
order (also called merit order, summarized in Table 9) that determines when it is used to meet
load. Must-run resources such as intermittent renewable generation are dispatched at their full
available capacity at all times, regardless of load.
Table 9: Electrical Dispatch Priorities for Generation Technologies, Imports and Demand
Resources (DR)
Technology Merit Order
Run-of-River Hydro Must-run
Distributed and Utility Solar Must-run
Onshore and Offshore Wind Must-run
On Peak Distributed Generation (DR)
Must-run
Rhode Island-only+ On Peak Energy Efficiency (DR)
Must-run
Reservoir Hydro 1
Fuel Cell 1
Nuclear 1
Landfill Gas 2
Natural Gas Steam 2
Biomass 2
Québec Imports 2
Steam Coal (CHP and non-CHP) 3
Natural Gas Combined Cycle and ICE CHP
3
Other 3
New York/New Brunswick Imports 3
Municipal Solid Waste 4
Natural Gas Combined Cycle CHP and Combustion Turbine
4
Oil Combined Cycle and Oil Steam 4
Natural Gas ICE 5
Oil ICE 5
Oil Combustion Turbine (CHP and non-CHP)
6
Rhode Island-only+ Real Time Demand Response (DR)
6

44
All Other Demand Resources Not dispatched
+Generally, ISO-NE demand resources contribute capacity towards the system reserve margin but are not dispatched
in the model. Two exceptions are permitted for On Peak Energy Efficiency and Real Time Demand Response
resources which are physically located in Rhode Island, and which may be used to meet the state’s electricity
requirements.
Resource Requirements and Constraints
The supply of primary renewable energy available in Rhode Island is represented in the reference
case by modeling the annual sustainable yield of renewable resources: onshore wind and biomass
(Lopez et al. 2012), offshore wind (Applied Technology & Management et al. 2007), utility and
distributed solar, hydro, geothermal (Brown et al. 2015), landfill gas (National Grid 2010) and
municipal solid waste (Rhode Island Division of Planning 2014). These amounts serve as
constraints on total production in any one year. Other primary fossil fuels and secondary fuels
besides electricity are assumed to be imported into Rhode Island as necessary to satisfy the
state’s requirements8.
3 Emissions of Greenhouse Gases and Local Air Pollutants
To calculate emissions of GHGs and other air pollutants from the energy system, emission
factors—defined as the mass of pollutant per unit of energy consumed or produced—are
assigned to each activity or process that consumes or produces energy in the LEAP model. The
factors are then multiplied by projected energy consumption or production to determine total
emissions.9 Factors are specified for all GHGs emitted from the energy system (including carbon
dioxide, nitrous oxide, and methane) as well as NOx, NMVOC, sulfur dioxide, carbon
monoxide, and particulate matter less than 10 and 2.5 microns in diameter.
For consistency with Rhode Island’s most recent GHG inventory, state-specific emission factors
for major energy demand sectors are taken from EPA’s State Inventory Tool (SIT) where
possible (U.S. Environmental Protection Agency 2015b). Gaps for fuel, demand sector or
pollutant combinations that are not provided in SIT are filled from a variety of publicly available
sources, particularly EPA’s WebFIRE system (U.S. Environmental Protection Agency 2016b)
and the Intergovernmental Panel on Climate Change’s (IPCC’s) Database on Greenhouse Gas
Emission Factors (Intergovernmental Panel on Climate Change 2016), with smaller data gaps
filled by a mixture of other source and the modeling team’s own assumptions (Bond et al. 2004;
European Environment Agency 2013; Argonne National Lab 2015).
Emission factors for energy transformation processes are also incorporated. The model includes
fugitive emissions associated with the transmission and distribution of natural gas, and with the
8 In-state requirements for natural gas by end-users (excluding power plants) are increased by 1.5% to account for
estimated pipelines losses incurred in its transmission and distribution. 9 There are two exceptions to this methodology: nitrogen oxides and sulfur dioxide emitted from the on-road
transport sector. Emissions of these pollutants are specified using on a per vehicle-mile traveled basis.

45
transmission of electricity (for example, sulfur hexafluoride emissions from capacitor banks).
Pollution arising from electricity generation is tracked for all power plants and technologies in
the power sector model, consistent with a consumption-based accounting approach. Emission
factors for each major technology are taken first from EPA’s eGRID database (U.S.
Environmental Protection Agency 2015a), the from the WebFIRE system and IPCC as needed
(U.S. Environmental Protection Agency 2016; Intergovernmental Panel on Climate Change
2016). These data are supplemented by emissions factors from a variety of other sources.
Average GHG emissions per kilowatt-hour from adjacent control areas - Québec, New
Brunswick, New York - are also included (U.S. Environmental Protection Agency 2015a;
Environment and Climate Change Canada 2016).
The land-use, land-use change, and forestry (LULUCF) sink was added to 1990 based on
available land cover datasets (downloaded from the Rhode Island Geographic Information
System (RIGIS) website http://www.rigis.org/), estimates of carbon stocks for each land cover
type (Abt Associates 2015), and trends in carbon dynamics from the EPA State Inventory Tool
(U.S. Environmental Protection Agency 2015b). RIGIS land cover datasets were available for
the years 1988, 1995, 2003/2004, and 2011. These were used to identify historical changes in
acreage of multiple land cover classes, including three types of forest. These historical changes
were interpolated across the dataset years to derive an estimate for the 1990 Rhode Island GHG
inventory.
The reference case projection of LULUCF GHG fluxes to 2035 was based on (1) estimates of
future residential, commercial, and industrial land needs and (2) the assumption that future land
needs will be met according to historical land conversion trends (i.e., most new residential
developments will be developed from forested lands). Estimates of future land needs were based
on population projections (Rhode Island Division of Planning 2013), employment projections
(Rhode Island Department of Labor and Training 2014), and Land Use 2025 (Rhode Island
Division of Planning 2006). We estimated future forest carbon dynamics using regional
modeling in the U.S. Forest Carbon Budget Model (U.S. Forest Service 2010) and used estimates
of carbon stocks for each land cover type developed in similar analysis for Massachusetts (Abt
Associates 2015).
4 Current Policies
The reference case projection accounts for existing federal, regional, and state policies expected
to shape future energy use and GHG emissions in Rhode Island. It does not include proposed
policies or rules that are not yet adopted as requirements. Table 10 summarizes how major
existing policies are addressed in the reference case.
Table 10: Handling of Major Existing Policies in Reference Case
Policy Description How Addressed in Reference Case Model
Transportation
Corporate Fuel economy standards for existing light- Included in MOVES Rhode Island assumptions

46
Policy Description How Addressed in Reference Case Model
Average Fuel Economy (CAFE)
Standards
duty vehicles, through 2011 model year. (MOVES outputs imported into LEAP model).
EPA/NHTSA Emissions and Fuel Efficiency
Standards
Standards for cars and light trucks, model years 2012-2016 and 2017-2025. Also includes Phase 1 Standards for medium- and heavy-duty engines and vehicles with 2014-2016 model years.
Included in MOVES Rhode Island assumptions (MOVES outputs imported into LEAP model).
EPA Emissions Standards
Tier 1 and 2 light-duty vehicle standards for nitrogen oxides (NOx) and non-methane volatile organic compounds (NMVOC) through 2016 model year. Tier 3 light-duty vehicle NOx and NMVOC standards and low-sulfur gasoline for model year 2017.
Included in MOVES Rhode Island assumptions (MOVES outputs imported into LEAP model).
California’s LEV Regulations
Low emission vehicle standards for NOx and NMVOC in light-duty vehicles.
Included in MOVES Rhode Island assumptions (MOVES outputs imported into LEAP model).
EPA On-Road Emission
Standards
On-road standards are also applied to construction equipment, small gasoline engines, off-road recreational vehicles, etc.
Included in MOVES Rhode Island assumptions (MOVES outputs imported into LEAP model).
Driving Rhode Island to Vehicle
Electrification (DRIVE)
Rhode Island consumer rebate for electric vehicles.
Not included in modeling assumptions. Reference scenario is compliant with CAFE standards for automakers, which is a fleet-average requirement. Therefore DRIVE does not impact GHG projections.
International Civil Aviation
Organization (ICAO) CO2
Standard for New Aircraft
Proposed international performance standard for new commercial and business aircraft delivered after January 1, 2028.10
Included in reference case as a projected fuel demand decrease.
Other Energy
Regional Greenhouse Gas Initiative (RGGI)
Cap and trade market for 25+ MW power stations in the following states: Connecticut, Delaware, Maine, Maryland, Massachusetts, New Hampshire, New York, Rhode Island, and Vermont (RGGI Inc. 2016a).
Baseline capacity expansion plans through 2020 (ISO New England 2016c) are assumed to be in alignment with declining RGGI targets given market signals.
As noted previously, the reference case
10 While the ICAO aircraft measure is a proposal, it reflects the current industry trend in which the introduction of
new jet designs in the next five years will meet or exceed the proposed standard in advance of the standard actually
going into effect (ICCT 2016). Therefore, we include it in the reference case as a conservative reflection of
projected business-as-usual energy demand in the commercial and business aircraft sector.

47
Policy Description How Addressed in Reference Case Model
Adjusted11 regional carbon dioxide allowances in each year are the following:
2014: 82,792,336 tonnes CO2
2015: 66,833,592 tonnes CO2
2016: 64,615,467 tonnes CO2
2017: 62,452,795 tonnes CO2
2018: 60,344,190 tonnes CO2
2019: 58,288,301 tonnes CO2
2020: 56,283,807 tonnes CO2
In 2015, Rhode Island was allocated 2.8% of regional allowance (RGGI Inc. 2016b).
model uses a consumption-based approach to determine GHG emissions from electricity supply, so reference case emissions are not directly comparable to the RGGI allocation. By adjusting emission factors, the model could be used to estimate generation-based emissions that would be comparable to the allowances, but this is outside the scope of this study.12
Renewable Energy Standard
(RES)
Renewable energy must make up the following shares of retail electricity sales in Rhode Island, interpolating linearly between each (State of Rhode Island 2016, sec. R.I.G.L § 39-26-4):
3% in 2007
5.5% in 2011
8.5% in 2014 and 201513
38.5% in 2035
Permitted under the standard: renewable electricity produced anywhere in the ISO-NE control area, electricity produced by consumer-owned distributed generators located in Rhode Island. Eligible renewable resources include solar, wind, geothermal, tidal/ocean, small hydro (plant size not exceeding 30 MW), wood/wood waste, and landfill gas.
Exclusions under the standard: renewable electricity purchased voluntarily by consumers; renewable capacity that entered into service before December 31
Renewable portfolio standards from all ISO-NE states and adjacent control areas —including Rhode Island’s RES — are combined to determine the expected renewable electricity requirements for the entire ISO-NE system through 2035 (the final year under Rhode Island’s current policy). Priorities for dispatching supply resources and constructing new resources are adjusted as necessary (final dispatch priorities are given in Table 9) to align the reference case power mix with the combined requirements. Voluntary purchases of renewable power are not considered.
11 From the “First and Second Control Period Interim Adjustment for Banked Allowances” (RGGI Inc. 2014).
Simply, these adjustments account for historical emissions which have been less than the historical emissions cap –
i.e., if the cap is larger than is shown to be necessary to induce change, it will have little impact and should therefore
be reduced. 12 Such a comparison would not include purchased offsets outside the power sector, which may meet up to 10% of
compliance obligations under RGGI but are not represented in the LEAP model. 13 Table 1 of Rhode Island Public Utilities Commission (2016) describes a delayed increase in the RES mandate in
the year 2015. The RES in 2015 is thus 8.5% instead of 10%, as it would be following the schedule of increases
since 2007.
48
Policy Description How Addressed in Reference Case Model
1997 may provide only 2% of retail sales used to meet the standard.
Various Renewable
Capacity Targets
Long-Term Contracting Standard for Renewable Energy (90 MW 2009-2014) (Rhode Island Division of Planning 2015a)
Distributed Generation Standard Contracts Program (40 MW 2011-2014) (ibid)
160 MW Renewable Energy Growth Program (160 MW 2014-2019) (ibid)
Capacity for the Long-Term Contracting Standard and Distributed Generation Program is represented as existing generation capacity in the model, as is capacity installed to date under the Renewable Energy Growth Program. New capacity is assumed to be developed to meet the Renewable Energy Growth (REG) Program’s 160 MW target in 2019. New capacity under the REG program is expected to be 85% solar PV, 13% onshore wind and the remainder for hydropower and anaerobic digestion of waste (Musher 2016).
Least-Cost Energy Efficiency
Procurement Law
“Least-cost procurement, which shall include procurement of energy efficiency and energy conservation measures that are prudent and reliable and when such measures are lower cost than acquisition of additional supply, including supply for periods of high demand.” (State of Rhode Island 2006, sec. R.I.G.L § 39-1-27.7). Newly-added14 electric energy savings from the least-cost procurement (LCP) program are projected to be, in each year (National Grid 2016):
268,468 MWh in 2014
222,822 MWh in 2015
199,760 MWh in 2016 (estimated)
201,347 MWh in 2017 (estimated)
From 2018 – 2021 and 2022 - 2024, new electricity savings are estimated at 2.7% and 2.0% of 2009 sales, respectively (ENE 2013).
Similarly, newly-added natural gas savings are (National Grid 2016):
409,029 MMBTU in 2014
419,778 MMBTU in 2015
395,760 MMBTU in 2016 (estimated)
Projected energy demand from AEO 2015 already accounts for efficiency mandates in the following federal laws:
American Recovery and Reinvestment Act of 2009
Energy Independence and Security Act of 2007
Energy Policy Acts of 1992 and 2005
Energy Improvement and Extension Act of 2008
National Appliance Energy Conservation Act of 1987
Clean Air Act Amendments of 1990 Additional details are provided in Appendix A of the AEO 2015 assumptions (U.S. Energy Information Administration 2015h). Notwithstanding, the LEAP reference case projection assumes that the least-cost procurement law enables additional efficiency beyond what is already contained in AEO 2015. Electricity and natural gas savings from the law are represented by subtracting the expected energy fuel savings from calculated energy consumption for residential and commercial sectors, separately. In addition, distillate heating oil
14 Newly-added efficiency refers to any efficiency measure which did not exist the previous year. However, the total
energy savings expected in any one year is the result of surviving efficient devices introduced in all previous years.
Only post-2014 savings from the LCP program are included, since the model relies upon real historical consumption
data from SEDS through 2013.

49
Policy Description How Addressed in Reference Case Model
414,606 MMBTU in 2017 (estimated)
From 2018 – 2020 and 2021 - 2024, new natural gas savings are estimated at 1.0% and 0.5% of 2009 sales, respectively (ENE 2013).
Heating oil savings are not explicitly covered by the LCP program.
savings are expected to arise alongside electric savings, and they are subtracted from total fuel consumption in the same way. Like gas savings, newly-added heating oil savings are estimated as 1.0% of 2009 sales from 2014 – 2020 and 0.5% of 2009 sales from 2021 – 2024. After the expiry of the LCP statute in 2024, no additional efficient technologies or projects are introduced and those already implemented will gradually retire.15
In addition to the electricity-saving impact of the LCP, ISO-NE recognizes energy efficiency as a passive demand resource and assigns an appropriate capacity credit. The contribution of efficiency resources to ISO-NE system reserve capacity is included on the supply-side of the model. Peak MW of capacity and capacity factors are derived from ISO-NE (2016b), ISO-NE (2016a), and ISO-NE (2015b). To be consistent with the consumption-based approach, capacity from all efficiency resources in the ISO-NE control area are counted, however, only those energy savings from efficiency in Rhode Island are explicitly included in the model.
Net Metering
Net metering may be offered to consumers generating electricity in an amount that does not exceed their average annual consumption over the previous three years (State of Rhode Island 2011, sec. R.I.G.L § 39-26.4-2). ‘Virtual’ net metering, where a customer can receive net metering credits for a project located off-site, is now allowed in Rhode Island in certain instances for public sector projects, farms, affordable housing, and residential projects.
Excepting biomass (but including biogas from anaerobic digestion), all generation resources that qualify for the RES are eligible.
A fraction of behind-the-meter generation capacity (determined from ISO-NE (2015b)) does not need to be represented explicitly in the model because it is assumed to be embedded in the AEO-derived demand projections and therefore embedded in the load curves used in the model. Other behind-the-meter capacity is included in the electricity supply model, where its production contributes to meeting demand and load. Projected growth in behind-the-meter capacity is taken from ISO-NE’s Distributed Generation Forecast, which accounts for the incentives provided by net metering in Rhode Island and other New England states (ISO New England 2015b).
15 A full description of annual energy savings arising from the LCP, as well as the retirement schedule for these
savings, is included in the memo LEAP Analysis of Rhode Island GHG Mitigation Scenarios: Summary of Results.

50
Policy Description How Addressed in Reference Case Model
Biodiesel Heating Oil Act of 2013
Distillate heating oil supplied to residential, commercial, and industrial consumers must contain the following volumetric share of biodiesel (State of Rhode Island 2013, sec. R.I.G.L § 23-23.7-4):
2% in 2014
3% in 2015
4% in 2016
5% in 2017
Appropriate fraction of distillate consumption for heating is shifted to biodiesel. Target in 2017 is assumed to persist in all following years.
Clean Power Plan Pollution reduction for existing power plants. Stayed by Supreme Court in 2016.
Not represented explicitly in the reference case.
Solarize Rhode Island
Education and financial incentives for homeowner and business adoption of solar photovoltaics.
Not represented explicitly in the reference case—not expected to be additional to other policies.
Renewable Energy Fund
Grants for residential, commercial, and public renewable energy installations.
Not expected to have an additional effect on the reference case.
Low Income Home Energy
Assistance Program (LIHEAP)
Enhancement
Small subsidies for residential electricity and natural gas consumers on their bill.
Not expected to have an additional effect on the reference case.
Rhode Island Property Assessed
Clean Energy (PACE) Program
Small loans to homeowners and commercial properties for energy efficiency and renewable energy improvements.
Not expected to have an additional effect on the reference case.
Non-Energy
Land Use 2025 – Rhode Island
State Land Use Policies and Plan
Assumptions about future land needs. Calculated future land needed for residential, commercial, and industrial development based on methods in land use plan and more current data and projections.
Solid Waste 2038: Rhode Island
Comprehensive Solid Waste
Management Plan
This report makes recommendations for reducing the waste stream entering the Central Landfill in order to extend its life beyond 2038 (Rhode Island Division of Planning 2015b).
While the report makes several recommendations, they have not currently been implemented as policies. Therefore, the effects of the recommendations have not been included in the reference case, which was estimated using default data from the EPA State Inventory Tool.
Kigali Amendment to
Montreal Protocol
International agreement to reduce production and use of ozone-depleting substitutes (hydrofluorocarbons), which are also potent GHGs, over next 30 years.
Estimated emissions from ozone-depleting substances based on current levels of emissions and the schedule of reductions specified in the Kigali Amendment: 10% reduction below 2010-2012 levels by 2019, 40% by 2024, 70% by 2029, 80% by 2034, and 85% by 2036. Emissions from ozone-depleting substances are held constant in the reference case after 2036.

51
5 Historical and Reference Case Validation
The Rhode Island LEAP model was validated by comparing results to other recent analyses of
Rhode Island’s GHG emissions. Notably, it is important to compare LEAP-estimated emissions
with the state’s 1990 and 2010 GHG inventories (Northeast States for Coordinated Air Use
Management 2013) to ensure that the model accurately reproduces historical emissions, and to
ensure that each inventory sector is correctly represented in LEAP (i.e., an “apples-to-apples”
comparison). Table 11 summarizes annual CO2-equivalent emissions from various sectors under
these two analyses. It is useful for highlighting any methodological differences that exist
between the inventories and LEAP assessment, and also for providing a consistent basis from
which emissions reduction targets may be calculated, which refer to a 1990 base year. In
particular, key differences among the analyses include the treatment of fugitive emissions from
electricity transmission and of non-energy emissions from land-use, land-use change and forestry
(LULUCF), both of which are absent in 1990 and 2010 inventories (shaded grey in the table).
These methodological discrepancies must be rectified using a set of adjustments in order to
compare electric sector emissions using a common basis. Fugitive emissions from electricity
transmission must be removed from the LEAP reference case, and the LULUCF sink
retroactively added to the 1990 inventory.
Further differences persist in the way that consumption-based emissions from the electric
generation sector were calculated for the 1990 and 2010 inventories when compared to the ISO-
NE downscaling method used in developing the LEAP Reference Case. In the previous 1990 and
2010 inventories by the Northeast States for Coordinated Air Use Management (2013), it was
assumed that in-state generation first went to meet Rhode Island’s in-state electricity demand. In
both the 1990 and 2010 inventories, in-state generation was less than in-state demand, therefore
all in-state generation emissions were counted in the Rhode Island GHG inventories. The electric
generation sector emissions associated with the remaining in-state demand were assumed to be
met using the grid-average electrical mix from Connecticut, Massachusetts, Vermont, New
Hampshire, and Maine.
For comparison with the LEAP Reference Case, the previous 1990 and 2010 Rhode Island GHG
consumption-based electric sector emissions had to be re-calculated. This was done using New
England-wide (i.e., all New England states including Rhode Island) electric generation sector
GHG emissions and state-level electricity consumption data obtained from EIA (U.S. Energy
Information Administration 2016a & 2016b). This established a New England-wide GHG
emission factor for the electric generation sector, which was multiplied by Rhode Island’s
electricity consumption in 1990 and 2010 to arrive at new estimates for consumption-based GHG
emissions in the same manner as done in the LEAP Reference Case.
Table 11: Comparison of Annual GHG Emissions by Sector, for Rhode Island’s State
Inventory and LEAP Model*

52
Category Sector
Annual Megatonnes of CO2e
1990 Inventory
2010 Inventory
2010 LEAP Modeling
Energy
Transportation 4.97 4.33 4.7916
Residential 2.37 2.28 2.24
Commercial 1.15 0.93 0.92
Industrial 0.71 0.64 0.61
Natural Gas Distribution 0.3 0.15 0.15
Electricity Distribution 0.03
Electricity Consumption 3.81 3.39 2.29
Non-Energy
Agriculture 0.04 0.02 0.02
Industrial Processes 0.09 0.43 0.43
Solid Waste 0.23 0.22 0.39
Wastewater 0.08 0.08 0.08
LULUCF -0.21
Subtotal 13.76 12.47 11.74
Adjustments
Electricity Distribution Fugitives -0.03
Electricity Consumption Methodology17 -0.99 0.15
LULUCF Addition -0.29 TOTAL 12.48 n/a 11.86
*Brown-shaded cells indicate where an adjustment is either not necessary or is not performed.
The LEAP reference case was also compared to the business-as-usual forecast in the recent
Rhode Island State Energy Plan (Rhode Island Division of Planning 2015a). The LEAP reference
16 Differences in historical energy consumption are observed between SEDS as accessed in 2016 (and used for
LEAP modeling) and the same database as accessed in 2013 (used for 2010 inventory calculations). These
differences are most pronounced in the transport sector: The 2013 SEDS data used for the 2010 inventory showed
less gasoline consumption than the updated 2016 SEDS data used in the Rhode Island LEAP model, and zero
ethanol. These “missing” fuels substantially reduce the 2010 inventory’s emissions estimate for transport. 17 Two changes are required to bring into line the electricity sector emissions in the 1990 inventory and the Rhode
Island LEAP analysis. While the 1990 inventory was developed using a consumption-based accounting approach,
the approach first assumed that in-state generation was given first priority to meet Rhode Island’s electricity
requirements. Only the remaining requirements were assumed to be met using the grid-average electrical mix from
CT, MA, VT, NH and ME. The first adjustment (subtracting 0.99 MT CO2e from the 1990 inventory) rectifies this,
instead making the assumption that all electricity used to satisfy Rhode Island’s requirements comes from the grid
average mix, as it does in the LEAP analysis. The second change adjusts for the inclusion of “exported emissions” in
the Rhode Island LEAP analysis. A true consumption-based emission accounting methodology must also reduce the
emissions estimates by an amount which would be associated with electricity exported outside of the ISO-NE
control area (0.15 MT CO2e in 2010). However, not knowing the quantity of exported electricity in 1990, this
adjustment cannot be made retroactively to the 1990 inventory. It must therefore be removed (0.15 MT CO2e added)
from the LEAP analysis in all years.
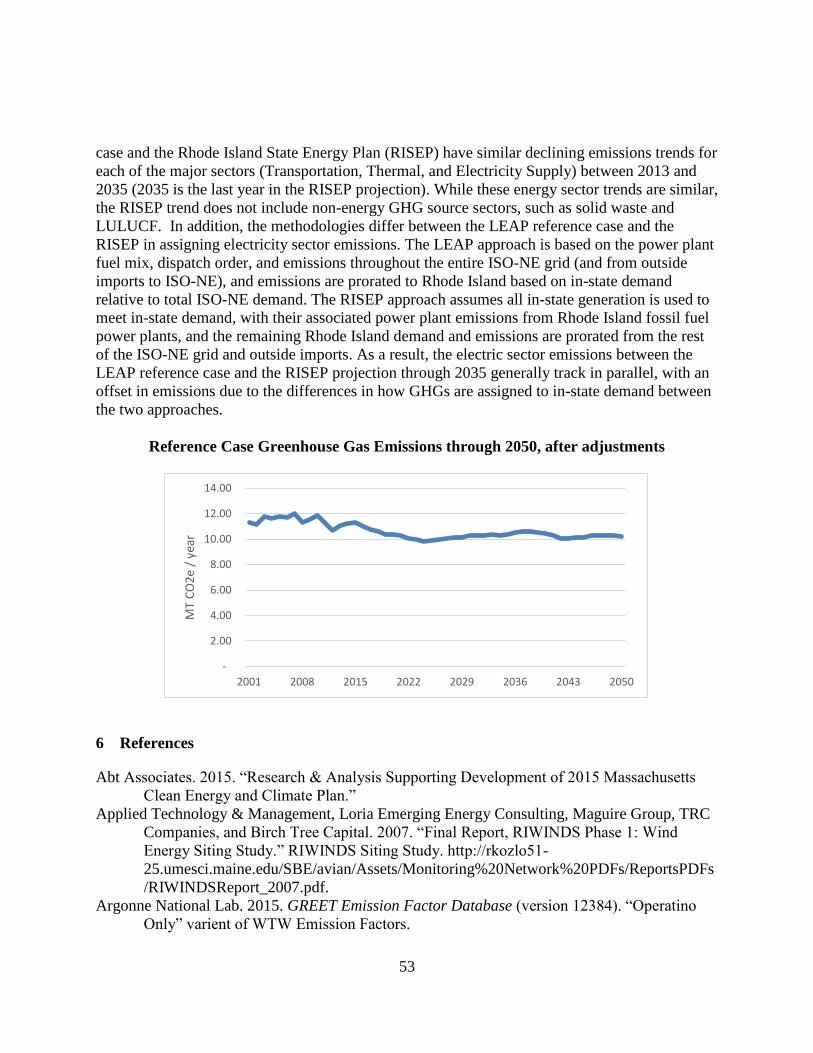
53
case and the Rhode Island State Energy Plan (RISEP) have similar declining emissions trends for
each of the major sectors (Transportation, Thermal, and Electricity Supply) between 2013 and
2035 (2035 is the last year in the RISEP projection). While these energy sector trends are similar,
the RISEP trend does not include non-energy GHG source sectors, such as solid waste and
LULUCF. In addition, the methodologies differ between the LEAP reference case and the
RISEP in assigning electricity sector emissions. The LEAP approach is based on the power plant
fuel mix, dispatch order, and emissions throughout the entire ISO-NE grid (and from outside
imports to ISO-NE), and emissions are prorated to Rhode Island based on in-state demand
relative to total ISO-NE demand. The RISEP approach assumes all in-state generation is used to
meet in-state demand, with their associated power plant emissions from Rhode Island fossil fuel
power plants, and the remaining Rhode Island demand and emissions are prorated from the rest
of the ISO-NE grid and outside imports. As a result, the electric sector emissions between the
LEAP reference case and the RISEP projection through 2035 generally track in parallel, with an
offset in emissions due to the differences in how GHGs are assigned to in-state demand between
the two approaches.
Reference Case Greenhouse Gas Emissions through 2050, after adjustments
6 References
Abt Associates. 2015. “Research & Analysis Supporting Development of 2015 Massachusetts
Clean Energy and Climate Plan.”
Applied Technology & Management, Loria Emerging Energy Consulting, Maguire Group, TRC
Companies, and Birch Tree Capital. 2007. “Final Report, RIWINDS Phase 1: Wind
Energy Siting Study.” RIWINDS Siting Study. http://rkozlo51-
25.umesci.maine.edu/SBE/avian/Assets/Monitoring%20Network%20PDFs/ReportsPDFs
/RIWINDSReport_2007.pdf.
Argonne National Lab. 2015. GREET Emission Factor Database (version 12384). “Operatino
Only” varient of WTW Emission Factors.
-
2.00
4.00
6.00
8.00
10.00
12.00
14.00
2001 2008 2015 2022 2029 2036 2043 2050
MT
CO
2e
/ ye
ar

54
Bond, Tami C., David G. Streets, Kristen F. Yarber, Sibyl M. Nelson, Jung-Hun Woo, and
Zbigniew Klimont. 2004. “A Technology-Based Global Inventory of Black and Organic
Carbon Emissions from Combustion.” Journal of Geophysical Research: Atmospheres
109 (D14): n/a–n/a. doi:10.1029/2003JD003697.
Brown, Austin, Philipp Beiter, Donna Heimiller, Carolyn Davidson, Paul Denholm, Jennifer
Melius, Anthony Lopez, Dylan Hettinger, David Mulcahy, and Gian Porro. 2015.
“Estimating Renewable Energy Economic Potential in the United States: Methodology
and Initial Results.” National Renewable Energy Laboratory.
http://www.nrel.gov/docs/fy15osti/64503.pdf.
E3. 2015. “California PATHWAYS: GHG Scenario Results.” Updated April 6, 2015.
ENE. 2013. “Rhode Island State Energy Plan Business-As-Usual Forecast.”
http://www.energy.ri.gov/documents/energyplan/ENE_RISEP_Business_As_Usual_Fore
cast.pdf.
Environment and Climate Change Canada. 2016. “National Inventory Report 1990-2014:
Greenhouse Gas Sources and Sinks in Canada.”
http://unfccc.int/files/national_reports/annex_i_ghg_inventories/national_inventories_sub
missions/application/zip/can-2016-nir-14apr16.zip.
European Environment Agency. 2013. “EMEP/EEA Air Pollutant Emission Inventory
Guidebook - 2013.” http://www.eea.europa.eu/publications/emep-eea-guidebook-2013.
Heaps, C.G. 2016. Long-Range Energy Alternatives Planning (LEAP) System (version
2015.0.30.0). Somerville, MA, US: Stockholm Environment Institute.
www.energycommunity.org.
ICCT (International Council on Clean Transportation). 2016. “International Civil Aviation
Organizationʼs CO2 Standard for New Aircraft.” http://www.theicct.org/icao-proposed-
co2-standard-update-201602.
Intergovernmental Panel on Climate Change. 2016. “Intergovernmental Panel on Climate
Change Database on Greenhouse Gas Emission Factors (IPCC-EFDB).” http://www.ipcc-
nggip.iges.or.jp/EFDB/main.php.
International Energy Agency. 2012. Energy Technology Perspectives 2012. Paris: Organisation
for Economic Co-operation and Development. http://www.oecd-
ilibrary.org/content/book/energy_tech-2012-en.
ISO New England. 2014a. “CELT Report: 2014-2023 Forecast Report of Capacity, Energy,
Loads, and Transmission.” http://iso-ne.com/static-
assets/documents/trans/celt/report/2014/2014_celt_report.xls.
———. 2014b. “Transmission Planning Technical Guide Appendix C: Guidelines for Treatment
of Demand Resources in System Planning Analysis.” http://www.iso-ne.com/static-
assets/documents/committees/comm_wkgrps/prtcpnts_comm/pac/plan_guides/plan_tech_
guide/technical_planning_guide_appendix_c_guidelines_for_treatment_of_demand_reso
urces_in_system_planning_analysis.pdf.
———. 2015a. “2015 Regional System Plan.” http://www.iso-ne.com/static-
assets/documents/2015/11/rsp15_final_110515.docx.
———. 2015b. “CELT Report: 2015-2024 Forecast Report of Capacity, Energy, Loads, and
Transmission.” http://iso-ne.com/static-assets/documents/2015/05/2015_celt_report.pdf.

55
———. 2015c. “Summary of Historical Installed Capacity Requirements and Related Values.”
http://iso-ne.com/static-assets/documents/2015/12/summary_of_icr_values_vii.xlsx.
———. 2016a. “2016 Energy-Efficiency Forecast 2020-2025.” http://iso-ne.com/static-
assets/documents/2016/04/ISO_NE_2016_EE_Forecast_2020_2025_Final.pdf.
———. 2016b. “CELT Report: 2016-2025 Forecast Report of Capacity, Energy, Loads, and
Transmission.” http://iso-ne.com/static-assets/documents/2016/05/2016_celt_report.xls.
———. 2016c. “Interconnection Request Queue 05-01-16.” http://iso-ne.com/static-
assets/documents/2014/09/interconnection_request_queue.xls.
———. 2016d. “ISO New England Seasonal Claimed Capability (SCC) Report as of 2/1/2016.”
http://www.iso-ne.com/static-assets/documents/2016/02/scc_february_2016.xls.
———. 2016e. “Net Energy and Peak Load by Source.” http://iso-ne.com/static-
assets/documents/markets/hstdata/rpts/net_eng_peak_load_sorc/energy_peak_source.xls.
Lopez, Anthony, Billy Roberts, Donna Heimiller, Nate Blair, and Gian Porro. 2012. “U.S.
Renewable Energy Technical Potentials: A GIS-Based Analysis.” National Renewable
Energy Laboratory. http://www.nrel.gov/docs/fy12osti/51946.pdf.
Meister Consultants Group. n.d. “Rhode Island Thermal Market Segmentation Summary.”
Musher, Danny. 2016. “Data Sources for Task 3,” July 20.
National Grid. 2010. “Renewable Gas — Vision for a Sustainable Gas Network.”
https://www9.nationalgridus.com/non_html/ng_renewable_wp.pdf.
———. 2016. “Energy Efficiency Program Basic Data,” June 27.
Northeast States for Coordinated Air Use Management. 2013. “Greenhouse Gas (GHG)
Emission Inventories for Rhode Island for 1990, 2010, and 2020.”
RGGI Inc. 2014. “Second Control Period Interim Adjustment for Banked Allowances
Announcement.” http://www.rggi.org/docs/SCPIABA.pdf.
———. 2016a. “Regional Greenhouse Gas Initiative Program Design.”
https://www.rggi.org/design/overview.
———. 2016b. “2015 Allowance Allocation.” http://www.rggi.org/design/overview/allowance-
allocation/2015-allowance-allocation.
Rhode Island Division of Planning. 2006. “Land Use 2025 – Rhode Island State Land Use
Policies and Plan.” http://www.planning.ri.gov/documents/121/landuse2025.pdf.
———. 2013. “Rhode Island Population Projections 2010 - 2040.”
———. 2014. “Solid Waste 2038: Rhode Island Comprehensive Solid Waste Management
Plan.”
http://www.planning.ri.gov/documents/LU/2015/SolidWaste2038_Approved_05142015_
Final.pdf.
———. 2015a. “Energy 2035: Rhode Island State Energy Plan.”
http://www.planning.ri.gov/documents/LU/energy/energy15.pdf.
———. 2015b. “Solid Waste 2038: Rhode Island Comprehensive Solid Waste Management
Plan.”
http://www.planning.ri.gov/documents/LU/2015/SolidWaste2038_Approved_05142015_
Final.pdf
———. 2016. “Rhode Island Statewide Model Update.” Appendix IV.
56
Rhode Island Department of Labor and Training, Labor Market Information. 2014. “Rhode
Islandʼs Employment Projections by Major Industry Division.”
Rhode Island Public Utilities Commission. 2016. “Annual RES Compliance Report For
Compliance Year 2014.” http://www.ripuc.org/utilityinfo/RES-2014-AnnualReport.pdf.
Rhode Island Geographic Information System (RIGIS). 1993. “Land Cover & Land Use - 1988.”
———. 2005. “Land Cover & Land Use - 1995.”
———. 2007. “Land Cover & Land Use - 2003/2004.”
———. 2015. “Land Cover & Land Use - 2011.”
Rhode Island Office of Energy Resources. 2016. “2015 Rhode Island Renewable Energy Data
Report.”
Schlömer, Steffen, Thomas Bruckner, Lew Fulton, Edgar Hertwich, Alan McKinnon, Daniel
Perczyk, Joyashree Roy, et al. 2014. “Annex III: Technology-Specific Cost and
Performance Parameters.” In Climate Change 2014: Mitigation of Climate Change.
Contribution of Working Group III to the Fifth Assessment Report of the
Intergovernmental Panel on Climate Change [Edenhofer, O., R. Pichs-Madruga, Y.
Sokona, E. Farahani, S. Kadner, K. Seyboth, A. Adler, I. Baum, S. Brunner, P.
Eickemeier, B. Kriemann, J. Savolainen, S. Schlömer, C. von Stechow, T. Zwickel and
J.C. Minx (Eds.)]. Cambridge University Press, Cambridge, United Kingdom and New
York, NY, USA.
State of Rhode Island. 2006. The Comprehensive Energy Conservation, Efficiency and
Affordability Act of 2006.
http://webserver.rilin.state.ri.us/BillText06/SenateText06/S2903Baa.htm.
———. 2011. Net Metering. http://webserver.rilin.state.ri.us/Statutes/TITLE39/39-26.4/39-26.4-
2.HTM.
———. 2013. Biodiesel Heating Oil Act of 2013.
http://webserver.rilin.state.ri.us/Statutes/title23/23-23.7/23-23.7-4.HTM.
———. 2016. Relating to Public Utilities and Carrier - Renewable Energy.
http://webserver.rilin.state.ri.us/BillText/BillText16/SenateText16/S2185A.pdf.
———. 2015. “Rhode Island State Guide Plan.” http://www.planning.ri.gov/planning/.
Tidball, Rick, Joel Bluestein, Nick Rodriguez, and Stu Knoke. 2010. “Cost and Performance
Assumptions for Modeling Electricity Generation Technologies.” Subcontract Report
NREL/SR-6A20-48595. National Renewable Energy Laboratory.
http://www.nrel.gov/docs/fy11osti/48595.pdf.
U.S. Census Bureau. 2015. “2014 American Community Survey 1-Year Estimates.” DP04:
Selected Housing Characteristics.
http://factfinder.census.gov/faces/tableservices/jsf/pages/productview.xhtml?src=bkmk.
U.S. Energy Information Administration. 2014a. “Commercial Demand Module of the National
Energy Modeling System: Model Documentation 2014.”
http://www.eia.gov/forecasts/aeo/nems/documentation/commercial/pdf/m066(2014).pdf.
———. 2014b. “Model Documentation Report: Industrial Demand Module of the National
Energy Modeling System.”
http://www.eia.gov/forecasts/aeo/nems/documentation/industrial/pdf/m064(2014).pdf.

57
———. 2014c. “Residential Demand Module of the National Energy Modeling System: Model
Documentation 2014.”
https://www.eia.gov/forecasts/aeo/nems/documentation/residential/pdf/m067(2014).pdf.
———. 2015a. “Form EIA-860 Detailed Data, 2014.”
https://www.eia.gov/electricity/data/eia860/xls/eia8602014.zip.
———. 2015b. “Form EIA-923 Detailed Data with Previous Form Data (EIA-906/920), 2014.”
www.eia.gov/electricity/data/eia923/.
———. 2015c. “State Energy Data System.” https://www.eia.gov/state/seds/.
———. 2015d. “NEMS Commercial Module Output.”
———. 2015e. “NEMS Industrial Module Output.”
———. 2015f. “NEMS Residential Module Output.”
———. 2015g. “Annual Energy Outlook 2015 with Projections to 2040.” DOE/EIA-
0383(2015). Washington, DC. http://www.eia.gov/forecasts/aeo/pdf/0383(2015).pdf.
———. 2015h. “Appendix A: Handling of Federal and Selected State Legislation and
Regulations in the AEO.”
http://www.eia.gov/forecasts/aeo/assumptions/pdf/appendix_a.pdf.
———. 2015i. “Assumptions to Annual Energy Outlook 2015.”
http://www.eia.gov/outlooks/aeo/assumptions/pdf/0554(2015).pdf .
———. 2016a. “Environment: State Carbon Dioxide Emissions.”
http://www.eia.gov/environment/emissions/state/.
———. 2016b. “Electricity: Detailed State Data.” http://www.eia.gov/electricity/data/state/.
U.S. Environmental Protection Agency. 2015a. “Emissions & Generation Resource Integrated
Database (eGRID), Year 2012 Data.” https://www.epa.gov/energy/egrid.
———. 2015b. State Inventory and Projection Tool (version August 2015 Energy Update).
http://www3.epa.gov/statelocalclimate/resources/tool.html.
———. 2016a. “MOVES and Other Mobile Source Emissions Models.”
https://www.epa.gov/moves.
———. 2016b. “Web Factor Information Retrieval System (WebFIRE).”
https://cfpub.epa.gov/webfire/.
U.S. Forest Service. 2010. “FORCARB2: An updated version of the U.S. Forest Carbon Budget
Model.” http://www.nrs.fs.fed.us/pubs/35613.

57
APPENDIX 2 – SCENARIO MODELING ASSUMPTIONS AND RESULTS

Rhode Island Greenhouse Gas (GHG) Emissions Reduction Study
LEAP Analysis of Rhode Island GHG Mitigation Scenarios:
Summary of Results
December 30, 2016
This memorandum presents the summary results of the Rhode Island greenhouse gas (GHG)
mitigation scenarios analyzed in the Long-range Energy Alternative Planning (LEAP) system.
The memorandum is divided into the following sections: 1) Description of building block
measures used in mitigation scenarios; 2) Descriptions of the selected scenarios, and 3) Scenario
emission results.
Recognizing the scale of the transformations necessary to lower GHG emissions by 80% below
1990 levels by 2050, we followed a two-phase process to identify and analyze major GHG
mitigation options as building blocks for five overall 80% GHG reduction pathway scenarios to
be analyzed by LEAP. In Phase 1, we identified a set of initial core mitigation options with
potential to reduce GHG emissions in the most important source sectors in Rhode Island. With
input from the EC4 Technical Committee and State Team, we defined and modeled a high-
investment/penetration approach and performed individual LEAP runs for each select mitigation
option. These initial mitigation options were not intended to demonstrate attaining, individually
or in combination, Rhode Island’s 2050 target, but were to inform the EC4 Technical
Committee, State Project Team, and stakeholders of the partial effects in and among this core set
of mitigation options. This in turn helped inform decisions for Phase 2 in which we built five
mitigation pathway scenarios aimed at meeting Rhode Island’s 80% GHG reduction target.
The mitigation options identified in Phase 1 are the 10 measures listed below:
1. Electric, natural gas, and heating oil energy efficiency
2. Reduction of on-road vehicle miles traveled (VMT)
3. Utility-scale renewable electricity
4. Distributed renewable electricity (rooftop solar photovoltaics)
5. Additional imports of low-carbon electricity
6. Nuclear electricity (license renewal for existing plants)
7. Electric heat in buildings
8. Biofuels/biomass heat in buildings
9. Electric vehicles
10. Advanced biofuels for transportation
In the following sections, we describe these Phase 1 measures and how they were combined into
the five mitigation scenarios of Phase 2 for the LEAP analysis. We show a graphical presentation
of the GHG reduction trajectories out to 2050 for each scenario, including how the reduction
trajectories vary between scenarios due to different assumed penetration levels of key measures.

59
The trajectories are also plotted against Rhode Island’s mid-term 2020 and 2035 goals and 2050
long-term GHG reduction target, which are the reference points for tracking future progress.
I. Descriptions of Measures in LEAP Scenarios
1. Phase 1 building block measures in LEAP scenarios
A. Electric and natural gas efficiency
Description:
Savings of electricity, natural gas and distillate heating oil are added to the Rhode Island LEAP
model in a “top-down” manner – this means that the savings are not attributed directly to a
particular end-use or technological improvement, but are applied in aggregate to a sector or
subsector as a whole. As a result, the representation of energy efficiency in the model adjusts
final energy demands which would otherwise be calculated from a baseline built purely on the
Annual Energy Outlook 2015 (AEO2015) (U.S. Energy Information Administration 2015b). The
AEO2015 reference trajectory demonstrates very little autonomous improvement in energy
efficiency.
Any fuel savings incurred under Rhode Island’s least-cost procurement (LCP) law in 2013 or in
prior years is necessarily captured in historical energy consumption data from the State Energy
Data System (SEDS) (U.S. Energy Information Administration 2015a). However, since the final
year of historical SEDS data, National Grid has continued to record actual fuel savings which
can be attributed to in-state energy efficiency programs. The reference case must therefore be
modified accordingly, to explicitly account1 for any electricity and gas savings from 2014 and
2015. Energy savings are reported separately for each major efficiency program, and are
summarized on an annual basis in National Grid’s year-end reports (National Grid 2015;
National Grid 2016). Year-end reports also provide updated short-term energy efficiency
projections through the end of 2017.
Although year-end efficiency reports describe newly-added energy savings from one year to the
next, they do not include an estimate for the total energy savings in a given year, which is the
result of newly-added efficiency measures from previous years. Energy savings which are
attributable to each National Grid efficiency program may be assigned an approximate number
of years during which the measure is expected to persist, based on the average lifetime of
efficient technologies deployed under the program. While National Grid does not publically
maintain a bottom-up database of each efficient technology sold in each year (or the efficiency of
the less-efficient device which it replaces), the names of each program may be used to estimate
the end-use which it targets. Each National Grid efficiency program is grouped into one of six
“aggregate programs,” with average lifetimes given in Table 1 and Table 2.
Table 1: Aggregate program name, sector or end-use and average number of active years (lifetime) for electricity-
saving measures deployed under major National Grid efficiency programs.
1 As described in the Reference Case Memo, Rhode Island’s LCP is not embedded in the Annual Energy Outlook’s
final demand projections.

60
Applicable Sector and End-Use in LEAP Lifetime Aggregate Program National Grid Program
Single Family Residential Heating and Cooling
11 Single Family Weatherization or New Construction
Single Family - Income Eligible Services
Residential New Construction
EnergyWise
Multi-Family Residential Heating and Cooling
11 Multi-Family Weatherization
Income Eligible Multifamily
EnergyWise Multifamily
All Residential 11 Residential Products
Energy Star HVAC
Energy Star Lighting
Energy Star Products
All Residential 1 Residential Behavior Home Energy Reports
All Commercial 12 Commercial Weatherization of New Construction
Large Commercial New Construction
Large Commercial Retrofit
All Commercial 12 Commercial Products Small Business Direct Install
Table 2: Aggregate program name, sector or end-use and average number of active years (lifetime) for natural gas-
saving measures deployed under major National Grid efficiency programs.
Applicable Sector and End-Use in LEAP Lifetime Aggregate Program National Grid Program
Single Family Residential Heating and Cooling
21 Single Family Weatherization or New Construction
Single Family - Income Eligible Services
Residential New Construction
EnergyWise
Multi-Family Residential Heating and Cooling
16 Multi-Family Weatherization
Income Eligible Multifamily
EnergyWise Multifamily
All Residential 17 Residential Products Energy Star HVAC
All Residential 1 Residential Behavior Home Energy Reports
All Commercial 11 Commercial Weatherization of New Construction
Large Commercial New Construction
Large Commercial Retrofit
All Commercial 13 Commercial Products Small Business Direct Install
Each new kilowatt-hour of electricity or BTU of natural gas which is saved under each program
is assumed to persist for the number of years described in the tables above, before retiring
completely. As described in the Reference Case memo (Northeast States for Coordinated Air Use
Management, Stockholm Environment Institute US, and Abt Associates 2016), newly-added
savings are taken from 2014/2015 real savings and 2016/2017 estimates (National Grid 2015;
National Grid 2016). Beginning in 2018, these estimates are followed by projected savings
through 2024 in the Business-as-Usual scenario of the Rhode Island State Energy Plan (RISEP)
(ENE 2013), which are given as a percentage of 2009 sales of electricity and natural gas,
respectively. Delivered distillate heating oil savings are not explicitly broken out in National
Grid year-end reporting. Instead total annual heating oil savings under the Reference Case are

61
established beginning in 2014 using the same newly-added percentage of 2009 sales that is
assigned to natural gas.
Technology/Measure Potential:
Continuing the trend in newly-added energy efficiency established by the Reference Case, the
electricity and natural gas efficiency measure includes additional newly-added savings from
2025 – 2050. These new savings are also expressed as a percentage of 2009 sales in electricity
and natural gas (also heating oil) through 2035, taken from the RISEP (ENE 2013). Newly added
savings in remaining years are also assumed, though identifying the mechanisms by which these
savings can be achieved falls outside of this analysis. Table 3 summarizes the newly-added
savings in each year. Total annual energy savings in each fuel are captured in the figures that
follow, with energy savings from the Reference Case provided for context.
Table 3: Energy savings added in 2018 and beyond, under the electricity and natural gas efficiency scenario. Prior
savings given by National Grid’s short-term projections. Unless otherwise stated, 2025 – 2035 savings are taken
from the RISEP Business-as-Usual (BAU) scenario.
Fuel 2009 Sales Newly-added savings, (% of 2009 sales)
2018 - 2020 2021 - 2024 2025 - 2030 2031 - 2035 2036-2040 2041 - 2050
Electricity 7494594 MWh
2.7% 2.0%* 1.5% 2.5% 2.7%
Natural Gas 39001480 MMBTU
1.0% 0.5% 1.5%** 2.3%
Distillate Fuel Oil 22532000 MMBTU
1.0% 0.5% 0.5-0.9%***
*New electricity savings are 2.7% of 2009 sales in 2021.
**New natural gas savings are increased from those expected under RISEP’s BAU from 2031 – 2035.
***Heating oil savings are linearly extrapolated to 0.9% of 2009 sales by 2050.
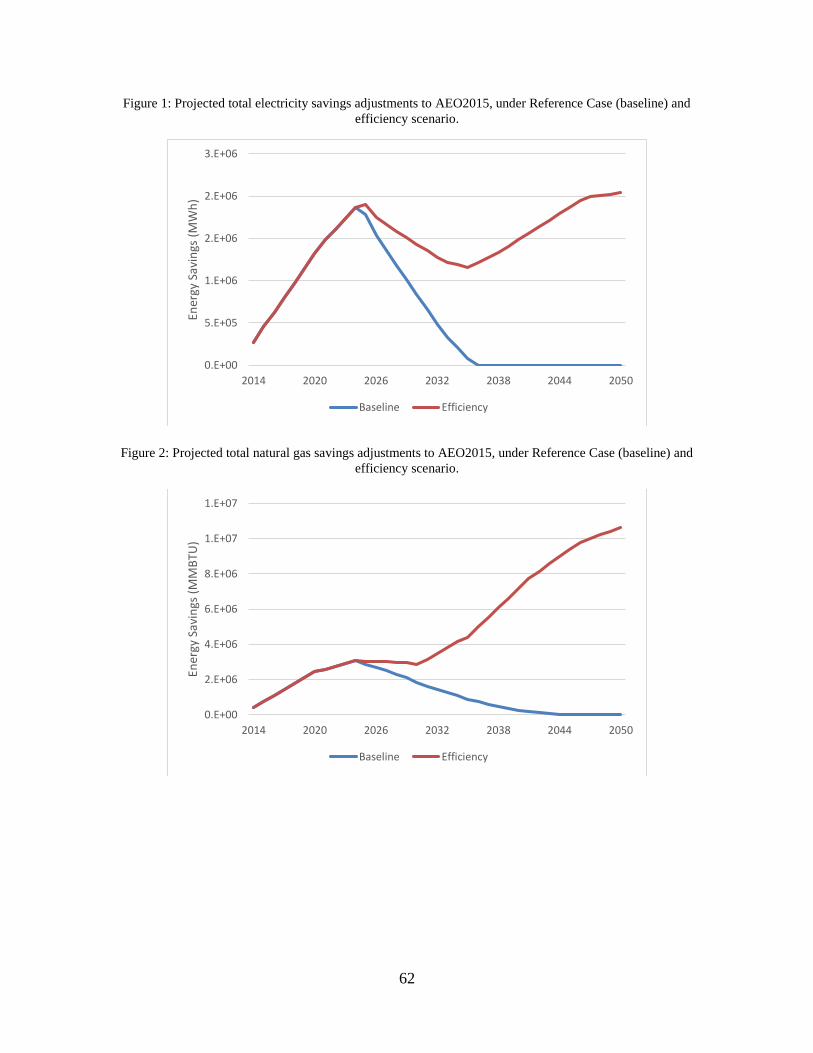
62
Figure 1: Projected total electricity savings adjustments to AEO2015, under Reference Case (baseline) and
efficiency scenario.
Figure 2: Projected total natural gas savings adjustments to AEO2015, under Reference Case (baseline) and
efficiency scenario.
0.E+00
5.E+05
1.E+06
2.E+06
2.E+06
3.E+06
2014 2020 2026 2032 2038 2044 2050
Ener
gy S
avin
gs (
MW
h)
Baseline Efficiency
0.E+00
2.E+06
4.E+06
6.E+06
8.E+06
1.E+07
1.E+07
2014 2020 2026 2032 2038 2044 2050
Ener
gy S
avin
gs (
MM
BTU
)
Baseline Efficiency

63
Figure 3: Projected total distillate fuel oil savings adjustments to AEO2015, under Reference Case (baseline) and
efficiency scenario.
Information sources:
1. ENE. 2013. “Rhode Island State Energy Plan Business-As-Usual Forecast.”
http://www.energy.ri.gov/documents/energyplan/ENE_RISEP_Business_As_Usual_Forec
ast.pdf.
2. National Grid. 2015. “2014 Energy Efficiency Year-End Report.” RIPUC Docket No.
4451.
3. ———. 2016. “2015 Energy Efficiency Year-End Report.” RIPUC Docket No. 4527.
4. Northeast States for Coordinated Air Use Management, Stockholm Environment Institute
US, and Abt Associates. 2016. “Rhode Island Greenhouse Gas (GHG) Emissions
Reduction Study: Developing the Reference Case in the Long-Range Energy Alternatives
Planning (LEAP) Framework.” Draft version 13.
5. U.S. Energy Information Administration. 2015a. “State Energy Data System.”
https://www.eia.gov/state/seds/.
6. ———. 2015b. “Annual Energy Outlook 2015 with Projections to 2040.” DOE/EIA-
0383(2015). Washington, DC. http://www.eia.gov/forecasts/aeo/pdf/0383(2015).pdf.
B. VMT reductions
Description:
Estimated annual vehicle miles traveled (VMT) during 2015 in Rhode Island is 7,445 million,
and is projected to grow to 7,810 million by 2030 and 7,899 million by 2040 (Rhode Island
Statewide Planning Program 2016). VMT in light-duty passenger vehicles makes up the majority
of total VMT in Rhode Island, and is the focus of VMT reduction strategies for this analysis.
0.E+00
5.E+05
1.E+06
2.E+06
2.E+06
3.E+06
2014 2020 2026 2032 2038 2044 2050
Ener
gy S
avin
gs (
MM
BTU
)
Baseline Efficiency
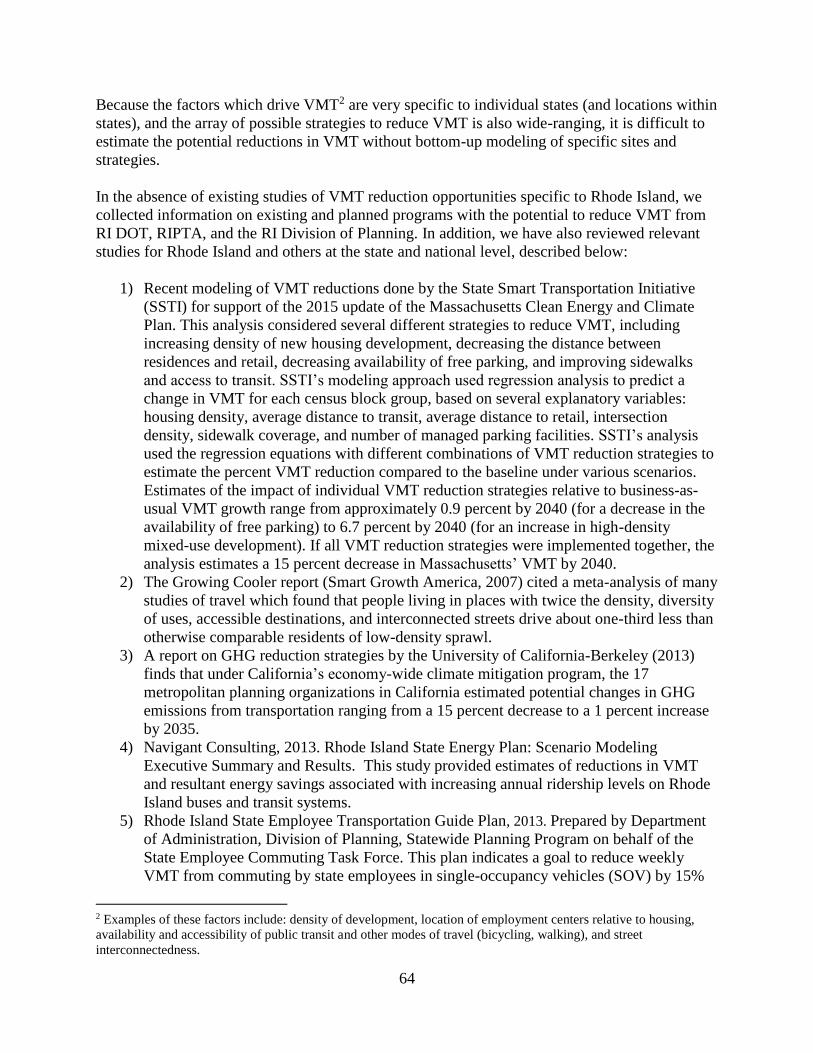
64
Because the factors which drive VMT2 are very specific to individual states (and locations within
states), and the array of possible strategies to reduce VMT is also wide-ranging, it is difficult to
estimate the potential reductions in VMT without bottom-up modeling of specific sites and
strategies.
In the absence of existing studies of VMT reduction opportunities specific to Rhode Island, we
collected information on existing and planned programs with the potential to reduce VMT from
RI DOT, RIPTA, and the RI Division of Planning. In addition, we have also reviewed relevant
studies for Rhode Island and others at the state and national level, described below:
1) Recent modeling of VMT reductions done by the State Smart Transportation Initiative
(SSTI) for support of the 2015 update of the Massachusetts Clean Energy and Climate
Plan. This analysis considered several different strategies to reduce VMT, including
increasing density of new housing development, decreasing the distance between
residences and retail, decreasing availability of free parking, and improving sidewalks
and access to transit. SSTI’s modeling approach used regression analysis to predict a
change in VMT for each census block group, based on several explanatory variables:
housing density, average distance to transit, average distance to retail, intersection
density, sidewalk coverage, and number of managed parking facilities. SSTI’s analysis
used the regression equations with different combinations of VMT reduction strategies to
estimate the percent VMT reduction compared to the baseline under various scenarios.
Estimates of the impact of individual VMT reduction strategies relative to business-as-
usual VMT growth range from approximately 0.9 percent by 2040 (for a decrease in the
availability of free parking) to 6.7 percent by 2040 (for an increase in high-density
mixed-use development). If all VMT reduction strategies were implemented together, the
analysis estimates a 15 percent decrease in Massachusetts’ VMT by 2040.
2) The Growing Cooler report (Smart Growth America, 2007) cited a meta-analysis of many
studies of travel which found that people living in places with twice the density, diversity
of uses, accessible destinations, and interconnected streets drive about one-third less than
otherwise comparable residents of low-density sprawl.
3) A report on GHG reduction strategies by the University of California-Berkeley (2013)
finds that under California’s economy-wide climate mitigation program, the 17
metropolitan planning organizations in California estimated potential changes in GHG
emissions from transportation ranging from a 15 percent decrease to a 1 percent increase
by 2035.
4) Navigant Consulting, 2013. Rhode Island State Energy Plan: Scenario Modeling
Executive Summary and Results. This study provided estimates of reductions in VMT
and resultant energy savings associated with increasing annual ridership levels on Rhode
Island buses and transit systems.
5) Rhode Island State Employee Transportation Guide Plan, 2013. Prepared by Department
of Administration, Division of Planning, Statewide Planning Program on behalf of the
State Employee Commuting Task Force. This plan indicates a goal to reduce weekly
VMT from commuting by state employees in single-occupancy vehicles (SOV) by 15%
2 Examples of these factors include: density of development, location of employment centers relative to housing,
availability and accessibility of public transit and other modes of travel (bicycling, walking), and street
interconnectedness.

65
by January 2012, 25% by January 2014, and by 35% by January 2016. While focused on
strategies to reduce the commuting VMT of RI state employees, the plan describes
options for VMT reductions which can be deployed at the state level, including: public
transportation, bicycles, carpools, modified work schedules, and technology-based
options such as telecommuting.
6) The consulting firm VHB has built a transportation demand model (TDM) for Rhode
Island which can be used to run scenarios reflecting mode-shifting from vehicle travel to
increased use of bus and transit. The RI Division of Planning used output from RI’s TDM
to model a scenario that increases transit ridership from the current 1.69% of all trips to
5.00% of all trips by 2040. This corresponded to a 3.4% reduction in VMT relative to the
2040 VMT “business-as-usual” baseline and a 0.5% reduction in VMT relative to 2015.
Technology/Measure potential:
VMT reductions that could be achieved by a suite of the following VMT reduction strategies are
listed below, but we note that the percent VMT reduction achievable by each VMT reduction
strategy is poorly quantified.
Infrastructure Development Strategies o Expansion of bus route network
o Development of new bikeway infrastructure
Pricing Strategies o General parking fees
o Mileage fees
o Programs that require employee parking fees
o Programs that incentivize employers pay employees to give up parking spaces
Demand Management Strategies o Incentives to make work places bike friendly and transit friendly (e.g. installation
of bike racks, employer subsidies for public transportations)
Transit Improvement Strategies o Expansion of transit signal priority (TSP) systems
o Development of transit stations and improvements in transit reliability
o Expansion of van pooling program
Smart Growth Strategies o Incentives or requirements supporting mixed-use development
o Incentives that promote high density development
o Improvement of sidewalk coverage in urban areas
o Improvement of street network connectivity
Information sources:
1. Costs for Pedestrian and Bicycle Infrastructure Improvements. Pedestrian and Bicycle
Information Center (October 2013).
2. Massachusetts Clean Energy and Climate Plan for 2020, 2015 Update. Massachusetts
Executive Office of Energy and Environmental Affairs (updated December 2015).
3. Growing Cooler: The Evidence on Urban Development and Climate Change. Smart
Growth America (released September 2007).

66
4. Near-Term Transportation Energy and Climate Change Strategies: Interregional
Transportation Related Greenhouse Gas Emissions Reduction Strategies. University of
California, Berkeley, Transportation Sustainability Research Center (December 2013).
5. Smart Growth America, 2011. “Rhode Island Smart Transportation: Save Money and
Grow the Economy.” Available at:
http://www.smartgrowthamerica.org/documents/smart-transportation-rhode-island.pdf
6. Rhode Island State Employee Transportation Guide Plan, 2013. Prepared by Department
of Administration, Division of Planning, Statewide Planning Program on behalf of the
State Employee Commuting Task Force.
7. Navigant Consulting, 2013. Rhode Island State Energy Plan: Scenario Modeling
Executive Summary and Results.
8. US Federal Transit Administration (FTA), 2016. "Before and After Studies Of New Starts
Projects Report to Congress.” 2010 – 2015. https://www.transit.dot.gov/funding/grant-
programs/capital-investments/and-after-studies-new-starts-projects
9. American Public Transportation Association (APTA), 2015. “U.S. Average New Vehicle
Costs for 2014 and 2015 Vehicles by Type.”
http://www.apta.com/resources/statistics/Documents/Table23-VehCostTransitLength-
2015-Vehicle.pdf
10. Rhode Island Statewide Planning Program, 2016. “Rhode Island Statewide Model
Update.” http://www.planning.ri.gov/documents/trans/travel/tp166.pdf
C. Utility-scale renewable electricity
Description:
We follow the California PATHWAYS 2015 updated analysis as a guide to develop a high
penetration scenario for utility-scale renewables in LEAP. As in this work for Rhode Island, the
California PATHWAYS effort developed 80% GHG reduction scenarios by 2050 in California
relative to the state’s 1990 emissions. Renewable generation sources accounted for 75-86% of
the capacity installed on the California grid in 2050 and over 80% of annual generation. Using
this as a benchmark, we assumed renewable energy penetration levels consistent with the
California PATHWAYS analysis.
We used an NREL 2012 assessment of technical potential in the ISO-NE region to develop a
renewable energy future by resource type that provides about 85% of total electricity generation
by 2050. In the Phase 1 measure, we assumed generation shares of about 35% from utility-scale
solar, 23% from onshore wind, 20% from offshore wind, and 5% collectively from wood/waste
biomass, small hydro, and landfill gas. The renewables generation largely displaced natural gas
in the measure, with the remaining balance supplied largely by existing nuclear generation.
The renewable shares are illustrative as their technical generation potential (GWh/yr) given in
the NREL 2012 assessment indicates some renewable generation sources (e.g., rural utility-scale
PV and offshore wind) are well in excess of current electricity demand (see Table 4). Therefore,
there is some room for varying the shares across renewable generation types. For this example,
we assumed onshore wind as having a relatively greater share of generation due to its current
lower cost relative to most other renewable options. These shares, however, could be varied in

67
future analyses to reflect potential policy goals (see, for example, the separate discussion in the
following section on distributed renewable electricity with a focus on rooftop solar PV).
Assumptions and data gaps:
Technical potential matched to meet demand does not consider system integration of a large
amount of intermittent renewables into grid. Sensitivity analysis could be performed to probe
alternative ways to address system reliability. One approach would be to over-build renewable
capacity across a large region that would require lower levels of grid storage or generation
backup (e.g., battery storage, residual natural gas combustion). A second approach is to build
out renewables to match demand with greater levels of grid storage, such as batteries. These
sensitivity scenarios could provide a relative comparison of costs from the two approaches, but
are not the subject of this analysis.
Technology or Measure Potential:
Technical potentials are taken from NREL (2012), and shown in the table below relative to ISO-
New England annual demand circa 2014 (GWh/yr). The table shows there is a large technical
potential for renewable generation in aggregate across the ISO-New England region relative to
current demand (circa 2014). This indicates that there is the possibility of many differing
combinations of renewable generation mixes for Rhode Island than could be assumed in the
limited number of LEAP scenarios evaluated in this analysis.
Table 4: Technical potential (GWh/yr) for renewable generation in New England relative
to ISO-NE demand, circa 2014.
Renewable Technology Technical potential (GWh/yr) % of ISO-NE
demand, ~2014
Urban Utility-Scale PV 35613 29.5%
Rural Utility-Scale PV 3155627 2610.0%
Onshore Wind 45264 37.4%
Offshore Wind 1561442 1291.4%
Biopower-solid 7402 6.1%
Biopower-gaseous 2710 2.2%
Hydropower 9546 7.9%
Information sources:
1. E3, California PATHWAYS: GHG Scenario Results (updated April 6, 2015).
2. Lazard’s Levelized Cost of Energy Analysis—Version 9.0, (November 2015).
3. NREL. "U.S. Renewable Energy Technical Potentials: A GIS-Based Analysis." NREL/TP-
6A20-51946. Golden, CO: National Renewable Energy Laboratory (2012).
D. Distributed renewable electricity
Description:
This measure is a variation to the utility-scale renewables measure. In this measure, some utility-
scale renewable energy capacity is replaced with distributed renewables, which may have higher
installation costs relative to utility-scale projects. We examine it separately, however, because

68
while costs may be higher, it has the potential for more local economic benefits (e.g., jobs) as the
resource is largely driven through local installations using local labor. Utility-scale renewables
are typically located in more remote areas, which may also be often out-of-state.
Despite the northern latitude, rooftop solar PV has a relatively large technical potential across
New England relative to electricity demand, based on a 2016 NREL report. The NREL report
notes that even though solar is a below-average resource in New England compared to other U.S.
regions, the amount of generation needed is offset by the New England states’ below average
per-capita electricity consumption. Within Rhode Island, NREL estimates a technical potential
for rooftop solar PV generation in an amount greater than 55% of the state’s total electricity sales
in 2013. The New England states as a whole have the technical potential to generate electricity
from rooftop solar PV in an amount greater than 50% of the region’s 2013 electricity sales
(NREL 2016).
For LEAP modeling, we replaced 35% of renewable generation assumed in the previous utility-
scale renewables measure with rooftop solar PV generation by 2050. This amount of solar PV
generation is about 25-30% of total generation from all electricity generation sources in 2050.
We chose this level of penetration as an example of a reasonably aggressive goal that might be
targeted through policy incentives as a local economic development strategy.
Assumptions and data gaps:
Technical potential is based on PV module performance of 16%. It would be higher/lower if
module performance is assumed higher/lower.
Potential is based only on existing, suitable roof tops. It does not include ground-mounted PV.
Technical potential would be greater if installing on less suitable roof area, mounting over open
spaces like parking lots, or by integrating PVs into building facades.
The NREL report does not consider system integration of a large amount of solar PV into grid.
Technology/Measure potential:
Within New England, the 2016 NREL report estimates an annual generation technical potential
across all buildings (residential and commercial) of 61,600 GWh from an installed capacity of
53.7 GW. Within Rhode Island, NREL estimated an in-state technical potential across all
buildings of 4,400 GWh from an installed capacity of 3.8 GW. The 2016 NREL report ranked
Rhode Island fourth highest among all states in rooftop PV’s annual generation technical
potential relative to 2013 electricity sales.
Information sources:
1. E3, California PATHWAYS: GHG Scenario Results (updated April 6, 2015)
2. NREL, Rooftop Solar Photovoltaic Technical Potential in the United States: A Detailed
Assessment, Tech. Report NREL/TP-6A20-65298 (January 2016)
http://www.nrel.gov/docs/fy16osti/65298.pdf
3. U.S. DOE SunShot, Photovoltaic System Pricing Trends, 2015 Edition (August 25, 2015)

69
E. Additional imports of low-carbon electricity
Description:
Currently, ISO-NE has two high voltage direct current (HVDC) lines to resources operated by
Hydro Québec rated at 2000 MW and 217 MW of energy capacity. We currently are representing
these in the RI LEAP model. We assume in the scenarios the addition of a hypothetical
transmission line of 1090 MW energy capacity beginning in 2019, and the addition of a second
hypothetical transmission line also of 1090 MW energy capacity in 2025. We set the capacity of
the transmission lines to be equivalent to a recent Northern Pass proposal, but we note that the
addition of transmission lines to bring low-carbon electricity into New England could include
electricity generated by other renewables (wind, solar) across a broader geographical region, and
not be exclusively limited to hydro imports.
Information sources:
1. ISO-NE, Status of Proposed Plan Application (PPA) Applications as of July 27, 2016, http://www.iso-ne.com/system-planning/transmission-planning/proposed-plan-
applications
2. Northern Pass forward nhplan, http://www.northernpass.us/project-overview.htm
F. Nuclear re-licensing
Description:
The US Nuclear Regulatory Commission (NRC) permits license extensions for nuclear
generating units in 20-year increments (U.S. Nuclear Regulatory Commission 2016a). License
extensions have already been granted for Millstone Nuclear Power Station’s Units 2 and 3 in
Connecticut, so that they may continue operating until 2035 and 2045, respectively (U.S.
Nuclear Regulatory Commission 2016b; U.S. Nuclear Regulatory Commission 2016c). This
scenario examines the continued operation of these plants after a second license extension,
enabling the generators to operate well beyond the final year covered by the analysis. New
Hampshire’s Seabrook, the other nuclear plant in the ISO-NE control area, remains operational
through 2050 in the model’s baseline. It is unaffected by this high-penetration scenario.
As part of the re-licensing application, NRC Regulation 10 CFR Part 54 (U.S. Nuclear
Regulatory Commission 2015b) requires plant owners to conduct an aging management review
for age-related degradation of structures, systems and components and to develop an aging
management program to maintain plant safety during the period of extended operation. In
addition to the safety review, NRC Regulation 10 CFR Part 51 (U.S. Nuclear Regulatory
Commission 2015a) requires an environmental review for the license renewal application to
assess potential environmental impacts during extended operation. In the aging management
program, minor and major refurbishment activities are usually identified for the years prior to the
license expiry date. These refurbishments incur expenses and force the unit into an outage period
while the work is being completed.
Assumptions and Data Gaps:

70
Refurbishment work, which begins eight years before the current license expiry, is assumed to be
required as part of the re-licensing process for this scenario. During this period, it is typical for
four separate minor refurbishments called “Current Term Outages” to be conducted (consisting
of electrical cable upgrades, minor structural upgrades, etc.), each lasting 3 – 4 months and
during which time the unit will be unable to operate (U.S. Nuclear Regulatory Commission
1996). A final major refurbishment in the year preceding the issue of a new license will force the
unit offline for up to 9 months, so that critical components such as steam generators or other
vessel internal components may be upgraded.
During each of these outages, the availability of the generating units is reduced. This will reduce
the dispatch of nuclear electricity, requiring other sources of generation to fill the gap. A
summary of modeling assumptions for Millstone’s re-licensing and assumed refurbishment are
outlined in Table .
Table 5: Availability for refurbishment and relicensing of Millstone Nuclear Power Station, units 2 and 3.
Outage Generating Unit
Availability Outage Years
Millstone 2 Millstone 3
Current Term Outage 1 67.5%† 2026 – 2027 2036 – 2037
Current Term Outage 2 67.5%† 2028 – 2029 2038 – 2039
Current Term Outage 3 67.5%† 2030 – 2031 2040 – 2041
Current Term Outage 4 67.5%† 2032 – 2033 2042 – 2043
Major Refurbishment 22.5%‡ 2034 2044 † Based on a 25% reduction of the unit’s normal availability of 90%. ‡ Based on a 75% reduction of the unit’s normal availability of 90%.
Technology or Measure Potential:
The potential of this option is limited to the installed nuclear capacity in the ISO-NE control
area, and which is scheduled to retire during the modeling horizon. Millstone units 2 and 3 are
the only nuclear capacities to be covered by the measure.
Information sources:
1. Canadian Manufacturers & Exporters. 2010. “The Economic Benefits of Refurbishing
and Operating Ontario’s Nuclear Reactors.” https://cna.ca/wp-
content/uploads/2014/05/Refurbishing-Ontario%E2%80%99s-Nuclear-Fleet-a-Major-
Economic-Boost.pdf.
2. U.S. Nuclear Regulatory Commission. 1996. “Generic Aging Lessons Learned (GALL)
Report — Final Report (NUREG-1801, Revision 2).”
https://books.google.com/books?id=Tyw3AQAAMAAJ&pg=PR1#v=onepage&q&f=false
3. ———. 2015a. “Part 51 - Environmental Protection Regulations for Domestic Licensing
and Related Regulatory Functions.” http://www.nrc.gov/reading-rm/doc-
collections/cfr/part051/.
4. ———. 2015b. “Part 54 - Requirements for Renewal of Operating Licenses for Nuclear
Power Plants.” http://www.nrc.gov/reading-rm/doc-collections/cfr/part054/.

71
5. ———. 2016a. “Backgrounder on Reactor License Renewal.”
http://www.nrc.gov/reading-rm/doc-collections/fact-sheets/fs-reactor-license-
renewal.html.
6. ———. 2016b. “Millstone Power Station, Unit 2.” http://www.nrc.gov/info-
finder/reactors/mill2.html.
7. ———. 2016c. “Millstone Power Station, Unit 3.” http://www.nrc.gov/info-
finder/reactors/mill3.html.
G. Electric heat in buildings
Description:
According to EIA data, only 7 percent of homes in New England use electricity as their main
fuel for space heating. Another 24 percent of homes use electricity as a secondary space heating
fuel. For commercial buildings, the EIA data show that while electric heating is commonly
available (approximately 45 percent of square footage in New England uses electricity as a main
or backup heating fuel), it is not used very often, as it supplies only 3 percent of the total heating
load. The majority of homes and businesses in the region use fossil fuels (i.e., No. 2 heating oil,
natural gas, and propane) for space heating. Most of Rhode Island’s current electric heating is
provided by electric resistance heating systems. In this this mitigation option, our focus is on
high efficiency electric heat pump technologies.
Current heating and cooling demand for Rhode Island is approximately 30 million GJ for the
residential sector and approximately 8 million GJ for commercial buildings. We estimate the
current number of heat pumps, forced-air furnaces, and boilers in use in RI homes and businesses
using EIA data and the projections by Meister Consulting Group for RI. According to data from
NEMS, new heat pumps have a life expectancy ranging from 7 to 21 years, with an average life
of approximately 14 years. Forced-air furnaces and boilers have average useful lives of
approximately 17 and 25 years, respectively. We use these data on equipment lifetimes to
estimate the number of units coming out of service in each year, which could be replaced with
new air- or ground-source heat pumps or biomass systems. Initial estimates from Meister
Consulting Group find that 18,700 single-family heating system replacements occur in Rhode
Island each year, based on an average turnover time of 13 years.
Assumptions and data gaps:
The total amount of heat from fossil energy replaced by heat pumps is adjusted to account for the
increased efficiency provided by heat pumps, using the following assumptions from EIA’s
NEMS:
Air source heat pumps will have an average Coefficient of Performance of 3.
Ground source heat pumps will have an average Coefficient of Performance of 5.
The furnaces and boilers replaced by heat pumps will have an average Annual Fuel
Utilization Efficiency of 80 percent, based on assumptions from NEMS.
Meister Consulting Group recently performed an analysis of renewable heating and cooling
technologies for RI, which included scenarios of 2 percent, 5 percent, and 10 percent of

72
replacement of total thermal load by heat pumps, biomass systems, and other renewable heating
technologies by 2035. However, modeling results for other states indicate that a much more
aggressive scenario than Meister’s 10 percent replacement scenario will be needed to meet a
target of an 80 percent reduction in GHG emissions by 2050.
Rather than use Meister’s assumptions about a percent penetration rate for heat pumps, we model
the installation of heat pumps based on the assumed retirement rate of existing fossil units (e.g.,
natural gas and oil boilers and furnaces) and assumptions about the percentage of retiring units
that are replaced with heat pumps. The useful life of residential and commercial fossil units
ranges from 17 to 25 years, based on assumptions from NEMS. It is assumed that the proportion
of fossil units retiring in each year is (1 / useful life).3 We make assumptions about the
proportion of the retiring fossil units that must be replaced with heat pumps in each year to meet
Rhode Island’s emission reduction targets.
For residential units, we assume that 20 percent of retiring fossil units are replaced with heat
pumps in 2017. That percentage rises to 80 percent by 2035. However, to meet a goal of
approximately 80 percent penetration of heat pumps by 2050, the replacement rate must rise
sharply after 2035 to 480 percent by 2050. A heat pump replacement rate greater than 100
percent means than some fossil units must be retired before the end of their useful life in order to
achieve the heat pump penetration goals.
For commercial units, we assume that 30 percent of retiring fossil units are replaced with heat
pumps between 2017 and 2035. After 2035, the heat pump replacement rate rises to 210 percent
by 2050. As with the residential units, this means that some fossil units will have to be retired
before the end of their useful life. However, because of relatively faster turnover of commercial
heating units, the penetration rate does not have to rise as sharply as that for residential units.
Data are limited for forming projections of the proportion of installed heat pumps that will be air-
source versus ground-source, but recent installations in other states suggest that air source heat
pumps are being deployed at a higher rate than are ground source heat pumps. We used the ratio
of ground-source and air-source heat pumps from Meister’s scenarios (90 percent air-source and
10 percent ground-source).
Information sources:
1. Energy Information Administration, Residential Energy Consumption Survey (RECS),
Commercial Building Energy Consumption Survey (CBECS), Manufacturing Energy
Consumption Survey (MECS)
2. Energy Information Administration, National Energy Modeling System (NEMS)
3. Oak Ridge National Lab, 2010. Assessment of National Benefits from Retrofitting
Existing Single-Family Homes with Ground Source Heat Pump Systems: Final Report
(August 2010), Prepared by X. Liu, Energy and Transportation Science Division.
4. Commonwealth Accelerated Renewable Thermal Strategy Final Report. Navigant
Consulting and Meister Consultants Group, prepared for Massachusetts Department of
Energy Resources. January 2014.
3 Note that we follow Meister’s assumptions that 90 percent of heat pumps will have a fossil fuel-based backup unit
that will provide approximately 20 percent of the heating load.
73
5. Meister Consultants Group, draft Thermal Installation Scenarios for Rhode Island
(2016).
H. Biomass and biofuels for heat in buildings
Description:
Rhode Island’s ability to replace existing heating fuels with biofuels could be constrained by
supply, which will be determined by federal policies and regional and national market
conditions. We calculate Rhode Island’s proportional share of national biofuel volumes required
under EPA’s Renewable Fuel Standard (RFS), based on Rhode Island’s current total demand for
diesel across sectors. We assume that Rhode Island’s proportional share of RFS biodiesel
production will remain constant and estimate that future national biodiesel will meet RFS
required levels up to 2018.4 Beyond 2018, we assume additional quantities of biodiesel will
become available in the marketplace, increasing by 5% per year, culminating in biofuels
providing 31.3% of heating oil demand in Rhode Island by 2050.
We note that RI’s biodiesel supply can be shared between the transportation and building heating
sectors. In this variant, we project a hypothetical 100 percent allocation of available biodiesel to
the building sector. Measure J below provides the counter hypothetical in which all biodiesel is
used in the transportation sector. Buildings currently account for 63 percent of total demand for
diesel/No. 2 heating oil in Rhode Island, and many oil furnaces and boilers can accommodate a
biodiesel blend without additional retrofitting, so it is likely that some portion of available
biodiesel will be used in buildings.
For use of solid biomass in heating, we use projections of technology penetration levels and
technical characterizations for biomass pellet heating systems in the residential sector and
biomass chip heating systems in the commercial sector, respectively, developed by Meister
Consulting Group (MCG) in its analysis of renewable thermal strategies for Rhode Island. As
discussed under Measure G above, air- and ground-source heat pumps will be the primary
technology to meet heating demand in the buildings sector, but biomass-based systems will also
play a small role.
Assumptions:
Total demand for diesel in RI constitutes 0.38 percent of national diesel demand. We assume that
Rhode Island will have access to that proportion of national biodiesel supply.
We assume that future national biodiesel will meet RFS required levels up to 2018. Beyond
2018, we create a high-supply case that assumes additional quantities of biodiesel will become
available in the marketplace, increasing by 5% per year. We assume that biodiesel cannot make
up more than 20% of the diesel/biodiesel blend because biodiesel blends higher than 20% can
present storage issues, affect warranties, and congeal in low temperatures for many heating oil
systems unless they are modified.
4 EPA’s proposed RFS volume for biomass-based diesel for 2018 is 2.1 billion gallons. Available at:
https://www.epa.gov/renewable-fuel-standard-program/proposed-renewable-fuel-standards-2017-and-biomass-
based-diesel.

74
For this analysis, we assume that biofuels will provide GHG reductions on a lifecycle basis. We
adopt the assumption from the California PATHWAYS analysis that future advanced biofuels
will have net zero-carbon emissions, i.e., 100 percent reduction (E3, 2015). This, however, must
be treated with caution, as the California PATHWAYS zero-carbon assumption has not been
demonstrated in practice, and is an area of uncertain feasibility. This caution also applies in the
application of advanced biofuels to transportation, as described below in Measure J. Policy
makers will need to consider carefully how much weight to place on the future mitigation
potential (or availability) of advanced biofuels in achieving Rhode Island’s 80 percent reduction
goal, such as considering hedging with relatively deeper GHG reductions elsewhere, should
biofuel advances not occur to a greater extent.
For solid biomass, similar to the assumption for biodiesel, we assume net zero-carbon emissions.
EPA’s Scientific Advisory Board (SAB) on GHG emissions accounting for biogenic feedstocks
used in stationary sources will publish its findings later this year, and these findings could
provide the basis for a more refined set of assumptions about lifecycle GHG emissions
associated with solid biomass fuels.5
Technology potential:
RI biodiesel supply in 2018 (proportional share of RFS required volume):
0.96 (LHV)6 TBtu
Table 6 below describes the percent of projected demand for No. 2 heating fuel in buildings
which could be met by RI’s proportion of biodiesel supplied under the high supply case. Note
that biodiesel’s ability to meet the total diesel demand for the building sector is constrained by
(1) the supply of biodiesel and (2) our assumption that the biodiesel and conventional diesel mix
cannot exceed 20% biodiesel by volume (also 20% by energy content). From now to 2030,
biodiesel’s ability to meet the total diesel demand is constrained by supply. By 2040, biodiesel’s
ability to meet the total diesel demand is constrained by our assumption that the mix cannot
exceed 20% biodiesel by volume.
5 More information on EPA’s SAB is available at:
https://yosemite.epa.gov/sab/SABPRODUCT.NSF/81e39f4c09954fcb85256ead006be86e/3235DAC747C16FE9852
57DA90053F252/$File/Charge+and+cover+memo_Feb+25,+2015.pdf 6 The lower heating value (LHV) assumes that liquid water in the fuel evaporates during combustion (vaporization
takes additional energy).

75
Table 6: RI projected diesel demand for heating in building sector.
Year Projected Diesel and No. 2 Heating Fuel
Demand for Building Sector (TBtu)
Projected Biodiesel Supply for RI in High Supply Case (TBtu)
Percentage of projected diesel demand for building sector
that can be met by RFS biodiesel (percentage by
energy content)
2020 13.0 1.06 8.18%
2030 10.2 1.72 16.91%
2040 8.07 2.81 20.00%
2050 7.45 4.58 20.00% Source: Abt Associates analysis of EIA projections.
Information sources:
1. State Energy Data System (SEDS) 2014 for diesel/No. 2 fuel use nationally and in RI -
http://www.eia.gov/state/seds/xxx
2. E3, California PATHWAYS: GHG Scenario Results (updated April 6, 2015).
3. EPA Renewable Fuel Standard website for biodiesel volumetric requirement in 2018 -
https://www.epa.gov/renewable-fuel-standard-program/renewable-fuel-annual-standards
4. DOE Alternative Fuels Data Center for biodiesel (B100) energy content -
www.afdc.energy.gov
5. United States Department of Agriculture, Economic Research Service, U.S. Bioenergy
Statistics, Table 17 http://www.ers.usda.gov/data-products/us-bioenergy-statistics.aspx
6. U.S. Energy Information Administration (EIA), Independent Statistics & Analysis, U.S.
Weekly No. 2 Heating Oil Residential Price,
https://www.eia.gov/opendata/qb.cfm?sdid=PET.W_EPD2F_PRS_NUS_DPG.W
7. Meister Consultants Group, draft Thermal Installation Scenarios for Rhode Island
(2016).
8. California Air Resources Board (CARB), 2009. Proposed Regulation to Implement the
Low Carbon Fuel Standard, https://www.arb.ca.gov/fuels/lcfs/030409lcfs_isor_vol1.pdf
I. Electric vehicles
Description:
The Rhode Island LEAP scenarios adopt the penetration rates used in the California
PATHWAYS analysis for light-duty electric vehicles. In the California PATHWAYS high
battery electric vehicle (BEV) scenario, 80% of light-duty vehicles were battery electric or plug-
in hybrids by 2050. In addition to electrification of the light-duty motor vehicle fleet, zero-
carbon measures are included for larger vehicle classes. These include 80% zero-carbon buses,
95% zero-carbon refuse trucks, and 65% zero-carbon combination short-haul trucks.
Information sources:
1. E3, California PATHWAYS: GHG Scenario Results (updated April 6, 2015).
2. EPAUS9R - An Energy Systems Database for use with the Market Allocation (MARKAL)
Model, https://www.epa.gov/air-research/epaus9r-energy-systems-database-use-market-
allocation-markal-model.
76
J. Advanced biofuels for transportation
Description:
This measure is based on analysis of opportunities for fuel-switching from conventional
transportation fuels to advanced biofuels in RI’s transportation sector, as follows: (1) switching
from conventional diesel to biodiesel and (2) expanding the percentage of cellulosic ethanol in
the gas/ethanol mix.
As previously given in Measure H (Biofuels and biomass for heat in buildings), Rhode Island’s
ability to replace existing transportation fuels with biofuels could be constrained by the national
supply of advanced biofuels, which will be determined to some degree by federal policies and
market conditions. We calculate Rhode Island’s proportional share of national volumes of
advanced biofuels required under EPA’s Renewable Fuel Standard (RFS), based on Rhode
Island’s current total demand for ethanol and diesel across sectors. We assume that Rhode
Island’s proportional share of national biofuel production will remain constant.
We assume that future national biodiesel supply will follow RFS required levels through 2022
and we create a high-supply case for future national biodiesel supply beyond 2018. As described
under Measure H, we note that RI’s biodiesel supply can be shared between the transportation
and building heating sectors. Here, we illustrate a scenario where 100 percent of RI’s biodiesel
supply is allocated to replacing diesel use in the transportation sector. Specific applications are to
larger vehicle classes where electric technologies are not currently available, such as long-haul
trucks.
We estimate that national ethanol supply will follow RFS required levels through 2022 and we
create a high-supply case for future national biodiesel supply beyond 2022.
Assumptions:
Total demand for diesel in RI constitutes 0.38 percent of national diesel demand. We assume
Rhode Island will have access to that proportion of national biodiesel supply. We assume future
national biodiesel supply will increase by 5% per year from 2018 – 2050.
Total demand for ethanol in RI constitutes 0.28 percent of national ethanol demand. We assume
that Rhode Island will have access to that proportion of national cellulosic ethanol supply.
We assume future national cellulosic ethanol supply will follow the published RFS required
volumes up to 2022. We create a high-supply case based on the Department of Energy’s 2016
Billion Ton Report 3% yield, $60 farm price scenario, which projects cellulosic biomass supply
increasing to about 930,000,000 tons of cellulosic biomass. We use the Billion Ton Report’s
conversion factor of 0.85 gallons ethanol/ton of biomass and linearly interpolate between years
for which the report projected cellulosic biomass supply. There is some uncertainty associated
with this approximation, because cellulosic ethanol is an emerging technology and production of
cellulosic ethanol has failed to meet EPA’s volumetric requirements under the RFS in recent
years.
We assume that a gasoline and ethanol mix cannot exceed 85% ethanol by volume and that
biodiesel will be used by a limited number of passenger cars and trucks, light commercial trucks,

77
intercity buses, transit buses, school buses, refuse trucks, and motor homes, as well as in the
short-haul, long-haul, and off-road transportation sectors.
We adopt the California PATHWAYS zero-carbon net emissions assumption, but repeat our
earlier caution that this has not been demonstrated in practice, and is an area of uncertain
feasibility. We recognize that due to current lack of zero-carbon technology options for some
mobile source categories, such as long-distance heavy-duty trucks, GHG mitigation options are
currently limited in this sector, but care must be taken to track the evolution of advanced biofuels
in the future and monitor whether they will become capable of helping meeting Rhode Island’s
GHG reduction requirements.
Technology potential:
Switch from conventional diesel to biodiesel:
RI biodiesel supply in 2018 (proportional share of RFS required volume):
0.96 (LHV) TBtu
Table 7 below describes the percent of projected demand for diesel in transportation which could
be met by RI’s proportion of biodiesel supplied under the RFS requirements in a high-supply
case.
Table 7: RI projected diesel demand for transportation sector.
Year Projected Diesel
Demand for
Transportation Sector
(TBtu)
Projected Biodiesel Supply for RI in High Supply Case (TBtu)
Percentage of projected diesel
demand for transportation sector
that can be met by RFS biodiesel
(percentage by energy content)
2020 9.94 1.06 10.7%
2030 11.61 1.72 14.9%
2040 13.13 2.81 21.4%
2050 14.66 4.58 31.3% Source: Abt Associates analysis of EIA projections.
Expansion of cellulosic ethanol’s percentage of gas/ethanol mix:
RI cellulosic ethanol supply in 2017 (proportional share of RFS required volume):
0.38 (LHV) TBtu
Table 8 below describes the percent of projected demand for gas and ethanol in transportation
which could be met by RI’s cellulosic ethanol supply in a high-supply case. Note that cellulosic
ethanol’s ability to meet the total ethanol and gasoline demand for the transportation sector is
constrained by (1) the supply of cellulosic ethanol and (2) our assumption that the gasoline and
ethanol mix cannot exceed 85% ethanol by volume (79.08% by energy content). From now to
2040, cellulosic ethanol’s ability to meet the total ethanol and gasoline demand is constrained by

78
supply. By 2050, cellulosic ethanol supply is projected to exceed demand, but cellulosic ethanol
still cannot meet all of the combined ethanol and gasoline demand because of the 85% blend
wall.
Table 8: RI projected ethanol demand for transportation sector.
Year
Projected Total Ethanol and Gasoline Demand for Transportation Sector (TBtu)
Projected Cellulosic Ethanol Supply for RI in High Supply Case (TBtu)
Cellulosic ethanol percentage of total gas/ethanol mix (percentage by energy content)
2017 42.43 1.19 0.16%
2020 42.87 2.27 5.30%
2030 32.62 10.16 31.14%
2040 22.27 17.18 77.16%
2050 18.53 24.10 79.08% Source: Abt Associates analysis of EIA projections.
Information sources:
1. EPA Renewable Fuel Standards for biodiesel requirements,
https://www.epa.gov/renewable-fuel-standard-program/proposed-renewable-fuel-
standards-2017-and-biomass-based-diesel
2. EIA State Energy Data System (SEDS) 2014, http://www.eia.gov/state/seds/
3. 2016 Billion Ton Report, Department of Energy,
https://bioenergykdf.net/billionton2016/overview
4. United States Department of Agriculture, Economic Research Service, 2016, U.S.
Bioenergy Statistics, http://www.ers.usda.gov/data-products/us-bioenergy-statistics.aspx
5. Oil Price Information Service, Ethanol and Biodiesel Information Service, July 2016,
http://www.opisnet.com/images/productsamples/EBISnewsletter-sample.pdf
6. California Air Resources Board, 2011. Low Carbon Fuel Standard 2011 Program
Review Report,
http://www.arb.ca.gov/fuels/lcfs/workgroups/advisorypanel/20111208_LCFS%20progra
m%20review%20report_final.pdf
7. California Air Resources Board (CARB), 2009. Proposed Regulation to Implement the
Low Carbon Fuel Standard, https://www.arb.ca.gov/fuels/lcfs/030409lcfs_isor_vol1.pdf
2. Non-energy GHG reduction measures
A. Solid Waste
Description:
The Rhode Island LEAP scenarios assume that the Central Landfill is closed in 2038 as
anticipated in the Rhode Island Comprehensive Solid Waste Management Plan. We further
assume that after the landfill is closed, the waste stream in Rhode Island is significantly reduced
through an increase in recycling and composting measures, and that any remaining waste is
exported to other states. Even though the Central Landfill is assumed to be closed in 2038, it will
continue to emit some GHGs as the waste in place decays. Based on simulations using EPA’s

79
State Inventory and Projection Tool, we determined that the landfill would continue to be a
source of GHG emissions for approximately 10 years after closure, and that GHG emissions of
the landfill will decline to 0 by 2048.
Information sources:
1. Solid Waste 2038: Rhode Island Comprehensive Solid Waste Management Plan, 2015,
http://www.planning.ri.gov/documents/LU/2015/SolidWaste2038_Approved_05142015_
Final.pdf
2. U.S. Environmental Protection Agency, State Inventory and Projection Tool, 2016,
https://www.epa.gov/statelocalclimate/state-inventory-and-projection-tool
B. Land Use, Land-Use Change, and Forestry (LULUCF)
Description:
This mitigation strategy assumes no net loss of forest, wetlands, and pasture lands in RI from
20117 to 2035. The strategy represents a scenario where Rhode Island households shift to more
dense residential developments, and where demand for new housing and commercial
development is met by filling in already developed lands before developing natural lands.
Conserving forests reduces GHG emissions relative to the reference case by (1) avoiding carbon
emissions that would occur in the reference case due to loss of carbon storage in forests and (2)
maintaining land area that can continue to sequester carbon each year.
Estimates of future land needs are based on population projections (Rhode Island Division of
Planning 2013), employment projections (Rhode Island Department of Labor and Training,
2014), the 2025 Land Use Planning Report (Rhode Island Division of Planning 2006), and the
assumption that new Rhode Island households will be accommodated in denser residential
developments than the current trend.
We estimate future forest carbon dynamics using regional modeling in the U.S. Forest Service’s
Forest Carbon Budget model (USFS 2010) and used estimates of carbon stocks for each land
cover type developed in similar analysis for Massachusetts (Abt Associates, 2015).
Our projections end at 2035 due to the high level of uncertainty regarding future land use change
and the impacts of future climate change on forests’ health and ability to sequester carbon. After
2035, our assumption in LEAP is that the carbon flux from LULUCF remains constant at
projected 2035 levels through 2050.
7 We began the mitigation calculation at 2011 because that is the most recent year for which Rhode Island
Geographic Information System (RIGIS) land cover and land use data is available.

80
Figure 4: Changes in forest acreage and carbon storage under different scenarios.
Figure 5: Changes in annual forest carbon fluxes under different scenarios.
Information sources:
1. Abt Associates. 2015. “Research & Analysis Supporting Development of 2015
Massachusetts Clean Energy and Climate Plan.”
2. Rhode Island Department of Labor and Training, Labor Market Information. 2014.
“Rhode Island's Employment Projections by Major Industry Division.”

81
3. Rhode Island Division of Planning. 2006. “Land Use 2025 – Rhode Island State Land
Use Policies and Plan.”
4. Rhode Island Division of Planning. 2013. “Rhode Island Population Projections 2010 –
2040.”
5. U.S. Department of Agriculture, Forest Service (USFS). 2010. Heath, L., M. Nichols, J.
Smith, and J. Mills. “FORCARB2: An updated version of the U.S. Forest Carbon Budget
Model.” http://www.nrs.fs.fed.us/pubs/35613.
6. Rhode Island Geographic Information System (RIGIS). 2015. “Land Cover & Land Use –
2011.”
II. LEAP Scenario Descriptions
The Resilient Rhode Island targets relative to the 1990 Rhode Island GHG inventory used in this
analysis are summarized in Table 9.
Table 9: Resilient Rhode Island GHG emission targets.
Emissions Target Below 1990 Year Allowed Emissions (MMtonnes CO2e/year)
--- 1990 12.48 (historical)
10% 2020 11.23
45% 2035 6.86
80% 2050 2.50
In this analysis, we developed with input from the Rhode Island State Team and the EC4
Technical Committee the following five scenarios aimed at achieving Rhode Island’s 80% GHG
reduction target by 2050. As described below, the scenarios differ in implementation rates of
some measures and combinations of measures. In general, however, all scenarios share many
common features that reflect relatively limited degrees of freedom in achieving the deep GHG
reductions needed to achieve an 80% reduction by 2050. All scenarios require extensive
electrification of the heating and transportation sectors as well as deep decarbonization of the
electricity sector. All scenarios include the same solid waste and LULUCF mitigation measures,
as well as 100% rail electrification.
1. Scenario 1.0 “80% Below 1990 by 2050”
Scenario 1.0 is referred to as “80% Below 1990 by 2050”, and includes most of the Phase 1
building block measures at their maximum implementation rates as described in the previous
section. These maximal implementation rates are referred to as “Phase 1 limits”. Scenario 1.0
excludes two measures: distributed renewable electricity and biomass and biofuel heating in
buildings. Distributed renewable electricity is included as a measure in Scenario 2.1 (described
below), and its absence here does not reduce the overall amount of renewable generation. In
excluding biomass and biofuel heating, Scenario 1.0 allocated all available biofuels entirely to
the transportation sector. In Scenario 2.2 (also described below), a greater portion of available

82
biofuels is allocated for heating in the buildings sector. A summary of Phase 1 measures and the
extent to which they are included in Scenario 1.0 is given in the following table.
Table 10: Scenario 1.0 “80% Below 1990 by 2050.”
Phase 1 Measure Inclusion in Scenario 1.0
Electric, Natural Gas, and Heating Oil
Efficiency
Fully included
VMT Reductions Fully included
Utility-Scale Renewable Electricity Fully included
Distributed Renewable Electricity Not included
Additional Imports of Clean Electricity Fully included
Nuclear Re-licensing Fully included
Electric Heat in Buildings 85% of Phase 1 limit
Biomass and Biofuels Heating in Buildings Not included
Electric Vehicles 85% of Phase 1 limit
Advanced Biofuels for Transportation Fully included*
*This measure targets only the diesel and gasoline and ethanol consumption that remains after the majority of
transport is electrified.
2. Scenario 2.0 “45% Below 1990 by 2035, 80% Below 1990 by 2050”
With the implementation schedule described in the above table for Scenario 1.0, Rhode Island’s
GHG abatement is projected to exceed the Resilient Rhode Island Act GHG reduction target for
2035. As a consequence, Scenario 2.0, labeled “45% Below 1990 by 2035, 80% Below 1990 by
2050,” reduces the initial rate of implementation of several measures through 2035 to provide a
GHG reduction trajectory which meets (but does not significantly exceed) the 45% by 2035
interim GHG reduction target. After 2035, implementation rates then accelerate to achieve the
same 80% GHG reduction goal in 2050 as in Scenario 1.0. Scenario 2.0 reduces biodiesel blend,
ethanol blend, and cellulosic ethanol (in ethanol) blend targets through 2035, as well as the 2035
shares of electric heat pumps and electric vehicles relative to those observed in Scenario 1.0. In
addition, renewable capacity) may be reduced until 2035, increasing afterwards.8 The extent to
which each Phase 1 measure is included in Scenario 2.0 is described below.
8 In the Rhode Island LEAP model, neither capacity nor dispatch is controlled directly – instead, future capacity
options may be specified, and these are added and dispatched as necessary. Therefore, in Scenario 2.0 and derivative
scenarios, the relative additions of renewable and non-renewable generation capacity are adjusted. A more complete
description is provided in the Reference Case memo.

83
Table 11: Scenario 2.0 “45% Below 1990 by 2035, 80% Below 1990 by 2050.”
Phase 1 Measure Inclusion in Scenario 2.0
Electric, Natural Gas, and Heating Oil
Efficiency
Fully included
VMT Reductions Fully included
Utility-Scale Renewable Electricity Additions of renewable capacity set to 60% of Phase 1
limit through 2035, 100% of Phase 1 limit thereafter
Distributed Renewable Electricity Not included
Additional Imports of Clean Electricity Fully included
Nuclear Re-licensing Fully included
Electric Heat in Buildings 50% of Phase 1 limit in 2035, increasing to 85% by 2050
Biomass and Biofuels Heating in Buildings Not included
Electric Vehicles 10% of Phase 1 limit in 2020, increasing to 50% in 2035
and 85% by 2050
Advanced Biofuels for Transportation Biodiesel/diesel, cellulosic ethanol/ethanol and
ethanol/gasoline blends reach only 2017 levels in Phase
1 limit by 2035, increasing to full implementation by
2050
Table 12 provides additional context on the extent of additional renewable energy resources
projected for 2050 in Scenario 2.0. The table summarizes the shares of renewable energy
generation and capacity by 2050 projected by LEAP at the ISO-NE regional level, rather than
down-scaled to Rhode Island. This is illustrates what would be projected for the entire ISO-NE
region in order to achieve Rhode Island’s down-scaled share of regional electricity generation
sector GHG emissions needed to meet its 80% GHG reduction goal using the consumption-based
approach in LEAP. The table also shows ISO-NE’s projected renewable capacity in 2020 (far
right column), which provides additional context for the large increase in renewable capacity
projected by LEAP for the ISO-NE region by 2050. The increased renewable energy generation
and capacity by 2050 reflects not only meeting traditional demand (e.g., residential/commercial
lighting and appliances), but also increased demand for electric vehicle recharging and other
GHG mitigation measures in Scenario 2.0 requiring electricity. When combined with the nuclear
re-licensing measure, Scenario 2.0 projects over 98% of generation in 2050 to be from zero-
carbon sources.

84
Table 12: Mix of renewable energy generation shares by 2050 for ISO-NE region.
% Share of Generation by
2050*
LEAP Projected Installed Capacity (MW) in ISO-NE by
2050
ISO-NE Projected
Capacity (MW) by 2020
Utility-scale PV 34.1% 46,594
Distributed PV** 0.05% 65 All Solar: 542
Offshore Wind 21.7% 8,610
Onshore Wind 23.7% 12,369 All Wind: 4,228
Wood & Wood Waste (biopower-solid) 2.1% 918 40
Landfill Gas (biopower-gaseous) 0.5% 192 2
Hydropower 1.0% 193 31
Total 83.2% 68,942 4,843 *The “% Share of Generation in 2050” is calculated relative to generation excluding demand resources and
imports.
**Distributed PV is not explicitly included in this measure, but a small amount is projected to occur under the
reference case, which is carried over into the LEAP results.
3. Scenario 2.1 “Distributed PV and Offshore Wind”
Scenario 2.1 is called “Distributed PV and Offshore Wind”, and is the first of three variants of
Scenario 2.0. It explores a different mix of renewable electricity capacity options by increasing
the additions of offshore wind while reducing additions of onshore wind, and by trading some
additions of utility-scale solar PV for distributed solar PV. The following table lists the
measures as combined in Scenario 2.1.

85
Table 13: Scenario 2.1 “Distributed PV and Offshore Wind.”
Phase 1 Measure Inclusion in Scenario 2.1
Electric, Natural Gas, and Heating Oil
Efficiency
Fully included
VMT Reductions Fully included
Utility-Scale Renewable Electricity Partially included* – ratio of offshore to onshore wind
capacity additions increases by 100% relative to Phase 1
limit by 2050
Distributed Renewable Electricity Partially included* – ratio of BTM solar PV capacity
additions relative to FTM solar PV additions increased by
76% in all years
Additional Imports of Clean Electricity Fully included
Nuclear Re-licensing Fully included
Electric Heat in Buildings 50% of Phase 1 limit in 2035, increasing to 85% by 2050
Biomass and Biofuels Heating in Buildings Not included
Electric Vehicles 10% of Phase 1 limit in 2020, increasing to 50% in 2035
and 85% by 2050
Advanced Biofuels for Transportation Biodiesel/diesel, cellulosic ethanol/ethanol and
ethanol/gasoline blends reach only 2017 levels in Phase
1 limit by 2035, increasing to full implementation by
2050
*In addition to adjustments made to the type of renewable capacity additions, the total ratio of renewable capacity
additions relative to non-renewable capacity additions increases from 60% of the Phase 1 limit through 2035 and
250% thereafter.
4. Scenario 2.2 “Biofuel Heating”
Scenario 2.2 is the second variant of Scenario 2.0, and is called “Biofuel Heating”. This
variation adds the biomass and biofuels for heating in buildings measure into Scenario 2.0, while
reducing the implementation of electric heat pumps. We continue to allocate some level of
biofuels to the transportation sector, but at lower volumes than in Scenario 2.0. The following
table lists the measures as implemented in Scenario 2.2.

86
Table 14: Scenario 2.2 “Biofuel Heating.”
Phase 1 Measure Inclusion in Scenario 2.2
Electric, Natural Gas, and Heating Oil
Efficiency
Fully included
VMT Reductions Fully included
Utility-Scale Renewable Electricity Additions of renewable capacity set to 60% of Phase 1
limit through 2035, 100% of Phase 1 limit thereafter
Distributed Renewable Electricity Not included
Additional Imports of Clean Electricity Fully included
Nuclear Re-licensing Fully included
Electric Heat in Buildings 30% of Phase 1 limit in 2035, increasing to 70% by 2050
Biomass and Biofuels Heating in Buildings Fully included*
Electric Vehicles 10% of Phase 1 limit in 2020, increasing to 50% in 2035
and 85% by 2050
Advanced Biofuels for Transportation Biodiesel/diesel, cellulosic ethanol/ethanol and
ethanol/gasoline blends reach only 2017 levels in Phase
1 limit by 2035, increasing to full implementation by
2050
*Aside from biomass heating, biofuel targets described in this measure target only the distillate heating oil
consumption that remains after the majority of space heating is electrified.
5. Scenario 2.3 “Fewer Heat Pumps and Electric Vehicles, More Renewables”
Scenario 2.3, “Fewer Heat Pumps and Electric Vehicles, More Renewables”, is the third variant
of Scenario 2.0. It describes a pathway with less aggressive electrification of heating and
transport end-uses, but more aggressive decarbonization of the power supply to compensate. The
variations to the key measures are listed in the following table.

87
Table 4: Scenario 2.3 “Fewer Heat Pumps and Electric Vehicles, More Renewables.”
Phase 1 Measure Inclusion in Scenario 2.3
Electric, Natural Gas, and Heating Oil
Efficiency
Fully included
VMT Reductions Fully included
Utility-Scale Renewable Electricity Additions of renewable capacity set to 100% of Phase 1
limit through 2035, 250% thereafter
Distributed Renewable Electricity Not included
Additional Imports of Clean Electricity Fully included
Nuclear Re-licensing Fully included
Electric Heat in Buildings 45% of Phase 1 limit in 2035, increasing to 80% by 2050
Biomass and Biofuels Heating in Buildings Not included
Electric Vehicles 10% of Phase 1 limit in 2020, increasing to 45% in 2035
and 80% by 2050
Advanced Biofuels for Transportation Biodiesel/diesel, cellulosic ethanol/ethanol and
ethanol/gasoline blends reach only 2017 levels in Phase
1 limit by 2035, increasing to full implementation by
2050
III. LEAP Scenario Emissions Results
Figure tracks the GHG reduction trajectories of Scenario 1.0, “80% Below 1990 by 2050” and
Scenario 2.0, “45% Below 1990 by 2035, 80% Below 1990 by 2050”. The horizontal dashed line
delineates Rhode Island’s 1990 GHG emissions inventory level of 12.48 MMtonnes CO2e, while
green squares indicate the 2020 (20% below 1990), 2035 (45% below 1990), and 2050 (80%
below 1990) GHG reduction targets. As the trajectories show, both scenarios well exceed the
2020 Resilient Rhode Island reduction target and meet the 2050 target, while Scenario 1.0
exceeds the mid-term 2035 target by over 20%. The relaxed implementation rates of several
measures in Scenario 2.0 brings the GHG reduction trajectory in line with the 2035 target of 45%
below 1990 emissions, but this necessitates a ramp up in measure implementation rates for this
scenario between 2035 and 2050. The variant Scenarios 2.1, 2.2 and 2.3 are omitted because they
are qualitatively nearly identical to Scenario 2.0 in the chart.

88
Figure 6: Scenario 1.0 and Scenario 2.0 GHG (CO2e) reduction trajectories relative to Reference Case (Baseline).
-
2.00
4.00
6.00
8.00
10.00
12.00
14.00
2001 2008 2015 2022 2029 2036 2043 2050
Mill
ion
Met
ric
Ton
nes
CO
2-e
qu
ival
ent
45% by 2035, 80% by2050 (Scenario 2.0)
80% Below 1990(Scenario 1.0)
Reference Case
1990 Emissions
2020 Target
2035 Target
2050 Target
![Greenhouse Gas Emissions and Emissions Trading in North … · 2020. 2. 23. · 2002] Stephenson-Greenhouse Gas Emissions, Kyoto and U.S. Response 45 greenhouse gas molecules. This](https://static.fdocuments.in/doc/165x107/60facf56e286b02f9b10de99/greenhouse-gas-emissions-and-emissions-trading-in-north-2020-2-23-2002-stephenson-greenhouse.jpg)