Standard Methods for Estimating Greenhouse Gas Emissions ... · Standard Methods for Estimating...
11
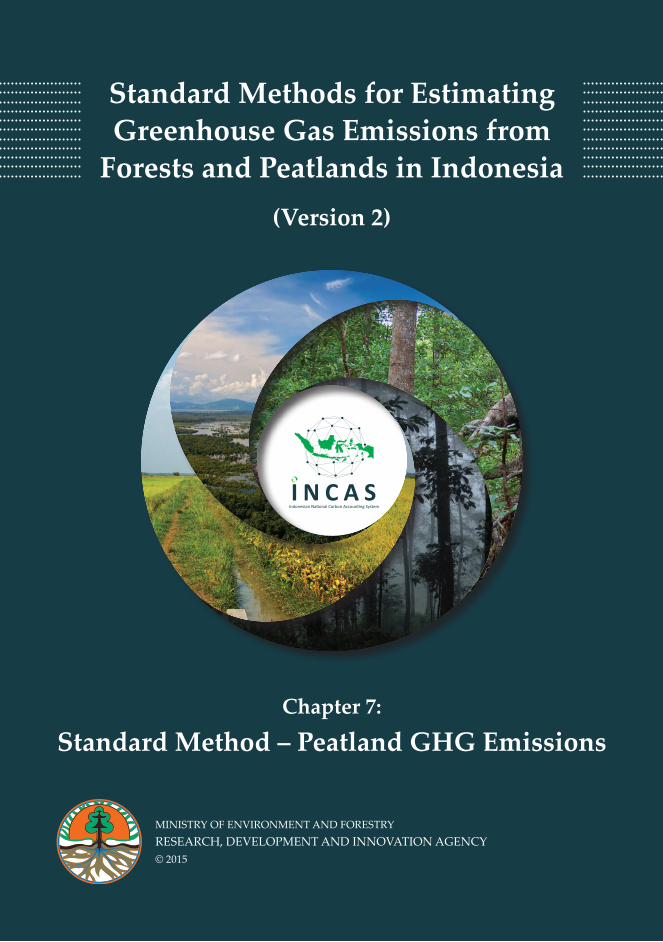
Standard Methods for Estimating Greenhouse Gas Emissions from Forests and Peatlands in Indonesia (Version 2) MINISTRY OF ENVIRONMENT AND FORESTRY RESEARCH, DEVELOPMENT AND INNOVATION AGENCY © 2015 Chapter 7: Standard Method – Peatland GHG Emissions
Transcript of Standard Methods for Estimating Greenhouse Gas Emissions ... · Standard Methods for Estimating...
Standard Methods for Estimating Greenhouse Gas Emissions from
Forests and Peatlands in Indonesia(Version 2)
MINISTRY OF ENVIRONMENT AND FORESTRYRESEARCH, DEVELOPMENT AND INNOVATION AGENCY© 2015
Chapter 7:
Standard Method – Peatland GHG Emissions
INDONESIAN NATIONAL CARBON ACCOUNTING SYSTEM (INCAS)
Chapter 7: Standard Method – Peatland GHG Emissions
This chapter is taken from the complete publication from the following source: Krisnawati, H., Imanuddin, R., Adinugroho, W.C. and Hutabarat, S. 2015. Standard Methods for Estimating Greenhouse Gas Emissions from Forests and Peatlands in Indonesia (Version 2). Research, Development and Innovation Agency of the Ministry of Environment and Forestry. Bogor, Indonesia. The other chapters and full publication are also available on the INCAS website www.incas-indonesia.org
44 | Standard Methods for Estimating Greenhouse Gas Emissions from Forests and Peatlands in Indonesia (Version 2)
7.1 PURPOSE
This standard method describes the process used by INCAS for modelling GHG emissions from peatland in Indonesia. This includes data collation, data analysis, quality control, quality assurance, modelling and reporting.
For this standard method, peatland is defined as land with organic soils. This represents areas with an accumulation of partly decomposed organic matter, with ash content equal to or less than 35%, peat depth equal to or more than 50 cm and organic carbon content (by weight) of at least 12% (Wahyunto et al., 2004; Agus et al., 2011).
Peatland GHG emissions are estimated annually for the following sources and gases:
• biological oxidation of drained peat: CO2-C, CO2-e
• peat fire:3 CO2-C, CO2, CO, CH4
• direct emissions from drained organic soils: N2O, CH4
Outputs from this standard method can be expressed as tonnes for each GHG or expressed in tonnes CO2-equivalent GHG emissions. Time periods for reporting can be specified to meet reporting requirements.
7.2 DATA COLLATION
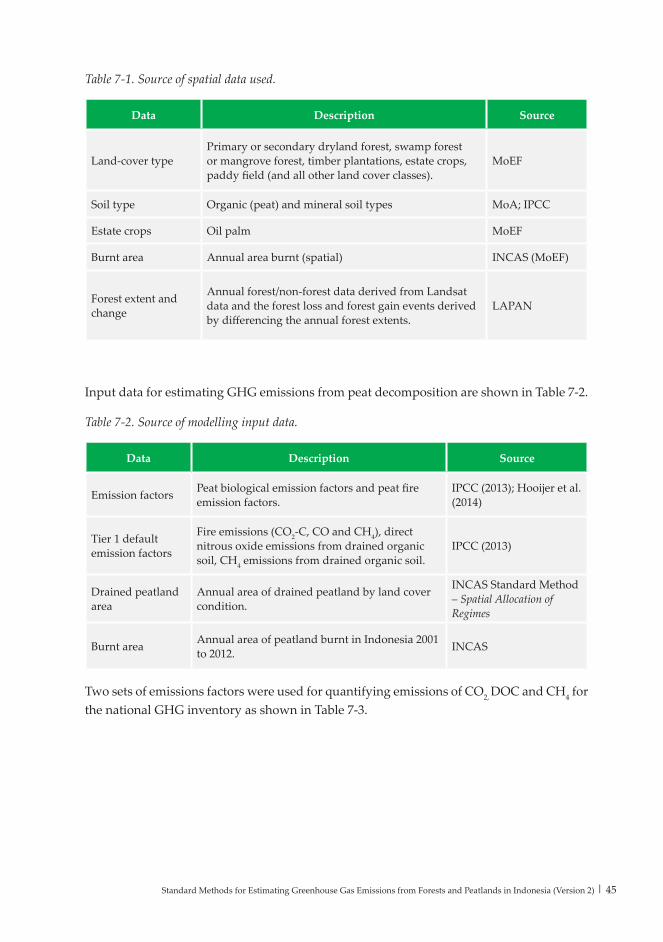
Spatial data used in this method are summarized in Table 7-1. Spatial data collation methods are described in the Standard Method – Spatial Allocation of Regimes (Chapter 6).
3 Note: Fire emission factors for N2O and NOx are not provided by IPCC at Tier 1 due to limited data for N2O and NOx emissions from organic soil fires.
STANDARD METHOD –PEATLAND GHG EMISSIONS
Standard Methods for Estimating Greenhouse Gas Emissions from Forests and Peatlands in Indonesia (Version 2) | 45
Table 7-1. Source of spatial data used.
Data Description Source
Land-cover typePrimary or secondary dryland forest, swamp forest or mangrove forest, timber plantations, estate crops, paddy field (and all other land cover classes).
MoEF
Soil type Organic (peat) and mineral soil types MoA; IPCC
Estate crops Oil palm MoEF
Burnt area Annual area burnt (spatial) INCAS (MoEF)
Forest extent and change
Annual forest/non-forest data derived from Landsat data and the forest loss and forest gain events derived by differencing the annual forest extents.
LAPAN
Input data for estimating GHG emissions from peat decomposition are shown in Table 7-2.
Table 7-2. Source of modelling input data.
Data Description Source
Emission factors Peat biological emission factors and peat fire emission factors.
IPCC (2013); Hooijer et al. (2014)
Tier 1 default emission factors
Fire emissions (CO2-C, CO and CH4), direct nitrous oxide emissions from drained organic soil, CH4 emissions from drained organic soil.
IPCC (2013)
Drained peatland area
Annual area of drained peatland by land cover condition.
INCAS Standard Method – Spatial Allocation of Regimes
Burnt area Annual area of peatland burnt in Indonesia 2001 to 2012. INCAS
Two sets of emissions factors were used for quantifying emissions of CO2, DOC and CH4 for the national GHG inventory as shown in Table 7-3.
46 | Standard Methods for Estimating Greenhouse Gas Emissions from Forests and Peatlands in Indonesia (Version 2)
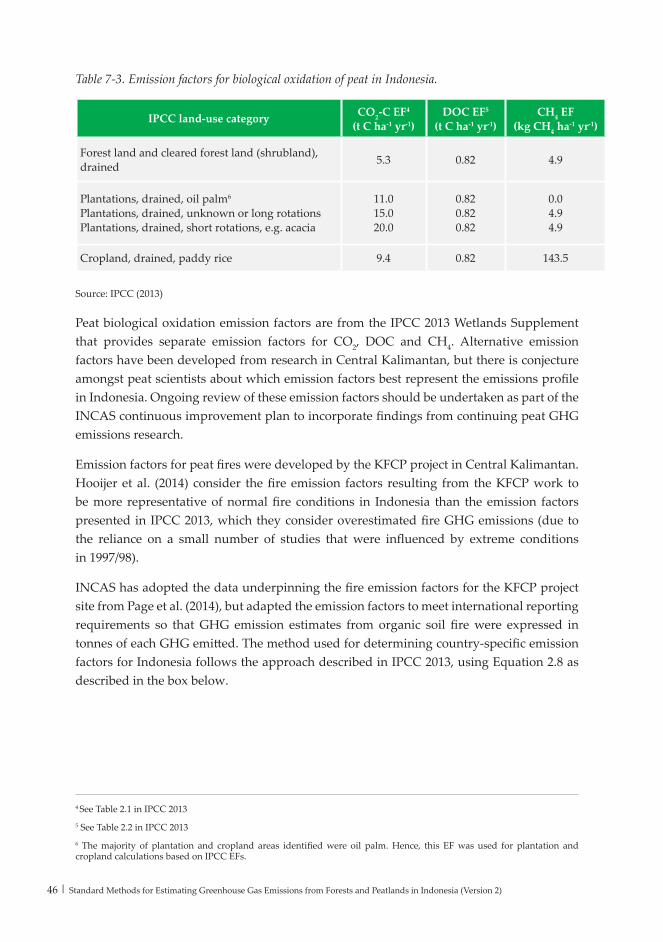
Table 7-3. Emission factors for biological oxidation of peat in Indonesia.
IPCC land-use category CO2-C EF4 (t C ha-1 yr-1)
DOC EF5 (t C ha-1 yr-1)
CH4 EF (kg CH4 ha-1 yr-1)
Forest land and cleared forest land (shrubland), drained 5.3 0.82 4.9
Plantations, drained, oil palm6
Plantations, drained, unknown or long rotationsPlantations, drained, short rotations, e.g. acacia
11.015.0 20.0
0.820.82 0.82
0.04.9 4.9
Cropland, drained, paddy rice 9.4 0.82 143.5
Source: IPCC (2013)
Peat biological oxidation emission factors are from the IPCC 2013 Wetlands Supplement that provides separate emission factors for CO2, DOC and CH4. Alternative emission factors have been developed from research in Central Kalimantan, but there is conjecture amongst peat scientists about which emission factors best represent the emissions profile in Indonesia. Ongoing review of these emission factors should be undertaken as part of the INCAS continuous improvement plan to incorporate findings from continuing peat GHG emissions research.
Emission factors for peat fires were developed by the KFCP project in Central Kalimantan. Hooijer et al. (2014) consider the fire emission factors resulting from the KFCP work to be more representative of normal fire conditions in Indonesia than the emission factors presented in IPCC 2013, which they consider overestimated fire GHG emissions (due to the reliance on a small number of studies that were influenced by extreme conditions in 1997/98).
INCAS has adopted the data underpinning the fire emission factors for the KFCP project site from Page et al. (2014), but adapted the emission factors to meet international reporting requirements so that GHG emission estimates from organic soil fire were expressed in tonnes of each GHG emitted. The method used for determining country-specific emission factors for Indonesia follows the approach described in IPCC 2013, using Equation 2.8 as described in the box below.
4 See Table 2.1 in IPCC 20135 See Table 2.2 in IPCC 2013 6 The majority of plantation and cropland areas identified were oil palm. Hence, this EF was used for plantation and cropland calculations based on IPCC EFs.
Standard Methods for Estimating Greenhouse Gas Emissions from Forests and Peatlands in Indonesia (Version 2) | 47
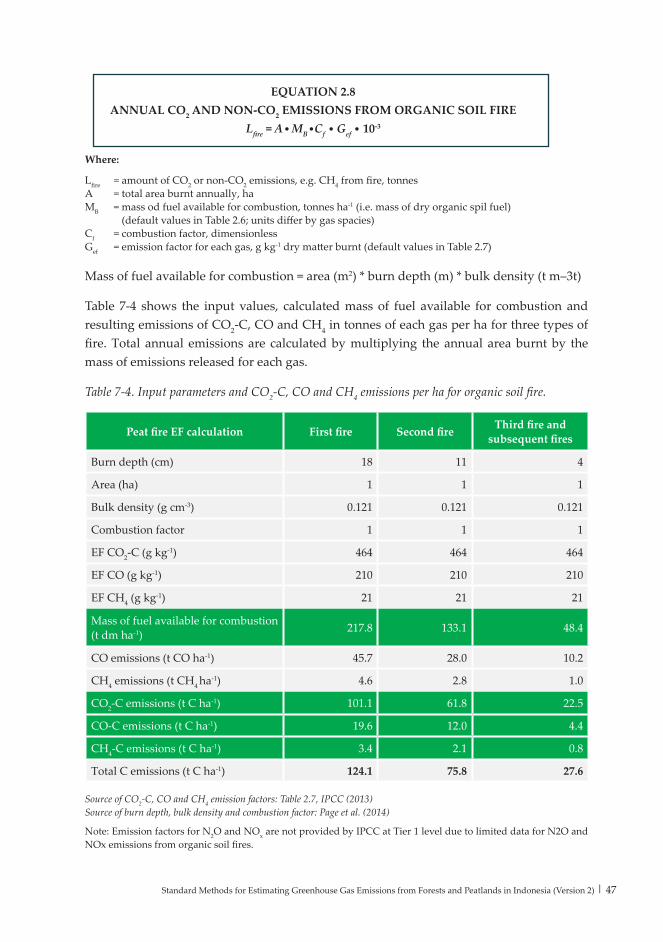
Mass of fuel available for combustion = area (m2) * burn depth (m) * bulk density (t m–3t)
Table 7-4 shows the input values, calculated mass of fuel available for combustion and resulting emissions of CO2-C, CO and CH4 in tonnes of each gas per ha for three types of fire. Total annual emissions are calculated by multiplying the annual area burnt by the mass of emissions released for each gas.
Table 7-4. Input parameters and CO2-C, CO and CH4 emissions per ha for organic soil fire.
Peat fire EF calculation First fire Second fire Third fire and subsequent fires
Burn depth (cm) 18 11 4
Area (ha) 1 1 1
Bulk density (g cm-3) 0.121 0.121 0.121
Combustion factor 1 1 1
EF CO2-C (g kg-1) 464 464 464
EF CO (g kg-1) 210 210 210
EF CH4 (g kg-1) 21 21 21
Mass of fuel available for combustion (t dm ha-1) 217.8 133.1 48.4
CO emissions (t CO ha-1) 45.7 28.0 10.2
CH4 emissions (t CH4 ha-1) 4.6 2.8 1.0
CO2-C emissions (t C ha-1) 101.1 61.8 22.5
CO-C emissions (t C ha-1) 19.6 12.0 4.4
CH4-C emissions (t C ha-1) 3.4 2.1 0.8
Total C emissions (t C ha-1) 124.1 75.8 27.6
Source of CO2-C, CO and CH4 emission factors: Table 2.7, IPCC (2013)Source of burn depth, bulk density and combustion factor: Page et al. (2014)
Note: Emission factors for N2O and NOx are not provided by IPCC at Tier 1 level due to limited data for N2O and NOx emissions from organic soil fires.
EQUATION 2.8ANNUAL CO2 AND NON-CO2 EMISSIONS FROM ORGANIC SOIL FIRE
Lfire = A MB Cf Gef 10-3
Where:
Lfire = amount of CO2 or non-CO2 emissions, e.g. CH4 from fire, tonnesA = total area burnt annually, haMB = mass od fuel available for combustion, tonnes ha-1 (i.e. mass of dry organic spil fuel)
(default values in Table 2.6; units differ by gas spacies)Cf = combustion factor, dimensionlessGef = emission factor for each gas, g kg-1 dry matter burnt (default values in Table 2.7)

48 | Standard Methods for Estimating Greenhouse Gas Emissions from Forests and Peatlands in Indonesia (Version 2)
Nitrous oxide emissions from drained soil
Annual nitrous oxide emissions from organic soil were calculated by multiplying the annual area of drained peatland in a land-use category by Tier 1 default emission factors from IPCC 2013 (Table 7-5).
For the national pilot inventory the ‘plantation: oil palm’ emission factor was applied for all plantation and estate crops as oil palm represents the majority of plantations on peatland. The ‘forest land and cleared forest land (shrubland), drained’ emission factor was used for all land other than plantation and estate crops and rice paddy.
Table 7-5. Default nitrous oxide emission factors from organic soil.
Land-use category Emission factor (kg N2O-N ha-1 yr-1)
Forest land and cleared forest land (shrubland7), drained 2.4
Plantation: oil palm 1.2
Plantation: sago palm 3.3
Cropland except rice 5.0
Rice 0.4
Grassland 5.0
7.3 ANALYSIS
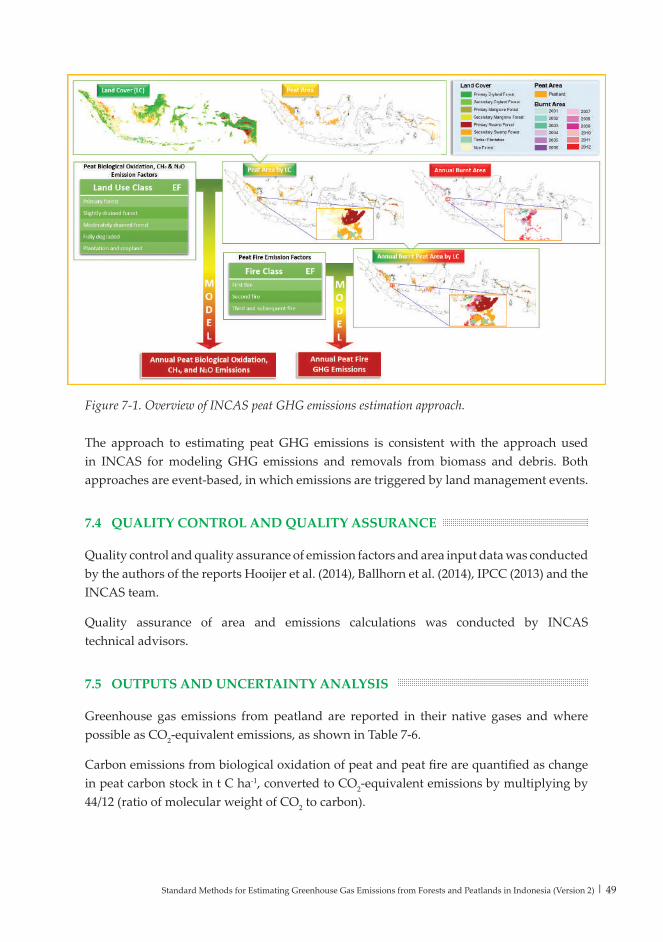
The overall approach is illustrated in Figure 7-1. Total annual GHG emissions are estimated by multiplying the area affected by drainage or fire by an activity specific emission factor. Separate emission factors are used for peat biological oxidation and peat fires. Emissions in fire years are comprised of both biological oxidation and peat fire emissions.
Standard Methods for Estimating Greenhouse Gas Emissions from Forests and Peatlands in Indonesia (Version 2) | 49
Figure 7-1. Overview of INCAS peat GHG emissions estimation approach.
The approach to estimating peat GHG emissions is consistent with the approach used in INCAS for modeling GHG emissions and removals from biomass and debris. Both approaches are event-based, in which emissions are triggered by land management events.
7.4 QUALITY CONTROL AND QUALITY ASSURANCE
Quality control and quality assurance of emission factors and area input data was conducted by the authors of the reports Hooijer et al. (2014), Ballhorn et al. (2014), IPCC (2013) and the INCAS team.
Quality assurance of area and emissions calculations was conducted by INCAS technical advisors.
7.5 OUTPUTS AND UNCERTAINTY ANALYSIS
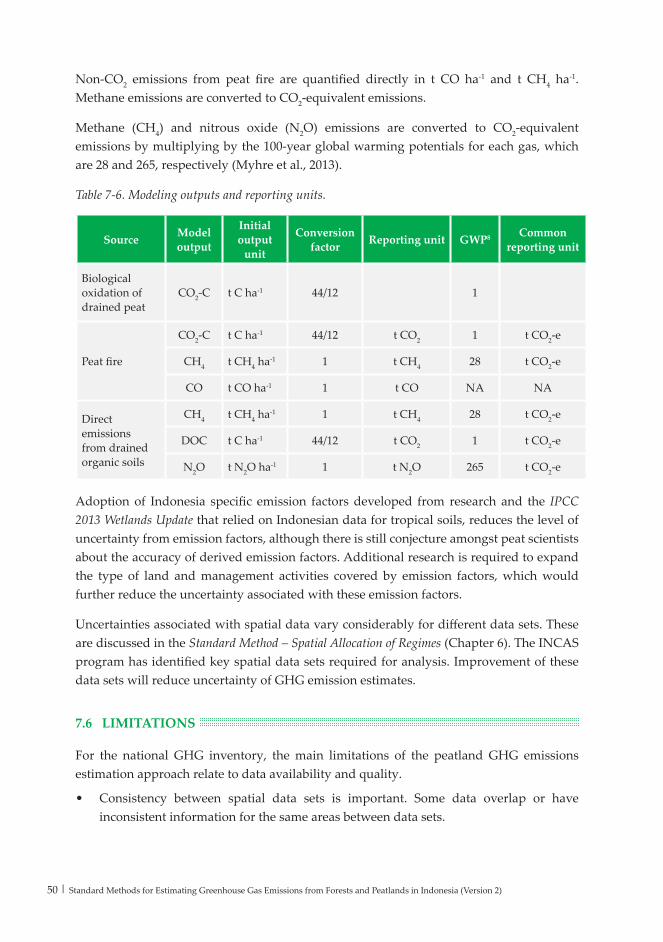
Greenhouse gas emissions from peatland are reported in their native gases and where possible as CO2-equivalent emissions, as shown in Table 7-6.
Carbon emissions from biological oxidation of peat and peat fire are quantified as change in peat carbon stock in t C ha-1, converted to CO2-equivalent emissions by multiplying by 44/12 (ratio of molecular weight of CO2 to carbon).
50 | Standard Methods for Estimating Greenhouse Gas Emissions from Forests and Peatlands in Indonesia (Version 2)
Non-CO2 emissions from peat fire are quantified directly in t CO ha-1 and t CH4 ha-1. Methane emissions are converted to CO2-equivalent emissions.
Methane (CH4) and nitrous oxide (N2O) emissions are converted to CO2-equivalent emissions by multiplying by the 100-year global warming potentials for each gas, which are 28 and 265, respectively (Myhre et al., 2013).
Table 7-6. Modeling outputs and reporting units.
Source Model output
Initial output
unit
Conversion factor Reporting unit GWP8 Common
reporting unit
Biological oxidation of drained peat
CO2-C t C ha-1 44/12 1
Peat fire
CO2-C t C ha-1 44/12 t CO2 1 t CO2-e
CH4 t CH4 ha-1 1 t CH4 28 t CO2-e
CO t CO ha-1 1 t CO NA NA
Direct emissions from drained organic soils
CH4 t CH4 ha-1 1 t CH4 28 t CO2-e
DOC t C ha-1 44/12 t CO2 1 t CO2-e
N2O t N2O ha-1 1 t N2O 265 t CO2-e
Adoption of Indonesia specific emission factors developed from research and the IPCC 2013 Wetlands Update that relied on Indonesian data for tropical soils, reduces the level of uncertainty from emission factors, although there is still conjecture amongst peat scientists about the accuracy of derived emission factors. Additional research is required to expand the type of land and management activities covered by emission factors, which would further reduce the uncertainty associated with these emission factors.
Uncertainties associated with spatial data vary considerably for different data sets. These are discussed in the Standard Method – Spatial Allocation of Regimes (Chapter 6). The INCAS program has identified key spatial data sets required for analysis. Improvement of these data sets will reduce uncertainty of GHG emission estimates.
7.6 LIMITATIONS
For the national GHG inventory, the main limitations of the peatland GHG emissions estimation approach relate to data availability and quality.
• Consistency between spatial data sets is important. Some data overlap or have inconsistent information for the same areas between data sets.
Standard Methods for Estimating Greenhouse Gas Emissions from Forests and Peatlands in Indonesia (Version 2) | 51
• Spatial extent of annual burnt area is important. Further work is needed to accurately determine areas burnt and fire intensity for historical fires.
• Methane emissions from drainage ditches are noted in IPCC 2013 as potentially significant, although insufficient information was available about drainage ditch location and size to include these in the National GHG inventory. Further work is required to provide more comprehensive data about drainage ditch location, sizes, condition and the distance from ditches that are impacted by drainage.
• Peat mapping, including peat boundaries and depth, needs to be improved.
• Land management information of peatlands, particularly land uses and intensity of management following forest clearing, were limited and should be improved.
• Data about water table depth in disturbed and managed peatland was not available for the whole of Indonesia. Further research should be undertaken to develop relationships between land management, canal management (including canal blocking) and water table depth and the resultant GHG emissions.
• Limited research indicates that peat biological emission factors for the first 5 years after clearing are significant. Further research should be undertaken to improve these estimates in terms of the quantity and timing of emissions.
7.7 IMPROVEMENT PLAN
GHG emissions from organic soil are substantially higher than net emissions from other carbon pools associated with deforestation, forest degradation, sustainable management of forest and enhancement of forest carbon stocks that are modelled using higher tier methods. This indicates that further work is needed to reduce uncertainty associated with peat GHG emission estimates. Ongoing research will help to reduce some sources of uncertainty. However, greater collaboration between custodians of data about peat and peatland management and further analysis of these data could yield earlier substantial improvements in peatland GHG emissions estimates. A detailed, prioritized, continuous improvement plan should be developed for peat activities and an overarching coordination body appointed to manage their implementation.
ISBN 978-979-8452-65-9
9 789798 452659
This publication describes in detail the standard methods of the Indonesian National Carbon Accounting System (INCAS) to quantify net greenhouse gas (GHG) emissions from forests and peatlands in Indonesia in a transparent, accurate, complete, consistent and comparable manner. The standard methods describe the approach and methods used for data collation, data analysis, quality control, quality assurance, modelling and reporting. The standard methods cover (i) Initial Conditions, (ii) Forest Growth and Turnover, (iii) Forest Management Events and Regimes, (iv) Forest Cover Change, (v) Spatial Allocation of Regimes, (vi) Peatland GHG Emissions, and (vii) Data Integration and Reporting. This second version of the standard methods includes improvements implemented in preparing the first comprehensive national GHG inventory for forests and peatlands, the results of which are reported in National Inventory of Greenhouse Gas Emissions and Removals on Indonesia’s Forests and Peatlands. This publication has been prepared and published by the Indonesian Ministry of Environment and Forestry, under the Research, Development and Innovation Agency.
MINISTRY OF ENVIRONMENT AND FORESTRYRESEARCH, DEVELOPMENT AND INNOVATION AGENCY© 2015