Pre-drilling geothermal assessment of porosity and ...
4
33 Denmark constitutes a low-enthalpy geothermal area. Current geothermal production takes place from two sandstone-rich formations: the Bunter Sandstone and Gas- sum Formations. These formations form major potential geothermal reservoirs, but information about the perme- ability of the potential sandstone reservoirs is difficult to obtain. This may be explained by deposition in a variety of environments under different climatic conditions, and by variable diagenetic overprint (Olivarius et al. 2015). Thus, the sandstone characteristics and properties are diverse, and in areas where wells are scarce, the assessment of the extent and reservoir properties of sandstone layers is associ- ated with much uncertainty. In order to reduce exploration risk it is therefore essential to develop a robust method for prediction of porosity and permeability prior to drilling. Kristensen et al. (2016) presented a five-step method for predicting porosity and permeability averages of prospec- tive geothermal formations in Danish onshore areas with low data density. The method is based on the sandstone reservoir characteristics of the Gassum Formation from geological and petrophysical data acquired in deep wells. The main purpose was to reduce the uncertainties associ- ated with prediction of reservoir properties. The study presented here investigates the efficiency of the five-step method when applied to the Bunter Sandstone Formation. The study area extends from the west coast of Denmark to the east coast of southernmost Sweden, and from the Danish border with Germany to just north of the Ringkøbing–Fyn High (Fig. 1). Farther north, the Bunter Sandstone Formation grades into the partly contemporary Skagerrak Formation. Eighteen wells provided well-log and core-analysis data from the formation. The five-step method Kristensen et al. (2016) developed the five-step method by integrating well log data from the Gassum Formation with porosity and permeability measurements obtained from conventional core analysis (CCAL). The main concept be- hind the method is that the porosity is related primarily to depth, whereas the permeability depends on a range of parameters including porosity, mineralogy, grain size and sorting. Thus, if the burial depth for a particular poten- tial reservoir layer is known, a relatively reliable porosity estimate may be derived (step 1). A permeability estimate may then be obtained from a porosity–permeability rela- Pre-drilling geothermal assessment of porosity and permeability of the Bunter Sandstone Formation, onshore Denmark Morten Leth Hjuler and Lars Kristensen Arnum-1 Hønning-1 Løgumkloster-1–2 Varnæs-1 Felsted-1 Kegnæs-1 Tønder-3–5 Jelling-1 Løve-1 Søllested-1 Ørslev-1 Margretheholm-1 Höllviksnäs-1 Stenlille-19 Rødby-1 50 km Danish well Swedish well Major fault Structural high N R i n g k ø b i n g – F y n H i g h N o r t h G e r m a n B a s i n D a n i s h B a s i n F a u l t z o n e 100 km Fig. 1. The approximate extent of the Bunter Sandstone Formation in southern Denmark and adjacent areas (as delimited by the map frame), showing major structural elements and locations of investigated wells. Maps showing e.g. the extent, thickness and data sources of the Bunter Sandstone Formation are available from theWebGIS portal at the Geological Survey of Denmark and Greenland (http://dybgeotermi.geus.dk/ ). © 2017 GEUS. Geological Survey of Denmark and Greenland Bulletin 38, 33–36. Open access: www.geus.dk/publications/bull
Transcript of Pre-drilling geothermal assessment of porosity and ...
33
Denmark constitutes a low-enthalpy geothermal area. Current geothermal production takes place from two sandstone-rich formations: the Bunter Sandstone and Gas-sum Formations. These formations form major potential geothermal reservoirs, but information about the perme-ability of the potential sandstone reservoirs is difficult to obtain. This may be explained by deposition in a variety of environments under different climatic conditions, and by variable diagenetic overprint (Olivarius et al. 2015). Thus, the sandstone characteristics and properties are diverse, and in areas where wells are scarce, the assessment of the extent and reservoir properties of sandstone layers is associ-ated with much uncertainty. In order to reduce exploration risk it is therefore essential to develop a robust method for prediction of porosity and permeability prior to drilling. Kristensen et al. (2016) presented a five-step method for predicting porosity and permeability averages of prospec-tive geothermal formations in Danish onshore areas with low data density. The method is based on the sandstone reservoir characteristics of the Gassum Formation from geological and petrophysical data acquired in deep wells. The main purpose was to reduce the uncertainties associ-ated with prediction of reservoir properties.
The study presented here investigates the efficiency of the five-step method when applied to the Bunter Sandstone Formation. The study area extends from the west coast of Denmark to the east coast of southernmost Sweden, and from the Danish border with Germany to just north of the Ringkøbing–Fyn High (Fig. 1). Farther north, the Bunter Sandstone Formation grades into the partly contemporary Skagerrak Formation. Eighteen wells provided well-log and core-analysis data from the formation.
The five-step methodKristensen et al. (2016) developed the five-step method by integrating well log data from the Gassum Formation with porosity and permeability measurements obtained from conventional core analysis (CCAL). The main concept be-hind the method is that the porosity is related primarily to depth, whereas the permeability depends on a range of parameters including porosity, mineralogy, grain size and sorting. Thus, if the burial depth for a particular poten-tial reservoir layer is known, a relatively reliable porosity estimate may be derived (step 1). A permeability estimate may then be obtained from a porosity–permeability rela-
Pre-drilling geothermal assessment of porosity and permeability of the Bunter Sandstone Formation, onshore Denmark
Morten Leth Hjuler and Lars Kristensen
Arnum-1Hønning-1
Løgumkloster-1–2 Varnæs-1
Felsted-1
Kegnæs-1
Tønder-3–5
Jelling-1Løve-1
Søllested-1 Ørslev-1
Margretheholm-1
Höllviksnäs-1
Stenlille-19
Rødby-1
50 km
Danish wellSwedish wellMajor faultStructural high
N
R i n g k ø b i n g – F y n H i g h
N o r t h G e r m a n B a s i n
D a n i s h B a s i n
F a u l t z o n e
100 km
Fig. 1. The approximate extent of the Bunter Sandstone Formation in southern Denmark and adjacent areas (as delimited by the map frame), showing major structural elements and locations of investigated wells. Maps showing e.g. the extent, thickness and data sources of the Bunter Sandstone Formation are available from theWebGIS portal at the Geological Survey of Denmark and Greenland (http://dybgeotermi.geus.dk/).
© 2017 GEUS. Geological Survey of Denmark and Greenland Bulletin 38, 33–36. Open access: www.geus.dk/publications/bull

3434
tion (steps 2–4), and finally, the uncertainty can be as-sessed (step 5). Therefore the depth of the sandstone layer is required. In areas with no wells, the depth can only be estimated from seismic data, which therefore indirectly control whether the five-step method can be applied. Be-low, the main components of the five steps are defined and explained; for a detailed description of the concept, refer to Kristensen et al. (2016). Step 1: Porosity–depth model. In order to predict the po-rosity of a formation, a regional porosity–depth relation is established. Log-derived, effective porosity data subjected to cut-off by shale content (<30%) and porosity (>15%) are averaged for each well and plotted against estimated maxi-mum burial depth. The resulting relation, the porosity–depth model, is expressed as ϕlog = a + b × D (Equation 1), where ϕlog is the log-derived porosity, D is the burial depth and a and b are constants. Step 2: Initial permeability model. An initial, basin-wide porosity–permeability relation based on core-analysis data is established in order to predict permeability. Subsequent to porosity cut-off (15%), this relation, i.e. the initial per-meability model, is expressed as kini = a × ϕcore
b (Equation 2), where kini is the core-gas permeability, ϕcore is the core porosity and a and b are constants. Step 3: General permeability model. This model uses log-derived, averaged permeabilities with the purpose of in-corporating a dataset encompassing the entire formation
and not only covering parts of the formation as is mostly the case with the core-based dataset used in step 2. Equa-tion 2 is used to calculate permeability estimates from the log-derived porosity. Shale and porosity cut-offs of 30% and 15%, respectively, are applied. A cross-plot between log-derived and averaged porosity and permeability data points forms the basis for definition of a general permeabil-ity model expressed as kg = a × ϕlog
b (Equation 3), where kg is the log-derived permeability, ϕlog is the log-derived porosity and a and b are constants. Step 4: Local permeability model. The general perme-ability model is adapted to local conditions by multiplying Equation 3 with a constant, C. Thus, the general perme-ability model constitutes a template for the local permea-bility model, which may be expressed as kL = C × kG (Equa-tion 4), where kL is the local permeability. Step 5: Permeability-uncertainty range. A local area fea-turing several wells with a sufficient amount of appropri-ate log data is selected and a local permeability model is established. The extensive source data ensure a statistically well-restrained model and a consistent uncertainty range, which is assumed to be applicable to local models with-in the same formation in other parts of the Danish area. Below, the results of applying the five-step method to the Bunter Sandstone Formation in Denmark are described.
Application of the five-step methodFourteen wells (Fig. 1) provided data for the generation of a porosity–depth model for the Bunter Sandstone Forma-tion (Fig. 2); data from the Løgumkloster-1, 2 and 2A wells were excluded because of their location in a fault zone (Fig. 1) where tectonic activity may have altered the sandstone properties. The porosity–depth model (step 1). Unfortunately, the scattered data distribution prevented derivation of a math-ematically defined trend line, and thus a reliable poros-
Porosity %
Rødby-1
Felsted-1
Kegnæs-1
Kværs-1
Margretheholm-1
Stenlille-19
Varnæs-1
Løve-1
Ørslev-1
Jelling-1
Søllested-1
Løgumkloster-2A
Løgumkloster-2 Løgumkloster-1
Tønder-3Tønder-4Tønder-5
Margretheholm-1
Stenlille-19
Løgumkloster-1
Tønder-4Tønder-5
Average net porosityPorosity–depth trendGluyas & Cade (1997)
1500
2000
2500
3000
35000 10 20 30
Estim
ated
max
imal
buria
l dept
h (m
)
Fig. 2. Porosity–depth model (step 1) for the Bunter Sandstone Forma-tion. The shown model (black line) is an estimate by the authors; the Løgumkloster wells were excluded from the model (see text) due to their location in a fault zone. A mechanical compaction curve (Gluyas & Cade 1997) is shown for comparison. Modified from Kristensen et al. (2016).
0 10 20 30 40 501
10
100
1000
10000
Gas
per
mea
bilit
y (m
D)
Porosity %Initial permeability model:κini = 48084 × φcore
3.4571
Arnum-1Hønning-1Höllviksnäs-1Rødby-1Stenlille-19Tønder-3Tønder-4Tønder-5
Porositycut-off
Fig. 3. Initial permeability model (step 2) for the Bunter Sandstone For-mation.
35
ity–depth model could not be generated. The shown trend line is the authors’ best estimate based on their general experience and knowledge of petrographic characteristics and diagenetic overprints. The generation of a permeabil-ity–depth model was attempted as an alternative to the po-rosity–depth model, but without success as the scattered data distribution prevented establishment of a well-defined trend line. The initial permeability model (step 2). Eight of the wells shown in Fig. 1 provided core-analysis data for the initial permeability model (Fig. 3). In order to generate a reli-able porosity–permeability relation based on comparable measurements, only permeabilities obtained from cleaned, unflawed plugs of productive lithologies, measured under similar testing conditions were used. Data from uncleaned plugs and data points representing low permeabilities (<1 mD) and unproductive lithologies (claystone/shale) were removed from the dataset. Subsequently, shale and poros-ity cut-offs of 30% and 15%, respectively, were applied.The initial permeability model is based on 360 data points and is expressed by Equation 5: kini = 48084 × ϕcore
3.4571, where kini is in mD and ϕcore is in per cent. The general permeability model (step 3). The log-derived permeability was calculated for 16 wells (Fig. 1) using Equation 5 with the log-derived porosity as input. Løgum-kloster-2A was discarded due to porosity cutoff. Subse-quently, the log-derived permeability was averaged and a cross-plot between averaged log-derived porosity and per-meability was generated (Fig. 4). The general permeability model is expressed by Equation 6: kg = 0.0026 × ϕlog
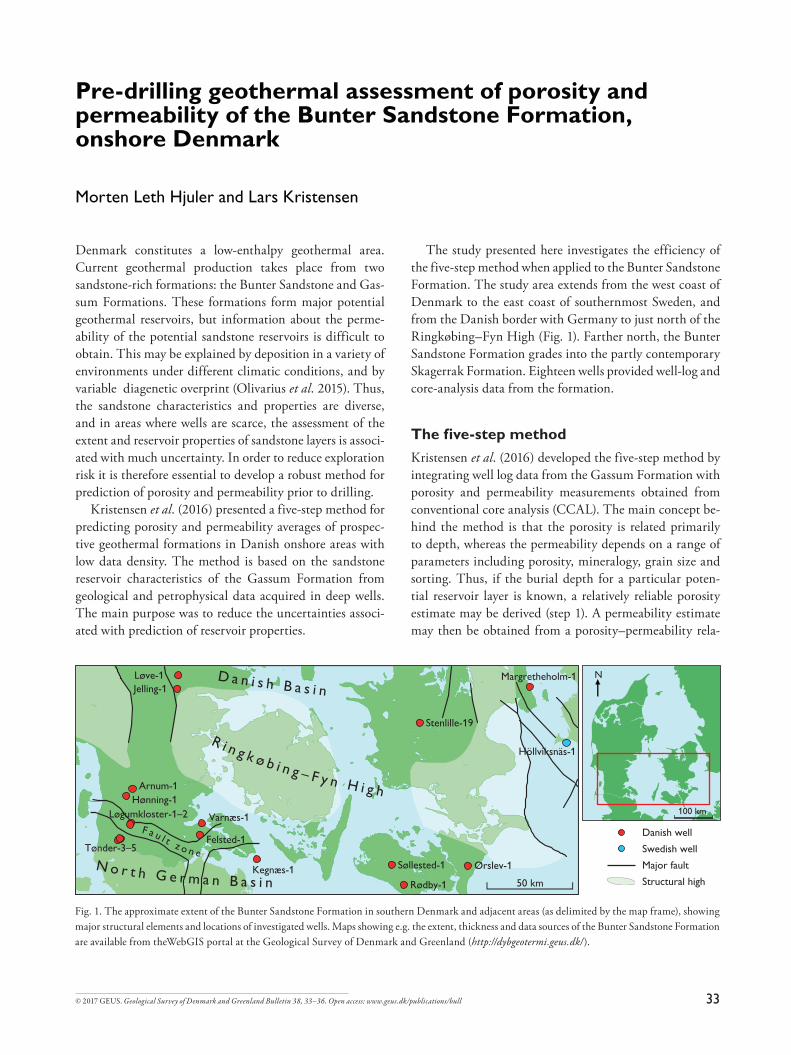
3.7843 (Fig. 4). The introduction of the general permeability mod-el imposes a slightly higher specific permeability estimate than that calculated from the initial permeability model, i.e., kg > kini (Fig. 4). The local permeability model (step 4). Local permeability models were generated for the Tønder and Stenlille areas
in order to demonstrate the variability of sandstone reser-voirs within the Bunter Sandstone Formation (Fig. 5). For the Tønder area, the local permeability model is expressed as kTønder = 1.7 × (0.0026 × ϕ3.7843) (Equation 7) and for the Stenlille area as kStenlille = 0.8 × (0.0026 × ϕ3.7843) (Equation 8). Permeability-uncertainty range (step 5). Only the Tønder area provides the data density needed for establishing an uncertainty range for a local permeability model. How-ever, the number of data-supplying wells is limited to 3 (Tønder-3–5), and the statistical basis from the available Bunter Sandstone Formation data is insufficient to assess the uncertainty range.
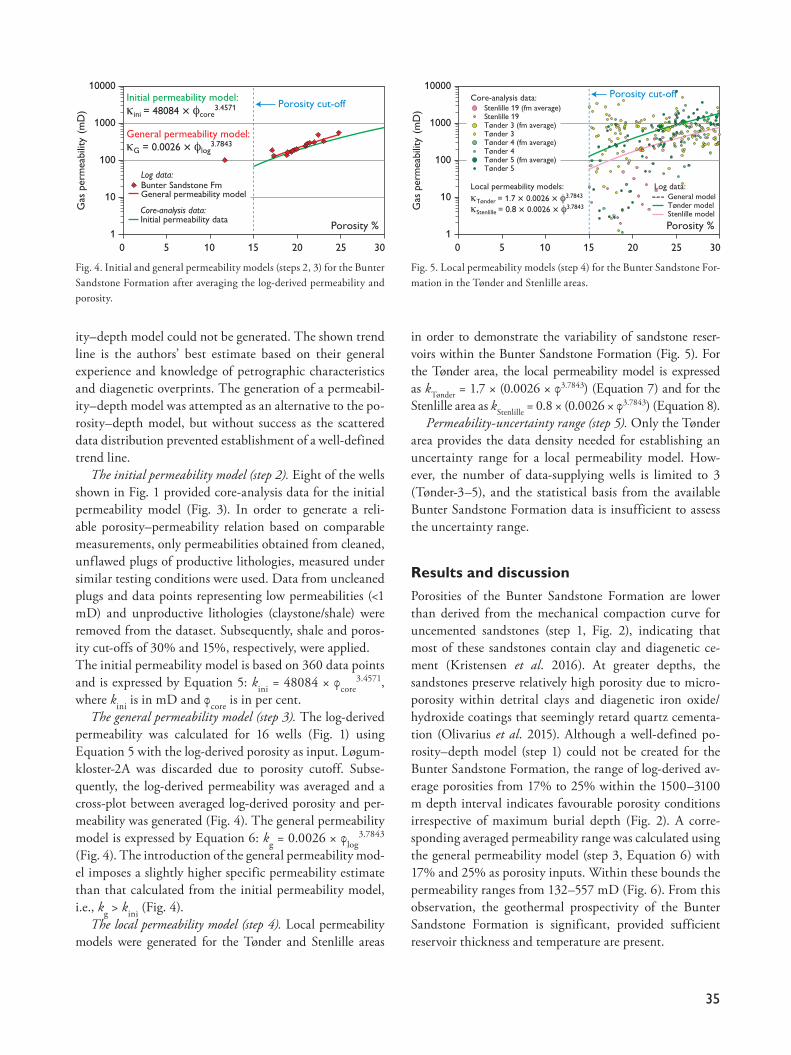
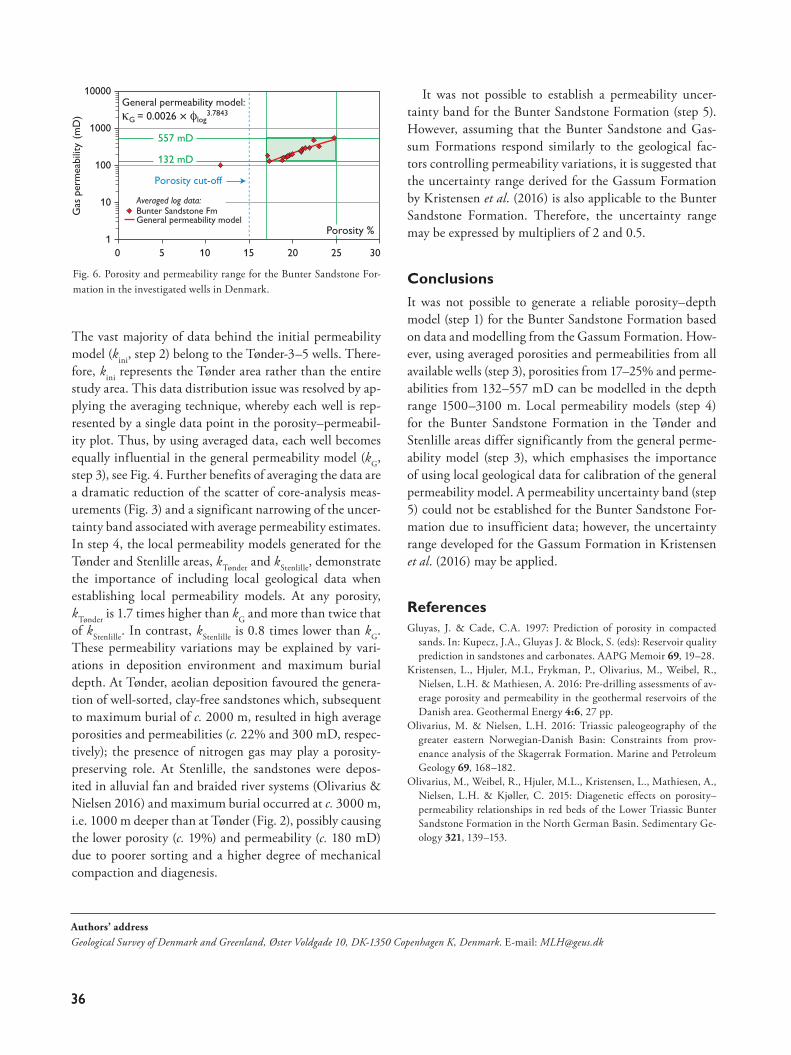
Results and discussionPorosities of the Bunter Sandstone Formation are lower than derived from the mechanical compaction curve for uncemented sandstones (step 1, Fig. 2), indicating that most of these sandstones contain clay and diagenetic ce-ment (Kristensen et al. 2016). At greater depths, the sandstones preserve relatively high porosity due to micro-porosity within detrital clays and diagenetic iron oxide/hydroxide coatings that seemingly retard quartz cementa-tion (Olivarius et al. 2015). Although a well-defined po-rosity–depth model (step 1) could not be created for the Bunter Sandstone Formation, the range of log-derived av-erage porosities from 17% to 25% within the 1500–3100 m depth interval indicates favourable porosity conditions irrespective of maximum burial depth (Fig. 2). A corre-sponding averaged permeability range was calculated using the general permeability model (step 3, Equation 6) with 17% and 25% as porosity inputs. Within these bounds the permeability ranges from 132–557 mD (Fig. 6). From this observation, the geothermal prospectivity of the Bunter Sandstone Formation is significant, provided sufficient reservoir thickness and temperature are present.
50 10 15 20 25 301
10
100
1000
10000G
as p
erm
eabi
lity
(mD
)
Porosity %
Log data:Bunter Sandstone FmGeneral permeability model
Porosity cut-off Initial permeability model:
General permeability model:
κini = 48084 × φcore
3.4571
κG = 0.0026 × φlog3.7843
Core-analysis data:Initial permeability data
Fig. 4. Initial and general permeability models (steps 2, 3) for the Bunter Sandstone Formation after averaging the log-derived permeability and porosity.
50 10 15 20 25 301
10
100
1000
10000
Gas
per
mea
bilit
y (m
D)
Core-analysis data:Stenlille 19 (fm average)Stenlille 19Tønder 3 (fm average)Tønder 3Tønder 4 (fm average)Tønder 4Tønder 5 (fm average)Tønder 5
Log data:General model Tønder model Stenlille model
Porosity cut-off
Local permeability models:κTønder = 1.7 × 0.0026 × φ3.7843
κStenlille = 0.8 × 0.0026 × φ3.7843
Porosity %
Fig. 5. Local permeability models (step 4) for the Bunter Sandstone For-mation in the Tønder and Stenlille areas.
3636
The vast majority of data behind the initial permeability model (kini, step 2) belong to the Tønder-3–5 wells. There-fore, kini represents the Tønder area rather than the entire study area. This data distribution issue was resolved by ap-plying the averaging technique, whereby each well is rep-resented by a single data point in the porosity–permeabil-ity plot. Thus, by using averaged data, each well becomes equally influential in the general permeability model (kG, step 3), see Fig. 4. Further benefits of averaging the data are a dramatic reduction of the scatter of core-analysis meas-urements (Fig. 3) and a significant narrowing of the uncer-tainty band associated with average permeability estimates.In step 4, the local permeability models generated for the Tønder and Stenlille areas, kTønder and kStenlille, demonstrate the importance of including local geological data when establishing local permeability models. At any porosity, kTønder is 1.7 times higher than kG and more than twice that of kStenlille. In contrast, kStenlille is 0.8 times lower than kG. These permeability variations may be explained by vari-ations in deposition environment and maximum burial depth. At Tønder, aeolian deposition favoured the genera-tion of well-sorted, clay-free sandstones which, subsequent to maximum burial of c. 2000 m, resulted in high average porosities and permeabilities (c. 22% and 300 mD, respec-tively); the presence of nitrogen gas may play a porosity-preserving role. At Stenlille, the sandstones were depos-ited in alluvial fan and braided river systems (Olivarius & Nielsen 2016) and maximum burial occurred at c. 3000 m, i.e. 1000 m deeper than at Tønder (Fig. 2), possibly causing the lower porosity (c. 19%) and permeability (c. 180 mD) due to poorer sorting and a higher degree of mechanical compaction and diagenesis.
It was not possible to establish a permeability uncer-tainty band for the Bunter Sandstone Formation (step 5). However, assuming that the Bunter Sandstone and Gas-sum Formations respond similarly to the geological fac-tors controlling permeability variations, it is suggested that the uncertainty range derived for the Gassum Formation by Kristensen et al. (2016) is also applicable to the Bunter Sandstone Formation. Therefore, the uncertainty range may be expressed by multipliers of 2 and 0.5.
ConclusionsIt was not possible to generate a reliable porosity–depth model (step 1) for the Bunter Sandstone Formation based on data and modelling from the Gassum Formation. How-ever, using averaged porosities and permeabilities from all available wells (step 3), porosities from 17–25% and perme-abilities from 132–557 mD can be modelled in the depth range 1500–3100 m. Local permeability models (step 4) for the Bunter Sandstone Formation in the Tønder and Stenlille areas differ significantly from the general perme-ability model (step 3), which emphasises the importance of using local geological data for calibration of the general permeability model. A permeability uncertainty band (step 5) could not be established for the Bunter Sandstone For-mation due to insufficient data; however, the uncertainty range developed for the Gassum Formation in Kristensen et al. (2016) may be applied.
ReferencesGluyas, J. & Cade, C.A. 1997: Prediction of porosity in compacted
sands. In: Kupecz, J.A., Gluyas J. & Block, S. (eds): Reservoir quality prediction in sandstones and carbonates. AAPG Memoir 69, 19–28.
Kristensen, L., Hjuler, M.L, Frykman, P., Olivarius, M., Weibel, R., Nielsen, L.H. & Mathiesen, A. 2016: Pre-drilling assessments of av-erage porosity and permeability in the geothermal reservoirs of the Danish area. Geothermal Energy 4:6, 27 pp.
Olivarius, M. & Nielsen, L.H. 2016: Triassic paleogeography of the greater eastern Norwegian-Danish Basin: Constraints from prov-enance analysis of the Skagerrak Formation. Marine and Petroleum Geology 69, 168–182.
Olivarius, M., Weibel, R., Hjuler, M.L., Kristensen, L., Mathiesen, A., Nielsen, L.H. & Kjøller, C. 2015: Diagenetic effects on porosity–permeability relationships in red beds of the Lower Triassic Bunter Sandstone Formation in the North German Basin. Sedimentary Ge-ology 321, 139–153.
50 10 15 20 25 301
10
100
1000
10000G
as p
erm
eabi
lity
(mD
)
Porosity %
Averaged log data:Bunter Sandstone FmGeneral permeability model
Porosity cut-off
132 mD
557 mD
General permeability model: κG = 0.0026 × φlog
3.7843
Fig. 6. Porosity and permeability range for the Bunter Sandstone For-mation in the investigated wells in Denmark.
Authors’ addressGeological Survey of Denmark and Greenland, Øster Voldgade 10, DK-1350 Copenhagen K, Denmark. E-mail: [email protected]