Orientational order parameter of a liquid crystalline ... · Orientational order parameter of a...
4
Orientational order parameter of a liquid crystalline compound by optical studies M. K. Usha *1 , P. Pardhasaradhi 2 and D. Revannasiddaiah 1 1 P.G. Department of Physics, St. Philomena’s College (Autonomous), Mysuru – 570015, Karnataka 2 SSD Polymers, Machilipatanam -521002, Andhra Pradesh *Email of corresponding author: [email protected] Abstract—The paper reports the refractive indices and density measurements at different temperatures in the nematic and liquid phases of liquid crystalline p-butoxybenzylidene p- propylaniline (4O.3). From these data, the orientational order parameter S has been estimated employing different approaches. The results obtained are compared and discussed. Key words: Liquid crystal, refractive index, density, nematic, orientational order parameter. 1. Introduction Liquid crystals possess a combination of properties of both crystalline solids and isotropic liquids, thus, providing scientists and engineers with one of the most active and fascinating fields of scientific and industrial research. The major application of liquid crystals is in construction of liquid crystal displays (LCDs). They also find innumerable applications in industries, photonics, imaging technology, biomedical field and in nanoscience and nanotechnology [1]. To understand the suitability and applicability of liquid crystalline systems in different applications, their basic characterization is very essential. The orientational order parameter, S defines the long-range orientational order in the liquid crystalline phase and plays an important role in the determination of the applicability of nematic liquid crystals in electro-optical devices. It can be estimated using techniques such as dielectric, diamagnetic susceptibility, elastic constants, X-rays, NMR, ESR, IR, etc. [1, 2]. However, optical method is most widely used for this purpose. Optical method involves the measurement of refractive indices and/or density as a function of temperature usually accompanied by calculation of polarizabilities. The molecular structure of the compound p-butoxybenzylidene p-propylaniline (4O.3) studied here is shown in Figure 1. The compound belongs to Schiff’s base nO.m class where n and m denote the alkoxy and alkyl chain lengths on either side of the rigid core. Literature survey reveals that extensive studies have been carried out on nO.m series compounds [3-5]. Rao et al. [3] have reported refractive index and density measurements of International Journal of Scientific & Engineering Research Volume 8, Issue 10, October-2017 ISSN 2229-5518 66 IJSER © 2017 http://www.ijser.org IJSER
Transcript of Orientational order parameter of a liquid crystalline ... · Orientational order parameter of a...
Orientational order parameter of a liquid crystalline compound by optical
studies
M. K. Usha*1, P. Pardhasaradhi2 and D. Revannasiddaiah1 1P.G. Department of Physics, St. Philomena’s College (Autonomous), Mysuru – 570015,
Karnataka 2SSD Polymers, Machilipatanam -521002, Andhra Pradesh
*Email of corresponding author: [email protected]
Abstract—The paper reports the refractive indices and density measurements at different
temperatures in the nematic and liquid phases of liquid crystalline p-butoxybenzylidene p-
propylaniline (4O.3). From these data, the orientational order parameter S has been estimated
employing different approaches. The results obtained are compared and discussed.
Key words: Liquid crystal, refractive index, density, nematic, orientational order parameter.
1. Introduction
Liquid crystals possess a combination of properties of both crystalline solids and isotropic
liquids, thus, providing scientists and engineers with one of the most active and fascinating
fields of scientific and industrial research. The major application of liquid crystals is in
construction of liquid crystal displays (LCDs). They also find innumerable applications in
industries, photonics, imaging technology, biomedical field and in nanoscience and
nanotechnology [1]. To understand the suitability and applicability of liquid crystalline
systems in different applications, their basic characterization is very essential.
The orientational order parameter, S defines the long-range orientational order in the
liquid crystalline phase and plays an important role in the determination of the applicability
of nematic liquid crystals in electro-optical devices. It can be estimated using techniques such
as dielectric, diamagnetic susceptibility, elastic constants, X-rays, NMR, ESR, IR, etc. [1, 2].
However, optical method is most widely used for this purpose. Optical method involves the
measurement of refractive indices and/or density as a function of temperature usually
accompanied by calculation of polarizabilities.
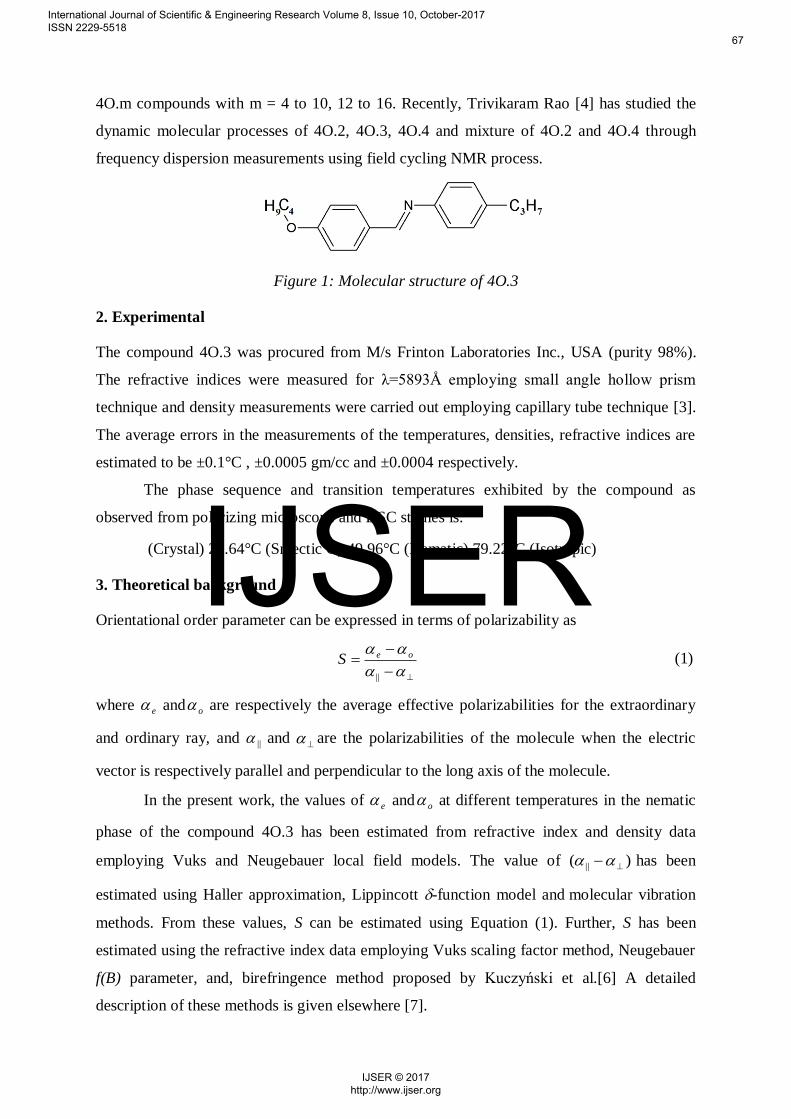
The molecular structure of the compound p-butoxybenzylidene p-propylaniline (4O.3)
studied here is shown in Figure 1. The compound belongs to Schiff’s base nO.m class where
n and m denote the alkoxy and alkyl chain lengths on either side of the rigid core.
Literature survey reveals that extensive studies have been carried out on nO.m series
compounds [3-5]. Rao et al. [3] have reported refractive index and density measurements of
International Journal of Scientific & Engineering Research Volume 8, Issue 10, October-2017 ISSN 2229-5518
66
IJSER © 2017 http://www.ijser.org
IJSER
4O.m compounds with m = 4 to 10, 12 to 16. Recently, Trivikaram Rao [4] has studied the
dynamic molecular processes of 4O.2, 4O.3, 4O.4 and mixture of 4O.2 and 4O.4 through
frequency dispersion measurements using field cycling NMR process.
Figure 1: Molecular structure of 4O.3
2. Experimental
The compound 4O.3 was procured from M/s Frinton Laboratories Inc., USA (purity 98%).
The refractive indices were measured for λ=5893Å employing small angle hollow prism
technique and density measurements were carried out employing capillary tube technique [3].
The average errors in the measurements of the temperatures, densities, refractive indices are
estimated to be ±0.1°C , ±0.0005 gm/cc and ±0.0004 respectively.
The phase sequence and transition temperatures exhibited by the compound as
observed from polarizing microscope and DSC studies is:
(Crystal) 28.64°C (Smectic G) 49.96°C (Nematic) 79.22°C (Isotropic)
3. Theoretical background
Orientational order parameter can be expressed in terms of polarizability as
||
oeS (1)
where e and o are respectively the average effective polarizabilities for the extraordinary
and ordinary ray, and || and are the polarizabilities of the molecule when the electric
vector is respectively parallel and perpendicular to the long axis of the molecule.
In the present work, the values of e and o at different temperatures in the nematic
phase of the compound 4O.3 has been estimated from refractive index and density data
employing Vuks and Neugebauer local field models. The value of )( || has been
estimated using Haller approximation, Lippincott -function model and molecular vibration
methods. From these values, S can be estimated using Equation (1). Further, S has been
estimated using the refractive index data employing Vuks scaling factor method, Neugebauer
f(B) parameter, and, birefringence method proposed by Kuczyński et al.[6] A detailed
description of these methods is given elsewhere [7].
International Journal of Scientific & Engineering Research Volume 8, Issue 10, October-2017 ISSN 2229-5518
67
IJSER © 2017 http://www.ijser.org
IJSER
4. Results and discussion
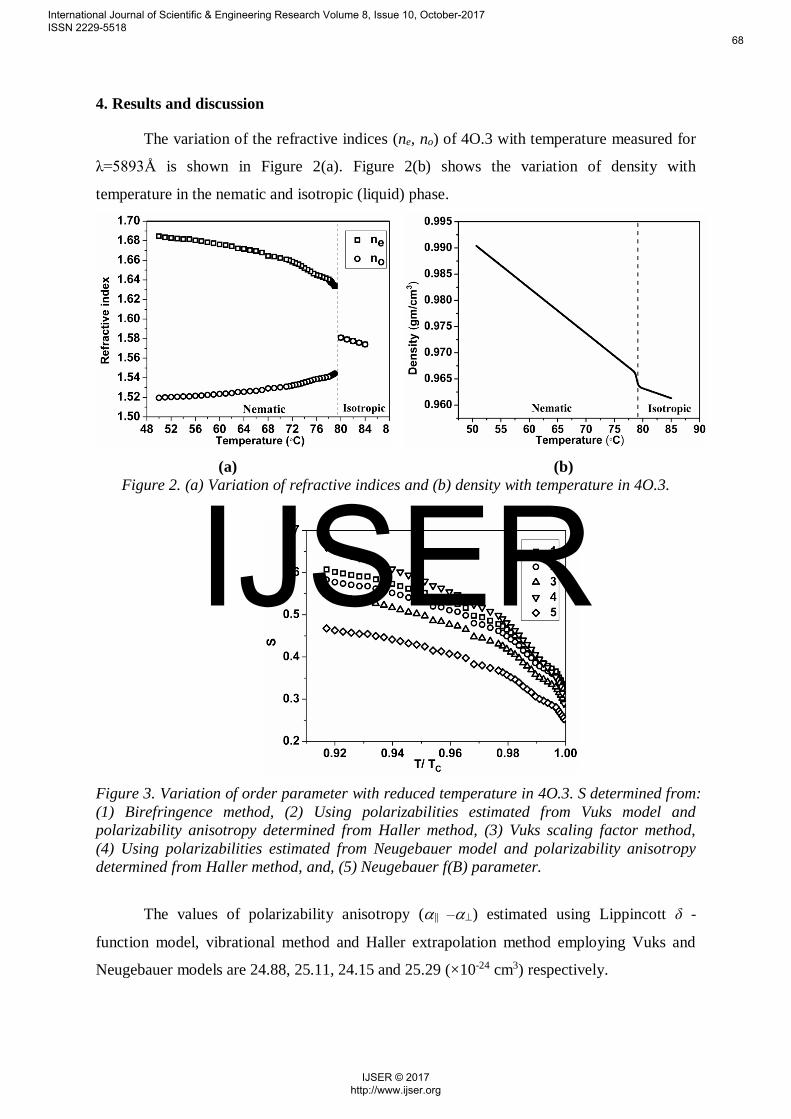
The variation of the refractive indices (ne, no) of 4O.3 with temperature measured for
λ=5893Å is shown in Figure 2(a). Figure 2(b) shows the variation of density with
temperature in the nematic and isotropic (liquid) phase.
(a) (b)
Figure 2. (a) Variation of refractive indices and (b) density with temperature in 4O.3.
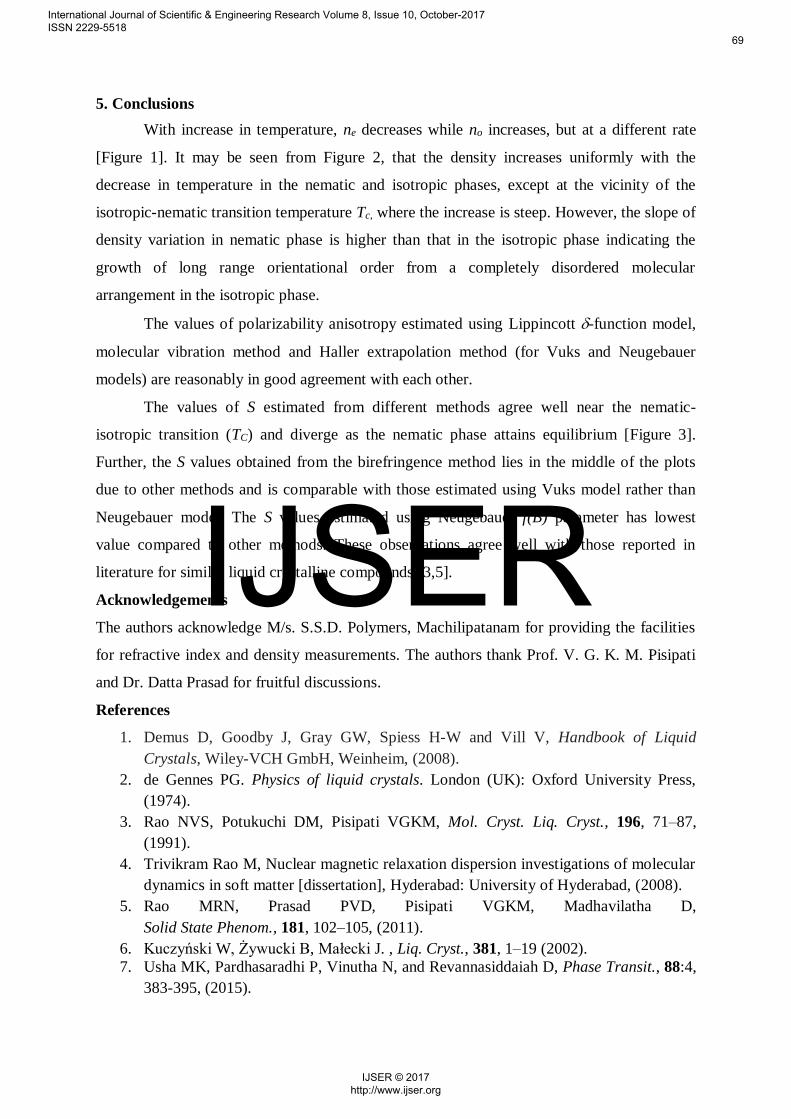
Figure 3. Variation of order parameter with reduced temperature in 4O.3. S determined from:
(1) Birefringence method, (2) Using polarizabilities estimated from Vuks model and
polarizability anisotropy determined from Haller method, (3) Vuks scaling factor method,
(4) Using polarizabilities estimated from Neugebauer model and polarizability anisotropy
determined from Haller method, and, (5) Neugebauer f(B) parameter.
The values of polarizability anisotropy (|| –) estimated using Lippincott δ -
function model, vibrational method and Haller extrapolation method employing Vuks and
Neugebauer models are 24.88, 25.11, 24.15 and 25.29 (×10-24 cm3) respectively.
International Journal of Scientific & Engineering Research Volume 8, Issue 10, October-2017 ISSN 2229-5518
68
IJSER © 2017 http://www.ijser.org
IJSER
5. Conclusions
With increase in temperature, ne decreases while no increases, but at a different rate
[Figure 1]. It may be seen from Figure 2, that the density increases uniformly with the
decrease in temperature in the nematic and isotropic phases, except at the vicinity of the
isotropic-nematic transition temperature Tc, where the increase is steep. However, the slope of
density variation in nematic phase is higher than that in the isotropic phase indicating the
growth of long range orientational order from a completely disordered molecular
arrangement in the isotropic phase.
The values of polarizability anisotropy estimated using Lippincott -function model,
molecular vibration method and Haller extrapolation method (for Vuks and Neugebauer
models) are reasonably in good agreement with each other.
The values of S estimated from different methods agree well near the nematic-
isotropic transition (TC) and diverge as the nematic phase attains equilibrium [Figure 3].
Further, the S values obtained from the birefringence method lies in the middle of the plots
due to other methods and is comparable with those estimated using Vuks model rather than
Neugebauer model. The S values estimated using Neugebauer f(B) parameter has lowest
value compared to other methods. These observations agree well with those reported in
literature for similar liquid crystalline compounds [3,5].
Acknowledgements
The authors acknowledge M/s. S.S.D. Polymers, Machilipatanam for providing the facilities
for refractive index and density measurements. The authors thank Prof. V. G. K. M. Pisipati
and Dr. Datta Prasad for fruitful discussions.
References
1. Demus D, Goodby J, Gray GW, Spiess H-W and Vill V, Handbook of Liquid
Crystals, Wiley-VCH GmbH, Weinheim, (2008).
2. de Gennes PG. Physics of liquid crystals. London (UK): Oxford University Press,
(1974).
3. Rao NVS, Potukuchi DM, Pisipati VGKM, Mol. Cryst. Liq. Cryst., 196, 71–87,
(1991).
4. Trivikram Rao M, Nuclear magnetic relaxation dispersion investigations of molecular
dynamics in soft matter [dissertation], Hyderabad: University of Hyderabad, (2008).
5. Rao MRN, Prasad PVD, Pisipati VGKM, Madhavilatha D,
Solid State Phenom., 181, 102–105, (2011).
6. Kuczyński W, Żywucki B, Małecki J. , Liq. Cryst., 381, 1–19 (2002).
7. Usha MK, Pardhasaradhi P, Vinutha N, and Revannasiddaiah D, Phase Transit., 88:4,
383-395, (2015).
International Journal of Scientific & Engineering Research Volume 8, Issue 10, October-2017 ISSN 2229-5518
69
IJSER © 2017 http://www.ijser.org
IJSER