SUPPLEMENTARY INFORMATION - Carnegie Mellon …ntpl.me.cmu.edu/pubs/ong_nmat17_si.pdf · 1...
24
Orientational order controls crystalline and amorphous thermal transport in superatomic crystals Wee-Liat Ong 1,2 , Evan S. O’Brien 1 , Patrick S. M. Dougherty 2 , Daniel W. Paley 1 , C. Fred Higgs III 2,3 , Alan J. H. McGaughey 2,4 , Jonathan A. Malen 2,4, *, Xavier Roy 1,* 1 Department of Chemistry, Columbia University, New York, New York 10027. 2 Department of Mechanical Engineering, Carnegie Mellon University, Pittsburgh, Pennsylvania 15213. 3 Department of Electrical and Computer Engineering, Carnegie Mellon University, Pittsburgh, Pennsylvania 15213. 4 Department of Materials Science and Engineering, Carnegie Mellon University, Pittsburgh, Pennsylvania 15213. * Corresponding authors Jonathan A. Malen - [email protected] Xavier Roy - [email protected] I. Synthesis of SACs II. Single crystal X-ray diffraction (SCXRD) III. FDTR fitting parameters IV. Heat capacity measurements and predictions for other SACs V. Nanoindentation VI. Calculation of longitudinal and transverse sound speeds VII. Minimum thermal conductivity model calculations VIII. Modified Callaway model for thermal conductivity with Born-von Karman dispersion IX. Temperature dependence of the thermal conductivity of SACs X. References SUPPLEMENTARY INFORMATION DOI: 10.1038/NMAT4739 NATURE MATERIALS | www.nature.com/naturematerials 1 © 2016 Macmillan Publishers Limited, part of Springer Nature. All rights reserved.
Transcript of SUPPLEMENTARY INFORMATION - Carnegie Mellon …ntpl.me.cmu.edu/pubs/ong_nmat17_si.pdf · 1...

1
Supplementary Information:
Orientational order controls crystalline and amorphous thermal transport in superatomic
crystals
Wee-Liat Ong1,2, Evan S. O’Brien1, Patrick S. M. Dougherty2, Daniel W. Paley1, C. Fred Higgs
III2,3, Alan J. H. McGaughey2,4, Jonathan A. Malen2,4,*, Xavier Roy1,*
1Department of Chemistry, Columbia University, New York, New York 10027. 2Department of Mechanical Engineering, Carnegie Mellon University, Pittsburgh, Pennsylvania
15213. 3Department of Electrical and Computer Engineering, Carnegie Mellon University, Pittsburgh,
Pennsylvania 15213. 4Department of Materials Science and Engineering, Carnegie Mellon University, Pittsburgh,
Pennsylvania 15213.
* Corresponding authors
Jonathan A. Malen - [email protected]
Xavier Roy - [email protected]
I. Synthesis of SACs
II. Single crystal X-ray diffraction (SCXRD)
III. FDTR fitting parameters
IV. Heat capacity measurements and predictions for other SACs
V. Nanoindentation
VI. Calculation of longitudinal and transverse sound speeds
VII. Minimum thermal conductivity model calculations
VIII. Modified Callaway model for thermal conductivity with Born-von Karman
dispersion
IX. Temperature dependence of the thermal conductivity of SACs
X. References
SUPPLEMENTARY INFORMATIONDOI: 10.1038/NMAT4739
NATURE MATERIALS | www.nature.com/naturematerials 1
© 2016 Macmillan Publishers Limited, part of Springer Nature. All rights reserved.
2
I. Synthesis of SACs
General Information: Triethylphosphine and triphenylphosphine were purchased from Sigma
Aldrich. Dicobalt octacarbonyl, tellurium and selenium powders were purchased from Strem
Chemicals. Cobalt bromide and sodium sulfide nonahydrate were purchased from Alfa Aesar.
C60 (99.5% assay) was obtained from BuckyUSA. All solvents were purchased from Fischer
Scientific and were purified by elution through a dual column solvent purification system
(MBraun SPS). All reaction and sample preparations were carried out under inert atmospheres
using standard Schlenk techniques or in a nitrogen-filled glovebox. Co6S8(PPh3)6, Co6Te8(PEt3)6,
Co6Se8(PEt3)6, and [Co6Se8(PEt3)6][C60]2 were prepared according to literature procedures1–4. 1H
NMR and 31P spectra were acquired on Bruker 400 and Bruker 500 spectrometers, respectively.
Co6S8(PEt3)6: A 20 mL cylindrical pressure vessel was loaded with Co6S8(PPh3)6 (200 mg,
0.092 mmol), PEt3 (600 mg, 5.078 mmol) and tetrahydrofuran (10 mL). The sealed vessel was
sealed under an N2 atmosphere with a PTFE bushing and a perfluorinated O-ring. The reaction
was heated to 75 ºC for 48 hours. The flask was cooled to room temperature, resulting in the
precipitation of a dark solid. The vessel was opened in a nitrogen-filled glovebox and the
solution was centrifuged. The fine brown crystals were washed rinsed with diethyl ether (5 mL)
and dried in vacuo. Yield: 115 mg (95 % yield)
1H NMR (400 MHz, [toluene-d8], 298 K): δ = 1.08-1.19 (9H, m), 1.88-2.00 (6H, m)
31P NMR (203 MHz, [toluene-d8], 298 K): 45 (broad)
[Co6Te8(PEt3)6][C60]2: Co6Te8(PEt3)6 (29.4 mg, 0.014 mmol) and C60 (19.9 mg, 0.028 mmol)
were dissolved in toluene (8 mL) and 1-methylnapthalene (8 mL), respectively. The solutions
were filtered through 0.2 µm PTFE filters. The solution of Co6Te8(PEt3)6 was slowly layered
onto the solution of C60 and was left undisturbed to diffuse for 18 hrs. Black crystals formed on
the walls of the vial, which were subsequently washed with toluene (3 mL) and hexanes (3 mL),
and dried in vacuo. Yield: 37 mg (76 % yield)
© 2016 Macmillan Publishers Limited, part of Springer Nature. All rights reserved.

3
Co6E8(PEt3)6, single crystal (E = S, Se, Te): Co6E8(PEt3)6 (20 mg) was dissolved in toluene (10
mL) and filtered through a 0.2 µm PTFE filter. Single crystals were grown by evaporating the
toluene solution for 5 days in the glovebox.
Figure S1: Optical microscope image of [Co6Te8(PEt3)6][C60]2 crystals grown onto a Si/SiO2
substrate. Scale bar is 100 µm.
Figure S2: Optical microscope image of a [Co6Se8(PEt3)6][C60]2 crystal grown onto a
Si/SiO2 substrate. Scale bar is 100 µm.
© 2016 Macmillan Publishers Limited, part of Springer Nature. All rights reserved.

4
Figure S3: Optical microscope image of a [Co6Se8(PEt3)6][C60]2 crystal grown onto a
Si/SiO2 substrate, coated with a thin gold layer (60 nm). Scale bar is 100 µm.
II. Single crystal X-ray diffraction
Single-crystal XRD experiments were performed on an Agilent SuperNova
diffractometer using mirror-monochromated Mo K radiation. In a typical experiment, crystals
were mounted in oil on a MiTeGen microloop and cooled to 100 K on the diffractometer.
Complete data were collected to 0.8 Å resolution. Data collection, integration, scaling
(ABSPACK) and absorption correction (face-indexed Gaussian integration5 or numeric
analytical methods6) were performed in CrysAlisPro7. Structures were solved by direct methods
in ShelXT8 or by charge flipping in SuperFlip9. Subsequent refinement was performed by full-
matrix least-squares on F2 in ShelXL. Olex210 was used for viewing and to prepare CIF files.
PLATON11 was used extensively for SQUEEZE12, ADDSYM13 and TwinRotMat. Many
disordered solvent molecules were modeled as rigid fragments from the Idealized Molecular
Geometry Library14. ORTEP graphics were prepared in CrystalMaker15. Thermal ellipsoids are
rendered at the 50 % probability level.
© 2016 Macmillan Publishers Limited, part of Springer Nature. All rights reserved.
5
Crystal data for all compounds are given in Tables S1-S5. Crystal structures featuring
thermal parameters for Co6S8(PEt3)6, Co6Se8(PEt3)6, [Co6Se8(PEt3)6][C60]2, and
[Co6Te8(PEt3)6][C60]2 at 100 K are shown in Fig. S4-S7, respectively. Crystal data for
Co6Te8(PEt3)6 has been reported by Steigerwald and coworkers3. Non-routine crystallographic
details are provided below. The X-ray crystallographic coordinates for all structures are
deposited at the Cambridge Crystallographic Data Centre (CCDC) with their CCDC deposition
numbers shown in Tables S1-S5. These structures can be obtained online from the
Supplementary Information or http://www.ccdc.cam.ac.uk/.
© 2016 Macmillan Publishers Limited, part of Springer Nature. All rights reserved.

6
Table S1: Crystallographic data for [Co6Se8(PEt3)6][C60]2 P�̅� phase.
Compound [Co6Se8(PEt3)6][C60]2
Formula C156H90Co6P6Se8
MW 3135.35
Space group P3̅
a (Å) 15.7282(4) 15.7619(4) 15.7561(5) 15.7555(4) 15.7613(5)
b (Å) 15.7282(4) 15.7619(4) 15.7561(5) 15.7555(4) 15.7613(5)
c (Å) 12.5180(3) 12.5214(4) 12.5521(4) 12.5483(4) 12.5433(4)
α (°) 90 90 90 90 90
β (°) 90 90 90 90 90
γ (°) 120 120 120 120 120
V (Å3) 2681.78(14) 2694.02(16) 2698.63(18) 2697.61(17) 2698.52(19)
Z 1 1 1 1 1
ρcalc (g cm-3) 1.941 1.933 1.929 1.930 1.929
T (K) 100.00 125.02 150.01 175.08 185.01
λ (Å) 0.71073 0.71073 0.71073 0.71073 0.71073
2θmin, 2θmax 6.81, 59.106 6.8, 58.816 6.798, 58.912 6.798, 59.108 6.796, 58.944
Nref 14621 14068 14275 14144 13577
R(int), R(σ) 0.0592, 0.0688 0.0614, 0.0720 0.0594, 0.0695 0.0607, 0.0730 0.0569, 0.0734
μ(mm-1) 3.775 3.758 3.752 3.753 3.752
Tmax, Tmin 0.696, 0.543 0.716, 0.566 0.694, 0.565 0.682, 0.554 0.708, 0.594
Data 4237 4161 4196 4166 4042
Restraints 195 195 195 195 195
Parameters 269 269 269 269 269
R1(obs) 0.0401 0.0464 0.0427 0.0443 0.0476
wR2(all) 0.0715 0.0842 0.0793 0.0857 0.0947
S 1.041 1.047 1.053 1.058 1.030
Peak, hole (e- Å-3) 0.84, -0.70 0.73, -0.66 0.88, -0.59 0.71, -0.73 0.72, -0.59
CCDC code 1497864 1497865 1497866 1497867 1497868
© 2016 Macmillan Publishers Limited, part of Springer Nature. All rights reserved.

7
Table S2: Crystallographic data for [Co6Se8(PEt3)6][C60]2 P�̅�m1 phase.
Compound [Co6Se8(PEt3)6][C60]2
Formula C156H90Co6P6Se8
MW 3135.35
Space group P3̅m1
a (Å) 15.8509(6) 15.8375(6) 15.8557(6) 15.8701(7) 15.8973(9) 15.8892(8)
b (Å) 15.8509(6) 15.8375(6) 15.8557(6) 15.8701(7) 15.8973(9) 15.8892(8)
c (Å) 12.4594(6) 12.4482(5) 12.4718(5) 12.4870(6) 12.5253(7) 12.5166(9)
α (°) 90 90 90 90 90 90
β (°) 90 90 90 90 90 90
γ (°) 120 120 120 120 120 120
V (Å3) 2711.0(2) 2704.0(2) 2715.4(2) 2723.6(3) 2741.4(4) 2736.7(3)
Z 1 1 1 1 1 1
ρcalc (g cm-3) 1.920 1.925 1.917 1.912 1.899 1.902
T (K) 190.02 200.00 225.00 250.00 275.01 300.01
λ (Å) 0.71073 0.71073 0.71073 0.71073 0.71073 0.71073
2θmin, 2θmax 6.778, 59.136 6.784, 58.954 6.774, 58.934 6.768, 59.258 6.506, 58.988 6.758, 59.248
Nref 13706 14570 14544 14732 15294 14051
R(int), R(σ) 0.0628, 0.0553 0.0649, 0.0558 0.0662, 0.0555 0.0677, 0.0563 0.0729, 0.0610 0.0692, 0.0631
μ(mm-1) 3.735 3.744 3.729 3.717 3.693 3.700
Tmax, Tmin 0.714, 0.587 0.694, 0.561 0.695, 0.566 0.707, 0.578 0.718, 0.566 0.694, 0.517
Data 2353 2468 2464 2409 2501 2452
Restraints 17 17 17 17 17 17
Parameters 106 106 106 106 106 106
R1(obs) 0.0494 0.0459 0.0486 0.0542 0.0531 0.0552
wR2(all) 0.1039 0.1011 0.1051 0.1155 0.1159 0.1189
S 1.020 1.051 1.053 1.051 1.041 1.038
Peak, hole (e- Å-3) 0.85, -1.00 0.96, -0.95 0.95, -1.19 0.80, -1.25 0.83, -0.79 0.67, -0.92
CCDC code 1497869 1497870 1497871 1497872 1497873 1497874
© 2016 Macmillan Publishers Limited, part of Springer Nature. All rights reserved.
8
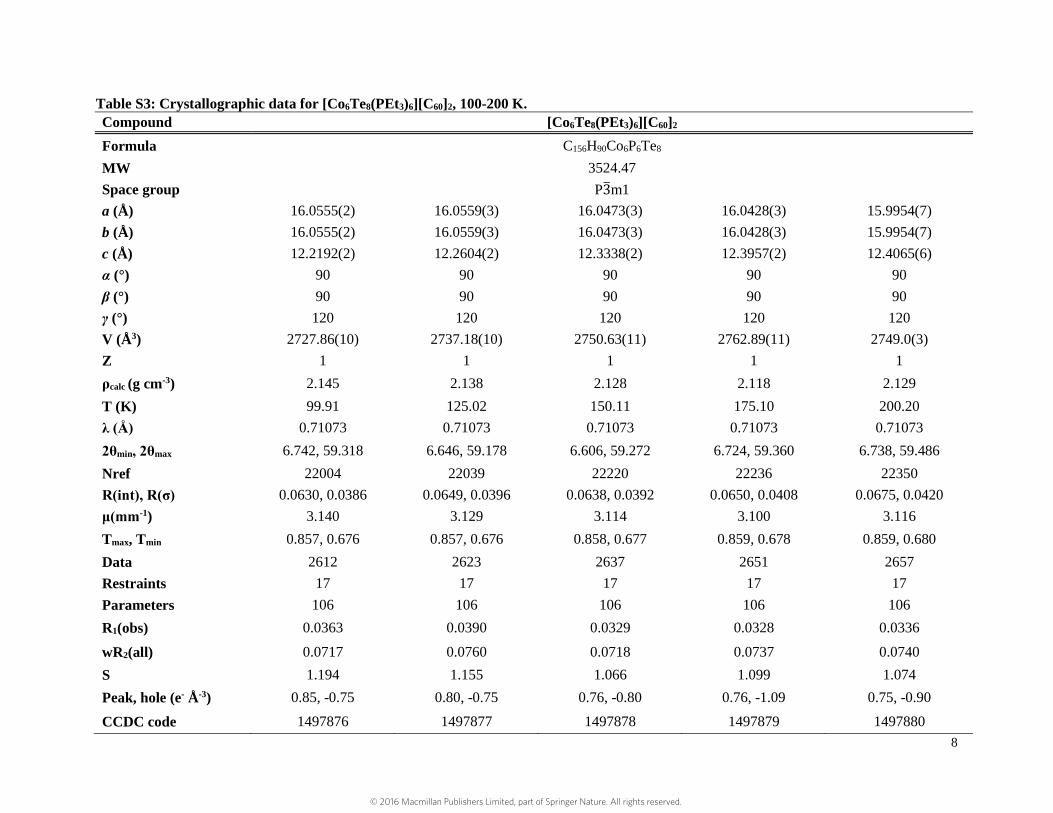
Table S3: Crystallographic data for [Co6Te8(PEt3)6][C60]2, 100-200 K.
Compound [Co6Te8(PEt3)6][C60]2
Formula C156H90Co6P6Te8
MW 3524.47
Space group P3̅m1
a (Å) 16.0555(2) 16.0559(3) 16.0473(3) 16.0428(3) 15.9954(7)
b (Å) 16.0555(2) 16.0559(3) 16.0473(3) 16.0428(3) 15.9954(7)
c (Å) 12.2192(2) 12.2604(2) 12.3338(2) 12.3957(2) 12.4065(6)
α (°) 90 90 90 90 90
β (°) 90 90 90 90 90
γ (°) 120 120 120 120 120
V (Å3) 2727.86(10) 2737.18(10) 2750.63(11) 2762.89(11) 2749.0(3)
Z 1 1 1 1 1
ρcalc (g cm-3) 2.145 2.138 2.128 2.118 2.129
T (K) 99.91 125.02 150.11 175.10 200.20
λ (Å) 0.71073 0.71073 0.71073 0.71073 0.71073
2θmin, 2θmax 6.742, 59.318 6.646, 59.178 6.606, 59.272 6.724, 59.360 6.738, 59.486
Nref 22004 22039 22220 22236 22350
R(int), R(σ) 0.0630, 0.0386 0.0649, 0.0396 0.0638, 0.0392 0.0650, 0.0408 0.0675, 0.0420
μ(mm-1) 3.140 3.129 3.114 3.100 3.116
Tmax, Tmin 0.857, 0.676 0.857, 0.676 0.858, 0.677 0.859, 0.678 0.859, 0.680
Data 2612 2623 2637 2651 2657
Restraints 17 17 17 17 17
Parameters 106 106 106 106 106
R1(obs) 0.0363 0.0390 0.0329 0.0328 0.0336
wR2(all) 0.0717 0.0760 0.0718 0.0737 0.0740
S 1.194 1.155 1.066 1.099 1.074
Peak, hole (e- Å-3) 0.85, -0.75 0.80, -0.75 0.76, -0.80 0.76, -1.09 0.75, -0.90
CCDC code 1497876 1497877 1497878 1497879 1497880
© 2016 Macmillan Publishers Limited, part of Springer Nature. All rights reserved.

9
Table S4: Crystallographic data for [Co6Te8(PEt3)6][C60]2, 225-300 K.
Compound [Co6Te8(PEt3)6][C60]2
Formula C156H90Co6P6Te8
MW 3524.47
Space group P3̅m1
a (Å) 16.0630(3) 16.0702(3) 16.0818(3) 16.0906(4)
b (Å) 16.0630(3) 16.0702(3) 16.0818(3) 16.0906(4)
c (Å) 12.4534(3) 12.4759(3) 12.5063(3) 12.5353(3)
α (°) 90 90 90 90
β (°) 90 90 90 90
γ (°) 120 120 120 120
V (Å3) 2782.72(12) 2790.28(13) 2801.11(13) 2810.68(14)
Z 1 1 1 1
ρcalc (g cm-3) 2.103 2.097 2.089 2.082
T (K) 225.11 250.07 275.01 300.05
λ (Å) 0.71073 0.71073 0.71073 0.71073
2θmin, 2θmax 6.710, 59.218 6.704, 59.164 6.698, 59.136 6.690, 59.356
Nref 22516 22651 22731 22794
R(int), R(σ) 0.0684, 0.0425 0.0679, 0.0426 0.0696, 0.0439 0.0741, 0.0463
μ(mm-1) 3.078 3.070 3.058 3.047
Tmax, Tmin 0.860, 0.681 0.860, 0.682 0.861, 0.683 0.861, 0.683
Data 2673 2685 2693 2697
Restraints 17 17 17 17
Parameters 106 106 106 106
R1(obs) 0.0360 0.0371 0.0396 0.0385
wR2(all) 0.0826 0.0868 0.0931 0.0918
S 1.074 1.098 1.074 1.074
Peak, hole (e- Å-3) 0.95, -0.68 0.76, -1.04 0.76, -1.09 0.96, -0.92
CCDC code 1497881 1497882 1497883 1497884
© 2016 Macmillan Publishers Limited, part of Springer Nature. All rights reserved.

10
Table S5: Crystallographic data for unary SACs. Crystal data for Co6Te8(PEt3)6 at room temperature has been previously reported3.
Compound [Co6S8(PEt3)6][C7H8] [Co6Se8(PEt3)6][C7H8] [Co6Te8(PEt3)6]
Formula C43H98Co6P6S8 C43H98Co6P6Se8 C36H90Co6P6Te8
MW 1411.09 1786.29 2083.27
Space group R3̅ P1̅ R3̅ P1̅
a (Å) 16.765(2) 16.9491(7) 11.6534(7) 17.1316(6) 12.1664(4)
b (Å) 16.765(2) 16.9491(7) 11.7631(7) 17.1316(6) 13.0458(5)
c (Å) 19.201(3) 19.2886(8) 11.7664(5) 19.4810(8) 20.1918(8)
α (°) 90 90 93.439(4) 90 88.869(3)
β (°) 90 90 90.535(4) 90 86.318(3)
γ (°) 120 120 94.120(5) 120 70.724(2)
V (Å3) 4668.6(13) 4798.7(5) 1605.72(15) 4951.5(4) 3018.9(2)
Z 3 3 1 3 2
ρcalc (g cm-3) 1.506 1.465 1.847 1.797 2.292
T (K) 100.01 293.00 100.01 293.00 100.01
λ (Å) 0.71073 0.71073 0.71073 0.71073 0.71073
2θmin, 2θmax 7.040, 59.260 6.976, 52.738 6.940, 59.312 6.904, 58.950 6.618, 59.526
Nref 14634 3963 8273 13363 18995
R(int), R(σ) 0.0964, 0.0716 0.0570, 0.0884 0.0490, 0.0717 0.0583, 0.0512 0.0550, 0.0573
μ(mm-1) 2.013 1.959 6.225 6.056 5.583
Tmax, Tmin 0.875, 0.806 0.875, 0.829 0.436, 0.400 0.611, 0.464 0.609, 0.331
Data 2628 3963 8273 2760 18995
Restraints 87 7 156 8 216
Parameters 137 103 362 102 524
R1(obs) 0.0431 0.0428 0.0548 0.0382 0.0580
wR2(all) 0.0929 0.0876 0.1413 0.0770 0.1575
S 1.062 0.906 0.978 1.022 1.033
Peak, hole (e- Å-3) 0.63, -0.77 0.64, -0.58 1.47, -1.47 0.51, -0.48 2.44, -2.60
CCDC code 1497860 1497861 1497862 1497863 1497875
© 2016 Macmillan Publishers Limited, part of Springer Nature. All rights reserved.

11
Figure S4: Molecular structure of Co6S8(PEt3)6. S, green; Co, blue; P, orange; C, black.
Hydrogen atoms are removed to clarify the view. Disordered toluene not depicted.
Figure S5: Molecular structure of Co6Se8(PEt3)6. Se, yellow; Co, blue; P, orange; C, black.
Hydrogen atoms are removed to clarify the view. Disordered toluene not depicted.
© 2016 Macmillan Publishers Limited, part of Springer Nature. All rights reserved.

12
Figure S6: Crystal structure of [Co6Se8(PEt3)6][C60]2. Se, yellow; Co, blue; P, orange; C,
black. Hydrogen atoms are removed to clarify the view.
Figure S7: Crystal structure of [Co6Te8(PEt3)6][C60]2. Te, red; Co, blue; P, orange; C,
black. Hydrogen atoms are removed to clarify the view.
Lattice measurements: For observing the trends in cell dimensions with varying
temperature, we measured the lattices as accurately as possible in CrysAlisPro. The data sets
were fitted with the Proffit module to generate accurate 3D reflection profiles, and the
resulting peak tables were recycled into Ewald Explorer. These were indexed with an
extremely small (0.02*h) peak matching window, which ensured that the lattice
measurements used an accurately measured subset of the diffraction data. Since the fully
refined crystal structures used the complete data sets, the lattice parameters reported in the
attached .cif files are somewhat less precise.
[Co6Se8(PEt3)6][C60]2, P �̅� phase: The crystal was a non-merohedral twin by a twofold
rotation around (11̅1). When the structure was solved from the isolated reflections of the
© 2016 Macmillan Publishers Limited, part of Springer Nature. All rights reserved.

13
major component, it was clear that each domain was additionally twinned by the common
merohedral twin operation 2(110). A four-component HKLF 5 file was prepared by hand, but
the weak reflections of the minor non-merohedrally related domain did not improve the
refinement. Instead, an HKLF 4 file was generated from the isolated reflections of the first
component, rejecting all overlapped reflections. This was treated routinely as a merohedral
twin. The strongly anisotropic ADPs of the ordered C60 required the use of RIGU to stabilize
the refinement.
[Co6Se8(PEt3)6][C60]2, P�̅�m1 phase: For [Co6Se8(PEt3)6][C60]2, the isolated reflections of
the major twin component were selected as described above. Each structure was solved using
ShelXT to locate all non-H atoms of the cluster and to approximately locate the C60. The
entire PEt3 ligand is disordered over the mirror plane in this phase, so the alkyl groups were
located with the help of DFIX restraints for the beginning stage of the refinement.
When a reasonable starting model was constructed, the C60 was introduced as a rigid
fragment from the IMGL. The C60 was introduced in three independent positions, with total
occupancy of 1/6 determined by its 3m. site symmetry. The three independent C60 molecules
were restrained to be concentric by the use of a dummy atom lying on the crystallographic
threefold axis. Furthermore, a floating “target” atom was located on the threefold axis at a
distance of about 3.5 Å, the diameter of a C60 molecule. Each independent C60 had a dummy
atom included in its rigid body model: one on a C atom, one in the center of a 5-membered
ring, one in the center of a six-membered ring. Each of these three dummy atoms was
restrained to lie near the “target” atom with a moderate esd on the restraint. The result was a
model in which the C60 molecular threefold axis, the molecular fivefold axis, or a carbon
atom could align with the crystallographic threefold axis. The occupancies of these three
possibilities were refined. Due to extensive correlation between ADPs, a single isotropic
group ADP was refined for all C60 carbon atoms in each structure. The refinements were very
unstable, as expected for a model with many overlapping atoms on a special position, and
DAMP was employed carefully with moderate weight to stabilize the refinement without
introducing bias.
© 2016 Macmillan Publishers Limited, part of Springer Nature. All rights reserved.

14
The refinements show that the fullerene in [Co6Se8(PEt3)6][C60]2 does not significantly prefer
any orientation in the P3̅m1 phase, although we note that the low-temperature P3̅ phase
entails a perfect alignment of the molecular and crystallographic threefold axes
Co6S8(PEt3)6C7H8: The crystal was slightly cracked, and the resulting split reflections were
treated as a non-merohedral twin with a small 3° rotation around an arbitrary axis. The
weaker isolated reflections of the second component were omitted.
© 2016 Macmillan Publishers Limited, part of Springer Nature. All rights reserved.

15
III. FDTR fitting parameters
Table S6: Fitting parameters for FDTR.
Layer
Thickness
Thermal Conductivity
(W/m-K)
Volumetric Heat Capacity
(kJ/m3-K)
Au Layer 60 - 70 nm
(measured by
AFM)
Measure using 4-point
probe method and
calculate kAu from
Weidemann-Franz Law
2500 (@ 300 K, otherwise use
ref. 16)
SAC
crystal
>100 μm
(estimated from
top view of
microscopic
images)
Fitting parameter from
FDTR
- Measured by DSC for
T >190 K.
- Lower temperature values are
estimated from DFT trends by
adding a fixed percentage (20 to
35 %) to the DFT values. This
percentage is the average
percentage difference between
the DSC and the DFT values at
T > 190K.
Substrate No effect on the
fitted kSAC
No effect on the fitted
kSAC
No effect on the fitted kSAC
The focused laser spot radius is allowed to vary 3.1 ± 0.1 um from the measured value during
fitting in order to get a better fit on the data. This range is within the measurement uncertainty
of the spot radius, which is 4 % of the spot radius.
© 2016 Macmillan Publishers Limited, part of Springer Nature. All rights reserved.

16
IV. Heat capacity measurements and predictions for SACs
Figure S8: Measured and predicted Cv for SACs not included in Fig. 2 using DSC and
DFT techniques.
© 2016 Macmillan Publishers Limited, part of Springer Nature. All rights reserved.
17
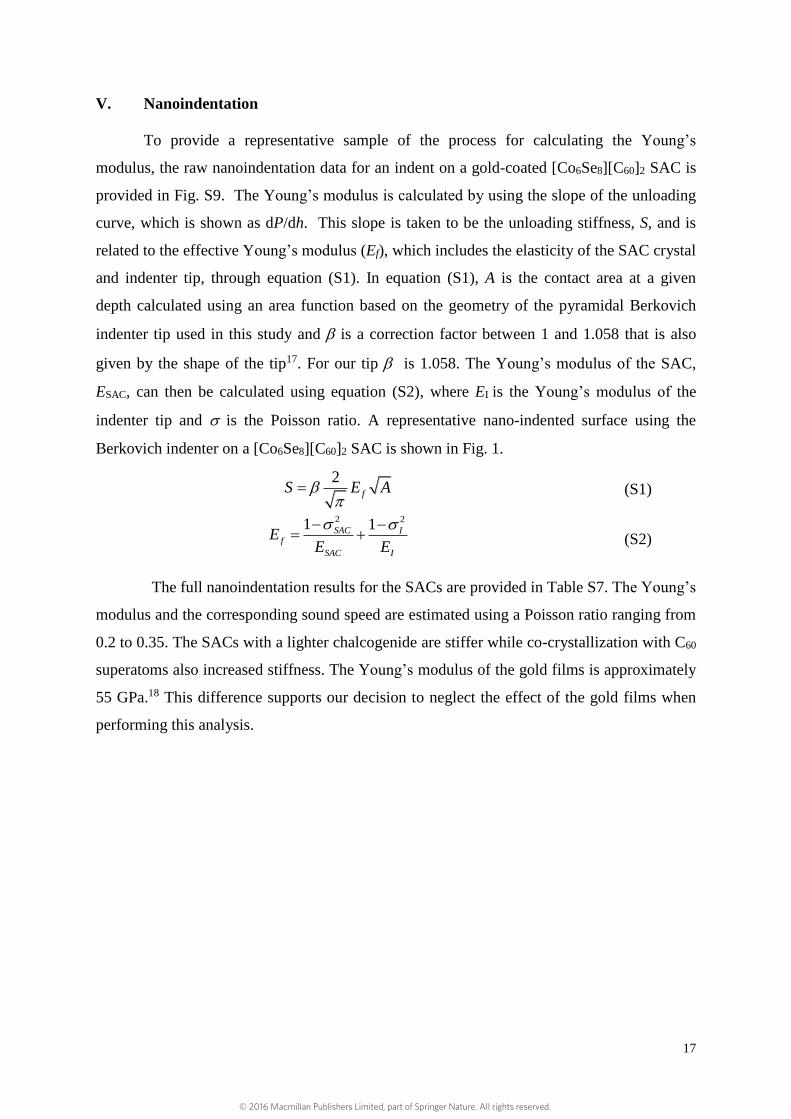
V. Nanoindentation
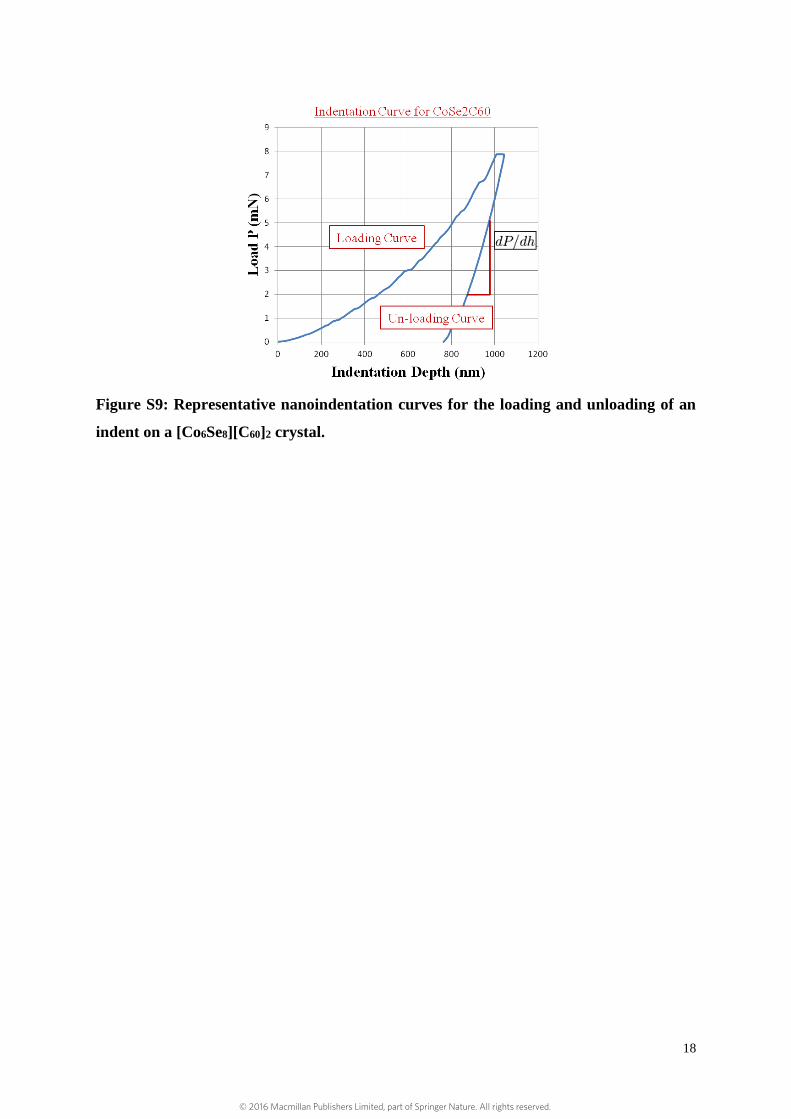
To provide a representative sample of the process for calculating the Young’s
modulus, the raw nanoindentation data for an indent on a gold-coated [Co6Se8][C60]2 SAC is
provided in Fig. S9. The Young’s modulus is calculated by using the slope of the unloading
curve, which is shown as dP/dh. This slope is taken to be the unloading stiffness, S, and is
related to the effective Young’s modulus (Ef), which includes the elasticity of the SAC crystal
and indenter tip, through equation (S1). In equation (S1), A is the contact area at a given
depth calculated using an area function based on the geometry of the pyramidal Berkovich
indenter tip used in this study and is a correction factor between 1 and 1.058 that is also
given by the shape of the tip17. For our tip is 1.058. The Young’s modulus of the SAC,
ESAC, can then be calculated using equation (S2), where EI is the Young’s modulus of the
indenter tip and is the Poisson ratio. A representative nano-indented surface using the
Berkovich indenter on a [Co6Se8][C60]2 SAC is shown in Fig. 1.
2fS E A
(S1)
2 21 1SAC If
SAC I
EE E
(S2)
The full nanoindentation results for the SACs are provided in Table S7. The Young’s
modulus and the corresponding sound speed are estimated using a Poisson ratio ranging from
0.2 to 0.35. The SACs with a lighter chalcogenide are stiffer while co-crystallization with C60
superatoms also increased stiffness. The Young’s modulus of the gold films is approximately
55 GPa.18 This difference supports our decision to neglect the effect of the gold films when
performing this analysis.
© 2016 Macmillan Publishers Limited, part of Springer Nature. All rights reserved.
18
Figure S9: Representative nanoindentation curves for the loading and unloading of an
indent on a [Co6Se8][C60]2 crystal.
© 2016 Macmillan Publishers Limited, part of Springer Nature. All rights reserved.

19
VI. Calculation of longitudinal and transverse sound speeds
To calculate the longitudinal
1
1 1 2
SACL
Ev
and transverse
2 1
SACT
Ev
sound speeds19, the measured ESAC and a range of Poisson ratios ()
from 0.2 to 0.35 are used (estimates are based on available measurements on C60 and C70
crystals). The average sound speed ( v ) is obtained through averaging the longitudinal and
two transverse components, 2 / 3L Tv v v . The nominal average sound speed is assumed
at a Poisson ratio of 0.3, which corresponds to the Poisson ratio of a C60 single crystal20.
Table S7: Young’s modulus and sound speed from nanoindentation at room
temperature.
SAC Young’s modulus,
ESAC (GPa)
Longitudinal
sound speed#,
vL (m/s)
Transverse
sound speed#,
vT (m/s)
Average
sound speed#, v (m/s)
[Co6S8] 4.0 ± 0.8 1906 1018 183
1741314
[Co6Se8] 2.3 ± 0.1 1313 702 56
45906
[Co6Te8] 0.62 ± 0.03 608 325 24
19419
[Co6Se8][C60]2 8.1 ± 0.5 2399 1282 107
861655
[Co6Te8][C60]2 1.5 ± 0.4 993 585 686 103
101
# The nominal sound speed value is calculated using a poisson ratio of 0.3 in the equations
shown above. The uncertainty in the average sound speed is calculated using the upper and
lower bound in the Young’s modulus and a Poisson ratio between 0.35 and 0.2 (taken from
measurements21 made on C60 and C70).
© 2016 Macmillan Publishers Limited, part of Springer Nature. All rights reserved.

20
VII. Minimum thermal conductivity model calculations
The Cahill-Pohl model is given by22:
(S3)
where kB is the Boltzmann constant, n is the number density of oscillators, i indexes
polarization (one longitudinal and two transverse), T is temperature, / Bx k T , and
1/3
26 /i i Bv n k is the Debye temperature with is the reduced Planck’s constant and
is the angular vibrational frequency.
The kmin trends are calculated using equation (S3) with values for the longitudinal and
transverse sound speeds from Table S7 and the number density (n) from the Tables S8 and S9
below. The SAC number density is obtained from SCXRD data and is listed in Table 1.
For kmin-atomic, n = number of atoms per unit cell / Volume of unit cell.
Table S8: Number density for kmin-atomic.
SAC
Number of atoms
per unit cell at
300 K
Volume of unit
cell (m3) at 300 K
Number density,
n (m-3) at 300 K
[Co6S8] 146 x 3 + 15 x 3
(3 toluene) 4798.7 x 10-30 1.01 x 1029
[Co6Se8] 146 x 3 + 15 x 3
(3 toluene) 4951.5 x 10-30 9.75 x 1028
[Co6Te8] 146 x 2 3093.6 x 10-30 9.44 x 1028
[Co6Se8][C60]2 266 2736.7 x 10-30 9.91 x 1028
[Co6Te8][C60]2 266 2810.7 x 10-30 9.68 x 1028
C60 60 x 4 2898.6 x 10-30 8.28 x 1028
21/3 33 /2/3
min 2016 1
i
xT
B ix
i i
T x ek k n v dx
e
© 2016 Macmillan Publishers Limited, part of Springer Nature. All rights reserved.

21
In the Cahill-Pohl (CP) model, the number density of the participating oscillators
assumes that each oscillator has three degrees of freedom. A superatom, treated as a rigid
body (not a point mass), has six degrees of freedom (three vibrational and three
rotational)23,24 and is thus equivalent to two oscillators in the CP model for the estimation of
kmin-super.
For kmin-super, n = 2 x number of superatoms per unit cell / Volume of unit cell.
Table S9: Number density for kmin-super.
SAC
Number of
superatoms per
unit cell at 300 K
Number density,
n (m-3) at 300 K
[Co6S8] 3 + 3 (3 toluene) 2.50 x 1027
[Co6Se8] 3 + 3 (3 toluene) 2.42 x 1027
[Co6Te8] 2 1.30 x 1027
[Co6Se8][C60]2 3 2.19 x 1027
[Co6Te8][C60]2 3 2.13 x 1027
C60 4 2.76 x 1027
VIII. Modified Callaway model for thermal conductivity with Born-von Karman
dispersion
For an isotropic material, 21
3j j j
j
k C v , where j is the mode index for all phonons
in the first Brillouin zone. The heat capacity per mode is given by j j
dfC
dT , with f being
the Bose-Einstein distribution. The group velocity per mode jv is calculated with a Born-von
Karman dispersion from the polarization-dependent sound speed (vi with i = L or T)
determined from the measured Young’s modulus. Born-von Karman dispersion specifies that
0cos / 4j i jv v q , where qj is the magnitude of the mode wave vector and
© 2016 Macmillan Publishers Limited, part of Springer Nature. All rights reserved.

22
1/3
2
0 2 / 6 N , with N being the number density of primitive cells25. For the lifetime,
j , we assume that Umklapp scattering is dominant and has the form
1
2 exp /j jA T B T
, where A and B are fitting constants to the temperature-dependent
thermal conductivity data25.
IX. Temperature dependence of the thermal conductivity of SACs
Figure S10: Temperature dependence of the thermal conductivities of [Co6S8], [Co6Se8],
and [Co6Te8][C60]2. All measured samples are shown on this plot, except for [Co6Te8] and
[Co6Se8][C60]2 which are already shown in Fig. 4 of the manuscript.
© 2016 Macmillan Publishers Limited, part of Springer Nature. All rights reserved.

23
X. References
1. Roy, X. et al. Nanoscale atoms in solid-state chemistry. Science. 341, 157–60 (2013).
2. Hong, M. et al. Syntheses, properties and X-ray crystal structures of hexanuclear
cobalt-chalcogen clusters Co6S8(PPh3)6 and Co6Se8(PPh3)6·THF. Polyhedron 10, 927–
934 (1991).
3. Steigerwald, M. L., Siegrist, T. & Stuczynski, S. M.
Octatelluridohexakis(triethylphosphine)hexacobalt and a connection between Chevrel
clusters and the NiAs structure. Inorg. Chem. 30, 2256–2257 (1991).
4. Roy, X. et al. Quantum soldering of individual quantum dots. Angew. Chem. Int. Ed.
51, 12473–12476 (2012).
5. Blanc, E., Schwarzenbach, D. & Flack, H. D. The evaluation of transmission factors
and their first derivatives with respect to crystal shape parameters. J. Appl. Cryst. 24,
1035–1041 (1991).
6. Clark, R. C. & Reid, J. S. The analytical calculation of absorption in multifaceted
crystals. Acta Cryst. 51, 887–897 (1995).
7. CrysAlis PRO, version 1.171.37.35, Oxford Diffraction /Agilent Technologies UK
Ltd,Yarnton, England. (2014).
8. Sheldrick, G. M. Crystal structure refinement with SHELXL. Acta Cryst. 71, 3–8
(2015).
9. Palatinus, L. & Chapuis, G. SUPERFLIP – A computer program for the solution of
crystal structures by charge flipping in arbitrary dimensions. J. Appl. Cryst. 40, 786–
790 (2007).
10. Dolomanov, O. V., Bourhis, L. J., Gildea, R. J., Howard, J. A. K. & Puschmann, H.
OLEX2 : A complete structure solution, refinement and analysis program. J. Appl.
Cryst. 42, 339–341 (2009).
11. Spek, A. L. Structure validation in chemical crystallography. Acta Cryst. 65, 148–155
(2009).
12. Van der Sluis, P. & Spek, A. L. BYPASS: An effective method for the refinement of
crystal structures containing disordered solvent regions. Acta Cryst. 46, 194–201
(1990).
13. Le Page, Y. MISSYM 1.1 – a flexible new release. J. Appl. Cryst. 21, 983–984 (1988).
14. Guzei, I. A. An idealized molecular geometry library for refinement of poorly behaved
molecular fragments with constraints. J. Appl. Cryst. 47, 806–809 (2014).
15. CrystalMaker Software Ltd, Oxford, England. at <www.crystalmaker.com>
© 2016 Macmillan Publishers Limited, part of Springer Nature. All rights reserved.

24
16. Furukawa, G. T., Saba, W. G. & Reilly, M. L. Critical analysis of the heat-capacity
data of the literature and evaluation of thermodynamic properties of copper, silver,
and gold, from 0 to 300 K. (U.S. Dept. of Commerce, National Bureau of Standards,
1968).
17. Tsui, T. Y. & Pharr, G. M. Substrate effects on nanoindentation mechanical property
measurement of soft films on hard substrates. J. Mater. Res. 14, 292–301 (1999).
18. Espinosa, H. D. & Prorok, B. C. Size effects on the mechanical behavior of gold thin
films. J. Mater. Sci. 38, 4125–4128 (2003).
19. Kinsler, L. E., Frey, A. R., Coppens, A. B. & Sanders, J. V. Fundamentals of acoustics.
(Wiley, 1999).
20. Kobelev, N. P., Nikolaev, R. K., Soifer, Y. M. & Khasanov, S. S. The elastic stiffness
matrix of single-crystal C60. Chem. Phys. Lett. 276, 263–265 (1997).
21. Kolomenskii, A. A., Szabadi, M. & Hess, P. Laser diagnostics of C60 and C70 films by
broadband surface acoustic wave spectroscopy. Appl. Surf. Sci. 86, 591–596 (1995).
22. Cahill, D., Watson, S. & Pohl, R. Lower limit to the thermal conductivity of disordered
crystals. Phys. Rev. B 46, 6131–6140 (1992).
23. Wang, X., Liman, C. D., Treat, N. D., Chabinyc, M. L. & Cahill, D. G. Ultralow
thermal conductivity of fullerene derivatives. Phys. Rev. B 88, 1–7 (2013).
24. Olson, J. R., Topp, K. A. & Pohl, R. O. Specific heat and thermal conductivity of solid
fullerenes. Science. 259, 1145–8 (1993).
25. Yang, F. & Dames, C. Mean free path spectra as a tool to understand thermal
conductivity in bulk and nanostructures. Phys. Rev. B 87, 1–12 (2013).
© 2016 Macmillan Publishers Limited, part of Springer Nature. All rights reserved.