Quantitative spectral and orientational analysis in ... this review, we try to make assessments of...
67
See discussions, stats, and author profiles for this publication at: https://www.researchgate.net/publication/244589764 Quantitative spectral and orientational analysis in surface sum frequency generation vibrational spectroscopy (SFG-VS) Article in International Reviews in Physical Chemistry · April 2005 DOI: 10.1080/01442350500225894 CITATIONS 341 READS 294 5 authors, including: Some of the authors of this publication are also working on these related projects: Interfacial physics and chemistry, surface photochemistry, chemical physics of materials science View project Hong-fei Wang Pacific Northwest National Laboratory 69 PUBLICATIONS 2,154 CITATIONS SEE PROFILE Wei Gan Harbin Institute of Technology Shenzhen Gra… 45 PUBLICATIONS 1,570 CITATIONS SEE PROFILE Yi Rao Temple University 38 PUBLICATIONS 1,111 CITATIONS SEE PROFILE All content following this page was uploaded by Wei Gan on 22 September 2015. The user has requested enhancement of the downloaded file.
Transcript of Quantitative spectral and orientational analysis in ... this review, we try to make assessments of...

Seediscussions,stats,andauthorprofilesforthispublicationat:https://www.researchgate.net/publication/244589764
Quantitativespectralandorientationalanalysisinsurfacesumfrequencygenerationvibrationalspectroscopy(SFG-VS)
ArticleinInternationalReviewsinPhysicalChemistry·April2005
DOI:10.1080/01442350500225894
CITATIONS
341
READS
294
5authors,including:
Someoftheauthorsofthispublicationarealsoworkingontheserelatedprojects:
Interfacialphysicsandchemistry,surfacephotochemistry,chemicalphysicsofmaterialsscience
Viewproject
Hong-feiWang
PacificNorthwestNationalLaboratory
69PUBLICATIONS2,154CITATIONS
SEEPROFILE
WeiGan
HarbinInstituteofTechnologyShenzhenGra…
45PUBLICATIONS1,570CITATIONS
SEEPROFILE
YiRao
TempleUniversity
38PUBLICATIONS1,111CITATIONS
SEEPROFILE
AllcontentfollowingthispagewasuploadedbyWeiGanon22September2015.
Theuserhasrequestedenhancementofthedownloadedfile.

International Reviews in Physical Chemistry,Vol. 24, No. 2, April–June 2005, 191–256
Quantitative spectral and orientational analysis in surface
sum frequency generation vibrational spectroscopy
(SFG-VS)
HONG-FEI WANG*, WEI GANyz, RONG LUyzx,YI RAOyz� and BAO-HUA WUy
State Key Laboratory of Molecular Reaction Dynamics, Institute of Chemistry,The Chinese Academy of Sciences, ZhongGuanCun, Beijing, PR China 100080
(Received 6 March 2005; in final form 20 May 2005)
Sum frequency generation vibrational spectroscopy (SFG-VS) has been proven to be a uniquelyeffective spectroscopic technique in the investigation of molecular structure and conformations,as well as the dynamics of molecular interfaces. However, the ability to apply SFG-VS tocomplex molecular interfaces has been limited by the ability to abstract quantitative informa-tion from SFG-VS experiments. In this review, we try to make assessments of the limitations,issues and techniques as well as methodologies in quantitative orientational and spectral analy-sis with SFG-VS. Based on these assessments, we also try to summarize recent developmentsin methodologies on quantitative orientational and spectral analysis in SFG-VS, and theirapplications to detailed analysis of SFG-VS data of various vapour/neat liquid interfaces.A rigorous formulation of the polarization null angle (PNA) method is given for accurate deter-mination of the orientational parameterD ¼ hcos �i=hcos3 �i, and comparison between the PNAmethod with the commonly used polarization intensity ratio (PIR) method is discussed. Thepolarization and incident angle dependencies of the SFG-VS intensity are also reviewed, inthe light of how experimental arrangements can be optimized to effectively abstract crucialinformation from the SFG-VS experiments. The values and models of the local field factorsin the molecular layers are discussed. In order to examine the validity and limitations of thebond polarizability derivative model, the general expressions for molecular hyperpolarizabilitytensors and their expression with the bond polarizability derivative model for C3v, C2v and C1v
molecular groups are given in the two appendixes. We show that the bond polarizability deri-vative model can quantitatively describe many aspects of the intensities observed in the SFG-VSspectrum of the vapour/neat liquid interfaces in different polarizations. Using the polarizationanalysis in SFG-VS, polarization selection rules or guidelines are developed for assignmentof the SFG-VS spectrum. Using the selection rules, SFG-VS spectra of vapour/diol,and vapour/n-normal alcohol (n � 1–8) interfaces are assigned, and some of the ambiguityand confusion, as well as their implications in previous IR and Raman assignment,are duly discussed. The ability to assign a SFG-VS spectrum using the polarization selectionrules makes SFG-VS not only an effective and useful vibrational spectroscopy technique forinterface studies, but also a complementary vibrational spectroscopy method in general
*Corresponding author. Email: [email protected] Students of Graduate School of the Chinese Academy of Sciences.zIn alphabetical order. These three authors contributed equally.xCurrent address: Reaction and Excitation Dynamics Group, Materials Engineering Laboratory, NationalInstitute for Material Science, Sengen, Tsukuba, Japan.�Current address: Department of Chemistry, Columbia University, New York, NY 10025, U.S.A.
International Reviews in Physical Chemistry
ISSN 0144–235X print/ISSN 1366–591X online � 2005 Taylor & Francis
http://www.tandf.co.uk/journals
DOI: 10.1080/01442350500225894
Dow
nloa
ded
by [
Nat
iona
l Sci
ence
Lib
rary
] at
18:
31 1
9 Ju
ly 2
012

condensed phase studies. These developments will put quantitative orientational and spectralanalysis in SFG-VS on a more solid foundation. The formulations, concepts and issuesdiscussed in this review are expected to find broad applications for investigations on molecularinterfaces in the future.
Contents page
1 Scope of this review 193
2 Background 194
2.1. Understanding molecular interfaces 194
2.2. Interface sum frequency generation vibrational spectroscopy (SFG-VS) 197
2.2.1. General formulation of SFG-VS 197
2.2.2. Some simple formulations of SHG and SFG-VS for interfacestudies 200
2.2.3. General issues in application of SFG-VS 203
3 Quantitative orientational and polarization analysis with SFG-VS 205
3.1. Experimental configuration: the polarization null angle (PNA) method 206
3.2. Experimental configuration: the incident angles 209
3.3. Value of the local field factors in the interface layer 213
3.4. Raman depolarization ratio and hyperpolarizability tensor ratios 217
3.5. Approach to complex molecular interfaces with the accurately measuredorientational parameter D 223
4 SFG-VS: a unique vibrational spectroscopy 227
4.1. SFG-VS: molecular symmetry and polarization selection rules 230
4.2. Assignment of SFG-VS spectrum for vapour/liquid interfaces 233
4.3. SFG-VS and its implications on IR and Raman vibrational spectroscopy 241
5 Summary 243
Acknowledgments 245
Appendix 245
Appendix A: susceptibility tensors for molecular groupswith C3v, C2v, and C1v symmetry 245
C3v symmetry group 246
C2v symmetry group 247
C1v symmetry group 249
Appendix B: hyperpolarizability and Raman depolarization ratio 249
CH group with C1v symmetry 250
CH3 group with C3v symmetry 251
CH2 with C2v symmetry 252
References 253
192 H.-F. Wang et al.
Dow
nloa
ded
by [
Nat
iona
l Sci
ence
Lib
rary
] at
18:
31 1
9 Ju
ly 2
012

1. Scope of this review
This review is intended to report on recent developments in sum frequency generationvibrational spectroscopy (SFG-VS) as a quantitative vibrational spectroscopic methodfor understanding the detailed spectroscopy, structure and energetics of the vapour/liquid interface. These developments can be used for the investigation of interfacesbeyond vapour/liquid interfaces, and knowledge of the vapour/liquid interfaces at thedetailed molecular level can be used for an understanding of other kinds of molecularinterfaces as well.
There was an excellent review in this journal on aqueous interfaces studied withSFG-VS by Schultz et al. in the year of 2000 [1]. In the past 20 years, it has been anever-growing field to employ second-order non-linear optical methods, namely,second harmonic generation (SHG) and sum frequency generation vibrational spectro-scopy (SFG-VS), for studies on various surfaces and interfaces in order to gain anunderstanding of their basic physical chemistry, and to find important applicationsand implications in material sciences, as well as in the biological sciences. Therehave been many comprehensive reviews on detailed SHG and SFG-VS interfacestudies [1–20], and many are on the investigation of various liquid interfaces,especially aqueous solution interfaces [1–9]. These developments suggest thatSFG-VS is a uniquely effective experimental technique among many moderntechniques for understanding molecular interfaces [20, 21].
This review is not going to repeat the successful stories of the SFG-VS techniquesin this growing field of current research. We would rather like to add to the arsenalof interface SFG-VS with more quantitative aspects of vibrational spectral analysisand molecular orientational analysis, which may enable more detailed understandingof the interactions, structure and energetics of the molecular interfaces. These develop-ments rely on careful analysis of the coherent nature and polarization dependence of theeffective macroscopic second-order susceptibility �ð2Þeff , which contains all microscopicinformation about the spectroscopic responses and orientation of the moleculargroups at the interface. With quantitative analysis of the key parameters, such as polar-ization configuration, the local field factor in the interface layers, and the molecularsymmetry and susceptibility tensorial relationships, SFG-VS has already providedrich information about the molecular interface [22]. Based on such pioneering successes,we can still sharpen our tools and go further for broader applications to more complexmolecular interfaces.
In this review, two novel aspects of SFG-VS are particularly discussed.The first aspect is the use of the polarization null angle (PNA) method for more
accurate determination of the molecular orientational parameter D ¼ hcos �i=hcos3 �i. With accurate D values, not only can the orientational angle of the moleculargroups at the interface be deduced, but small changes of molecular orientationalangle or orientational distribution can be discerned [23–25]. Therefore, accurate deter-mination of the D value can be particularly important in terms of investigatingchanges of the complex interfaces with subtle influences of the various environmentalparameters, such as concentration, pH, temperature, pressure, etc. We shall showthat in order to be able to accurately obtain D values, issues on the polarizationconfiguration, incident angle geometry, local field factors in the interface layer,
Spectral and orientational analysis in surface SFG-VS 193
Dow
nloa
ded
by [
Nat
iona
l Sci
ence
Lib
rary
] at
18:
31 1
9 Ju
ly 2
012
molecular symmetry and hyperpolarizability tensor ratios, have to be systematicallyexamined.
The second aspect is the use of vibrational spectral polarization selection rules basedon the molecular symmetry analysis for accurate vibrational spectral assignment [26].Since the interface is always with some orientational order, SFG-VS is intrinsically acoherent and polarization spectroscopy, and surface SFG-VS spectra usually exhibitnarrower spectral peaks; therefore, SFG-VS is an ideal tool for determining molecularsymmetry and discerning complex vibrational modes. Traditionally, SFG-VS studiesrelied on the spectral assignments of vibrational bands from IR and Raman studies.This has in some ways prevented SFG-VS from studying complex interfaces, wherethe molecular vibrational spectrum can be complicated due to the complex chemicalenvironments and interactions. The polarization selection rules can thus be used toassign vibrational modes not clearly observed in the IR or Raman spectra, and toclarify confusions in SFG-VS spectral assignments, as well as in previous IR andRaman assignments.
With the development of commercial SFG-VS spectrometers in the past fewyears [27], as well as the development of the broadband SFG-VS technique for fastacquisition of the SFG-VS spectrum [28, 29], SFG-VS measurement of interfacevibrational spectroscopy has become much easier and more reliable for ordinarychemists and material scientists in more and more research and development labora-tories. The methodology of choosing a proper SFG-VS experimental configurationfor a specific problem, and the methodology to perform quantitative analysis onSFG-VS spectral data are two key limiting factors for broader applications ofSFG-VS as a surface and interface diagnostic technique. We hope that what is discussedhere can help break these limitations to some extent.
2. Background
2.1. Understanding molecular interfaces
Interfaces are ubiquitous in nature. Chemical properties and processes at molecularinterfaces, especially material interfaces and biological interfaces, are among the centralthemes in modern chemical research [30]. Historically, the application of interfacialscience, including colloid science, has often been more of an art than a science.Greater knowledge about various interfacial phenomena at the atomic and molecularlevel as guiding principles for further application is in great demand. This is wherephysical chemistry studies come into play.
The physical chemist’s interests in interface studies are the understanding andprediction of interfacial thermodynamic properties, e.g. population or density, surfacefree energy, equilibrium constants, polarity, phase distribution and phase transitions;kinetic properties, e.g. diffusivity and viscosity; structural properties, e.g. chemicalcomposition, molecular orientation, hydrogen bonding and other interaction forces;and molecular dynamic properties, e.g. chemical reaction dynamics, rotational, vibra-tional and other relaxation dynamics. All these properties and processes at interfaces
194 H.-F. Wang et al.
Dow
nloa
ded
by [
Nat
iona
l Sci
ence
Lib
rary
] at
18:
31 1
9 Ju
ly 2
012

are usually very different from those in the bulk phase, due to the unique nature of theinterfaces [30].
The interface is the boundary separating and connecting any two bulk phases. All thechemical and physical processes involving exchange of energy and mass or interactionsbetween two bulk media must involve molecules crossing the interface. This makesinterface science not only fundamentally but also technologically important. The inter-face is a region with a thickness of only one or several molecular layers. The distinctproperties of the interface in comparison to those of the bulk originate not onlyfrom the difference of chemical compositions but also from the asymmetry of theforces that molecules and atoms experience at the interface. The asymmetry ofthe forces and discontinuity of electric fields across the interface region orientmolecules, affect their structure and change their dynamic properties by perturbingthe potential surfaces governing these motions. The discontinuity and asymmetrydetermine the interfacial dielectric properties, e.g. polarity, and transport properties,e.g. viscosity. Interface equilibrium and dynamic behaviour, which depend on theseinterfacial properties, markedly differ from those in bulk media.
Despite the very scientific and practical importance of interface studies, our under-standing of the chemistry and physics at an interface is still primitive, especially forliquid and aqueous interfaces. This arises from the fact that the interface region issuch a small entity. Not only is it difficult to characterize well by conventional experi-mental methods, but it is also very easily contaminated with a small level of impuritiesfrom the bulk medium. Therefore, until the 1950s, studies of surfaces and interfaceswere mostly on the macroscopic level. This unavoidably hindered the developmentof surface studies. With the development of modern techniques of purification andanalysis, a great number of advances in surface and colloid science and technologyhave been achieved [21]. However, even now the sensitivity and complexity of surfacesand colloids causes difficulties in developing a comprehensive understanding of manyphenomena of academic and practical importance [31]. New techniques need to bedeveloped to tackle those problems.
With the advance of modern high-vacuum technology, laser technology, sensitive andfast electronics in the past 50 years or so, a large number of techniques and instrumen-tation have been developed to study various interface properties at the atomic andmolecular level [21]. Most of these techniques are based on the scattering, absorption,or emission of photons, X-rays, neutrons, electrons, atoms and ions. Many of thesetechniques can only be applied to flat surfaces in a high-vacuum environment, whichhave brought great advances to our understanding, on the atomic level, of metal, semi-conductor and oxide model surfaces with great applications in the semiconductorindustry. However, microscopic study of surfaces under high pressure and temperature,and molecular interfaces which are common in material and biological systems, havebeen mostly left behind.
Gas/liquid interfaces, along with buried interfaces, i.e. liquid/liquid, liquid/solidand solid/solid interfaces, are mostly inaccessible by the techniques mentioned above.However, most interesting and important natural chemical and physical processeson Earth occur at these interfaces under ambient conditions. These includeequilibria and reactions in environmental and life systems with both fundamental
Spectral and orientational analysis in surface SFG-VS 195
Dow
nloa
ded
by [
Nat
iona
l Sci
ence
Lib
rary
] at
18:
31 1
9 Ju
ly 2
012

and practical importance. Because these interfaces are buried and cannot be studiedwith invasive techniques, optical techniques are desirable for experimental studies ofthese systems. Because the molecular interface is usually one or a few moleculesthick, the ideal optical technique has to be interface specific or selective, and musthave submonolayer sensitivity to probe changes of composition, orientation and struc-ture of the interface layer. In order to distinguish different chemical species at themolecular interface, such an optical technique also has to have chemical selectivity,or spectroscopic selectivity.
Fortunately, such an optical technique does exist. Since the early 1980s, Ron Shenand his colleagues have firmly established that second-order non-linear opticalmethods, namely second harmonic generation (SHG) and sum frequency generationvibrational spectroscopy (SFG-VS), are ideal interface probing optical techniqueswith interface selectivity, submonolayer sensitivity, spectroscopic selectivity, andare also non-invasive [32]. SHG and SFG are called second-order non-linear opticalprocesses because in such processes two photons of certain frequencies interact simul-taneously with an atom or molecule to instantaneously produce a new photon with thesum of the two frequencies. If the two frequencies are the same, the process is calledSHG; otherwise, SFG. The interfacial selectivity of SHG and SFG comes from thefact that coherent second-order optical processes are symmetrically forbidden inmedia having a centre of inversion. This centrosymmetry is naturally broken at theinterface layer, but it is conserved for the isotropic bulk, and consequently SHG andSFG become intrinsically interface specific [33].
In SFG-VS, tunable IR laser light and visible light at fixed frequency are used toobtain the vibrational spectrum at the sum frequency of the molecular groups at amolecular interface. As we know, with the vibrational spectrum of the interfacialmolecular species, interfacial chemistry can be studied in unprecedented moleculardetail. Since the first SFG-VS experiment by Shen et al. in 1987 [34, 35], SFG-VShas been proven to be a uniquely powerful technique in studying surface chemistry.Along with the development of laser technology in the past decade, broad applicationsof SFG-VS have been found to more complex molecular interface systems in varioustechnologically important fields, such as catalysis, chemical vapour deposition, electro-chemistry, and liquid interfaces, as well as interfaces related to environmental problemsand life sciences [7, 15].
Application of SFG-VS lies in its capability of obtaining quantitative information.The major obstacles for SFG-VS at the moment are that its ability for effective spectralassignment has been limited by IR and Raman studies, and that the quantitative anal-ysis of molecular orientation is limited by the complications in quantitative assessmentof the experimental and molecular parameters. Great effort has been dedicated toaddressing these issues in the past [13, 22, 36–41], but the general consensus in thefield so far is that these are still ‘qualitative or semi-quantitative accomplishments’[13, 15, 39, 42]. This review of progress mainly in our research group aims to shedsome new lights on these issues regarding the ability for quantitative analysis withSFG-VS [23–26, 43], and we hope that these efforts can help advance the capabilityof SFG-VS for effective spectral assignment and analysis, as well as accurateorientational and polarization analysis towards better understanding of interfacephenomena.
196 H.-F. Wang et al.
Dow
nloa
ded
by [
Nat
iona
l Sci
ence
Lib
rary
] at
18:
31 1
9 Ju
ly 2
012

2.2. Interface sum frequency generation vibrational spectroscopy (SFG-VS)
Here we shall follow the descriptions in the literature [22, 23, 26] and briefly present themathematical formulation of SFG-VS in the reflection geometry from a rotationallyisotropic achiral interface (C1v). Then we will discuss the issues in quantitative analysisin SFG-VS applications [13, 15, 22, 39].
2.2.1. General formulation of SFG-VS. The SFG intensity is proportional to thetwo incident laser intensities and the square of the absolute value of the effectivesum frequency susceptibility �ð2Þeff , which contains all the measurable informationon the response of the molecular system to the incident optical fields at the sumfrequency ! [22]:
Ið!Þ ¼8�3!2sec2�
c30n1ð!Þn1ð!1Þn1ð!2Þ�ð2Þeff
��� ���2Ið!1ÞIð!2Þ ð1Þ
with
�ð2Þeff ¼ eeð!Þ � Lð!Þ½ � � �ð2Þijk : Lð!1Þ � eeð!1Þ½ � Lð!2Þ � eeð!2Þ½ �: ð2Þ
Here !, !1 and !2 are the frequencies of the SF signal, visible and IR laser beams,respectively. nmð!iÞ is the refractive index of the bulk medium m ðm ¼ 1, 2, 0Þ atfrequency !i (i ¼ 0, 1, 2); �i is the incident or reflection angle from the interfacenormal to the beam with frequency !i; Ið!iÞ is the intensity of the SFG signal or theinput laser beams, respectively; eeð!iÞ is the unit electric field vector for the light beamat frequency !i at the interface. We defined the xy plane in the laboratory coordinatessystem �ðx, y, zÞ as the plane of the interface with z axis as the surface normal; all thelight beams propagate in the xz plane; p denotes the polarization of the optical fieldin the xz plane, while s is the polarization perpendicular to the xz plane [22, 26].Among the total of 27 macroscopic susceptibility tensors �ð2Þijk (ði, j, kÞ ¼ ðx, y, zÞ),there are seven non-zero terms for an achiral rotationally isotropic interface (C1v
symmetry), namely, �ð2Þxxz ¼ �ð2Þyyz, �
ð2Þxzx ¼ �
ð2Þyzy, �
ð2Þzxx ¼ �
ð2Þzyy, �
ð2Þzzz [22, 26]. Therefore,
for the co-propagation geometry with which the visible and IR beams are incidentwithin the same quarter in the xz plane, we have
�ð2Þeff ¼ sin� sin�1 cos�2Lyyð!ÞLyyð!1ÞLzzð!2Þ sin �2�yyz
þ sin� cos�1 sin�2Lyyð!ÞLzzð!1ÞLyyð!2Þ sin �1�yzy
þ cos� sin�1 sin�2Lzzð!ÞLyyð!1ÞLyyð!2Þ sin ��zyy
� cos� cos�1 cos�2Lxxð!ÞLxxð!1ÞLzzð!2Þ cos� cos�1 sin �2�xxz
� cos� cos�1 cos�2Lxxð!ÞLzzð!1ÞLxxð!2Þ cos� sin �1 cos�2�xzx
þ cos� cos�1 cos�2Lzzð!ÞLxxð!1ÞLxxð!2Þ sin � cos�1 cos�2�zxx
þ cos� cos�1 cos�2Lzzð!ÞLzzð!1ÞLzzð!2Þ sin � sin �1 sin �2�zzz ð3Þ
Spectral and orientational analysis in surface SFG-VS 197
Dow
nloa
ded
by [
Nat
iona
l Sci
ence
Lib
rary
] at
18:
31 1
9 Ju
ly 2
012
and
! sin � ¼ !1 sin �1 þ !2 sin �2: ð4Þ
The parameters �, �1 and �2 are the polarization angles of the SFG signal, visibleand IR laser beam, respectively. Equation (4), which is from the conservation ofmomentum in the x direction, determines the outgoing angle � of the SFG signal[44]. Equation (4) represents the case for IR and visible beams co-propagating andthe SFG signal in the reflection direction. Because !1 � !2 and ! ¼ !1 þ !2, � ’ �1.If it is the case for counter-propagation in the reflection geometry, the ‘þ’ sign andthe ‘�’ sign of the fifth and sixth terms in equation (3) are interchanged; and the ‘þ’sign becomes a ‘�’ sign in equation (4). Therefore, � will be significantly differentfrom �1. Sign interchange also occurs between the second and third terms in equation(9) for a counter-propagating geometry. This difference in � can have a significantinfluence on the polarization analysis in SFG-VS. We shall come back to this pointin section 3.2. Since the interface layer is molecularly thin and much less than thewavelength, the three-layer model for the interface SFG-VS is valid, and Liið!iÞ is thetensorial Fresnel factor at frequency !i as shown below [22, 40, 45]:
Lxxð!iÞ ¼2n1ð!iÞ cos �i
n1ð!iÞ cos �i þ n2ð!iÞ cos�i
Lyyð!iÞ ¼2n1ð!iÞ cos�i
n1ð!iÞ cos�i þ n2ð!iÞ cos �i
Lzzð!iÞ ¼2n2ð!iÞ cos�i
n1ð!iÞ cos �i þ n2ð!iÞ cos�i
n1ð!iÞ
n0ð!iÞ
� �2
ð5Þ
in which � i is the refractive angle into medium 2 defined by n1ð!iÞ sin �i ¼ n2ð!iÞ sin �i.n0ð!iÞ is the effective refractive index parameter of the interface layer. The definitionand physical meaning of n0ð!iÞ was elucidated by Shen et al. a few years ago [22, 40].One can see that the term n0ð!iÞ goes only into the expression of Lzzð!iÞ, and n0ð!iÞ isthe only unknown parameter in the calculation of the Fresnel factor Liið!iÞ. n
0ð!iÞ
value may be different from the refractive indices of the bulk medium at thecorresponding frequencies, respectively. The value of n0ð!iÞ and its effect on quanti-tative analysis in SFG will be discussed in detail in section 3.3.�ð2Þeff depends on the experimental polarization and geometry, and there are an infinite
number of combinations of experimental configurations which can give different �ð2Þeff .�ð2Þeff is also a linear combination of the four most commonly used independent experi-mental polarization combinations in the SFG literature, namely, ssp, sps, pss and ppp,as shown in the following:
�ð2Þeff, ssp ¼ Lyyð!ÞLyyð!1ÞLzzð!2Þ sin �2�yyz ð6Þ
�ð2Þeff, sps ¼ Lyyð!ÞLzzð!1ÞLyyð!2Þ sin �1�yzy ð7Þ
198 H.-F. Wang et al.
Dow
nloa
ded
by [
Nat
iona
l Sci
ence
Lib
rary
] at
18:
31 1
9 Ju
ly 2
012

�ð2Þeff, pss ¼ Lzzð!ÞLyyð!1ÞLyyð!2Þ sin ��zyy ð8Þ
�ð2Þeff, ppp ¼ �Lxxð!ÞLxxð!1ÞLzzð!2Þ cos� cos�1 sin �2�xxz
� Lxxð!ÞLzzð!1ÞLxxð!2Þ cos� sin �1 cos�2�xzx
þ Lzzð!ÞLxxð!1ÞLxxð!2Þ sin � cos�1 cos�2�zxx
þ Lzzð!ÞLzzð!1ÞLzzð!2Þ sin � sin �1 sin �2�zzz: ð9Þ
Furthermore, the macroscopic sum frequency susceptibility tensors �ð2Þijk are relatedto the microscopic hyperpolarizability tensor elements �ð2Þi0j0k0 in the molecular coordi-nates system �0ða, b, cÞ through the ensemble average, denoted by h i, over all possiblemolecular orientations [22]:
�ð2Þijk ¼ Ns
Xi0j0k0
hRii0Rjj0Rkk0 i�ð2Þi0j0k0 : ð10Þ
Here Ns is the number density of the interface moiety under investigation; R��0 is anelement of the rotational transformation matrix from the molecular coordination�0ða, b, cÞ to the laboratory coordination �(x, y, z) [46, 47], as shown in equation (25)in Appendix A. All the mathematical expressions connecting the 27 �ð2Þijk and 27 �ð2Þi0j0k0have been meticulously worked out by Hirose et al. through transformation of all thethree angles (�,�, ) [46]. In any application, one needs to make appropriate symmetry
considerations and angular averages to obtain the expressions of the non-vanishing �ð2Þijkelements as a linear combination of the non-vanishing �ð2Þi0j0k0 elements. It has to be notedthat in equation (10) the microscopic local field factors are not incorporated. Zhuang,Wei and Shen et al. discussed this issue in great detail [22, 40]. It was shown that by
properly altering the expression of the Fresnel factor Liið!iÞ, the expressions for �ð2Þijkin these two cases differ only by a common factor [22, 40].
In SFG-VS, the IR frequency is near resonance to molecular vibrational transitions,and the second-order molecular polarizability is
�ð2Þ ¼ �ð2ÞNR þXq
�q
!IR � !q þ i�qð11Þ
where the first term �ð2ÞNR represents non-resonant contributions; �q, !q and �q are thesum frequency strength factor tensor, resonant frequency and damping constant ofthe qth molecular vibrational mode, respectively. In general, �ð2ÞNR should be smalland real when the substrate is not in resonance with either of the three !i frequencies.This is generally true for the dielectric interfaces not in electronic resonance. However,for metal or semiconductor substrate interfaces, �ð2ÞNR is generally complex and not smallat all. In actual spectral fittings, the simple assumption of a Lorentzian line profilein equation (11) has been successful for most purposes, especially for dielectricinterfaces [15]. However, for metal or semiconductor interfaces, incorporation ofinhomogeneous effects on the line shape can be considered [39, 48–50].
Spectral and orientational analysis in surface SFG-VS 199
Dow
nloa
ded
by [
Nat
iona
l Sci
ence
Lib
rary
] at
18:
31 1
9 Ju
ly 2
012

In the theory of SFG-VS with a single resonance with IR frequencies, the tensorelements of �q are related to the IR and Raman properties of the vibrational mode[40, 51],
�qi0j0k0 ¼ �1
2�0!q
@ð1Þi0j0
@k0
@Qqð12Þ
in which @ð1Þi 0j 0=@Qq ¼ 0i 0j 0 and @k0=@Qq ¼
0k0 are the partial derivatives of the Raman
polarizability tensor and the IR transition dipole moment of the qth vibrational mode;and Qq is the normal coordinate of the same mode [40]. It is important to know that thesquares of 0i0j0 and
0k0 are directly proportional to the intensities of the Raman and
IR transition of the qth vibrational mode. Therefore, any non-zero sum frequencyvibrational mode has to be both IR and Raman active. This is the transition selectionrule for SFG-VS.
Molecular symmetry determines the non-zero elements of the molecular polarizabil-ity tensor �qi0j0k0 for the qth vibrational mode. The non-zero elements of �i0j0k0 for differentmodes with common symmetries, i.e. C3v, C2v and C1v, as well as the expression forthe corresponding macroscopic susceptibility tensors in equation (10) are given inAppendix A. For stretching vibrational modes of the aromatics, the expressions can befound in the literature [39, 52].
From equations (1)–(12), the experimentally measured SFG-VS intensity can bedirectly related to the microscopic molecular polarizability tensor �qi0j0k0 through theorientational average. If all the parameters and the values of �qi0j0k0 are known, thewhole problem can be treated quantitatively. Combining both SFG-VS and SHGtechniques, Zhuang and Shen et al. [22] pedagogically demonstrated the analysismethodology with detailed study on the molecular orientation and conformation ofthe –CN, –CH3 and the –(C6H4)3– terphenyl groups of the 400-n-pentyl-4-cyano-p-terphenyl [5CT, CH3(CH2)4(C6H4)3CN] molecule in the Langmuir monolayer atthe air/water interface. It is a great example and very educational on what could bedone with SFG-VS and SHG for interface studies. However, Professor Shen himselfsometimes considered it still a ‘qualitative or semi-quantitative accomplishment’ [42].
Indeed, some issues discussed in this work still call for further examination.Before we go further, we shall present the following formulations of equations
(1)–(12) into simpler expressions, which can be useful for quantitative analysis inSFG-VS and SHG with simple physical pictures of molecular orientational analysis,and for developing new quantitative techniques in SFG-VS and SHG [23–26, 53].
2.2.2. Some simple formulations of SHG and SFG-VS for interface studies. As we haveshown previously [23], for SHG and SFG-VS the �ð2Þeff in equation (3) can be generallysimplified by integration over the Euler angles and � into the following expression:
�ð2Þeff ¼ Nsdðhcos �i � chcos3 �iÞ ¼ Ns d rð�Þ: ð13Þ
200 H.-F. Wang et al.
Dow
nloa
ded
by [
Nat
iona
l Sci
ence
Lib
rary
] at
18:
31 1
9 Ju
ly 2
012

Here r(�) is the orientational field functional, which contains all orientational informa-tion at a given SFG experimental configuration. The dimensionless parameter c iscalled the general orientational parameter, which determines the orientational responser(�) to the molecular orientation angle �; and d is the susceptibility strength factor,which is a constant in a certain experimental configuration with a given molecularsystem. It is easy to show that the d and c values are both functions of the relatedFresnel coefficients, including the refractive index of the interface and the bulkphases, and the experimental geometry. d is proportional to the hyperpolarizabilityvalues. Therefore, d measures the strength of the non-linearity, while c is only relatedto the relative ratios between the hyperpolarizability tensor elements. Therefore, cmeasures order and anisotropy, i.e. molecular orientation. The expressions inequation (13) can be explicitly derived for both SHG and SFG from the rotationallyisotropic monolayer or ordered molecular films, because in equation (10)(see Appendix A) there are only linear combinations of hcos �i and hcos3 �i terms[23]. For some cases and � cannot be integrated in an ordered molecular system;then the expressions for d and c will contain terms with and �.
This formulation has certain advantages in terms of quantitative orien-tational and polarization analysis in SHG and SFG experiments [23]. In order tocompare SFG-VS experiments in different polarizations and experimental geometryconditions, the SFG intensity of any SFG experimental configuration can beexpressed as [23],
Ið!Þ ¼ Ad2 Rð�ÞN2s Ið!1ÞIð!2Þ ð14Þ
Rð�Þ ¼ rð�Þ�� ��2¼ hcos �i � c hcos3 �i
���� 2ð15Þ
in which A is the experimental constant, including the pre-factors in equation (1) timesthe instrumental response constant, and R(�) is called the orientational functional. As wehave shown elsewhere [23], the general orientational parameter c controls the orienta-tional behaviour of Ið!Þ through the function R(�). By changing experimental incidentangles and polarizations, the c value can be changed from �1 to þ1 [23]. The richbehaviour of R(�) has been carefully analysed, and the case for a �-distribution functionis illustrated in figure 1. For example, there are orientationally very sensitive regions onthe c¼ 2.25 and c¼ 4 curves, as well as orientationally insensitive regions on the c¼ 0.5and c¼ 1 curves. In comparison, linear polarization spectroscopy can only measure theorientation parameter K ¼ hcos2 �i, which varies only slowly with the tilt angle � [23].
For a non �-distribution of �, the behaviour of R(�) becomes more complicated asfully discussed elsewhere [23]. However, in such cases the formulation with the generalorientational parameter c can help disentangle the complicated behaviour of R(�) [23].It is clear that with different c values, orientationally sensitive and insensitive SFGor SHG measurements of the monolayer or ordered molecular films can be achieved.Orientationally insensitive measurements in SHG were first discussed by Simpsonand Rowlen [54, 55]. With the concept of the general orientational parameter c, theproper condition for effective orientationally insensitive measurements can be explicitlydetermined by reading the behaviour of R(�) for different c values. Generally, therelatively flat region on the R(�) curve for a particular c can be used for orientationally
Spectral and orientational analysis in surface SFG-VS 201
Dow
nloa
ded
by [
Nat
iona
l Sci
ence
Lib
rary
] at
18:
31 1
9 Ju
ly 2
012

insensitive measurements. The experimental configurations corresponding to these cvalues can be used for such measurements.
The orientational parameter D ¼ hcos �i=hcos3 �i is the crucial parameter to be deter-mined from SFG-VS and SHG experiments. The behaviour of D in terms of the orien-tational angle � and the distribution function f(�) has been carefully studied, especiallyby Rowlen and Simpson et al. [23, 56, 57]. It has been shown that the D value alonecannot uniquely provide information on both � and f(�). However, the formulationof R(�) not only allows using SHG and SFG measurements at different c values (polar-ization or experimental geometry) to uniquely determine � and f(�) in many cases [23],but also allows explicit and accurate determination of D values [23–25].
D values can be accurately determined through the polarization null angle (PNA)method. The null signal of Ið!Þ gives Rð�Þ ¼ 0, then c0 ¼ D ¼ hcos �i=hcos3 �i.Compared with the commonly used polarization intensity ratio (PIR) method in theSFG and SHG literature, the PNA method not only has much higher intrinsic accuracy,but also has the ability to obtain accurate D values for interface systems where the PIRmethod fails [23–25]. Even though both the PNA and PIR methods use exactly the sameset of parameters in analysis, it has been explicitly shown that the PIR method is simplya less accurate equivalent method to calculate the orientational parameter D [23–25].However, the PIR method has been commonly used in the SFG-VS literature for orien-tational analysis [23, 34]. In practice in many SFG-VS works, the intensity ratio wasdirectly modelled without explicitly obtaining the D value [58]. In this way, the elegancein the analysis [23, 56, 57] of the behaviour of the orientational parameter D onmolecular orientation and its distribution is generally lost. The fact is that withmore accurately determined D values through the PNA method, the sensitivity of theunknown parameters in the treatment of SFG-VS data can be more effectively assessed.The PNA method is central to the quantitative applications of SFG-VS, and we shallcome back to it in detail in section 3.
1.0
0.8
0.6
0.4
0.2
0.0
Ori
enta
tiona
l fun
ctio
nal R
(q)
(arb
.)
806040200
Orientational angle q (degrees)
c = 1
c = 0.5
c = 2.25
c = −1c = 4
c = 0(cos q)
K = cos2 q
c = −4
Figure 1. Orientational functional R(�) versus orientational angle � at c ¼ �4, �1, 0, 1, 0:5, 1, 2:25, 4 andK ¼ hcos2 �i versus �, assuming a �-distribution function for � [23].
202 H.-F. Wang et al.
Dow
nloa
ded
by [
Nat
iona
l Sci
ence
Lib
rary
] at
18:
31 1
9 Ju
ly 2
012
With the accurate determination of D, the first- and third-order orientational orderparameters of the interface layer or ordered molecular films, i.e. S1 ¼ hcos �i andS3 ¼ ð5hcos
3 �i � 3hcos �iÞ=2, can be explicitly connected to SHG and SFG-VSmeasurements as in the following [23, 53]:
rð�Þ ¼ 1�c
c0
� �hcos �i ¼ 1�
c
c0
� �S1
¼ ðc0 � cÞhcos3 �i ¼1
5ðc0 � cÞð2S3 þ 3S1Þ: ð16Þ
These orientational order parameters are important in understanding the orienta-tional order and phase transition behaviour of molecular layers as well as molecularfilms. Various spectroscopic methods, such as polarized Raman and fluorescentemission spectroscopies, have been formulated to obtain orientational parameters ofliquid crystal molecular films [59–61]. In these studies, S2 ¼ ð3hcos
2 �i � 1Þ=2 andS4 ¼ ð35hcos
4 �i � 30hcos2 �i þ 3Þ=8 parameters were obtained. Simple formulationcan demonstrate the advantages of coherent non-linear spectroscopy, such as SFG,SHG, CARS, Stimulated Raman, over incoherent spectroscopic methods, such asRaman and fluorescent emission, in experimental measurements of the orientationalorder parameters [53].
The above formulation provides new physical pictures and techniques for SFG-VSand SHG interface studies [24–26]. The PNA method will be discussed in section 3,with more examples of its applications.
2.2.3. General issues in application of SFG-VS. Even though SFG-VS is an interfacespecific spectroscopic technique, the total SFG-VS signal observed may not come onlyfrom the interface species [62–64]. If the contribution from the interfacial moleculescannot be separated from contributions from other sources, quantitative and polariza-tion analysis of the SFG-VS signal is more complicated or in question. The good thingis that it has been consistently shown that for SFG-VS studies on the vapour/liquid andmost dielectric interfaces in reflection geometry, the SFG-VS signal comes dominantlyfrom the contribution of the interfacial species [62–65].
Techniques of quantitative treatment in SFG-VS have been developed [22–26, 34,36–39, 66], and important issues have also been intensively reviewed [13, 15, 22, 23,39]. The interfaces studied with SFG-VS were also carefully compiled and reviewedin the literature [7, 15]. In terms of SFG-VS and SHG interface studies of molecularstructure and dynamics, the schematics in figure 2, following the review of the subjectsummarized by C. D. Bain [13], illustrates the scope of the problems and issues inSFG-VS and SHG interface studies.
The purpose of studies with SFG-VS and SHG is to obtain detailed molecular levelinformation on the population, orientation, conformation, and properties of the molec-ular hyperpolarizability, and their changes under different chemical environments,as well as their time dependent behaviour. The results from the analysis of theSFG-VS and SHG experimental data can be compared with the molecular dynamics(MD) and Monte Carlo molecular simulations, as well as ab initio calculations of the
Spectral and orientational analysis in surface SFG-VS 203
Dow
nloa
ded
by [
Nat
iona
l Sci
ence
Lib
rary
] at
18:
31 1
9 Ju
ly 2
012

interfacial structure and dynamics. Some general considerations for the advantages andlimitations of the treatment of SFG experimental data are as follows.
(a) From the known SFG-VS or SHG signal, and from the knowledge on theincoming laser beams, the �ð2Þeff of the interface layer or molecular film can bedirectly measured.
(b) With quantitative correction of the Fresnel factors and local field factors,the macroscopic SFG-VS or SHG susceptibility tensor elements �ð2Þijk can beobtained. In this case, the values and the influences of the local field factorsin the interface layer are generally not known. They are the major uncertainparameters for quantitative treatment of the SFG-VS and SHG data. Sincethere are only four independent �ð2Þijk for a rotationally isotropic interface,measurements in four different polarization combinations, i.e. ssp, sps, pss,and ppp, are usually needed.
(c) Through transformation of the Euler angle, the �ð2Þijk elements are directlyconnected to the microscopic (molecular) hyperpolarizability tensors, �ð2Þi0j0k0 .This connection is generally mathematical, and can be straightforwardlyworked out [46, 67]. Since there are 12 different ways to do the Eulerangle transformation [47], it is tedious to derive and to check theserelationships. Simplification comes when only a few non-zero elementsof �ð2Þijk and �ð2Þi0j0k0 are allowed because of macroscopic and microscopic(molecular) symmetry requirements. Such symmetry allowed terms can beidentified in the literature [16, 33, 68].
SHG or SFGSignal
LaserPulses
IVIS IIR
Ns, <q, f, y>
ab initio Calculation
Fresnel & Local FieldFactor Correction
Euler Transformation
ISF
Raman & IR Spectroscopy
MD & Monte CarloSimulation
(2)ceff
(2)cijk
(2)bi 'j 'k '
Figure 2. Schematic illustration of SFG-VS quantitative analysis. Adapted with permission from J. Chem.Soc. Faraday Trans. 1995, 91 1281–1296. Copyright (1995) the Royal Society of Chemistry [13].
204 H.-F. Wang et al.
Dow
nloa
ded
by [
Nat
iona
l Sci
ence
Lib
rary
] at
18:
31 1
9 Ju
ly 2
012
(d) Knowledge of the spectral response of �ð2Þi0j0k0 from Raman and IR spectroscopy,and also from ab initio calculations, is very important in terms of spectral assign-ment and spectral fitting [13]. Spectral assignment in SFG-VS has been basicallydependent on the spectral assignment with knowledge from Raman and IRstudies. Only until very recently, efforts have been made to develop a methodol-ogy for spectral assignment with polarization analysis of SFG-VS [26].
(e) For quantitative orientational analysis, the relative ratios between the �ð2Þi0j0k0elements can be obtained from the Raman depolarization measurement,combining with the bond polarizability derivative model, as well as comparisonwith ab initio calculations [22, 34, 36–39, 66]. As shown in Appendices A and B,with these ratios known, all the �ð2Þi0j0k0 elements can be expressed in a single �ð2Þi0j0k0element and a few known ratio values. Therefore, since there are severalindependent measurements in different polarizations, the absolute value of�ð2Þi0j0k0 is not necessary for obtaining structural and dynamical information inthe interface layer. However, the approaches for determining these ratios andthe effectiveness of the bond polarizability derivative model has been generallyquestioned [39], and has been rarely practiced [22, 36, 37, 39, 40].
It is then clear that the key issues on the applications of quantitative analysis ofSFG-VS and SHG techniques lie mainly in steps (b), (d), and (e). In short, they are thevalues for the local field factors in the interface layer, the explicit spectral assignment,and the values of the hyperpolarizability ratios. If these issues are not better addressedand formulated on solid foundations, the understanding of SFG-VS spectral data, andthe calculation of the orientation and orientational distribution of the moleculargroups, cannot be substantiated, and is subject to misinterpretations and large errorbars. Consequently, SFG-VS remains a mostly qualitative, rather than a quantitative,spectroscopic and analytical technique.
In the next two sections, we shall try to discuss how these issues can be addressed oravoided in SFG-VS analysis, and to present recent progress in these regards.
3. Quantitative orientational and polarization analysis with SFG-VS
Here we try to give a solid formulation of the polarization null angle (PNA) methodand to demonstrate its advantages over the commonly used polarization intensityratio (PIR) method, on orientational analysis in SFG-VS.
Since all spectral, orientational and polarization information in SFG-VS is containedin the �ð2Þeff as defined in equation (3), quantitative analysis with SFG-VS is to obtainmolecular information from experimental measurement of �ð2Þeff in specifically chosenexperimental conditions and configurations. As we discussed in section 2.2.3, theprimary concerns in this analysis of �ð2Þeff are its dependence on experimental configura-tions, namely, on polarization configurations and light incident angles; on molecularhyperpolarizability tensors, namely, the hyperpolarizability tensor ratios; and onthe local field factor values. We shall discuss these relationships, and based on thesediscussions we shall discuss how the PNA method can be used for accurate molecularorientation studies of molecular interfaces. Examples of simple vapour/liquid interfacesare used to illustrate the improvement of the quantitative analysis in SFG-VS, for their
Spectral and orientational analysis in surface SFG-VS 205
Dow
nloa
ded
by [
Nat
iona
l Sci
ence
Lib
rary
] at
18:
31 1
9 Ju
ly 2
012

SFG-VS spectra have clear and simple features. The same principles can be generallyapplied to complex molecular interfaces.
3.1. Experimental configuration: the polarization null angle (PNA) method
In previous SFG-VS studies, experimental configuration analysis is certainly one of theneglected dimensions. From our recent quantitative analysis with SHG [23], we havenoticed the importance of this missing dimension in the SFG-VS technique.
In order to better discuss issues in quantitative analysis of �ð2Þeff , equation (3) can berewritten as the following expressions from equations (6)–(9):
�ð2Þeff ¼ sin� sin�1 cos�2�ð2Þeff, ssp
þ sin� cos�1 sin�2�ð2Þeff, sps
þ cos� sin�1 sin�2�ð2Þeff, pss
þ cos� cos�1 cos�2�ð2Þeff, ppp: ð17Þ
Equation (17) explicitly underlines the idea that �ð2Þeff is just a linear combination of �ð2Þeffin four independently measurable experimental configurations, i.e. ssp, sps, pss, and ppppolarization configurations. In SFG-VS studies, measurements were done either withall these four experimental configurations; or one, usually with ssp or ppp; or two,usually with ssp and ppp; or three, usually with ssp, ppp, and sps, of the fourconfigurations.
However, since in SFG-VS experiments the measured quantity is j�ð2Þeff j2, instead of
�ð2Þeff , the information of �ð2Þeff cannot be completely recovered from the independentlymeasured ssp, sps, pss, and ppp SFG-VS intensities. Recent reports on the PNAmethod [23–25], polarization selection rules in SFG vibrational spectral assignment[26], and the polarization mapping method [69] in SFG-VS have signified this point.In this subsection we shall discuss the PNA method first, and the polarization selectionrules for vibrational spectral assignment in SFG-VS are discussed in section 4.
In the PNA method, a specific polarization set (�null,�null1 ,�null
2 ) exists to makethe SFG signal become zero (null), thus through Rð�Þ ¼ 0 with equation (26), theorientational parameter D can be determined. In practice, the problem can be greatlysimplified by letting �2 ¼ 0 and �1 ¼ �458 [24, 25]. Then
0 ¼ �ð2Þeff ¼ �
ffiffiffi2p
2sin�null�ð2Þeff, ssp þ
ffiffiffi2p
2cos�null�ð2Þeff, ppp ð18Þ
and
tan�null ¼ sin�null= cos�null ¼ �ð2Þeff, ppp=�ð2Þeff, ssp: ð19Þ
The right side of equation (19) is the polarization intensity ratio �ð2Þeff, ppp=�ð2Þeff, ssp, which
can directly lead to the determination of the orientational parameter D, as in the
206 H.-F. Wang et al.
Dow
nloa
ded
by [
Nat
iona
l Sci
ence
Lib
rary
] at
18:
31 1
9 Ju
ly 2
012

well established and commonly used PIR method, which calculates the D value fromeither �ð2Þeff, ppp=�
ð2Þeff, ssp or �ð2Þeff, sps=�
ð2Þeff, ssp ratios [22, 34].
There are two common disadvantages with the PIR method. Firstly, when either�ð2Þeff, ppp or �ð2Þeff, ssp is small, i.e. close to the noise level, the intensity ratio cannot bevery accurately determined from direct SFG intensity measurements. Especiallyfor the vapour/methanol [65], vapour/acetone [70], as well as vapour/acetonitrile [71]interfaces, only ssp polarization has a significant SFG signal observed above thenoise level in the CH3 stretching vibrational spectral region. So the PIR methodcannot provide a good measurement of the orientational parameter D of the CH3
groups for these interfaces [65]. Generally, peaks strong in one of the four standardpolarizations are small in other polarizations; this is how the polarization selectionrule works [26], and this is discussed in section 4. Because one of the two intensitiesis usually small, this undoubtedly introduces difficulties and uncertainties intothe PIR method. Therefore, the PIR method produces the desired measurement ofthe molecular orientation only for a small number of interfaces [22]. Secondly,since the SFG intensities in different polarizations are measured in the PIR method,the relative sign between the two �ð2Þeff s has to be independently determined [65].
The expression in equation (19) gives explicit reasons why the PNA method is moreadvantageous than the commonly used PIR method. Firstly, because the polarizationangle �null is the polarization when the SFG signal goes to zero (null), it can easilybe determined with an accuracy of about 1 degree, or much less. Thus, the�ð2Þeff, ppp=�
ð2Þeff, ssp ratio in equation (19) can be obtained with an accuracy determined by
the error bar of the null angle �null, instead of by the error bar of the SFG intensity.Apart from the accuracy, there is no relative sign problem in the PNA method [23].After the �ð2Þeff, ppp=�
ð2Þeff, ssp ratio is accurately determined, PNA uses exactly the same set
of parameters as PIR to calculate the orientational parameter D. Therefore, the PNAmethod is not simply an alternative method for the PIR method. It overcomes themajor disadvantages of the PIR method.
In the PIR method, if there is no spectral interference, the intensity ratio at the peakposition gives the same orientational parameter from the ratio of the oscillator strengthfitted from the SFG spectra. If there is spectral interference, the only reliable wayis to use the ratio between the fitted oscillator strengths from spectra of differentpolarizations.
Similarly, there are two ways to obtain the null angle. The first is to directly fit theSFG intensities measured at the peak position in different polarizations of the SFsignal, if there is no spectral interference. The second is to measure the SFG spectrain different SF signal polarization angles and fit the spectra for the oscillator strengthvalues, which are then used to fit for the null angle value. The latter method is usefulwhen there are spectral interferences present. For the cases of vapour/acetone andvapour/methanol interfaces, the CH3 symmetric stretch mode is a fairly isolated peakin their SFG-VS spectrum, and experimental data have shown that both approachesin the PNA method gave the same null angle values within the experimental error.
Using the same parameters for the vapour/methanol interfaces, measurement with thePNA method gave D ¼ 0:97� 0:04 [24, 25], while the PIR method gave D < 1:8 [65].Because the SFG intensity in both the ppp and sps polarization configurationsare very small and at the noise level, the PIR method can only give an upper limit
Spectral and orientational analysis in surface SFG-VS 207
Dow
nloa
ded
by [
Nat
iona
l Sci
ence
Lib
rary
] at
18:
31 1
9 Ju
ly 2
012

on the D value. This has left room for speculations on the orientational order at thevapour/methanol interface [65, 72–75]. Such a significant improvement of the accuracyof the orientational parameter D with the PNA method now provides new oppor-tunities in orientational analysis of the molecular interfaces. The most important aspectof applications with the PNA method may lie with the ability to measure small changesof the orientational order of a given molecular interface.
Figure 3 exemplifies one such application. The null angle of the symmetric stretchingSFG-VS spectral peak of the CH3 group at the vapour/methanol–water mixture inter-face is measured at different bulk methanol concentrations. The error bar for the nullangle is about 1.58, and the error bar for the D value is about 0.06. Because the D valueis very close to unity, the interfacial CH3 group is well ordered and its symmetry axispoints up close to the surface normal. The dependence of D on � and its distributionf(�), shown in figure 6, has been elegantly discussed by Simpson and Rowlen [23, 56,57]. It is clear from figure 3 that the orientational order of the methanol CH3 groupat the vapour/methanol–water mixture interface changes very little throughout thewhole range of the bulk methanol concentration; and it is clear that the CH3 is gettingslightly more ordered as the bulk methanol concentration increases. These results pro-vide strikingly detailed knowledge of the structure and energetics of this very importantand benchmark interface [65, 72–77]. With such knowledge of the molecular orienta-tion, a double layered structure of the vapour/methanol–water mixture interface isdetermined, and the adsorption free energies for the first and second layers of methanolmolecules were also determined [77, 78].
PNA measurements on the vapour/acetone–water mixture [79, 80], vapour/acetonitrile–water mixture, vapour/DMSO-water mixture as well as vapour/tert-butanol–water mixture interfaces [81] have also been conducted. These resultsare fully consistent with these for the vapour/methanol–water mixture and vapour/neat methanol interfaces, and some new features of the PNA method can also bedeveloped for studies on complex molecular interfaces. These aspects are discussed insection 3.5 using vapour/acetone and vapour/DMSO interfaces as examples.
1.6
1.4
1.2
1.0
0.8
Ori
enta
tiona
l par
amet
er D
1.00.80.60.40.20.0
Bulk methanol mole fraction
−15
−10
−5
0
Null angle (degree)
D value
Null angle
Figure 3. Null angle and D values for vapour/methanol–water mixture interfaces for different bulkmethanol mole fractions [77].
208 H.-F. Wang et al.
Dow
nloa
ded
by [
Nat
iona
l Sci
ence
Lib
rary
] at
18:
31 1
9 Ju
ly 2
012

The PNA method should find unprecedented applications in molecular interfacestudies. To our knowledge, the null angle measurement has been mentioned onlyonce [38] in previous SFG-VS studies, prior to our recent work [23–25]. Even thoughthe principle of null angle measurement in surface SHG was first demonstrated forthe determination of molecular orientation at silica surfaces some 20 years ago [82],and the null angle method in SHG was further elaborated in 1990 [83], the practicehas been scarce in the SHG interface studies [23–25].
It is to be noted that even though the determination of �null is straightforward andaccurate, in order to calculate D, parameters like the hyperpolarizability ratio and thelocal field factors in the interface layer, whose values are subject to uncertainties, haveto be employed. In the following sections, we shall discuss these parameters and showthat their value can be determined with fair accuracy. We shall also discuss the implica-tions of the accurately determined D values for understanding of the orientational orderof complex interfaces. Nevertheless, the relatively small changes of the orientationalorder of a given molecular interface can always be measured with the PNA method.This will bring many new applications to molecular interfaces studies.
In any case, even though PNA and PIR use different methods to obtain the �ð2Þeff ratio,they use the same set of parameters to calculate the D value. PNA measurement is notonly much more accurate than PIR, it can also make accurate measurement when PIRfails. We shall see that there are many more advantages for the PNA method in terms ofquantitative polarization and orientational analysis, when we discuss the incident angledependence of the SFG-VS intensities below.
3.2. Experimental configuration: the incident angles
Here we discuss how incident angle geometry can be optimized for SFG-VS measure-ment and for obtaining accurate D values free from complications of the unknown IRrefractive indices and local field factors.
Even though the issue of SFG experimental geometry has been discussed to someextent in the SFG-VS literature [84, 85, 87], as also summarized by Buck andHimmelhaus in their recent review article [15], the dependence of the SFG-VS signalon the incident angles is yet to be clearly discussed in terms of effective polarizationand orientational analysis.
Generally there are two basic geometries for doing a SFG-VS experiment in eitherreflection or transmission, namely, the co-propagating, and counter-propagatinggeometry. The basic difference between them is that in the former case, � ’ �1, whilein the latter case � is significantly different from �1. � is the outgoing angle of theSFG signal as defined in equation (4), while �1 is the incident angle of the visible beam.Because the co-propagating, and counter-propagating experimental geometries in thereflection were widely used in the SFG-VS literature, we shall limit our discussionsto them. Discussions on other geometries can follow suit.
From equations (6)–(9), it is easy to see that the value of �ð2Þeff in different polarizationconfiguration depends on the Fresnel factors given by equation (5). Equation (5)indicates that the Fresnel factors are functions of the incident angles, the dielectricconstants (or the refractive indices, nið!iÞ) of both bulk phases, as well as the localfield factors in the interface layer (n0ð!iÞ). For a given molecular interface, nið!iÞ and
Spectral and orientational analysis in surface SFG-VS 209
Dow
nloa
ded
by [
Nat
iona
l Sci
ence
Lib
rary
] at
18:
31 1
9 Ju
ly 2
012

n0ð!iÞ values are fixed numbers, even though the n0ð!iÞ values may not be exactlyknown. Therefore, the dependence of the SFG-VS signal in different polarizationconfigurations on the IR and visible incident angles can be used to evaluate then0ð!iÞ values in some special cases [22, 40, 86].
One of the important aspects of the incident angle dependence is that the SFG-VSspectra in different polarization configurations, i.e. ssp, sps, pss, and ppp configurations,have different incident angle dependence. People have noticed spectral differences whenthey try to compare the SFG-VS spectra on the same molecular interface obtained indifferent research groups, where different incident angles of IR and visible beamswere used [84, 85, 87]. But systematic analysis on this dependence has been generallyoverlooked. Here we shall show how intriguing this analysis is.
Figure 4 shows the SFG-VS spectra of the vapour/methanol interface with two sets ofincident angles (Set I: �1 ¼ 628, �2 ¼ 538; Set II: �1 ¼ 378, �2 ¼ 518) in the reflectiveco-propagating geometry in ambient conditions. It is easy to see that the ppp spectrumwith Set II exhibits clear spectral features. In the literature [65, 72–75, 77], SFG-VSspectra of the vapour/methanol interface obtained by different researchers are allsimilar to the spectra on the left side of figure 4, with featureless spectra in the sps,pss, as well as ppp polarizations. Therefore, polarization and orientational analysisof the vapour/methanol interface has been quite limited, until the PNA method wasused recently [77].
Now with the SFG spectra in Set II, the peak intensity around 2928 cm�1 in the pppspectrum is about one-quarter of that in the ssp spectrum. So the polarization andorientational analysis with the traditional PIR method can be performed. Fitting thespectra in Set II, we obtained �ssp=�ppp ¼ �2:0� 0:3 (the other value with the þ signis physically unreasonable, see [65]), and accordingly the order parameter isD ¼ 1:6þ1:1�0:6 [87]. The large error bar of this results comes mostly from the uncertainty
20 × 10−6
15
10
5
0
SF
G s
igna
l (a.
u.)
29502900285028002750
Wavenumber (cm−1)
ssp
ppp
sps
Vis 62° IR 53°
300029502900285028002750
Wavenumber (cm−1)
Vis 37° IR 51° ssp
ppp
sps
Figure 4. SFG-VS of vapour/methanol interface in two different experimental configurations. The ppp SFGspectrum shows clear features in the right, but no features in the left. The incident angle dependence can befully quantified by the calculated d 2Rð�Þ values, with known parameters discussed later. Full results to bepublished elsewhere. The assignments of the peaks can be found in table 4.
210 H.-F. Wang et al.
Dow
nloa
ded
by [
Nat
iona
l Sci
ence
Lib
rary
] at
18:
31 1
9 Ju
ly 2
012
from fitting the weak ppp peak. This error bar of the D value from the PIR method isthus about one order of magnitude larger than that from the PNA measurementdiscussed in section 3.1.
Analysis of the incident angle dependence not only can help find proper incidentangles to increase spectral intensity in certain polarizations, usually the ppp spectrumis the most sensitive, but also can be used to find proper incident angles for optimiza-tion of the accuracy and sensitivity of the PNA method. With Set I incident angles, thePNA method gives D ¼ 0:97� 0:06, while with Set II incident angles, the PNA givesD ¼ 0:96þ0:18�0:15. This difference of error bars with measurement in different incidentangle sets is not accidental. Full incident angle analysis has indicated that with Set II,the error bar is about three times of that with Set I, when the accuracy for the�null value measured in the PNA experiment is the same [87]. Analysis further indicatedthat the PNA sensitivity depends only very slightly on the IR incident angle �2, but thedependence on the visible incident angle �1 is quite significant. Analysis has also shownthat the optimal incident angles are �1 ffi 608 and �2 between 508 and 708 in order to getthe best PNA sensitivity and strong SFG-VS signal in the ssp polarization for thevapour/methanol interface [87].
Thus, we have shown that incident angle analysis is quite useful in terms of obtainingunseen spectra in certain polarizations, and it is also quite useful in terms of doing PNAanalysis with optimal incident angles. Now we are going to discuss one of thecrucial aspects from incident angle analysis in SFG-VS. It is the fact that the polariza-tion and orientational analysis is essentially insensitive to the IR refractive indicesin the co-propagating experimental configurations. This fact clearly makes theco-propagating experimental configurations the ideal choice for polarization and orien-tational analysis, and additional knowledge of the IR refractive indices can be obtainedfrom counter-propagating geometries.
As discussed in the literature [22, 40, 83, 88–90] and indicated in equation (5), thedetermination of the molecular orientation with SFG-VS and SHG is quite sensitiveto the values of n0ð!iÞ, which is usually not accurately known, especially for the IRwavelengths. Moreover, in some cases the value of n0ð!2Þ, as well as n2ð!2Þ in the IRwavelengths should vary significantly across the spectral region, because the dispersionof the refractive index in resonance with the IR wavelengths can be strong. Therefore,in order to make a quantitative analysis of �ð2Þeff , it is most difficult to assess the valuesof the Liið!2Þ terms in equation (3). In most SFG-VS studies, this issue of uncertaintyon IR refractive indices was generally evaded and the treatment can only be consideredqualitative and semi-quantitative, except for a few very careful studies by Zhuang,Wei and Shen et al. [22, 40].
However, detailed analysis of the terms in equations (6)–(9) provides a relatively easysolution for this problem. This comes from the fact that in equation (9), the second andthird term nearly cancel each other in a co-propagating geometry. When both theSF frequency ! and the visible frequency !1 are not in resonance with the interfacialmolecules, �xzx ¼ �zxx is generally valid. Therefore, the sum of the second and thirdterms in equation (9) is proportional to the term � ¼ �cos� sin �1 þ sin � cos�1 ¼sinð�� �1Þ for co-propagating geometry. For counter-propagating geometry,� ¼ �sinð�� �1Þ, as from the discussion above for equation (3). Table 1 listscalculated � values for incident angle Set I and Set II in both co-propagating and
Spectral and orientational analysis in surface SFG-VS 211
Dow
nloa
ded
by [
Nat
iona
l Sci
ence
Lib
rary
] at
18:
31 1
9 Ju
ly 2
012
betha
Highlight

counter-propagating geometries. The calculation indicates that in the co-propagatinggeometry, the second term and the third term in equation (9) contribute insignificantlyto the total �ð2Þeff, ppp, as discussed by Wei and Shen et al. [40]; while in the counter-propagating geometry, these two terms contribute quite significantly. For the SFGexperiment in collinear geometry, where � ¼ �1 ¼ �2, one always has �¼ 0. Thisindicates that in order to have better cancellation of the second and third terms inequation (9), it is better to arrange the IR and visible beams as close to collineargeometry as possible, for example, the �1 ¼ 608 and �2 ¼ 558 set is better than theSet I and II incident angles.
Now with the remaining two terms in equation (9) for �ð2Þeff, ppp in the co-propagatinggeometry, the ratio �ð2Þeff, ppp=�
ð2Þeff, ssp is very weakly dependent on the refractive
indices across the IR wavelengths, since the term Lzzð!2Þ in �ð2Þeff, ppp=�
ð2Þeff, ssp can simply
cancel each other. Because the �ð2Þeff, ppp=�ð2Þeff, ssp value can be accurately determined
from the PNA measurement as shown in equation (19), polarization analysis withco-propagating geometry should be generally immune from the uncertainty of therefractive indices and local field factors in the interface layer across the IR wavelengths.
It is interesting to note that even though �ð2Þeff, sps, �ð2Þeff, pss, and the second and third
terms in �ð2Þeff, ppp themselves do not contain the n0ð!2Þ term, they have to be avoidedin order to make sure �ð2Þeff, ppp=�
ð2Þeff, ssp is free from the influence of n0ð!2Þ, as well as
the n2ð!2Þ, n2ð!1Þ values. Generally, n0ð!2Þ cannot be exactly known for the IR wave-lengths; while n2ð!2Þ and n1ð!2Þ (n1ð!2Þ ffi 1:00 if medium 1 is air) can be measuredbut the data is generally not available. Even when they are available, different valuesat each wavelength near the resonant IR frequency greatly complicate the data proces-sing. Therefore, in practice the analysis here simplifies a lot of things in SFG-VS quan-titative analysis, and underlines the effectiveness and accuracy of the PNA methodsin the co-propagating geometry. Actually, we did find that in the calculation of theD values with the PNA method, the resulted D value changed very insignificantlywhen the values of the IR refractive indices were varied in a fairly large range. In themean time, D is much more sensitive to the values of the refractive indices of the SFand visible laser frequencies used.
Therefore, one can reach the following conclusions from equations (6)–(9) and thediscussions above,
(a) The ratios �ð2Þeff, sps=�ð2Þeff, ssp or �ð2Þeff, sps=�
ð2Þeff, ppp are not independent of the refractive
indices across the IR wavelengths, even for the co-propagating geometry.
Table 1. Comparison of � values for different incident angles in co-propagating and counter-propagatinggeometries. The wavelengths and frequency used are: visible ð!1Þ 532nm, IR ð!2Þ 3000 cm
�1. In order tocompare with the other two terms in equation (9), �=�1 and �=�2 are also calculated, where
�1 ¼ cos� cos�1 and �2 ¼ sin� sin�1:
Geometry �1 ð�Þ �2 ð
�Þ � ð�Þ � �=�1 �=�2
Co-propagating 62.0 53.0 60.6 �0.024 �0.10 �0.03Counter-propagating 62.0 53.0 40.7 0.36 1.0 0.63
Co-propagating 37.0 51.0 38.8 0.031 0.050 0.082Counter-propagating 37.0 51.0 24.3 0.22 0.30 0.89
Co-propagating 60.0 55.0 59.3 �0.012 �0.047 �0.016
212 H.-F. Wang et al.
Dow
nloa
ded
by [
Nat
iona
l Sci
ence
Lib
rary
] at
18:
31 1
9 Ju
ly 2
012
betha
Highlight
betha
Highlight

Therefore, determination of the orientational parameter D using these tworatios is subject to large errors and uncertainties. However, if the orientationalparameter can be accurately determined with other measurement, e.g. from�ð2Þeff, ppp=�
ð2Þeff, ssp, these two ratios can be used to calculate the IR local field
factor in the interface layer.(b) Polarization analysis in counter-propagating geometry has to deal with the
strong dependence on the refractive indices across the IR wavelengths.Therefore, in order to have better quantitative polarization and orientationalanalysis, the counter-propagating geometry should be generally avoided inSFG-VS interface studies.
(c) If a series of SFG-VS measurements using both co-propagating and counter-propagating geometries with certain incident angles are conducted on thesame molecular interface, the co-propagating geometry experiments should beable to give reliable information on the molecular orientation, and based onthis information, the counter-propagating geometry experiments should beable to give information on the IR refractive indices. In general, combiningmeasurements with different incident angle sets and using their different relativesensitivities on different parameters should directly benefit quantitativepolarization and orientational analysis in SFG-VS.
The effectiveness of the co-propagating geometry discussed above may not hold fordouble resonance SFG-VS, in which the SF frequency is usually in resonance withthe interfacial molecules. Therefore, �ð2Þxzx ¼ �
ð2Þzxx generally does not hold due to the
dispersion in the SF frequency, and the first two indices in �ð2Þijk cannot be interchanged.In these cases, the co-propagating geometry may not be advantageous over the counter-propagating geometry in quantitative polarization and orientational analysis.
Therefore, incident angle and incident geometry analysis is very important in terms ofpolarization and orientational analysis. It not only further exhibits the effectiveness ofthe PNA method, but also helps simplify parameter analysis in SFG-VS, especially inavoiding the influence of the refractive indices across the IR wavelengths in SFG-VSquantitative polarization and orientational analysis.
3.3. Value of the local field factors in the interface layer
Here the values of the local field factors and models to assess these values are discussed.Determination of the molecular orientation in SFG-VS and SHG is subjected to the
values of the local field factor n0ð!iÞ in the interface layer [22, 40, 83, 88–90]. We wouldlike to point to the classical papers by Shen and his co-workers for the definition of theeffective indices n0ð!iÞ, or the effective dielectric constant �
0ð!iÞ ¼ ðn0ð!iÞÞ
2, of the inter-face layer [22, 40, 91]. The physical meaning of �0ð!iÞ is the ratio between the micro-scopic local-field correction factors, i.e. �0ð!iÞ ¼ lk=l? [22, 40, 91]. Therefore, �0ð!iÞ
depends on the anisotropy of the dielectric properties in the molecular layer, andalso depends on the orientational order of the molecular dipoles [91].
It is known that since the interface layer is only one or several molecules thick andwith certain orientational order, its refractive index can be different from that of thebulk material formed with the same molecule [89, 92–99]. A theoretical treatment
Spectral and orientational analysis in surface SFG-VS 213
Dow
nloa
ded
by [
Nat
iona
l Sci
ence
Lib
rary
] at
18:
31 1
9 Ju
ly 2
012

of the local-field correction factor lii in the molecular layer for SHG was given by a clas-sical point-dipole model by Ye and Shen [91]. In a molecular monolayer with rotationalsymmetry around the interface normal z, we generally have lk ¼ lxx ¼ lyy, l? ¼ lzz. Thepoint-dipole model expresses the lii in terms of molecular packing distances, themolecular polarizability ii at the optical frequencies in the parallel and perpendiculardirections, as well as the distance of the molecule from the defined substrate surface.This model has been tested in some cases and can quantitatively describes the local-field correction factor lii in the molecular layers [92, 93, 95–99]. However, it is generallymore difficult to determine the parameters with enough accuracy in this model.In particular, on one hand, accurate orientational angles and distributions of themolecular dipoles in the molecular layer have to be known to calculate the lii termsfor obtaining �0ð!iÞ, and on the other hand, �0ð!iÞ value have to be known to determinethe orientational angles and distributions from the SHG or SFG-VS experimentalmeasurements in different polarization combinations. Therefore, this problem has tobe solved through a self-consistent approach, as suggested by Munn et al. [97–99].Here we are not going to get into the detailed expressions and parameters ofthis point-dipole model. However, we would like to point out some facts from thecalculations with the lii terms from the point-dipole model.
(a) Molecular polarizability in the optical frequency for small moleculesis typically in the range of a few A3, for example, a water molecule has¼ 1.5 A3 and a methanol molecule has ¼ 3.3 A3 [100]. With the moleculardistance calculated from their bulk densities, their lii are relatively small andclose to unity. Therefore, according to the formula in Ye and Shen [91],the n0ð!iÞ of the water interface changes from 1.14 to 1.21 when the moleculardipole of the water molecule at the pure water interface changes fromcompletely flat to upright; while for the methanol interface, n0ð!iÞ changesfrom 1.18 to 1.25. Because the molecular polarizability is generally additive,the larger the molecule, the bigger the , as well as the moleculardistance. Since the molecular dipole is usually not completely flat or completelyupright at the interfaces, therefore, for dielectric molecular layers far fromelectronic resonances, it is reasonable to say that for a simple liquid not inresonance or strong dispersion, n0ð!iÞ is generally around 1:20� 0:05, which isvery close to the n0ð!iÞ ¼ 1:18� 0:04 value used in recent quantitative analysis[22, 40, 86].
(b) For large chromophore, is usually more than one order larger than for smallmolecules. For example, the chromophores of 5CT and 8CB molecules havetheir >50 A3 at 800 nm [97–99, 101]. Simulation of an 8CB monolayer withthe formulation in Ye and Shen [91] shows that its n0ð!Þ changes from about1.4 to 1.9 as the orientation angle changes for about 108 in the molecularmonolayer and its average interface density changes from 52 to 40 A2 [101].Therefore, n0ð!Þ of such molecular layers changes significantly withthe interface molecular density as well as molecular orientation. We haverecently developed a self-consistent approach to calculate the molecular orienta-tion and n0ð!Þ values from the SHG data using the classical point-dipolemodel of the 8CB Langmuir monolayer at the air/water interface [23, 101].
214 H.-F. Wang et al.
Dow
nloa
ded
by [
Nat
iona
l Sci
ence
Lib
rary
] at
18:
31 1
9 Ju
ly 2
012
betha
Highlight
betha
Highlight

Both molecular orientation and the local field factors can be obtained atdifferent surface densities, and they agrees quantitatively with the simulationresults above.
As summarized by Shen et al. [22], in the SFG-VS and SHG literature, the values ofn0ð!iÞ were used either equal to the refractive index of one of the bulk phases, or equalto the bulk refractive index of molecules in the interface layer, or equal to values fromcertain experimental estimations. According to the discussions above, these approacheswere not on solid foundations. However, in the past two decades or so, Shen and hisco-workers have built the foundations for a quantitative treatment of this problem[22, 40, 91]. In practice, the polarization and experimental configuration analysis ofSFG-VS and SHG we have demonstrated in the previous sections can also be helpfulon this problem.
There are three n0ð!iÞs, namely, n0ð!Þ for the SF frequency, n0ð!1Þ for the visiblefrequency, and n0ð!2Þ for the IR frequencies, one has to deal with in SFG-VS analysis.In single resonant SFG-VS studies, n0ð!Þ ¼ n0ð!1Þ is generally valid within 0.03 units,because the dispersion effect is small between the SF and visible frequencies. Insection 3.2, we demonstrated that by choosing co-propagating geometry for polariza-tion and orientational analysis, the value for n0ð!2Þ of the IR frequency is insensitivein the analysis. Therefore, the problem can be generally simplified by letting n0ð!Þ ¼n0ð!1Þ ¼ n0ð!2Þ in quantitative analysis with co-propagating SFG-VS measurement.Thus, only one value for the effective refractive index in the interface layer, i.e. n0ð!Þ,needs to be determined or modelled. However, for SFG-VS in counter-propagatinggeometry, this assumption is generally not valid.
In a recent study, Shen and co-workers used n0ð!iÞ ¼ 1:18� 0:04 for all the molecularmoieties in the 5CT Langmuir monolayer at the air/water interface [22]. So far thiswork is one of the benchmark analyses of molecular orientation and conformationwith both SFG-VS and SHG [22, 40]. By doing so, consistent orientation angles andconformation for the CH3, terphenyl and CN groups of the 5CT molecule wereobtained. However, they also pointed out that using the n0ð!iÞ ¼ 1:18� 0:04 valuefor the terphenyl and CN groups is less justifiable, and the use of the proper valuesfor n0ð!iÞ in SFG-VS and SHG has to be determined with care [22].
From what we have discussed of this analysis, we can now provide some newperspectives on these results.
Firstly, since the co-propagating geometry was employed for SFG-VS measurementin this work [22], it is justifiable that n0ð!iÞ ¼ 1:18� 0:04 worked quite well with theCH3 groups. This value was also supported by calculation with the Lorentz modeltreatment [22]. This Lorentz model implies a sharp interface with only randomlyoriented dipoles. Therefore, it can be used to estimate the lower middle point, withthe lower limit for the molecular dipole lying completely flat and with the upperlimit completely upright at the interface of the n0ð!iÞ at the dielectric interfaces withmolecules of small molecular polarizability . As in the above discussions, the errorwith this estimation is expected to be less than 0.05 units for such interfaces.
Secondly, for the CN group, since the SFG-VS peak intensity of the ppp and spsare very small [22], the calculation with the ratios �ð2Þeff, sps=�
ð2Þeff, ssp and �ð2Þeff, ppp=�
ð2Þeff, ssp
using the PIR method is subject to significant errors. Furthermore, from the
Spectral and orientational analysis in surface SFG-VS 215
Dow
nloa
ded
by [
Nat
iona
l Sci
ence
Lib
rary
] at
18:
31 1
9 Ju
ly 2
012

discussion in section 3.2, these two ratios has very different dependence on the IRrefractive indices and local field factors. Therefore, the n0ð!iÞ ¼ 1:18� 0:04 calculatedfrom these data might be subject to these errors. We have recently investigated thesame system with the PNA method and conducted polarization analysis; the resultsindicated that the n0ð!iÞ value for calculating the CN orientation is larger than1:18� 0:04 [101].
Thirdly, in calculating the terphenyl group orientation angle with SHG using thefundamental wavelength at 532 nm, n0ð!!Þ has to be significantly different fromn0ð!2!Þ because of dispersion. Moreover, the jn0ð!2!Þ=n
0ð!!Þj ratio can be directly deter-mined from the SHG experiment, and it is usually significantly different from unity[23, 83]. Therefore, the treatment of SHG data of the terphenyl group with the assump-tion of n0ð!2!Þ ¼ n0ð!!Þ, as well as n
0ð!iÞ ¼ 1:18� 0:04, is generally not justifiable. Thesame conclusion goes for the treatment of the SHG study of the biphenyl chromophorein 8CB molecules at a rubbed polymer surface [23, 40]. A self-consistent calculationof the local field factors and the chromophore orientation in the 8CB Langmuirmonolayer has been conducted, which indicates that it is possible to address theproblems on changing n0ð!iÞ values at different surface densities and orientations insuch molecular layers [23, 101].
Therefore, it is still an open problem whether the layers with the CH3, CN andterphenyl groups should use different or the same n0ð!iÞ values in their orientationcalculation, since they are within the same molecule layer. If different n0ð!iÞ valueshave to be used for each of them, this implies three dielectric layers at this interface,which can be probed with different IR or visible frequencies. Further investigationwith more accuracy is certainly warranted. Even with these flaws, the basic conclusion,the problem discussed and the procedure presented on molecular orientation and con-formation analysis with SFG-VS and SHG in Zhuang and Shen’s work [22] are extre-mely useful and illuminating. This work along with others has inarguably demonstratedhow SFG-VS and SHG can certainly ‘allow us to completely map out the orientationand conformation of a fairly complicated molecule at an interface’ [22].
In summary, the n0ð!iÞ values for dielectric molecular layers not in resonance withthe SF or visible frequencies is about 1:20� 0:05. For such interfaces, experimentswith SFG-VS found that n0ð!iÞ ¼ 1:18� 0:04 can be used for the CH3 groups atliquid and polymer film interfaces [22, 86], without being subject to significant errors.The Lorentz model described by Shen et al. may be used to estimate the lowermiddle point of the n0ð!iÞ values at simple dielectric interfaces, with an error smallerthan 0.05 units. The D values in sections 3.1, 3.2 and 3.5 were calculated with then0ð!2Þ values from this Lorentz model. Since the n0ð!2Þ can be made insensitive inthe SFG-VS treatment with experiment in the co-propagating geometry,n0ð!Þ ¼ n0ð!1Þ ¼ n0ð!2Þ can be generally used in the calculation. However, this doesnot suggest that the values of the IR refractive indices and local field factors are trivial.On the contrary, this suggests a clear approach to address the issues regarding thevalues of the IR refractive indices and local field factors in the ordered interfacelayers. For molecules with large chromophores at the interface, n0ð!iÞ changes signifi-cantly with the surface density and chromophore orientation. Further investigation iscertainly needed for such interfaces, and the use of the proper values for n0ð!iÞ inSFG-VS and SHG has to be determined with care. Generally speaking, knowledge
216 H.-F. Wang et al.
Dow
nloa
ded
by [
Nat
iona
l Sci
ence
Lib
rary
] at
18:
31 1
9 Ju
ly 2
012
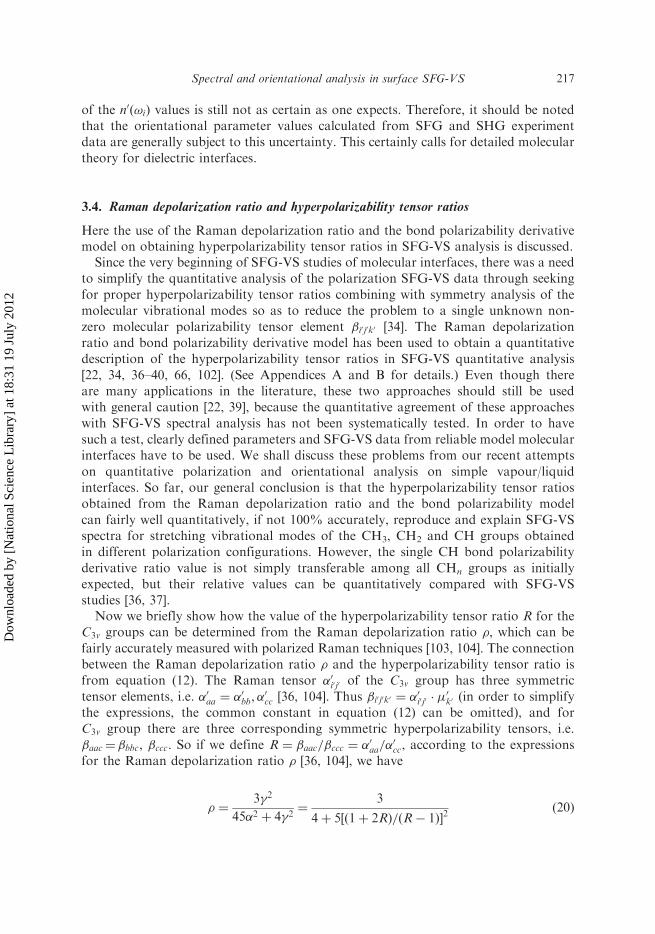
of the n0ð!iÞ values is still not as certain as one expects. Therefore, it should be notedthat the orientational parameter values calculated from SFG and SHG experimentdata are generally subject to this uncertainty. This certainly calls for detailed moleculartheory for dielectric interfaces.
3.4. Raman depolarization ratio and hyperpolarizability tensor ratios
Here the use of the Raman depolarization ratio and the bond polarizability derivativemodel on obtaining hyperpolarizability tensor ratios in SFG-VS analysis is discussed.
Since the very beginning of SFG-VS studies of molecular interfaces, there was a needto simplify the quantitative analysis of the polarization SFG-VS data through seekingfor proper hyperpolarizability tensor ratios combining with symmetry analysis of themolecular vibrational modes so as to reduce the problem to a single unknown non-zero molecular polarizability tensor element �i0j0k0 [34]. The Raman depolarizationratio and bond polarizability derivative model has been used to obtain a quantitativedescription of the hyperpolarizability tensor ratios in SFG-VS quantitative analysis[22, 34, 36–40, 66, 102]. (See Appendices A and B for details.) Even though thereare many applications in the literature, these two approaches should still be usedwith general caution [22, 39], because the quantitative agreement of these approacheswith SFG-VS spectral analysis has not been systematically tested. In order to havesuch a test, clearly defined parameters and SFG-VS data from reliable model molecularinterfaces have to be used. We shall discuss these problems from our recent attemptson quantitative polarization and orientational analysis on simple vapour/liquidinterfaces. So far, our general conclusion is that the hyperpolarizability tensor ratiosobtained from the Raman depolarization ratio and the bond polarizability modelcan fairly well quantitatively, if not 100% accurately, reproduce and explain SFG-VSspectra for stretching vibrational modes of the CH3, CH2 and CH groups obtainedin different polarization configurations. However, the single CH bond polarizabilityderivative ratio value is not simply transferable among all CHn groups as initiallyexpected, but their relative values can be quantitatively compared with SFG-VSstudies [36, 37].
Now we briefly show how the value of the hyperpolarizability tensor ratio R for theC3v groups can be determined from the Raman depolarization ratio �, which can befairly accurately measured with polarized Raman techniques [103, 104]. The connectionbetween the Raman depolarization ratio � and the hyperpolarizability tensor ratio isfrom equation (12). The Raman tensor 0i0j0 of the C3v group has three symmetrictensor elements, i.e. 0aa ¼
0bb,
0cc [36, 104]. Thus �i0j0k0 ¼
0i0j0 �
0k0 (in order to simplify
the expressions, the common constant in equation (12) can be omitted), and forC3v group there are three corresponding symmetric hyperpolarizability tensors, i.e.�aac¼ �bbc, �ccc. So if we define R ¼ �aac=�ccc ¼
0aa=
0cc, according to the expressions
for the Raman depolarization ratio � [36, 104], we have
� ¼3�2
452 þ 4�2¼
3
4þ 5 ð1þ 2RÞ=ðR� 1Þ½ �2
ð20Þ
Spectral and orientational analysis in surface SFG-VS 217
Dow
nloa
ded
by [
Nat
iona
l Sci
ence
Lib
rary
] at
18:
31 1
9 Ju
ly 2
012

with
¼1
3ð0aa þ
0bb þ
0ccÞ ¼
1
3
ð�aac þ �bbc þ �cccÞ
0c
�2 ¼1
2ð0aa �
0bbÞ
2þ ð0aa �
0ccÞ
2þ ð0bb �
0ccÞ
2� �
¼1
2
ð�aac � �bbcÞ2þ ð�aac � �cccÞ
2þ ð�bbc � �cccÞ
2� �
02c:
If we let Q ¼ffiffiffiffiffiffiffiffiffiffiffiffiffiffiffiffiffiffiffiffiffiffiffiffiffiffiffiffiffiffiffiffiffiffiffiffiffiffiffiffið3=5Þðð1=�Þ � ð4=3ÞÞ
p, then equation (20) gives �Q ¼ ð1þ 2RÞ=ðR� 1Þ.
So from a single � value, there are two corresponding R values as shown below.However, in reality only one R is physically correct. Eisenthal et al. demonstrateda method with polarized SFG-VS measurements to determine which R value is thecorrect one [38]
R ¼Qþ 1
Q� 2ðfor þQÞ or R ¼
Q� 1
Qþ 2ðfor �QÞ: ð21Þ
Generally, one can show with the bond polarizability derivative model that with0 r < 1 for the single XH bond, C3v groups, such as CH3, NH3, and SiH3, have1 < R 4 [22]. However, in the SFG-VS literature, there was some confusion onchoosing the correct R values [1, 39, 105–107]. (In [39], it was stated that R and R�1
correspond to the same � value without supporting information. In [105], a R value<1 appeared, being chosen for analysing SFG-VS data for the CH3 groups at theDMSO aqueous solution interface. In [1, 107], R<1 were used for SFG-VS analysisof the NH3 aqueous solution interface. This latter case was simply caused by usingthe Raman polarizability tensor data from reference [106], which misplaced the xxand zz values.) It is clear from equation (21) that the product of these two R valuesis ðQ2 � 1Þ=ðQ2 � 4Þ. Of course, when Q is large, this value approaches to unity, asindicated in some SFG-VS literature [39]. The reason that the Raman polarizationratio along cannot determine these two R value is easy to understand. The relationshipof 0aa ¼
0bb 6¼
0cc indicates that the molecular group is a symmetric top. If R<1, it is a
prolate symmetric top; while R>1 is an oblate symmetric top. The � value measured inan isotropic phase is the rotational average over all possible randomly distributedmolecular orientations. Therefore, it is natural that � is not able to tell the differencebetween a prolate symmetric top from a oblate symmetric top when their Ramantensor ratio Rprolate and Roblate satisfy Rprolate Roblate ¼ ðQ
2 � 1Þ=ðQ2 � 4Þ. However,when the molecule is oriented, as in the interface layer, polarization spectroscopy caneasily tell whether it is a prolate top or an oblate top [59]. This is why the polarizationmethod demonstrated by Eisenthal et al. works with SFG-VS polarizationmeasurements [38].
The effectiveness of the Raman depolarization ratio � for determining the hyper-polarizability tensor ratio R for the C3v groups relies on the following three factors:(a) the validity of equation (12); (b) the accuracy of the � values; (c) the R valuemeasured in one environment, e.g. the bulk liquid, can be used for another, e.g.the interface.
218 H.-F. Wang et al.
Dow
nloa
ded
by [
Nat
iona
l Sci
ence
Lib
rary
] at
18:
31 1
9 Ju
ly 2
012

The validity of equation (12) has been fairly well established [33, 36, 67]. Experimentswith ordinary Raman or coherent Raman techniques have shown that the depolariza-tion ratio � can be measured as accurately as 0.001 [103, 108]. Experiments have shownthat the Raman polarization ratio of the –CN and –C–C– stretching vibrations in aseries of cyano-biphenyl liquid crystals did not change when temperature (338 to368K) and pressure (0 to 150MPa) are changed in a broad range [109–111]. Forexample, under different temperature and pressure, the R value of the –CN groupfrom these measurements all fell into the range 0.26–0.27. Therefore, there is goodreason to believe that the Raman depolarization ratio � essentially does not changefrom the bulk liquid to liquid interfaces, unless specific interactions greatly alter relatedchemical bonds.
Even though there was discussion on whether the local mode treatment of the CH3
and CH2 groups with C3v and C2v symmetries, respectively, is valid, [39, 49] it hasbeen generally accepted in molecular spectroscopy textbook that ‘. . . in the case ofC–H stretches, the high frequency of the local vibration of the C–H bond tends touncouple that motion from that of the rest of the molecule’ [112]. In addition, slightdeviation from the exact C3v symmetry of the CH3 group in actual molecules can betreated with perturbations, as discussed by Hirose et al. [36].
With above considerations, the Raman depolarization ratio � obtained from experi-ment ought to be reliable for calculation of the R values, especially for the CH3 group.There is no reason to attribute big uncertainties to the R values if it is obtained from theRaman depolarization measurement data, even though it is clear that the R values fordifferent CH3 groups cannot be transferable. For example, R for the CH3 group inmethanol is 1.7, in ethanol is 3.4, and in ethane is 1.4 [39]. These are values directlyobtained from � values measured in Raman experiments, and can be used to quantita-tively address the different SFG-VS spectral features observed from these molecules,as we shall demonstrate in section 4 [26, 43].
For the symmetric stretching modes of C2v groups, such as CH2, because generally�aac 6¼ �bbc 6¼ �ccc, besides �, an additional parameter has to be employed to get thevalues for the two hyperpolarizability tensors: Ra ¼ �aac=�ccc and Rb ¼ �bbc=�ccc. Thisis partly responsible for why polarization and orientational analysis of SFG-VS spectraof the CH2 group has been scarce in the literature [26, 36, 37, 40, 41, 113]. All theseworks were based on the calculation of the ratio Ra and Rb with the bond polarizabilityderivative model.
Hirose et al. formulated the SFG-VS bond polarizability derivative model for calcu-lating the hyperpolarizability tensors of the CH3 and CH2 groups [36, 37, 114]. (Seedetails in Appendix B.) In this formulation, the hyperpolarizability tensor elements�i0j0k0 of CH3 group with C3v symmetry or CH2 group with C2v symmetry are expressedinto quantities proportional to the bond polarization derivative ratio r of a single CHbond, as defined in Appendix B [37]. Therefore, the Raman depolarization ratio �, thehyperpolarizability ratio R for CH3 group, and the Ra and Rb ratios for CH2 can beexpressed as a simple function of r. With the experimentally determined � values, R,or Ra and Rb, can be uniquely determined for quantitative polarization analysisin SFG-VS. Therefore, in this approach by Hirose et al., the value of the singlebond polarizability derivative ratio r is the only parameter needed to calculate thepolarization and orientational dependence in SFG-VS. All the derivation assumed
Spectral and orientational analysis in surface SFG-VS 219
Dow
nloa
ded
by [
Nat
iona
l Sci
ence
Lib
rary
] at
18:
31 1
9 Ju
ly 2
012

C3v symmetry for the CH3 group, and C2v symmetry for the CH2 group. Hirose et al.also pointed out that distortions from C3v and C2v symmetry can be treated withsmall perturbations, and the relationships should generally hold, with slightly differentr values [36].
However, the formulation derived by Hirose et al. has not been quantitatively testedfor its effectiveness in SFG-VS analysis, and its application in SFG-VS analysis has beenscarce. The general validity of the bond polarizability derivative model in SFG-VSanalysis has been questioned with concerns about the transferability of the r and Rvalues [39]. We recently reevaluated the expressions given by Hirose et al. for the hyper-polarizability tensors. We found that they are not consistent with themselves indifferent publications [36, 37, 114]. Therefore, attempts to test them cannot be donewithout completely re-deriving the equations (see details in Appendix B). Since theR value for the CH3 group can be directly derived from the � value without usingthe Hirose formulation, and CH3 has been the major focus in SFG-VS studies [15],Hirose’s formulation were often mentioned but not practiced in the SFG-VS literature.
On the other hand, Shen et al. used the bond additivity model which is essentially thesame as Hirose’s formulation and performed detailed quantitative SFG-VS analysis onCH2 at a polyvinyl alcohol surface [40, 41]. In this work, Shen et al. used the singlebond polarizability derivative ratio r¼ 0.14, which was obtained for the CH singlebond in the CH3 group in alkanes [115]. (The r¼ 0.14 value for the CH single bondin SFG-VS references [40, 41, 113] was cited in this paper. However, suggestions ofthis value cannot be found here.) The success of this work seems to suggest the validityof the bond polarizability derivative treatment. But since r can have different values fordifferent CH bonds, the question of whether the bond polarizability derivative model isvalid, and whether such r values can be used, needs to be addressed.
The bond polarizability derivative theory was first formulated and tested with rela-tively satisfactory results by D. A. Long in the 1950s to explain the relative intensitiesin Raman spectroscopy [116–120]. This theory was based on the simple assumption thata bond between two atoms ‘has the same polarizability irrespective of environment,provided, of course, that it remains a correct representation of the bond in the moleculein question’ [116]. The bond polarizability derivative, which is proportional to thesquare root of the Raman intensity, of a certain bond, e.g. C–H, can be empiricallyfitted from the observed Raman intensities. If this property is transferable betweenmolecules, then relative Raman intensities can be predicted in another molecule[116–121]. However, later detailed experimental and theoretical studies have shownthat the transferability of the bond polarizability derivative values is actually limited[115, 122–127]. Theoretical calculation have shown that the bond polarizability deriva-tive of individual CH bond in a molecule with different positions can vary by up to 40%[127]. Therefore, the bond polarizability derivative may not be as transferable as initi-ally hoped [116, 127]. However, it has been shown that bond polarizability derivativewith similar molecular structure features may cluster at certain values, and since assign-ment of individual Raman peaks to particular bonds is generally out of the question,‘it is not inappropriate to use an average value for the total (Raman) intensity in theCH region’ [127]. In SFG-VS, with narrower peaks, it is possible to distinguishmodes belonging to the same kind of groups connected to different atoms in themolecule (see figure 10).
220 H.-F. Wang et al.
Dow
nloa
ded
by [
Nat
iona
l Sci
ence
Lib
rary
] at
18:
31 1
9 Ju
ly 2
012

Therefore, it seems that the formulation by Hirose et al. can be valid in principle,even though the r values cannot be transferable between different molecules. Here weprovide two direct examples with SFG-VS spectra from simple liquid interfaces todemonstrate that the Hirose formulation is far more effective and valid than previouslythought, of course, using the re-derived expressions in Appendix B. As we shall discussin section 4 [26, 43], SFG-VS as a vibrational spectroscopic technique is probably amore suitable technique for studying molecular group symmetry and detail vibrationalspectral splitting in the condensed phase. SFG-VS spectra from liquid interfaces aregenerally narrower than IR and Raman spectra in the liquid phase. Molecules at theinterfaces are naturally ordered, and since the interface is only molecularly thin, sucha molecular path length does not disperse or rotate the SFG signal as with orderedbulk samples in the IR and Raman experiment where the light travels for a muchlonger optical path inside the sample. With SFG-VS as an intrinsically coherent polar-ization spectroscopy, these features allow SFG-VS to be truly sensitive to symmetry andspectral details, in comparison with other polarized spectroscopy techniques [59].Therefore, SFG-VS from the interface layer should be a good ground to test theeffectiveness of the bond polarizability derivative model.
The vapour/methanol interface was the first neat liquid interface to be studied withSFG [65]. The total lack of ppp and sps spectral features from the vapour/methanolinterface has been well reported in the literature [65, 72–75, 77]. In figure 4, itis shown that with �1 ¼ 378 and �2 ¼ 518 co-propagating geometry, the ppp spectralfeatures at 2828 cm�1 and 2940 cm�1 can be observed. Because the intensity changesbetween these two spectra agree well with the R¼ 1.7 value, as well as the bondpolarizability derivative model with r¼ 0.27, this result quantitatively validates theR¼ 1.7 value obtained directly with the � and the bond polarizability calculation.The lack of features in the 2965–2980 cm�1 region for the asymmetric stretching(as) mode of the CH3 in both experimental configurations can also be fairly wellexplained by the small �aca=�ccc ratio calculated from the bond polarizability modelin Appendix B.
Figure 5 presents SFG-VS spectra taken in the �1 ¼ 608 and �2 ¼ 558 co-propagatinggeometry on vapour/methanol and vapour/ethanol interfaces [43]. On the ppp and spsspectra, the CH3 asymmetric stretching around 2965 cm�1 for methanol is more than anorder weaker than that for ethanol. These cannot be explained by the different orienta-tions of the CH3 groups at the two interfaces. However, it can be explained with thebond polarizability derivative model, with the different r values calculated from thedifferent experimental � values. Using the expressions in Appendix B, for methanol,�aca=�ccc ¼ 1:0, while for ethanol �aca=�ccc ¼ 3:4. Therefore, with the same orientationof CH3 and with close �ccc values, the as SFG-VS peak intensities for methanol on pppand sps have to be ð3:4Þ2 ¼ 12 times weaker than those for the vapour/ethanol interface,where the as peaks at 2965 cm�1 are pronounced features on both ppp and sps spectra.The interference features around 2965 cm�1 on ssp spectra for the ethanol interfaceis also observed. These effects can all be quantitatively analysed with the knownR values and with the bond polarizability derivative formulation [101]. These resultsclearly indicate that the bond polarizability model is fairly effective and valid inquantitative analysis of SFG-VS spectra. It also indicates that the r values forthe single CH bond cannot be directly transferred between different molecules
Spectral and orientational analysis in surface SFG-VS 221
Dow
nloa
ded
by [
Nat
iona
l Sci
ence
Lib
rary
] at
18:
31 1
9 Ju
ly 2
012

in SFG-VS studies. This latter point suggests that one can use SFG-VS spectra todistinguish CH bonds with different bond polarizability derivative values.
The relative intensity of the 2828 cm�1 peak for vapour/methanol and the 2870 cm�1
peak for the vapour/ethanol interface belongs to the CH3 group in methanol and
10 × 10−6
8
6
4
2
0
SF
G in
tens
ity (
a.u.
)
3000295029002850
Wavenumber (cm−1)
sspspsppp
Methanol
5 × 10⁻⁶
4
3
2
1
0
SF
G in
tens
ity (
a.u.
)
30002950290028502800
Wavenumber (cm−1)
sspspsppp
Ethanol
Figure 5. SFG-VS spectra of the vapour/methanol and vapour/ethanol interface with �1 ¼ 608 and�2 ¼ 558 in co-propagating geometry. Assignments of the peaks can be found in table 4 [43].
222 H.-F. Wang et al.
Dow
nloa
ded
by [
Nat
iona
l Sci
ence
Lib
rary
] at
18:
31 1
9 Ju
ly 2
012

ethanol, respectively [43]. The single bond CH has r¼ 0.27, and the CH3 group hasR¼ 1.7 for the methanol molecule; while for the ethanol molecule, r¼ 0.025 andR¼ 3.4. Since their relative intensity is about 2.8, calculation of their intensity, grouporientation angle, and comparison with equation (39) show that �CH,methanol
ccc =�CH, ethanolccc ¼ 0:70 [101], if their transition dipole moments are held with close values.
This quantitatively explains the difference of the CH bond between methanol andethanol CH3 groups. With larger 0 values perpendicular to the CH bond in methanol,its 0�� is smaller, therefore its �CH,methanol
ccc value is also smaller than those for ethanol.The results indicate that quantitative comparison of the bond polarizability derivativevalues in different molecules is possible, and most importantly, such detailed compar-ison of the different CH bonds in methanol and ethanol can be used as one of theexamples for the success of the bond polarizability derivative model.
In section 4.2, comparison of SFG-VS spectra of vapour/ethylene glycol (EG)interfaces in different incident angle sets will also help demonstrate the effectivenessof the bond polarizability derivative model for SFG-VS.
In practice, r can sometimes be used as a fitting parameter when there are enoughindependently measured SFG-VS intensities in different polarizations. Shen et al.demonstrated that the r value thus obtained was generally consistent with the r valueobtained from the Raman polarization ratio measurement [22].
In summary, the bond polarizability derivative model formulated by Hirose et al. isgenerally effective and valid in quantitatively describing major aspects of SFG-VSspectra in detail. The bond polarizability derivative ratio r and hyperpolarizabilityratio R obtained from the Raman depolarization ratio can be used in SFG-VS spectralanalysis. Even though these ratios cannot be simply transferred to different molecules, aCH bond with similar structure properties can have similar r values. On these grounds,the same r value can be used for interpretation of SFG-VS spectra of groups withsimilar CH bonds in different molecules.
With better understanding of the problems associated with the local field factors andbond polarization model in the above sections, better quantitative polarization andorientational analyses can be achieved with SFG-VS studies. In the following sectionswe shall discuss problems on the application of quantitative orientational analysis andspectral analysis of SFG-VS for more complex molecular interfaces.
3.5. Approach to complex molecular interfaces with the accurately measuredorientational parameter D
Here we try to provide an approach to use the accurately measured D values for orien-tational analysis of complex molecular interfaces.
With the ability to accurately measure the orientational parameter D ¼ hcos �i=hcos3 �i in SFG-VS, the orientational order of the molecular interfaces can be furtherillustrated. In section 3.1 we have discussed how to used the PNA method to measuresmall changes in D for molecular interfaces. Now we shall discuss the basic propertiesof D and its implications for understanding orientational order of complex molecularinterfaces.
Simpson and Rowlen’s elegant work discussed the properties of the orienta-tional parameter D in SHG studies [56, 57]. By associating D with the first and third
Spectral and orientational analysis in surface SFG-VS 223
Dow
nloa
ded
by [
Nat
iona
l Sci
ence
Lib
rary
] at
18:
31 1
9 Ju
ly 2
012

orientational order parameters of molecular films, they raised awareness of themolecular orientational distribution for the SHG with the concept of the‘magic angle’ in calculating molecular orientation angles with theD values (figure 6) [56].To put it simply, a single value of D can be determined from a SHG or SFGexperiment, but it cannot be used to uniquely determine both the orientational angleand its distribution width, even if the distribution function is known.
To address these problems, our laboratory recently developed the concept of ageneral orientational parameter c and formulated the orientational functional R(�) inSHG and SFG-VS to determine both the orientation and orientational distributionwidth in the Langmuir monolayer with polarized SHG measurements [23]. This formu-lation, briefly presented in section 2.2.2, was applied to formulate the PNA methodin SHG [23] and SFG-VS [24, 25], and was applied to develop the polarization selectionrules for SFG-VS vibrational spectral assignment [26].
As discussed by Simpson and Rowlen [56] in figure 6, if one assumes a �-distributionfunction for the orientational angle �, then the value D ¼ 5=3 gives a ‘magic angle’at 39.28. The apparent tilt angle � is the theta value directly calculated fromD ¼ 1= cos2 �, i.e. assuming a �-distribution function of �. However, this ‘magic angle’corresponds to a broad range of ½�0, �� pairs as shown in figure 6. The existenceof such a ‘magic angle’ does not imply that the D value alone can never give narrowdistributions of the tilt angle �. From figure 6 one can easily find that when theapparent � is close to 08 (upright orientation) or 908 (lying flat at the interface), thedistribution width � can only have a small upper limit value, indicating that onlya narrow distribution can be allowed for these D values.
Figure 6. The apparent molecular tilt angle (calculated by assuming a �-function distribution) as a distribu-tion function of the root-mean-square width � of a Gaussian distribution function. Each curve corresponds toa centre orientational angle �0. The straight line at 39.2 is the magic angle. Reproduced with permission fromJ. Am. Chem. Soc. 1999, 121, 2635–2636. Copyright 1999 Am. Chem. Soc. [56].
224 H.-F. Wang et al.
Dow
nloa
ded
by [
Nat
iona
l Sci
ence
Lib
rary
] at
18:
31 1
9 Ju
ly 2
012

It is to be noted that in our formulation, in order to be in line with the definition ofthe general orientational parameter c, the definition of D is the inversion of the Ddefined by Simpson and Rowlen [23, 56]. This difference does not affect any of theanalysis.
With the basic understanding of the behaviour of D from Simpson and Rowlen’swork, now we can discuss more interesting properties of the orientational parameterD, and its implications in understanding the orientational order of complex molecularinterfaces.
From the definition of the orientational average denoted by h i, the ensemble averagehcos �i and hcos3 �i are equivalent to the summation of cos � and cos3 � for eachindividual molecular group divided by the total number of molecular groups,respectively. Therefore, we have
D ¼hcos �i
hcos3 �i¼ð1=NsÞ
Pi cos �i
ð1=NsÞP
i cos3 �i
: ð22Þ
The summation i is over each molecular group at the interface under study. Therefore,Pi ¼ Ns. If the same kind of molecular groups have two distinct orientations in the
interface layer, then we can let Ns ¼ N1 þN2; the mole fraction of one of the twogroups is x ¼ N1=Ns ð0 x 1Þ, and �1 and �2 as the tilt angles from the interfacenormal of the two groups, respectively, in equation (22). We have
D ¼xhcos �1i þ ð1� xÞhcos �2i
xhcos3 �1i þ ð1� xÞhcos3 �2i: ð23Þ
As shown in figure 7, left, equation (23) can be used to investigate the situation whenthe same molecular group at the interface can assume two distinct orientations. Wecame upon this formulation when we could not explain D<1 values with the singleorientation picture, no matter what distribution width is assumed. For the CH3
groups at the vapour/acetone interface, PNA measurement gives D ¼ 0:83� 0:05[80]. If a single distribution function for the tilting angle � is assumed, D<1 wouldbe impossible. If there are two distinct oriented CH3 groups, then a broad orientationaldistribution of the interfacial acetone molecules is not possible. So we have to reach forthe picture of two distinct orientations with a relatively narrow distribution width forthe CH3 groups at the vapour/acetone interface.
Analysis of equation (23) indicates that since generally jhcos �ij > jhcos3 �ij, in orderto have D<1 from equation (23), hcos �1i=hcos
3 �1i has to be close to unity, and hcos �2ihas to have opposite sign for hcos �1i, so as to make jxhcos �1i þ ð1� xÞhcos �2ij smallerthan jxhcos3 �1i þ ð1� xÞhcos3 �2ij. Thus, for the two CH3 groups in acetone, one has topoint up close to the interface normal, while the other has to point into the bulk liquidphase. With a narrow orientational distribution, if the value of � can be determined in�2 ¼ �1 þ�, equation (23) gives a unique set of ½�1, �2� values. For the vapour/acetoneinterface, MD simulation suggests the molecular plane is perpendicular to the interface[70]. Therefore, one can have � ¼ 117:28 as the C–C–C bond angle, and the calculation
Spectral and orientational analysis in surface SFG-VS 225
Dow
nloa
ded
by [
Nat
iona
l Sci
ence
Lib
rary
] at
18:
31 1
9 Ju
ly 2
012

from equation (23) gives �1 ¼ �14:48� 1:98 and �2 ¼ 102:88� 1:98, if the �-distributionfunction is assumed (figure 7, right).
Then what about some D value slightly larger than unity?For CH3 at the vapour/DMSO interface, we measured D ¼ 1:14� 0:04 [101]. From
figure 6, we know that the distribution width � of the tilt angle � cannot be more than178 in order to satisfy this D value, if a single distribution is assumed. Because the anglebetween the two CH3 groups in a DMSO molecule is 97.48, like the vapour/acetoneinterface, the two CH3 groups in DMSO have to have two distinct orientations witha certain distribution width � close to 178. These two orientations together have tosatisfy the value D ¼ 1:14� 0:04 through equation (23). Since one cannot makesimple assumptions about the � value for DMSO without additional information,no values of �1 and �2 can be uniquely determined for the moment. But fromequation (23), in order to satisfy D ¼ 1:14� 0:04, �1 has to be closer to the interfacenormal, while �2 is somewhere close to the interface, possibly but not necessarily topoint into the bulk liquid DMSO phase. On the other hand, the CH3 symmetricstretching vibrational peak is unusually strong in the ssp spectrum [105, 128]; thisalso indicates that the CH3 orientation distribution at the vapour/DMSO interfacehas to be quite narrow.
The two uniquely oriented CH3 groups at the vapour/acetone and vapour/DMSOinterfaces cannot be differentiated from their SFG-VS spectra. Even though theymay be in different chemical environments and experience different interactions at theinterfaces due to their unique orientation, the splitting is not big enough to be observedfrom their SFG-VS spectra. However, the accurately measured D values from the PNAmethod with SFG-VS revealed their unique orientation conformations.
3.5
3.0
2.5
2.0
1.5
1.0
0.5
D v
alue
−150 −100 −50 0 50 100 150
Orientation angle q1 (degree)
O
xC
CH3
CH3
z
Figure 7. Left: When �2 ¼ �1 þ� and both �1 and �2 have a �-distribution, D values in equation (23) can besmaller than unity. This feature for D has not been discussed before. If there is only one unique orientationaldistribution, D should always be larger than unity. In this plot, we put x¼ 0.5 and � ¼ 117:28, which is theangle between the two methyl groups in the acetone molecule. Right: Angular distribution of acetone at thevapour/acetone interface. The molecule illustrates the orientation with a �-distribution function of �1 and �2,while the shadowed part represents the mathematically allowed range by simulation with a Gaussiandistribution function [78, 79].
226 H.-F. Wang et al.
Dow
nloa
ded
by [
Nat
iona
l Sci
ence
Lib
rary
] at
18:
31 1
9 Ju
ly 2
012

Similarly, the orientational order of the vapour/tert-butanol interface can beanalysed. SFG-VS measurement gives D ¼ 1:32� 0:06 [101], which also indicates awell ordered interface, since a randomly ordered interface should give a much largerD value. Since each tert-butanol molecule has three CH3 groups, equation (22) hasto be formulated for three distinct oriented CH3 groups. However, analysis suggeststhat no matter how we place the molecule, two of the three CH3 groups have tohave close orientation angles. Therefore, to have x ¼ 1=3 or 2=3 in equation (23)might be a good approximation to describe the orientational order of the vapour/tert-butanol interface. This fact implies that for complex molecular interfaces,treatment with more than two or three distinct orientation distributions may not benecessary, even though the assumption for a single orientation distribution seems tobe too simple.
If the D values of two or more different groups in an interface layer can be measured,more information on the interface orientational and conformational order can bedetermined, because with D value of one group can already provide so much informa-tion. Mapping the order parameters of different molecular groups in the molecularlayer may lead to discoveries of novel physics and chemistry at complex interfaces.
SFG-VS investigation on polymer interfaces has been a growing field because of theirimportance in material sciences and implications to biological membrane studies [17].With the general formulation of D in equations (22) and (23), information on the orien-tational order of more complex molecular interfaces can be similarly extracted. Clearly,the terms in equation (22) can be grouped into more than two distinct orientatedgroups, but it seems that to have more than two or three distinct oriented groups isindeed not necessary. Analysis of such complex interfaces certainly requires otherindependently obtainable information or statistically theoretical treatment.Nevertheless, accurately measured D values of different molecular groups at such aninterface are very important. For example, now we could measure D values for bothCH3 and –C¼O groups at PMMA and PMA polymer interfaces [101]. More effort iscertainly needed to explain these data. However, it is certain that the formulationand analysis discussed here will help shed new light on our understanding of theorientational order at complex molecular interfaces.
Finally, it is to be noted that the D value obtained from PNA and PIR methodsdepends on the values of the local field factors in the interface layer. Knowledge ofthese values for a particular interface has to be obtained as discussed in section 3.3.
4. SFG-VS: a unique vibrational spectroscopy
It is important to realize that SFG-VS is not simply a vibrational spectroscopy methodfor interface studies, but also a vibrational spectroscopy technique with many advan-tages for the study of molecular vibrational spectroscopy in the condensed phases.SFG-VS can provide detailed information on molecular vibrational spectroscopyin general.
Since the SFG-VS spectral intensity depends on many parameters, as we havediscussed in previous sections, interpretation of the congested SFG-VS spectra fromcomplex molecular interfaces has been difficult. Along with technical difficulties
Spectral and orientational analysis in surface SFG-VS 227
Dow
nloa
ded
by [
Nat
iona
l Sci
ence
Lib
rary
] at
18:
31 1
9 Ju
ly 2
012

in handling complex laser systems in the research laboratory, interface studies withSFG-VS have been mainly conducted on relatively simple molecular interfaces offundamental and technological importance until most recently [15, 19]. These parametersdetermining the SFG-VS spectral intensity include polarization configuration, geometryof optical arrangement, the local field factors in the interface layer, symmetry propertiesof the molecular groups under investigation, and the hyperpolarizability tensorratios. The discussions above show that these parameters can be fairly well understood,and quantitative analysis of SFG-VS can be well established for the simple interfaces.On these bases, more complex SFG-VS spectra can be better understood.
The first step to understanding SFG-VS spectra is to have an accurate assignment ofthe spectral peaks. The common practice for spectral assignment in SFG-VS studies hasbeen to compare the spectrum with the IR and Raman results in the bulk media [13, 48,129–132], and sometimes assisted with ab initio calculations of the IR or Raman bandpositions of free molecules in the gas phase [13, 39]. This is the natural approachbecause the selection rules of SFG dictate that any sum frequency active molecularvibrational mode has to be both IR and Raman active as dictated by equation (12)[33]. The above practice has been able to address major SFG-VS spectral featuresand has been reasonably successful in SFG-VS studies. Thus, the general consensushas been that ‘. . . there is no simple relationship between observed peak positionsand intensities (in the SFG spectrum) and the properties of the underline modes, andthe parameters can be extracted by curve fitting’ [13]. This situation has lasted andhas left the assignment of complex SFG-VS spectra subject to the difficultiesand errors of the common IR and Raman studies.
If one looks into this matter closely, however, it is not hard to find the logical flaw inthe spectral fitting approach in SFG-VS, because almost all SFG-VS spectra in the CHstretching vibration region, i.e. around 2800–3000 cm�1, show narrower peaks and havemore separated features than these of the same molecule measured with IR and Ramanspectroscopy in the condensed phase [7, 26, 43]. This is due to the relatively muchmore ordered interfacial structure and the less dynamic nature of the interactions ofthe molecules at the interface than that in the condensed phase under the same ambientconditions [7, 30, 133, 134]. Consequently, some of these features could not beaccounted for by the existing IR and Raman assignments [7, 26, 43]. For example,even though we generally know that the 2800–3000 cm�1 region belongs to the CHstretching vibrational modes in IR and Raman spectroscopy, the features in SFG-VSspectra of vapour/1-heptanol and vapour/1-octanol interfaces in figure 12 cannotbe clearly assigned with knowledge only from IR and Raman assignments [43]. Thedifficulty in the practice of SFG-VS with knowledge only from IR and Ramanspectroscopy calls for methods which can provide effective and ‘in situ’ assignmenton SFG-VS spectrum.
In IR and Raman spectroscopy, knowledge of the symmetry property, i.e. polariza-tion property, of each vibrational peak is crucial for determination of its symmetrycategory, leading to explicit assignment of the spectra [135]. The ability to performpolarization measurements on oriented molecular samples is the key to success inspectral assignment [59]. However, it is generally difficult to prepare a well orderedmolecular sample for such spectroscopic measurement. In previous IR or Ramanstudies, because of the inhomogeneous broadening effect in liquid or solid samples,
228 H.-F. Wang et al.
Dow
nloa
ded
by [
Nat
iona
l Sci
ence
Lib
rary
] at
18:
31 1
9 Ju
ly 2
012

many vibrational spectral details can only emerge well below liquid hydrogen tempera-ture with crystalline samples where the spectral line broadening is greatly suppressed[136–139]. Another disadvantage for an ordered crystalline sample is that it may addoptical rotation to the polarization of the optical beam, making it difficult for accuratepolarization measurement of the weak spectra. Therefore, the symmetry propertiesof many weaker peaks and overlapping peaks have not been well characterized inIR and Raman spectroscopy.
Since SFG-VS is by nature a polarization spectroscopic technique, and the moleculesat the liquid interface are naturally ordered due to the anisotropic forces across the inter-facial region, the polarization dependence in SFG-VS spectra may also be used to deter-mine the symmetry property of each SFG-VS spectral peak. Additionally, since theinterface layer is just molecularly thin, the refractive SFG-VS signal is not subject tooptical rotation once we leave the interface. SFG-VS also has a stronger polarizationdependence than IR and Raman spectroscopy, because as a second-order non-linearprocess, SFG-VS, whose j�ð2Þeff j
2 is a function of higher orders of cos � function thanthe linear absorption and Raman processes, has to be more sensitive to molecular orien-tation [23, 53, 59]. Because of these unique properties of SFG-VS, assignment from IRand Raman spectroscopy may not be enough to assign SFG-VS spectra. In order toavoid such limitations, it is better to have a set of selection rules for SFG-VS spectralassignment, and they can be used along with knowledge from IR and Raman studies.
The review of the practices in SFG-VS above indicated that polarization dependencehas not been generally considered in assigning SFG-VS spectra. There has been workusing SFG-VS intensities [22, 40] and orientation analysis [107] for deducing the orien-tational angle or the hyperpolarizability ratio of certain functional groups. But it is rareto use the spectral intensity relationship between different polarization configurationsto help spectral assignments [86]. Only very recently, polarization selection rules inSFG-VS have been systematically attempted to help SFG-VS spectral assignment onCH3, CH2 and CH groups in the 2800–3000 cm�1 region [26, 43]. These studies demon-strate the importance and usefulness of SFG-VS polarization selection rules. Not onlycan many ambiguous assignments in SFG-VS spectra be addressed, but also some newspectral features and some incorrectly or ambiguously assigned peaks in the IR andRaman regime can be clarified. One such example is that of the 2940 cm�1 peak forthe ethylene glycol (EG) molecule, which has long been considered an asymmetricC–H stretching mode in the literature [5, 26, 35, 140, 141]; it has been unambiguouslyidentified as the Fermi resonance peak of the EG methylene symmetric stretching modethrough SFG-VS polarization selection rules, and in addition, through measurementand analysis with four different sets of incident angles, as shown in figure 9 and thediscussions in section 4.2.
It has been shown that SFG-VS polarization selection rules can help assignments oncomplex SFG-VS spectra [43]. This is one important step for its application to complexinterfaces such as polymeric and bio-membrane surfaces. Using these selection rules,IR and Raman assignments can also be validated or corrected. These aspects makeSFG-VS a unique vibrational spectroscopy not only for interface studies, but also forgeneral vibrational spectral assignment purposes.
In this section, the polarization selection rules for SFG-VS are presented basedon the formulation in section 2.2.3. Using these selection rules, SFG-VS spectra
Spectral and orientational analysis in surface SFG-VS 229
Dow
nloa
ded
by [
Nat
iona
l Sci
ence
Lib
rary
] at
18:
31 1
9 Ju
ly 2
012

of a series of vapour/liquid interfaces in the 2800–3000 cm�1 region are assigned, andsome general considerations on related problems in IR and Raman assignments arealso discussed.
4.1. SFG-VS: molecular symmetry and polarization selection rules
Polarization selection rules or guidelines in SFG-VS spectral analysis can be derived formolecular groups with different symmetry properties. This is based on the simple ideathat vibrational peaks belonging to different symmetry types do not have the samepolarization dependence in SFG-VS spectra. These rules help greatly to determinethe symmetry types of vibrational modes with SFG-VS spectra in different polariza-tions. These rules allow the assignment of SFG-VS spectra in situ, i.e. with their ownselection rules directly applied to SFG data, instead of ex situ, i.e. depending only ontransferable knowledge from the IR and Raman assignments.
Even though the SFG-VS spectral intensity depends on many parameters, there aresome generally held polarization dependence relationships, and they can be abstractedas rules or guidelines for SFG-VS spectral assignment. Since the function d 2Rð�Þ inequation (14) is responsible for the molecular contribution to the SFG-VS intensity,the d and c values for each vibrational modes of CH3, CH2 and CH groups in differentpolarization configurations can be evaluated, and the function d 2Rð�Þ can beevaluated against different orientational angles �. Table 3 lists all the correspondingd and c values calculated using the parameters in table 2. In order to see the polarizationselection rules for these three groups, each d 2Rð�Þ function is plotted against � with a�-distribution function in figure 8.
From table 3 and figure 8, some general relationship can be abstracted, and thefollowing polarization selection rules (guidelines) can be reached.
For CH3 groups, the polarization selection rules are:
(a) For the ss mode, the ssp intensity is always many times that for ppp, as well asfor sps and pss.
(b) For the as mode, the ppp intensity is always many times that for ssp, and bothof them would be largest when � ¼ 54:78.
(c) For small �, the sps and pss intensity is the largest for the as mode, and thesmallest for the ss mode.
(d) In ssp spectra, the as mode would negatively interfere with the ss mode whentheir frequencies overlap.
Table 2. Refractive indices used in calculating d and c values plotted in figure 8. The refractive indicesused for CH3 and CH are intended for the n-normal alcohols; while the refractive indices used for CH2
are intended for the diols. n0ð!Þ is calculated with the Lorentz model given by Shen et al. [22].
CH3 or CH CH2
Group ! !1 !2 ! !1 !2
n1(!i) 1.0 1.0 1.0 1.0 1.0 1.0n2(!i) 1.36 1.36 1.36 1.44 1.44 1.44n0ð!iÞ 1.16 1.16 1.16 1.18 1.18 1.18
230 H.-F. Wang et al.
Dow
nloa
ded
by [
Nat
iona
l Sci
ence
Lib
rary
] at
18:
31 1
9 Ju
ly 2
012

For the CH2 group, the polarization selection rules are:
(e) No ss peak appears in sps and pss spectra.(f) The ssp-ss intensity is always many times that of ppp-ss.(g) Peaks in the sps and pss spectra generally come from the as mode with a
relatively small tilt angle �.(h) For the as mode, the ppp intensity is always several times that of ssp. That is
to say, if there is any peak which is stronger in the ssp than ppp spectra,it cannot be from the as mode.
(i) In the ssp spectra, the ss and as modes of the CH2 groups with similarorientation negatively interfere with each other.
1.0
0.8
0.6
0.4
0.2
0.0 d2 R
(q)
for
CH
3-ss
(b c
cc2 )
d2 R
(q)
for
CH
3-as
(b a
ca2 )
d2 R
(q)
for
CH
(b c
cc2 )
d2 R
(q)
for
CH
2-as
(b a
ca2 )
d2 R
(q)
for
CH
2-ss
(b c
cc2 )
806040200
ssp
ppp
spspss
80 × 10−3
40 × 10−3
60
40
20
0806040200
Orientational angle (q)
806040200
Orientational angle (q)
806040200Orientational angle (q)
ppppss
sps
ssp
0.05
0.04
0.03
0.02
0.01
0.00
ssp
ppp × 10
sps pss
0.014
0.012
0.010
0.008
0.006
0.004
0.002
0.000
ppp
ssp
sps
pss
30
20
10
0
ppp
psssps
ssp
Figure 8. Polarization and symmetry dependence of symmetric and asymmetric stretching vibrationalmodes of CH3, CH2 and CH groups [26, 43]. R¼ 3.4 was used for CH3 group, r¼ 0.27 for CH group. ForCH2, all r give the same plot in figure 8. All calculations are with �1 ¼ 60� and �2 ¼ 55� in the co-propagatinggeometry. Each curve is plotted against the orientational angle � of the symmetry axis of the group. The unitsof SFG intensities are in ð�cccÞ
2 or ð�acaÞ2 of each individual group. Their relative intensity can be compared
with the bond polarizability derivative calculations in Appendix B, and they are consistent with theexperimental intensities [26, 43].
Spectral and orientational analysis in surface SFG-VS 231
Dow
nloa
ded
by [
Nat
iona
l Sci
ence
Lib
rary
] at
18:
31 1
9 Ju
ly 2
012
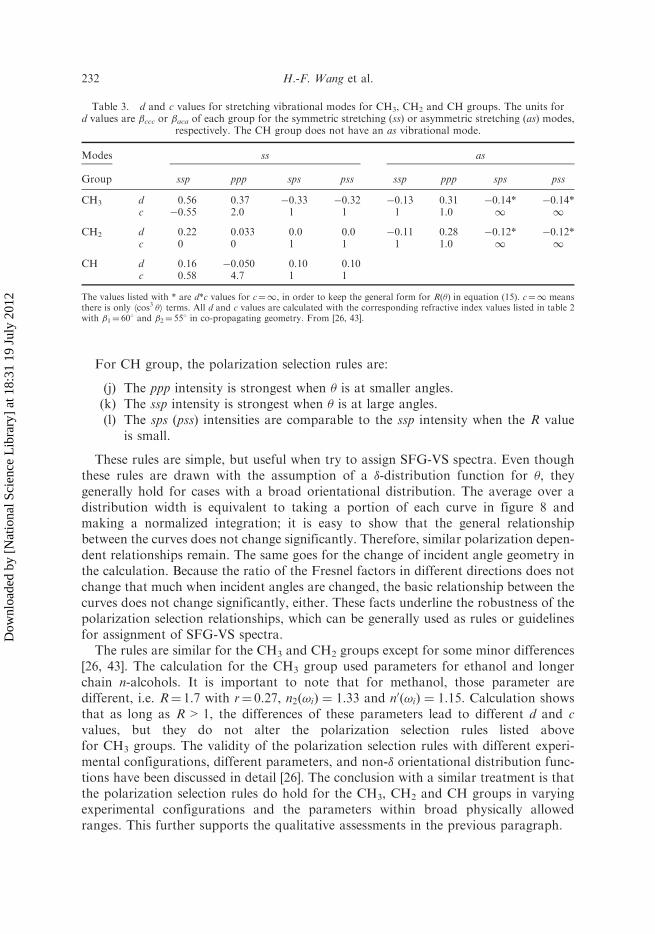
For CH group, the polarization selection rules are:
(j) The ppp intensity is strongest when � is at smaller angles.(k) The ssp intensity is strongest when � is at large angles.(l) The sps (pss) intensities are comparable to the ssp intensity when the R value
is small.
These rules are simple, but useful when try to assign SFG-VS spectra. Even thoughthese rules are drawn with the assumption of a �-distribution function for �, theygenerally hold for cases with a broad orientational distribution. The average over adistribution width is equivalent to taking a portion of each curve in figure 8 andmaking a normalized integration; it is easy to show that the general relationshipbetween the curves does not change significantly. Therefore, similar polarization depen-dent relationships remain. The same goes for the change of incident angle geometry inthe calculation. Because the ratio of the Fresnel factors in different directions does notchange that much when incident angles are changed, the basic relationship between thecurves does not change significantly, either. These facts underline the robustness of thepolarization selection relationships, which can be generally used as rules or guidelinesfor assignment of SFG-VS spectra.
The rules are similar for the CH3 and CH2 groups except for some minor differences[26, 43]. The calculation for the CH3 group used parameters for ethanol and longerchain n-alcohols. It is important to note that for methanol, those parameter aredifferent, i.e. R¼ 1.7 with r¼ 0.27, n2ð!iÞ ¼ 1:33 and n0ð!iÞ ¼ 1:15. Calculation showsthat as long as R>1, the differences of these parameters lead to different d and cvalues, but they do not alter the polarization selection rules listed abovefor CH3 groups. The validity of the polarization selection rules with different experi-mental configurations, different parameters, and non-� orientational distribution func-tions have been discussed in detail [26]. The conclusion with a similar treatment is thatthe polarization selection rules do hold for the CH3, CH2 and CH groups in varyingexperimental configurations and the parameters within broad physically allowedranges. This further supports the qualitative assessments in the previous paragraph.
Table 3. d and c values for stretching vibrational modes for CH3, CH2 and CH groups. The units ford values are �ccc or �aca of each group for the symmetric stretching (ss) or asymmetric stretching (as) modes,
respectively. The CH group does not have an as vibrational mode.
Modes ss as
Group ssp ppp sps pss ssp ppp sps pss
CH3 d 0.56 0.37 �0.33 �0.32 �0.13 0.31 �0.14* �0.14*c �0.55 2.0 1 1 1 1.0 1 1
CH2 d 0.22 0.033 0.0 0.0 �0.11 0.28 �0.12* �0.12*c 0 0 1 1 1 1.0 1 1
CH d 0.16 �0.050 0.10 0.10c 0.58 4.7 1 1
The values listed with * are d*c values for c¼1, in order to keep the general form for R(�) in equation (15). c¼1 meansthere is only hcos3 �i terms. All d and c values are calculated with the corresponding refractive index values listed in table 2with �1¼ 608 and �2¼ 558 in co-propagating geometry. From [26, 43].
232 H.-F. Wang et al.
Dow
nloa
ded
by [
Nat
iona
l Sci
ence
Lib
rary
] at
18:
31 1
9 Ju
ly 2
012
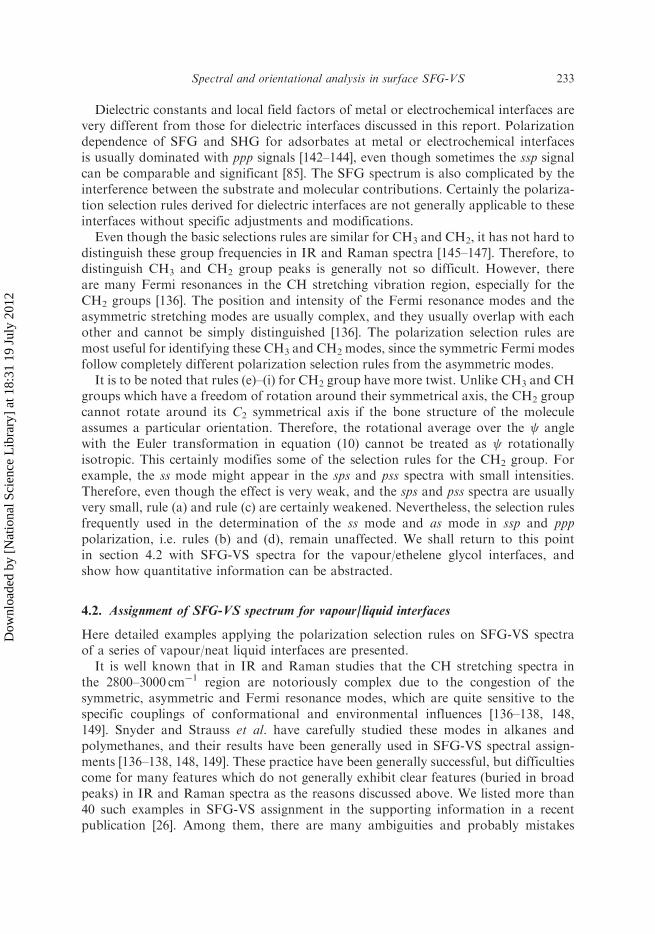
Dielectric constants and local field factors of metal or electrochemical interfaces arevery different from those for dielectric interfaces discussed in this report. Polarizationdependence of SFG and SHG for adsorbates at metal or electrochemical interfacesis usually dominated with ppp signals [142–144], even though sometimes the ssp signalcan be comparable and significant [85]. The SFG spectrum is also complicated by theinterference between the substrate and molecular contributions. Certainly the polariza-tion selection rules derived for dielectric interfaces are not generally applicable to theseinterfaces without specific adjustments and modifications.
Even though the basic selections rules are similar for CH3 and CH2, it has not hard todistinguish these group frequencies in IR and Raman spectra [145–147]. Therefore, todistinguish CH3 and CH2 group peaks is generally not so difficult. However, thereare many Fermi resonances in the CH stretching vibration region, especially for theCH2 groups [136]. The position and intensity of the Fermi resonance modes and theasymmetric stretching modes are usually complex, and they usually overlap with eachother and cannot be simply distinguished [136]. The polarization selection rules aremost useful for identifying these CH3 and CH2 modes, since the symmetric Fermi modesfollow completely different polarization selection rules from the asymmetric modes.
It is to be noted that rules (e)–(i) for CH2 group have more twist. Unlike CH3 and CHgroups which have a freedom of rotation around their symmetrical axis, the CH2 groupcannot rotate around its C2 symmetrical axis if the bone structure of the moleculeassumes a particular orientation. Therefore, the rotational average over the anglewith the Euler transformation in equation (10) cannot be treated as rotationallyisotropic. This certainly modifies some of the selection rules for the CH2 group. Forexample, the ss mode might appear in the sps and pss spectra with small intensities.Therefore, even though the effect is very weak, and the sps and pss spectra are usuallyvery small, rule (a) and rule (c) are certainly weakened. Nevertheless, the selection rulesfrequently used in the determination of the ss mode and as mode in ssp and ppppolarization, i.e. rules (b) and (d), remain unaffected. We shall return to this pointin section 4.2 with SFG-VS spectra for the vapour/ethelene glycol interfaces, andshow how quantitative information can be abstracted.
4.2. Assignment of SFG-VS spectrum for vapour/liquid interfaces
Here detailed examples applying the polarization selection rules on SFG-VS spectraof a series of vapour/neat liquid interfaces are presented.
It is well known that in IR and Raman studies that the CH stretching spectra inthe 2800–3000 cm�1 region are notoriously complex due to the congestion of thesymmetric, asymmetric and Fermi resonance modes, which are quite sensitive to thespecific couplings of conformational and environmental influences [136–138, 148,149]. Snyder and Strauss et al. have carefully studied these modes in alkanes andpolymethanes, and their results have been generally used in SFG-VS spectral assign-ments [136–138, 148, 149]. These practice have been generally successful, but difficultiescome for many features which do not generally exhibit clear features (buried in broadpeaks) in IR and Raman spectra as the reasons discussed above. We listed more than40 such examples in SFG-VS assignment in the supporting information in a recentpublication [26]. Among them, there are many ambiguities and probably mistakes
Spectral and orientational analysis in surface SFG-VS 233
Dow
nloa
ded
by [
Nat
iona
l Sci
ence
Lib
rary
] at
18:
31 1
9 Ju
ly 2
012

on assigning the related SFG-VS spectral peaks, especially for the Fermi resonance andas modes for the CH2 groups. The CH2 modes have been most troublesome in termsof spectral assignment, and we have to deal with them with CH2-only model moleculessuch as diols.
The polarization selection rules for CH2 help greatly in understanding the SFG-VSspectrum of the CH2 group vibrational modes. Figures 9 and 10 show SFG-VS for afew CH2-only interfaces. SFG-VS spectra of ethylene glycol (EG) at vapour/liquidand liquid/solid interfaces were reported before [5, 35, 140, 141]. In these studies, the2940 cm�1 peak in the ssp spectra was assigned to the CH2-as mode as usual.However, assignments of SFG-VS spectra of vapour/EG and two other vapour/diolinterfaces according to the polarization selection rules are in figures 9 and 10.According to rule (f), this 2940 cm�1 peak on the ssp spectrum must belong to ass mode as identified as the CH2-Fermi-ss mode; while the CH2-as mode is about2900 cm�1, which appears clearly on the ppp spectrum, and it is in opposite phase tothe CH2-ss peaks at 2870 cm
�1 and 2940 cm�1 on the ssp spectrum, as predicted exactlyby rule (i) [26].
Here we can see the usefulness of the formulation of R(�) with the d and c parametersin section 2.2 [23, 53]. Table 3 lists the d ¼ �0:11, c¼ 1.0 for the CH2-as mode,
8 ×10⁻⁶
6
4
2
SFG
inte
nsity
(a.
u.)
300029502900285028002750 29502900285028002750
Wavenumber (cm−1) Wavenumber (cm−1)
300029502900285028002750 29502900285028002750
Wavenumber (cm−1) Wavenumber (cm−1)
CH2-Fermi
CH2-ss
CH2-as
HO-(CH2)2-OHssppppspspss
Vis 60°IR 55°
14 ×10−6
12
10
8
6
4
2
0
SF in
tens
ity (
a.u.
)SF
inte
nsity
(a.
u.)
Vis 62°IR 53°
ssp ppp
14 ×10−6
12
10
8
6
4
2
0
SF in
tens
ity (
a.u.
)
Vis 37° IR 51° ssp
ppp
14 ×10−6
12
10
8
6
4
2
0
ssp pppVis 45°
IR 55°
Figure 9. SFG-VS spectra of the vapour/ethylene glycol interface at four incident angle sets inco-propagating geometry [26, 81].
234 H.-F. Wang et al.
Dow
nloa
ded
by [
Nat
iona
l Sci
ence
Lib
rary
] at
18:
31 1
9 Ju
ly 2
012

and d¼ 0.22, c¼ 0 for the CH2-ss mode in ssp polarization. Therefore, these two modesshould have their drð�Þ field factors in opposite phase throughout all � values. In themeantime, in the ppp polarization, we have d¼ 0.28, c¼ 1.0 for the CH2-as mode, andd¼ 0.033, c¼ 0 for the CH2-ss mode. Therefore, these two modes have the same phasefor their drð�Þ field factors. In fitting SFG-VS ssp spectra of the vapour/EG interface, asmall peak at about 2900 cm�1 in opposite phase with the 2870 cm�1 and 2940 cm�1
peaks has to be included. Therefore, the detailed interference in theSFG-VS spectrum is correctly predicted by the calculated d and c values. It is importantto realize that both d and r(�), i.e. c, contribute to the sign of the phase. If c>1,r(�) changes sign when � crosses the value � ¼ arccos c�1=2
� �. This is a very useful concept
when the interference effects in complex spectra, especially in the ppp polarization, needto be analysed. Given the importance of the interference effect in SFG-VSspectrum analysis [150, 151], the detailed analysis with this formulation will find moreapplications in SFG-VS studies. Such spectral detail can be very difficult to discernwithout such tools. For example, from table 3, the negative interference between theCH3-asmode around 2960 cm�1 and the tail of the CH2 or CH3-Fermi-ss in that vicinity
4 × 10⁻⁶
4 × 10⁻⁶
3
2
1
SFG
inte
nsity
(a.
u.)
SFG
inte
nsity
(a.
u.)
300029502900285028002750
Wavenumber (cm−1)
300029502900285028002750
Wavenumber (cm−1)
CH2-Fermi
CH2-ss
CH2-asHO-(CH2)3-OH
ssppppspspss
Vis 60°IR 55°
3
2
1
CH2-Fermi
CH2-ss
CH2-as
CH2-as
HO-(CH2)5-OH
ssppppspspss
Vis 60°IR 55°
Figure 10. SFG-VS spectra of vapour/1,3-propanediol and vapour/1,5-pentanediol interfaces, with�1 ¼ 60� and �2 ¼ 55� in co-propagating geometry [26].
Spectral and orientational analysis in surface SFG-VS 235
Dow
nloa
ded
by [
Nat
iona
l Sci
ence
Lib
rary
] at
18:
31 1
9 Ju
ly 2
012

on the ssp spectrum is predicted and observed in SFG-VS spectra of the vapour/ethanolinterface as in figure 5.
To further validate the assignments for the spectrum of the vapour/EG interface,SFG-VS spectra in four sets of incident angles in the co-propagating geometry wereobtained in figure 9. The quantitative aspects of these spectra can be fairly welladdressed with the bond polarizability derivative mode with a r ’ 0:3 and a twistangle around 508 [101]. This relatively large r value is consistent with the fact thatthe CH2 groups are directly connected to the OH group, which increases the perpendic-ular polarizability derivatives of the single CH bond. The same effect was observedin the CH3 group in the methanol molecule, which has r¼ 0.27. It seems that generallywhen CH2 or CH3 are connected to the OH group, their single bond r value shouldincrease quite significantly.
In figure 9, in the ppp spectrum with �1 ¼ 628 and �2 ¼ 538, three peaks are clearlypresent; on the ppp spectrum with �1 ¼ 378 and �2 ¼ 518, only the CH2-ss peakat 2870 cm�1 is present; while on the ppp spectra with �1 ¼ 458 and �2 ¼ 558, a small2870 cm�1 overlaps with a small 2900 cm�1 peak. Simulation with the incident angledependence quantitatively predicts the polarization dependence of all the peaks infigure 9. This is clear confirmation that there is essentially negligible contribution tothe 2940 cm�1 peak on the ssp spectrum from the CH2-as mode [101, 141].
In the four sets of SFG-VS spectra in figure 9, the polarization selection rules forCH2 are all valid. This fact clearly indicates the robustness of these selection rulesfor different experimental configurations. As we mentioned above, one thing thatdoes not fit the selection rule is that small intensities on sps and pss persist in all thespectral sets (only shown with �1 ¼ 608 and �2 ¼ 558 set). Usually such a smallsignal can be treated as noise. However, careful examination indicates that this isevidence that the twist angle is not randomly distributed as discussed below.
From Appendix B, we can see that the relationship �aac þ �bbc � 2�ccc ¼ 0 holdsgenerally for all r values in the CH2 group. This will make all the terms inequation (32) with �aac þ �bbc � 2�ccc disappear. Therefore, no sps-ss and pss-ss areallowed as stated by the selection rule (e). However, with the twist angle ,equation (30) has to be used for CH2-ss modes. The �aac þ �bbc � 2�ccc ¼ 0 inequation (32) now becomes 2hcos2 i�aac þ 2hsin2 i�bbc � 2�ccc 6¼ 0, as long ashcos2 i 6¼ hsin2 i 6¼ 1=2. However, because �aac þ �bbc � 2�ccc ¼ 0 is still true, thevalue of 2hcos2 i�aacþ 2hsin2 i�bbc � 2�ccc has to remain small. Thus, the sps-ssand pss-ss intensity at 2870 cm�1 and 2940 cm�1 can only be very small compared tothe ssp-ss and ppp-ss intensities. Therefore, the polarization selection rules regardingthe ssp and ppp intensities are generally valid even if the twist angle cannot beaveraged out as with random rotation.
Quantitative analysis of the spectra in figures 9 and 10 can further reveal theeffectiveness of the bond polarizability derivative model. One striking fact is the verystrong peak around 2900 cm�1 in the ppp SFG-VS spectra for the vapour/1,5-pentane-diol interface in figure 10. This peak clearly belong to the CH2-as mode [26]. In each1,5-pentanediol molecule, there are three kinds of CH2 groups, two directly connectedto the end OH groups at the position, two on the � position, one in the centre at the� position. Therefore, their r value should decrease as the CH2 is further from the OHgroup. From the bond polarizability derivative model for CH2 in equation (40), one has
236 H.-F. Wang et al.
Dow
nloa
ded
by [
Nat
iona
l Sci
ence
Lib
rary
] at
18:
31 1
9 Ju
ly 2
012
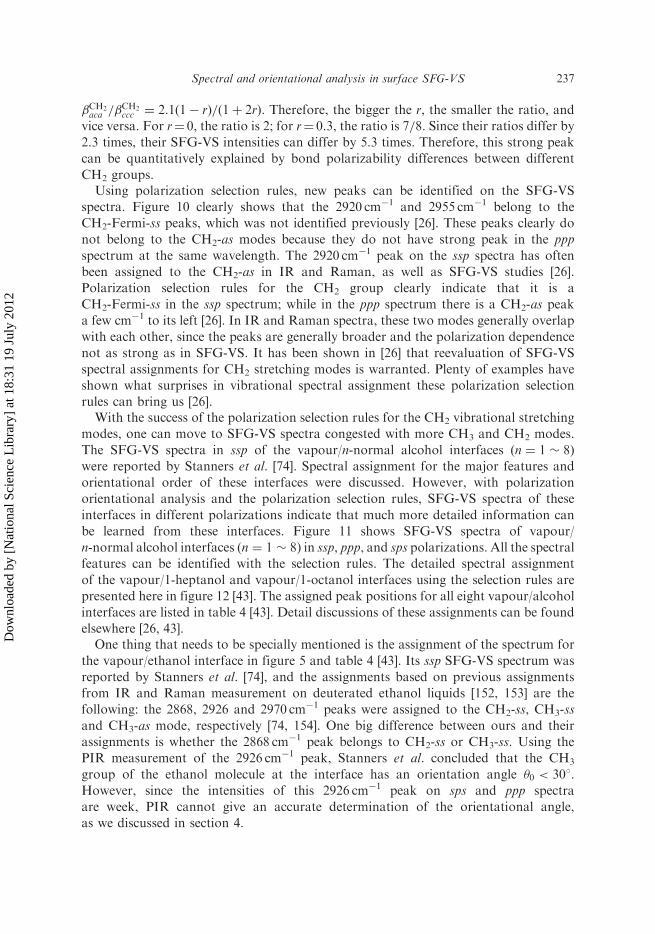
�CH2aca =�
CH2ccc ¼ 2:1ð1� rÞ=ð1þ 2rÞ. Therefore, the bigger the r, the smaller the ratio, and
vice versa. For r¼ 0, the ratio is 2; for r¼ 0.3, the ratio is 7=8. Since their ratios differ by2.3 times, their SFG-VS intensities can differ by 5.3 times. Therefore, this strong peak
can be quantitatively explained by bond polarizability differences between different
CH2 groups.Using polarization selection rules, new peaks can be identified on the SFG-VS
spectra. Figure 10 clearly shows that the 2920 cm�1 and 2955 cm�1 belong to the
CH2-Fermi-ss peaks, which was not identified previously [26]. These peaks clearly do
not belong to the CH2-as modes because they do not have strong peak in the ppp
spectrum at the same wavelength. The 2920 cm�1 peak on the ssp spectra has often
been assigned to the CH2-as in IR and Raman, as well as SFG-VS studies [26].
Polarization selection rules for the CH2 group clearly indicate that it is a
CH2-Fermi-ss in the ssp spectrum; while in the ppp spectrum there is a CH2-as peak
a few cm�1 to its left [26]. In IR and Raman spectra, these two modes generally overlap
with each other, since the peaks are generally broader and the polarization dependence
not as strong as in SFG-VS. It has been shown in [26] that reevaluation of SFG-VS
spectral assignments for CH2 stretching modes is warranted. Plenty of examples have
shown what surprises in vibrational spectral assignment these polarization selection
rules can bring us [26].With the success of the polarization selection rules for the CH2 vibrational stretching
modes, one can move to SFG-VS spectra congested with more CH3 and CH2 modes.
The SFG-VS spectra in ssp of the vapour/n-normal alcohol interfaces (n ¼ 1 � 8)
were reported by Stanners et al. [74]. Spectral assignment for the major features and
orientational order of these interfaces were discussed. However, with polarization
orientational analysis and the polarization selection rules, SFG-VS spectra of these
interfaces in different polarizations indicate that much more detailed information can
be learned from these interfaces. Figure 11 shows SFG-VS spectra of vapour/
n-normal alcohol interfaces (n ¼ 1 � 8) in ssp, ppp, and sps polarizations. All the spectral
features can be identified with the selection rules. The detailed spectral assignment
of the vapour/1-heptanol and vapour/1-octanol interfaces using the selection rules are
presented here in figure 12 [43]. The assigned peak positions for all eight vapour/alcohol
interfaces are listed in table 4 [43]. Detail discussions of these assignments can be found
elsewhere [26, 43].One thing that needs to be specially mentioned is the assignment of the spectrum for
the vapour/ethanol interface in figure 5 and table 4 [43]. Its ssp SFG-VS spectrum was
reported by Stanners et al. [74], and the assignments based on previous assignments
from IR and Raman measurement on deuterated ethanol liquids [152, 153] are the
following: the 2868, 2926 and 2970 cm�1 peaks were assigned to the CH2-ss, CH3-ss
and CH3-as mode, respectively [74, 154]. One big difference between ours and their
assignments is whether the 2868 cm�1 peak belongs to CH2-ss or CH3-ss. Using the
PIR measurement of the 2926 cm�1 peak, Stanners et al. concluded that the CH3
group of the ethanol molecule at the interface has an orientation angle �0 < 308.However, since the intensities of this 2926 cm�1 peak on sps and ppp spectra
are week, PIR cannot give an accurate determination of the orientational angle,
as we discussed in section 4.
Spectral and orientational analysis in surface SFG-VS 237
Dow
nloa
ded
by [
Nat
iona
l Sci
ence
Lib
rary
] at
18:
31 1
9 Ju
ly 2
012
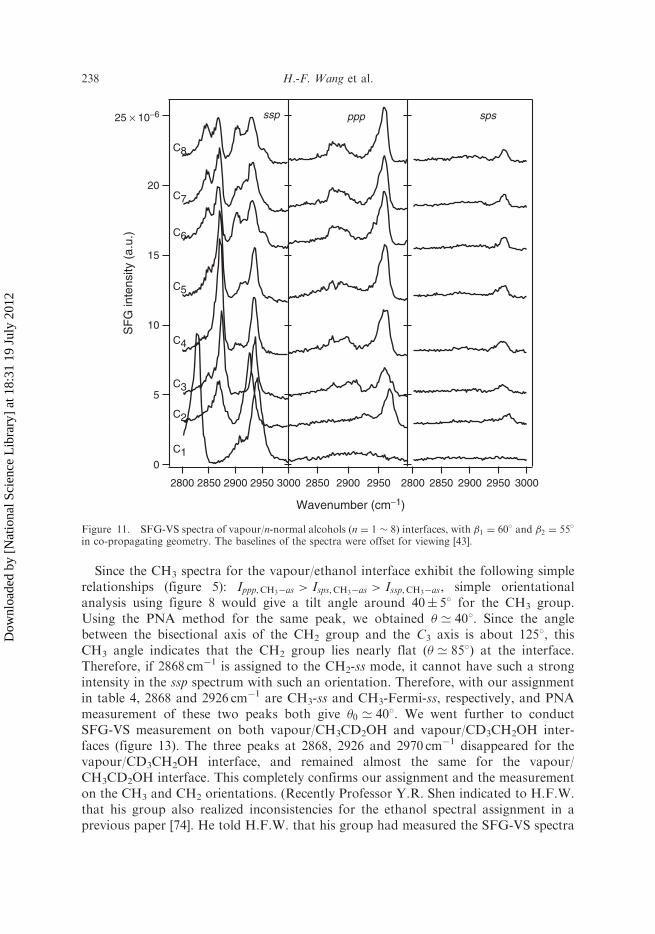
Since the CH3 spectra for the vapour/ethanol interface exhibit the following simplerelationships (figure 5): Ippp, CH3�as > Isps, CH3�as > Issp, CH3�as, simple orientationalanalysis using figure 8 would give a tilt angle around 40� 58 for the CH3 group.Using the PNA method for the same peak, we obtained � ’ 408. Since the anglebetween the bisectional axis of the CH2 group and the C3 axis is about 1258, thisCH3 angle indicates that the CH2 group lies nearly flat (� ’ 858) at the interface.Therefore, if 2868 cm�1 is assigned to the CH2-ss mode, it cannot have such a strongintensity in the ssp spectrum with such an orientation. Therefore, with our assignmentin table 4, 2868 and 2926 cm�1 are CH3-ss and CH3-Fermi-ss, respectively, and PNAmeasurement of these two peaks both give �0 ’ 408. We went further to conductSFG-VS measurement on both vapour/CH3CD2OH and vapour/CD3CH2OH inter-faces (figure 13). The three peaks at 2868, 2926 and 2970 cm�1 disappeared for thevapour/CD3CH2OH interface, and remained almost the same for the vapour/CH3CD2OH interface. This completely confirms our assignment and the measurementon the CH3 and CH2 orientations. (Recently Professor Y.R. Shen indicated to H.F.W.that his group also realized inconsistencies for the ethanol spectral assignment in aprevious paper [74]. He told H.F.W. that his group had measured the SFG-VS spectra
25 × 10−6
20
15
10
5
0
SF
G in
tens
ity (
a.u.
)
30002950290028502800 295029002850
Wavenumber (cm−1)
30002950290028502800
C1
C2
C3
C4
C5
C8
C7
C6
ssp ppp sps
Figure 11. SFG-VS spectra of vapour/n-normal alcohols (n ¼ 1 � 8) interfaces, with �1 ¼ 60� and �2 ¼ 55�
in co-propagating geometry. The baselines of the spectra were offset for viewing [43].
238 H.-F. Wang et al.
Dow
nloa
ded
by [
Nat
iona
l Sci
ence
Lib
rary
] at
18:
31 1
9 Ju
ly 2
012

of the vapor/1-alcohol interfaces in different polarizations since 2002. But his grouphad not done deuterated ethanol experiments, and full analysis of these data has yetto be finished.) This result indicates how polarization analysis along with the polariza-tion selection rules can help make correct assignment on the vibrational spectrum.In section 4.3, we shall discuss the ethanol vibrational spectrum further.
5 × 10⁻⁶
4
3
2
1
0
SFG
inte
nsity
(a.
u.)
3000295029002850
Wavenumber (cm−1)
CH3-Fermi
CH3-as
CH3-ss
CH2-ssCH2-as
CH2-Fermi
ssp ppp sps
1-heptanol
5 × 10⁻⁶
4
3
2
1
0
SFG
inte
nsity
(a.
u.)
30002950290028502800
Wavenumber (cm−1)
CH3-ss
CH2-ss
CH3-Fermi
CH3-as
CH2-Fermi
CH2-as
ssp ppp sps
1-octanol
Figure 12. SFG-VS spectra and assignments of CH vibrational modes of vapour/1-heptanol andvapour/1-octanol interfaces, with �1 ¼ 60� and �2 ¼ 55� in co-propagating geometry [43].
Table 4. Assignment of SFG-VS spectra of vapour/1-alcohol (n ¼ 1 � 8) interfaces. From [43].
Assignment CH2-ss CH3-ss CH2-as CH2-FR CH2-FR CH3-FR CH3-as(notation[137, 138]) (dþ) (rþ) (d�) (dþ)-FR (dþ)-FR (rþ)-FR (r�)polarization ssp ssp ppp & sps ssp ssp ssp ppp & sps
Methanol – 2828 – – – 2910, 2940 –Ethanol – 2868 – – – 2926 29701-Propanol 2850 2874 2908 (br) – – 2938 29601-Butanol 2850 2872 2898 (br) 2904 – 2938 29601-Pentanol 2850 2870 2890 (br) – 2918 2934 29601-Hexanol 2848 2868 2884 (br) 2904 2918, 2954 2932 29601-Heptanol 2848 2870 2884 (br) 2906 2918 2932 29601-Octanol 2846 2868 2884 (br) 2904 2918, 2954 2930 2960
br¼ broad peak.
Spectral and orientational analysis in surface SFG-VS 239
Dow
nloa
ded
by [
Nat
iona
l Sci
ence
Lib
rary
] at
18:
31 1
9 Ju
ly 2
012

The selection rules for the single CH stretching vibration can be useful in assignmentof SFG-VS spectra of protein interfaces, because all natural amino acid molecules,except for glycine, have a CH group. The CH group stretching mode is generallyhard to identify in IR and Raman spectroscopy [155, 156]. Extremely low temperature[137] and gaseous [148] Raman experiments with hydrocarbons containing –CHD– and–CHD2 groups have shown that the methine stretching is around 2900 cm�1. To ourknowledge, there is only one recent SFG-VS study on L-leucine at the air/water inter-face that presented a slight feature at 2902 cm�1 on the ssp spectra for the methinegroup [15, 157]. Using the polarization selection rules, a feature on the ssp and pppSFG-VS spectra of the vapour/2-propanol at 2914 cm�1 has been identified as theCH stretching vibration in the 2-propanol molecule [43]. We expect that with thepolarization selection rules and the ability to observe narrower peaks at the molecularinterfaces in SFG-VS, more observations of the CH stretching vibration will bereported on protein and bio-membrane interfaces.
It is worth noting that to apply the polarization selection rules, SFG-VS spectra inmore than one or two polarization combinations need to be measured for comparison.In the SFG-VS literature, systematic comparison of SFG-VS spectra in different polar-ization configurations has not been the norm for spectral assignment. The importanceof obtaining SFG-VS spectra with different incident angle sets has not been discussedand done. The analysis and examples with vapour/liquid interfaces illustrated here
2950290028502800
Wavenumber (cm−1)
20 × 10−6
15
10
5
0
SFG
inte
nsity
(a.
u.)
2950290028502800 30002950290028502800
ssp
ppp
sps
ssp
ppp
sps
ssp
ppp
sps
CD3CH2OH CH3CH2OHCH3CD2OH
CH3-ss, CH2-ss
CH3-Fermi
CH3-asCH3-ss
CH3-FermiCH3-as CH2-ss CH2-Fermi
Figure 13. SFG-VS spectra of vapour/ethanol interfaces, with �1 ¼ 628 and �2 ¼ 528 in co-propagatinggeometry. Solid lines are fitting curves. The baselines of ssp and ppp spectra are offset for viewing purpose.
240 H.-F. Wang et al.
Dow
nloa
ded
by [
Nat
iona
l Sci
ence
Lib
rary
] at
18:
31 1
9 Ju
ly 2
012

demonstrate that it is crucial to have SFG-VS measurement in different polarizationconfigurations for spectral assignment purpose. In some cases, spectra from differentincident angle sets also need to be compared. However, assignment of SFG-VSspectrum of complex molecular interface may still be difficult. It is hoped that moreknowledge can be gained through the polarization selection rules and detailedpolarization analysis and simulation.
We have shown in this section that with polarization selection rules, SFG-VS spectraobtained in different polarizations can be used to identify new spectral features, whichare not identified in IR and Raman studies. However, great caution has to be taken forthe new spectral features in SFG-VS spectra. Because SFG-VS is a sensitive interfaceprobe, spectral features can easily be detected from surface enrichment of the verydiluted surface active impurities or contaminates in the solution. Therefore, impurityand contamination may cause SFG-VS big problems. Bulk probes, such as IR andRaman spectroscopy, would not have this problem for small amounts of impurities.However, since the polarization selection rules provide a tool for in situ SFG-VSspectral assignment and analysis, together with knowledge from IR and Raman studies,these selection rules can provide direct symmetry properties analysis of the observedspectral features, and help identify whether these new spectral features are from theimpurity or are from the interfacial molecules under investigation.
Recently, a polarization mapping procedure based on the polarization analysismethod was proposed to mathematically reconstruct the small hidden features fromSFG-VS spectra in different polarizations [69]. Demonstration of differentiation ofsmall hidden non-electronically resonant chiral contributions to SFG-VS spectra indifferent polarizations of adsorbed fibrinogen molecules was also reported [158]. Theseapplications of polarization analysis to such high accuracy would certainly be excitingif confirmed by further examinations. Of course, the key to accurate polarizationanalysis nevertheless relies on the ability for effective polarization control in SFG-VSexperiment [24, 25, 77, 80, 87].
4.3. SFG-VS and its implications on IR and Raman vibrational spectroscopy
There are some general issues raised from SFG-VS spectral assignment on vibrationalspectroscopy in the condensed phase.
Vibrational spectral assignment is the first step for identification of molecular struc-tural and conformational properties, and also the starting point for dynamics studies onvibrational energy transfer (VET) as well as redistribution, and solute–solvent coupling[159]. From discussions in section 4.2, we have seen examples of the ambiguity andconfusion in IR and Raman assignments. As vibrational spectroscopy developedpurely for interface studies, SFG-VS has shown its ability and possibility to discerncomplex vibrational spectrum through the polarization selection rules based on molec-ular symmetry properties, and through more careful polarization spectral analysis.The vibrational spectral assignment of the ethylene glycol, ethanol molecules aresuch examples.
These developments may bring important consequences and broad implications invibrational spectroscopy and dynamics. For example, based on the assignment of the2968 cm�1 peak for the CH2-ssmode in ethanol [152, 153], the vibrational energy transfer
Spectral and orientational analysis in surface SFG-VS 241
Dow
nloa
ded
by [
Nat
iona
l Sci
ence
Lib
rary
] at
18:
31 1
9 Ju
ly 2
012
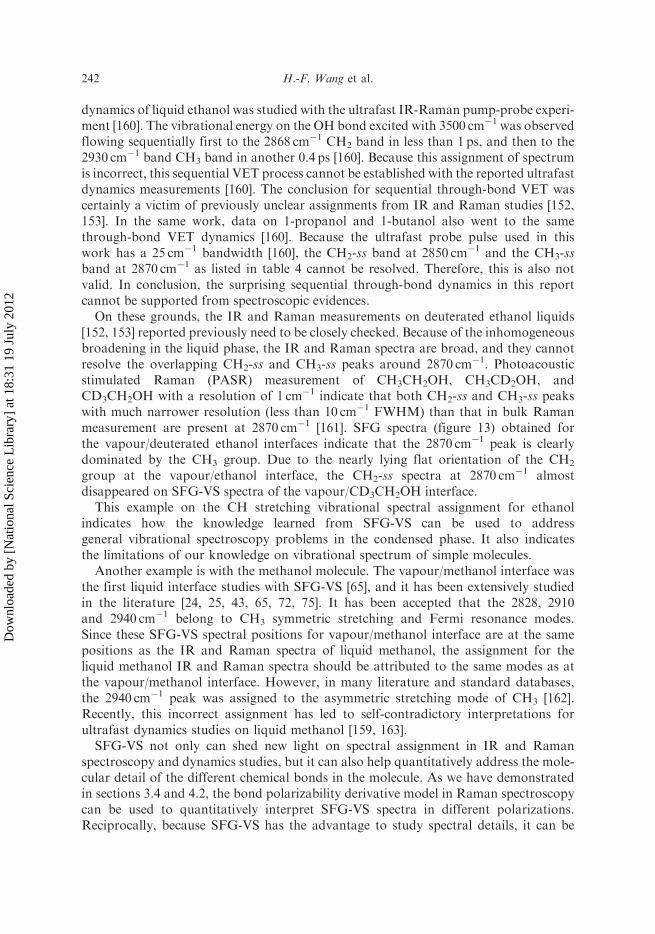
dynamics of liquid ethanol was studied with the ultrafast IR-Raman pump-probe experi-ment [160]. The vibrational energy on the OH bond excited with 3500 cm�1 was observedflowing sequentially first to the 2868 cm�1 CH2 band in less than 1 ps, and then to the2930 cm�1 band CH3 band in another 0.4 ps [160]. Because this assignment of spectrumis incorrect, this sequential VET process cannot be established with the reported ultrafastdynamics measurements [160]. The conclusion for sequential through-bond VET wascertainly a victim of previously unclear assignments from IR and Raman studies [152,153]. In the same work, data on 1-propanol and 1-butanol also went to the samethrough-bond VET dynamics [160]. Because the ultrafast probe pulse used in thiswork has a 25 cm�1 bandwidth [160], the CH2-ss band at 2850 cm�1 and the CH3-ssband at 2870 cm�1 as listed in table 4 cannot be resolved. Therefore, this is also notvalid. In conclusion, the surprising sequential through-bond dynamics in this reportcannot be supported from spectroscopic evidences.
On these grounds, the IR and Raman measurements on deuterated ethanol liquids[152, 153] reported previously need to be closely checked. Because of the inhomogeneousbroadening in the liquid phase, the IR and Raman spectra are broad, and they cannotresolve the overlapping CH2-ss and CH3-ss peaks around 2870 cm�1. Photoacousticstimulated Raman (PASR) measurement of CH3CH2OH, CH3CD2OH, andCD3CH2OH with a resolution of 1 cm�1 indicate that both CH2-ss and CH3-ss peakswith much narrower resolution (less than 10 cm�1 FWHM) than that in bulk Ramanmeasurement are present at 2870 cm�1 [161]. SFG spectra (figure 13) obtained forthe vapour/deuterated ethanol interfaces indicate that the 2870 cm�1 peak is clearlydominated by the CH3 group. Due to the nearly lying flat orientation of the CH2
group at the vapour/ethanol interface, the CH2-ss spectra at 2870 cm�1 almostdisappeared on SFG-VS spectra of the vapour/CD3CH2OH interface.
This example on the CH stretching vibrational spectral assignment for ethanolindicates how the knowledge learned from SFG-VS can be used to addressgeneral vibrational spectroscopy problems in the condensed phase. It also indicatesthe limitations of our knowledge on vibrational spectrum of simple molecules.
Another example is with the methanol molecule. The vapour/methanol interface wasthe first liquid interface studies with SFG-VS [65], and it has been extensively studiedin the literature [24, 25, 43, 65, 72, 75]. It has been accepted that the 2828, 2910and 2940 cm�1 belong to CH3 symmetric stretching and Fermi resonance modes.Since these SFG-VS spectral positions for vapour/methanol interface are at the samepositions as the IR and Raman spectra of liquid methanol, the assignment for theliquid methanol IR and Raman spectra should be attributed to the same modes as atthe vapour/methanol interface. However, in many literature and standard databases,the 2940 cm�1 peak was assigned to the asymmetric stretching mode of CH3 [162].Recently, this incorrect assignment has led to self-contradictory interpretations forultrafast dynamics studies on liquid methanol [159, 163].
SFG-VS not only can shed new light on spectral assignment in IR and Ramanspectroscopy and dynamics studies, but it can also help quantitatively address the mole-cular detail of the different chemical bonds in the molecule. As we have demonstratedin sections 3.4 and 4.2, the bond polarizability derivative model in Raman spectroscopycan be used to quantitatively interpret SFG-VS spectra in different polarizations.Reciprocally, because SFG-VS has the advantage to study spectral details, it can be
242 H.-F. Wang et al.
Dow
nloa
ded
by [
Nat
iona
l Sci
ence
Lib
rary
] at
18:
31 1
9 Ju
ly 2
012

used to obtain detailed information on the bond polarizability of the same chemical bondin different molecules or in different places in the same molecule. Because thevibrational spectra obtained with SFG-VS are usually narrower, and some of thepeaks may be suppressed in different polarizations, it has certain power to help resolveuncertain vibrational modes in IR and Raman spectroscopies in the condensed phase.We have shown here even with relatively very simple molecules, such as ethylene glycoland ethanol, there is ambiguity and confusion in their vibrational spectroscopy,which can be discerned with SFG-VS polarization analysis. In the meantime, with theabilities for detailed spectral assignment and quantitative polarization analysis ofSFG-VS spectrum as presented in this review, it is possible to employ it to investigatespectroscopy, structure, and dynamics at the complex molecular interfaces at themolecular and chemical bond level.
5. Summary
In summary, the ability to use SFG-VS for understanding of molecular interfacesdepends on the abilities to make detailed interpretation of SFG vibrational spectrum,and depends on our ability to analyse the polarization data in SFG-VS measurementsfor the orientational order parameters of the molecular interface. Through examples ofa series of vapour/neat liquid interfaces, this review focuses on the recent developmentsregarding the aspects on the ability of SFG-VS for quantitative polarization and orien-tational analysis, and polarization spectral analysis. The intensity of SFG-VS spectralpeaks depends on many parameters and factors, such as the experimental polarizationconfiguration, geometry of optical arrangements, the local field factors in the interfacelayer, symmetry properties of the molecular groups under investigation, and thehyperpolarizability tensor ratios. Therefore, depending on so many parameters, quan-titative analysis of SFG-VS data used to be a somewhat dreadful exercise. Detaileddiscussion on these parameters and factors helps us to develop optimized experimentalarrangements to assess the influences of each parameter and factor, to test the validityof models for local field factors in molecular layers and model for bond polarizabilityderivative, and to analyse the molecular symmetry through polarization data. Withbetter understanding of the determining parameters and factors on SFG-VS intensities,spectroscopic, structural, conformational information of the molecules in the interfacelayer can be quantitatively investigated.
We have discussed in detail the PNA method and the incident angle geometry foraccurate determination of the molecular orientational parameters in the molecularlayer. It is shown that the PNA method can be much more accurate than the PIRmethod. We have also shown that in doing PNA measurements in co-propagatinggeometry, the D value obtained is independent of the refractive indices and localfield factors in the molecular layer in IR wavelengths, which are usually not available.We then discussed the issues related to the local field factors in the molecular layer.
In order to examine and test the bond polarizability derivative model, generalexpressions of non-zero molecular hyperpolarizability tensors are given for C3v, C2v
and C1v molecular groups in Appendix B. The effectiveness and validity of themodel in quantitative SFG-VS analysis are tested with SFG-VS measurement
Spectral and orientational analysis in surface SFG-VS 243
Dow
nloa
ded
by [
Nat
iona
l Sci
ence
Lib
rary
] at
18:
31 1
9 Ju
ly 2
012

on vapour/neat liquid interfaces. It is demonstrated that with the bond polarizability
derivative model, detailed information on molecular bonds can be explained. Even
though the r or R values of a molecular group cannot be generally transferable,
clues can be found for similar r values of a certain C–H bond in similar chemical
environment, and the differences of r values can be generally compared.Polarization analysis of SFG-VS intensities from molecular groups with different
symmetries leads to a set of polarization selection rules or guidelines for assignment
of complex SFG-VS vibrational spectra. These selection rules enabled the spectral
assignment in SFG-VS to be in situ, i.e. with its own abilities, instead of being ex situ,
i.e. depending only on indirect knowledge from IR and Raman assignments. Of course,
knowledge from IR and Raman studies is nevertheless very helpful. The selection rules
developed here may need to be modified to some extent, but the concept to make in situ
SFG-VS spectral assignment will certainly advance the ability in SFG-VS for investiga-
tion of complex molecular interfaces. With these selection rules, explicit assignments of
SFG-VS spectra are achieved for a series of vapour/diol and vapour/normal alcohol
interfaces. Some ambiguity and confusion in the assignments of IR and Raman
spectrum in liquid phase is also addressed. Polarization selection rules and polarization
analysis in SFG-VS are essential steps for understanding of the vibrational
spectroscopy of complex molecular interfaces. Moreover, SFG-VS may also be used
to elucidate spectral ambiguity and confusion on spectral assignment where IR and
Raman may not work.In order to make effective quantitative orientational and spectral analysis, SFG-VS
experiments need to be performed in different polarizations, and some times with dif-
ferent incident angle geometries. In these measurement, accurate control of polarization
and incident angle is required [24, 25, 77, 80, 87]. The effectiveness of such polarization
analysis can only be tested with reliable experimental data on well defined model inter-
faces. Vapour/neat liquid interfaces are ideal model interfaces for such purposes.Even though SFG-VS measurements on different polarizations has been generally
practiced and the PIR method has been commonly used to study molecular orientation
at interfaces, systematic comparison of the polarization dependence of SFG-VS
spectrum has not been employed for SFG-VS spectral assignment until recently. The
incident angle geometry dependence of SFG-VS intensities has not been effectively
discussed in previous SFG-VS studies. We have shown that co-propagating incident
angle geometry can greatly simplify the quantitative analysis of SFG-VS data. And
the incident angle analysis can be used to resolve overlapped spectral peaks.As Shen et al. pointed out recently, SFG-VS is the only technique that can yield
a vibrational spectrum for molecules at a free liquid or liquid mixture interface [7].
With the development of quantitative orientational and spectral analysis in SFG-VS,
molecular interfaces, especially liquid interfaces, can be studied in great detail.
Recently, with accurate determination of the orientational parameters at the vapour/
methanol–water mixture and vapour/acetone–water mixture interfaces, a double
layered structure at these liquid interfaces was determined, and adsorption free energies
for the first and second layers were also determined [77, 78, 80]. The ideas, concepts,
and knowledge learned on the liquid interfaces at such detailed molecular level
can be used for understanding of other kinds of molecular interfaces, and it is equally
244 H.-F. Wang et al.
Dow
nloa
ded
by [
Nat
iona
l Sci
ence
Lib
rary
] at
18:
31 1
9 Ju
ly 2
012

important that the techniques and methodologies developed can find broad applica-tions to other molecular interfaces as well.
Acknowledgments
H.F.W. acknowledges support from the Chinese Academy of Sciences (the HundredTalent Program starting fund, 1999–2002), the Natural Science Foundation of China(NSFC No. 20274055, No. 20425309), and the Chinese Ministry of Science andTechnology (MOST No. G1999075305). We thank Wen-kai Zhang and Hui Wu forhelp with some derivations of the relationships in Appendix B. All SFG spectra wereobtained with the SFG spectrometer built by EKSPLA, Co. We thank the fine servicesprovided by the EKAPLA engineers. As neophytes in SFG-VS interface studies, wehave been trying to learn the ropes of the complicated SFG-VS technique. We aregreatly indebted to those who have laid the foundations and developed the key conceptson which advancements were made possible. H.F.W. thanks Kopin Liu for hissuggestion to prepare this work. H.F.W. also thanks K.B. Eisenthal, Hai-lung Dai,Ron Y. R. Shen, and Na Ji for their valuable discussions and encouragement.
Appendix
Appendix A: susceptibility tensors for molecular groupswith C3v, C2v, and C1v symmetry
According to Goldstein [47], there are 12, i.e. 2 3!, ways to make the Euler trans-formation between the molecular coordinates frame x0y0z0, or abc, and the laboratorycoordinates frame xyz. Here we use the Euler transformation defined in figure 14,one of the two popular definitions in describing problems in molecular spectroscopy[16, 33, 59, 67], and it has to be noted that inconsistencies should generally arise withthe and � terms if these different ways of Euler transformations are not carefully dis-tinguished and kept self-consistent. In our work, the Euler transformation matrix < is,
< ¼
cos cos�� cos � sin� sin � sin cos�� cos � sin� cos sin � sin�
cos sin�þ cos � cos� sin � sin sin�þ cos � cos� cos � sin � cos�
sin � sin sin � cos cos �
0B@
1CAð24Þ
as defined in
x
y
z
0B@
1CA ¼ <
x0
y0
z0
0B@
1CA ¼
Rxx0 Rxy0 Rxz0
Ryx0 Ryy0 Ryz0
Rzx0 Rzy0 Rzz0
0B@
1CA
x0
y0
z0
0B@
1CA: ð25Þ
The molecular fixed coordinates abc for the CH3 and CH2 are defined in figure 15.The expressions of the susceptibility tensors for C3v, C2v, and C1v symmetry groups
Spectral and orientational analysis in surface SFG-VS 245
Dow
nloa
ded
by [
Nat
iona
l Sci
ence
Lib
rary
] at
18:
31 1
9 Ju
ly 2
012

have been scattered in the literature, and in slightly different forms from eachother. Here we try to put them together in a consistent form for convenience infuture applications.
C3v symmetry group. There are 11 non-zero microscopic hyperpolarizability elementsfor C3v symmetry group, such as CH3, NH3, and SiH3 groups, etc. [36, 37, 68]. The firstthree terms are symmetric terms, and the last eight terms are asymmetric terms, corre-sponding to the symmetric stretching and asymmetric stretching modes, respectively:
�aac ¼ �bbc, �ccc
�aca ¼ �bcb, �caa ¼ �cbb
�aaa ¼ ��bba ¼ ��abb ¼ ��bab:
ð26Þ
When both the SF and visible frequencies are off resonance, one has �aca¼�bcb ¼ �caa¼ �cbb. Then for a rotationally isotropic interface, the seven non-zeromacroscopic elements of �ð2Þijk are obtained through integration over the two Eulerangles (� and ) as in the following [164, 165].
Figure 14. The Euler transformation between the laboratory coordinates xyz and the molecular coordinateabc (or x0y0z0) through three Euler angles (�, �, ).
c
b
aC
H1 H3
H2a
c
b
C
H1 H2
Figure 15. The definition of molecular fixed coordinates of CH3 and CH2.
246 H.-F. Wang et al.
Dow
nloa
ded
by [
Nat
iona
l Sci
ence
Lib
rary
] at
18:
31 1
9 Ju
ly 2
012

For the symmetric stretching (ss) vibrational mode,
�ð2Þ, ssxxz ¼ �ð2Þ, ssyyz ¼
1
2Ns�ccc ð1þ RÞ cos �h i � ð1� RÞ cos3 �
� �
�ð2Þ, ssxzx ¼ �ð2Þ, sszxx ¼ �
ð2Þ, ssyzy ¼ �
ð2Þ, sszyy ¼
1
2Ns�cccð1� RÞ cos �h i � cos3 �
� ��ð2Þ, sszzz ¼ Ns�ccc R cos �h i þ ð1� RÞ cos3 �
� �:
ð27Þ
For the asymmetric stretching (as) vibrational mode,
�ð2Þ, asxxz ¼ �ð2Þ, asyyz ¼ �Ns�aca hcos �i � cos3 �
� ��ð2Þ, asxzx ¼ �
ð2Þ, aszxx ¼ �
ð2Þ, asyzy ¼ �
ð2Þ, aszyy ¼ Ns�aca cos
3�
�ð2Þ, aszzz ¼ 2Ns�aca cos �h i � cos 3� � �
:
ð28Þ
Here the hyperpolarizability ratio is R ¼ �aac=�ccc ¼ �bbc=�ccc. R is different for themethyl group in different molecules, which can be explicitly determined from the inde-pendently measured Raman depolarization ratio [22, 38]. It has been indicated that Rhas to be in the range of about 1.66–4.0 for the methyl group [22, 36, 37, 72, 103], withR¼ 1.7 for methanol, R¼ 3.4 for ethanol and longer chain 1-alcohols, R¼ 1.9 foracetone, and R¼ 2.3 for DMSO [70, 72, 103, 105]. Actually, R can be smaller than 1.66in some cases, but it should be generally larger than 1 for C3v groups, as discussed inAppendix B. � is the tilt angle of the C3 axis from the surface normal, and the operatorh i denotes orientational ensemble average over different molecular orientations. It isnoted that the last four of the 11 non-zero hyperpolarizability elements for methylgroup vanishes in equation (27) and equation (28) due to the orientational ensembleaverage. It is also noted that the asymmetric susceptibility tensor terms for themethyl group are different from the corresponding terms for the asymmetric terms ofthe methylene group by a factor of 2 [26, 164, 165], instead of bearing the exactsame forms [86], unless the two fold degeneracy of the CH3-as mode is lifted.
It is to be noted that in some work, cos 3�, instead of cos3 �, is used in the aboveexpressions [131]. They are equivalent through the trigonometrical relationshipcos 3� ¼ 4 cos3 � � 3 cos �.
C2v symmetry group. For C2v symmetry groups, such as the CH2 group, there areseven non-vanishing molecular hyperpolarizability tensor elements [36, 37, 40, 68].The first three terms are symmetric (a1), and the last four terms are asymmetric(b1 and b2), corresponding to the symmetric stretching and asymmetric stretchingmodes of the CH2 group, respectively:
�aac, �bbc, �ccc, �aca ¼ �caa, �bcb ¼ �cbb: ð29Þ
Averaging over the Euler angle � for the rotationally isotropic interface, the sevennon-zero macroscopic �ð2Þijk elements are the following.
Spectral and orientational analysis in surface SFG-VS 247
Dow
nloa
ded
by [
Nat
iona
l Sci
ence
Lib
rary
] at
18:
31 1
9 Ju
ly 2
012
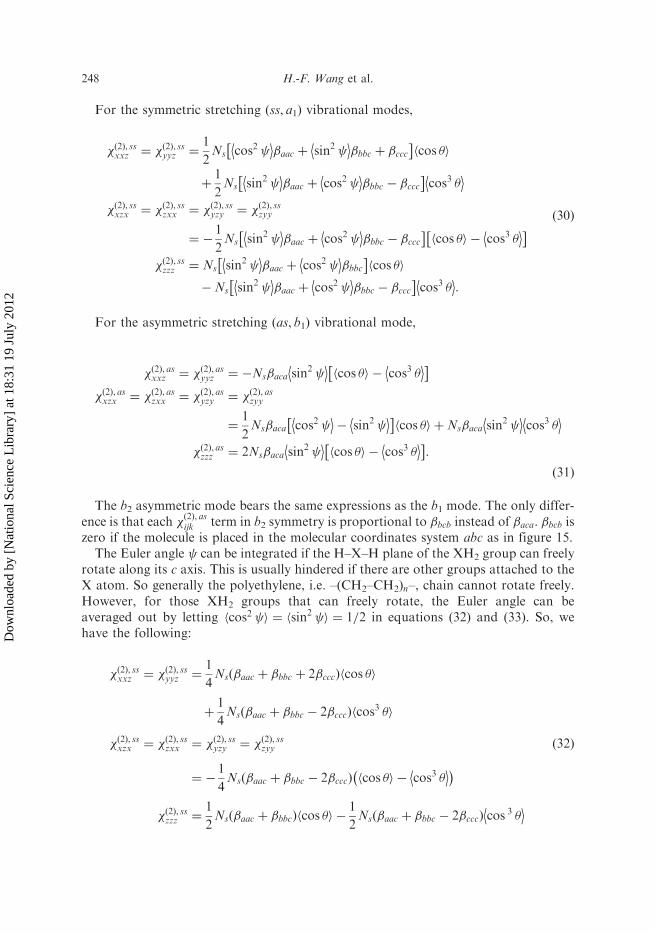
For the symmetric stretching (ss, a1) vibrational modes,
�ð2Þ, ssxxz ¼ �ð2Þ, ssyyz ¼
1
2Ns cos2
�aac þ sin2
�bbc þ �ccc
� �cos �h i
þ1
2Ns sin2
�aac þ cos2
�bbc � �ccc
� �cos3 �
�ð2Þ, ssxzx ¼ �ð2Þ, sszxx ¼ �
ð2Þ, ssyzy ¼ �
ð2Þ, sszyy
¼ �1
2Ns sin2
�aac þ cos2
�bbc � �ccc
� �cos �h i � cos3 �
� ��ð2Þ, sszzz ¼ Ns sin2
�aac þ cos2
�bbc
� �cos �h i
�Ns sin2
�aac þ cos2
�bbc � �ccc� �
cos3 �
:
ð30Þ
For the asymmetric stretching (as, b1) vibrational mode,
�ð2Þ, asxxz ¼ �ð2Þ, asyyz ¼ �Ns�aca sin
2
cos �h i � cos3 � � �
�ð2Þ, asxzx ¼ �ð2Þ, aszxx ¼ �
ð2Þ, asyzy ¼ �
ð2Þ, aszyy
¼1
2Ns�aca cos2
� sin2 � �
hcos �i þNs�aca sin2
cos3 �
�ð2Þ, aszzz ¼ 2Ns�aca sin2
cos �h i � cos3 �
� �:
ð31Þ
The b2 asymmetric mode bears the same expressions as the b1 mode. The only differ-ence is that each �ð2Þ, asijk term in b2 symmetry is proportional to �bcb instead of �aca. �bcb iszero if the molecule is placed in the molecular coordinates system abc as in figure 15.
The Euler angle can be integrated if the H–X–H plane of the XH2 group can freelyrotate along its c axis. This is usually hindered if there are other groups attached to theX atom. So generally the polyethylene, i.e. –(CH2–CH2)n–, chain cannot rotate freely.However, for those XH2 groups that can freely rotate, the Euler angle can beaveraged out by letting hcos2 i ¼ hsin2 i ¼ 1=2 in equations (32) and (33). So, wehave the following:
�ð2Þ, ssxxz ¼ �ð2Þ, ssyyz ¼
1
4Ns �aac þ �bbc þ 2�cccð Þhcos �i
þ1
4Ns �aac þ �bbc � 2�cccð Þhcos3 �i
�ð2Þ, ssxzx ¼ �ð2Þ, sszxx ¼ �
ð2Þ, ssyzy ¼ �
ð2Þ, sszyy
¼ �1
4Ns �aac þ �bbc � 2�cccð Þ hcos �i � cos3 �
� �
�ð2Þ, sszzz ¼1
2Ns �aac þ �bbcð Þhcos �i �
1
2Nsð�aac þ �bbc � 2�cccÞ cos
3 �
ð32Þ
248 H.-F. Wang et al.
Dow
nloa
ded
by [
Nat
iona
l Sci
ence
Lib
rary
] at
18:
31 1
9 Ju
ly 2
012

and the non-vanishing tensor elements for methylene asymmetric-stretching mode (as),
�ð2Þ, asxxz ¼ �ð2Þ, asyyz ¼ �
1
2Ns�aca hcos �i � cos3 �
� �
�ð2Þ, asxzx ¼ �ð2Þ, aszxx ¼ �
ð2Þ, asyzy ¼ �
ð2Þ, aszyy ¼
1
2Ns�aca cos
3 �
�ð2Þ, aszzz ¼ Ns�aca hcos �i � cos3 � � �
ð33Þ
For the CH2 group, there is a general relationship �aac þ �bbc � 2�ccc ¼ 0, as shownin Appendix B. Therefore, equation (32) can be greatly simplified for polarization spec-tral analysis [26]. Especially, this relationship makes �ð2Þ, ssxzx ¼�
ð2Þ, sszxx ¼ �
ð2Þ, ssyzy ¼�
ð2Þ, sszyy ¼ 0,
which means no ss vibrational mode spectra must be observed in the sps and pss polar-izations according to equation (32). However, if ss vibrational mode spectra forCH2 group can be observed in the sps and pss polarizations, the conclusion is thatthe twist angle cannot be rotationally averaged, and the analysis has to usedequations (30) and (31).
C1v symmetry group. The XH groups, such as single OH and CH bond, would haveC1v symmetry. The non-zero hyperpolarizability terms for a C1v group are allsymmetric [66, 102], i.e. �aac ¼ �bbc ¼ R�ccc, with the R value falling into the range0–0.28 for C–H, equal to its bond polarizability derivative ratio r [22, 37, 103].Generally, 0 r < 1 is for a single chemical bond. It is easy to show that the non-zero elements for C1v symmetry susceptibility tensors follow the same expressions asthose for the ss mode of the CH3 group in equation (27). However, as we haveshown in section 4, the different R values for the CH3 and CH groups should leadto quite different polarization selection rules for the two groups. The r value for thesingle O–H group is about 0.32 or less [102, 166], the treatment for the methinegroup here can be applied to the analysis to stretching mode of the O–H group, theC¼O group, and other molecular groups with C1v symmetry.
Appendix B: hyperpolarizability and Raman depolarization ratio
As we pointed out above, knowledge of the hyperpolarization ratios between different�i0j0k0 tensor elements is crucial for quantitative interpretation and polarization analysisof SFG-VS spectrum. Hirose and co-workers used a bond polarizability derivativemodel to derive expressions for non-zero hyperpolarizability tensor elements of theCH3 and CH2 groups from the single CH bond polarizability derivative with a C1v
symmetry, and the single bond polarizability derivative ratio r ¼ 0 =0�� ¼
0��=
0��, in
which �� is the molecular coordinates of the single CH bond with � as the CH bondaxis. The r value can be empirically obtained from the measured Raman depolarizationratio � through the bond polarizability derivative ratio [36, 37, 114].
In Hirose’s initial formulation of the bond polarizability derivative model [36], r¼ 0was assumed. However, the inadequacy of this assumption is apparent, because the CHsingle bond does have a polarizability and polarizability derivative perpendicular to the
Spectral and orientational analysis in surface SFG-VS 249
Dow
nloa
ded
by [
Nat
iona
l Sci
ence
Lib
rary
] at
18:
31 1
9 Ju
ly 2
012
bond axis direction [115]. Therefore, revisions [37, 114] were made by Hirose et al. [36],to incorporate the case for 0 r < 1. This revision should have been able to be reducedback to the initial expressions [36] if we let r¼ 0. However, careful examination indi-cated that the expressions given in both cases are not fully consistent with themselves[36, 37, 114]. This might be the reason that even though these seminal works byHirose et al. have been very popularly cited in the SFG-VS literature, concrete testof validity of the model cannot be found. We have carefully reexamined the derivations,checked the consistency, and tried to test its quantitative validity on interpretation ofSFG-VS spectral intensities with some cases as reviewed here.
A detailed bond polarizability derivative calculation has been conducted by Dr. XingWei in Prof. Y. R. Shen’s group for CH2 group with r¼ 0.14, and applied to SFG-VSstudy on the CH2 groups at a rubbed polyvinyl alcohol polymer surface [40, 41]. Ourexpressions for CH2 give exactly the same Ra and Rb ratios as them for the CH2
group when r¼ 0.14 is plugged in. This is one indication that the expressions we derivedshould be in the correct form. So we list these expressions of the hyperpolarizabilitytensors in terms of the bond polarizability derivative ratio below. The expressionsare all based on the seminal papers by Hirose et al. [36, 37, 114]. Even though theexpressions are derived for CHn groups, they can be readily used for groups with thesame molecular groups respectively.
It is to be noted that even though this approach has been called the bond polarizabil-ity derivative model, in order to derive the hyperpolarizability tensors, both the bondpolarizability derivative model (for Raman tensors) and bond moment derivativemodel (for IR bond moment) are actually used. The effectiveness of Hirose’s modelactually depends on the effectiveness of both models. Even though we have presentedsome good examples supporting the validity of Hirose’s model for quantitative analysisof SFG-VS spectra, further detailed examinations are still warranted.
CH group with C1v symmetry. For a single CH bond with C1v symmetry, r ¼0 =
0�� ¼
0��=
0��. Its three non-zero elements for the symmetric stretching mode are
�aac ¼ �bbc ¼ r�ccc
�ccc ¼ �1
2�0!CHGCH
@��@�
� �0
@�@�
� �0
¼GCH
!CH�0CH:
ð34Þ
Here !CH is the stretching frequency of the CH single bond; GCH ¼ 1=MC þ 1=MH isthe inverse effective mass of the CH bond; and �ccc ¼ GCH�
0CH=!CH is the hyperpolar-
izability constant for a single CH bond, as defined by Shen et al. [40, 41]. For theCH group, the molecular fixed coordinates ðabcÞ are equivalent to the single bond fixedcoordinates ð ��Þ. The single CH bond polarizability derivative ratio r can be obtainedfrom the Raman depolarization ratio �. Of course, only one of the two solutions inequation (35) which satisfies 0 r < 1 is physically acceptable for the single CH bond.
� ¼3�2
452 þ 4�2¼
3
4þ 5 ð1þ 2rÞ=ð1� rÞ½ �2: ð35Þ
250 H.-F. Wang et al.
Dow
nloa
ded
by [
Nat
iona
l Sci
ence
Lib
rary
] at
18:
31 1
9 Ju
ly 2
012

CH3 group with C3v symmetry. The definition of the molecule fixed coordinates forCH3 is shown in figure 15. With r as the single bond polarizability derivative ratio,the 11 non-zero molecular hyperpolarizability tensor elements for CH3 with a C3v
symmetry are listed as follows:
�aac ¼ �bbc ¼ �3
2
Gsym�0CH
!sð1þ rÞ � ð1� rÞ cos2 �� �
cos �
�ccc ¼ �3Gsym�
0CH
!srþ ð1� rÞ cos2 �� �
cos �
�bcb ¼ �cbb ¼ �caa ¼ �aca ¼ �3
2
Gdeg�0CH
!d1� rð Þ sin2 �cos �
�aaa ¼ ��bba ¼ ��abb ¼ ��bab ¼3
4
Gdeg�0CH
!d1� rð Þ sin3 �
ð36Þ
where � is the ffH–C–H bond angle for the CH3 group; Gsym ¼ ð1þ 2 cos �Þ=MCþ 1=MH
and Gdeg ¼ ð1� cos �Þ=MC þ 1=MH are the inverse effective mass for the symmetricand asymmetric normal modes, with MC and MH as the atomic masses of C and Hatoms, respectively. !s and !d are the vibrational frequency of the symmetric andasymmetric vibrational modes for CH3. These definitions are the same as given byHirose et al. [36, 37]. Then, one can have
R ¼�aac�ccc¼
1þ r� ð1� rÞ cos2 �
2 rþ ð1� rÞ cos2 �½ �ð37Þ
and then with equation (20), it is easy to show that
� ¼3�2
452 þ 4�2¼
3
4þ 20 1þ2rð1�rÞð1�3 cos2 �Þ
h i2 : ð38Þ
With equation (37), one can only get one solution for 0 r < 1. Therefore, the valuefor R calculated from equation (37) is unique. Because for CH3 the bond angle� ffi 109:58 and cos � ffi �1=3, with 0 r < 1 one can show that 4 � R > 1 [22].
For example, �¼ 0.014 [103] for the CH3 group in methanol, and so r¼ 0.28 andR¼ 1.67; while �¼ 0.053 [103] for the CH3 group in ethanol, so r¼ 0.026 andR¼ 3.4. It is clear that the r and R values for the CH3 group cannot be transferredbetween methanol and ethanol molecules.
It is interesting to note that �aca is proportional to 1� r. Therefore, the larger the r,the smaller the asymmetric intensity. Therefore, from equation (36), calculation usingthe r¼ 0.28 gives �aca=�ccc ¼ 1:0 and r¼ 0.026 gives �aca=�ccc ¼ 3:4. Since theSFG-VS intensity is proportional to ð�Þ2, this fact explains quantitatively why theSFG-VS peak of the asymmetric modes of CH3 group in interfacial methanol ismore than 10 times weaker than that of ethanol, as well as other long chain normalalcohols [43].
Spectral and orientational analysis in surface SFG-VS 251
Dow
nloa
ded
by [
Nat
iona
l Sci
ence
Lib
rary
] at
18:
31 1
9 Ju
ly 2
012

The ratio �CH3ccc =�
CHccc can be derived to compare the CH3 and CH SFG-VS spectral
intensities,
�CH3ccc
�CHccc
¼ �3Gsym!CH
!sGCHrþ ð1� rÞ cos2 �� �
cos �: ð39Þ
Given MC ¼ 12, MH ¼ 1, � ¼ 109:58, !CH ¼ 2920 cm�1, !CH3�ss ¼ 2870 cm�1, we havecos � ffi �1=3, and �CH3
ccc =�CHccc ¼ 0:107ð1þ 8rÞ.
CH2 with C2v symmetry. Definition of the molecule fixed coordinates for CH2 isshown in figure 15. Then the seven non-zero hyperpolarizability tensor elements ofCH2 with C2v symmetry are as follows:
�aac ¼Ga�
0CH
!a1ð1þ rÞ � ð1� rÞ cos �½ � cos
�
2
� �
�bbc ¼2Ga�
0CH
!a1r cos
�
2
� �
�ccc ¼Ga�
0CH
!a1ð1þ rÞ þ ð1� rÞ cos �½ � cos
�
2
� �
�aca ¼ �caa ¼Gb�
0CH
!b1ð1� rÞ sin �½ � sin
�
2
� �
�bcb ¼ �cbb ¼ 0
ð40Þ
where � is the ffH–C–H bond angle for the CH2 group; Ga ¼ ð1þ cos �Þ=MC þ 1=MH
and Gb ¼ ð1� cos �Þ=MC þ 1=MH are the inverse effective mass for the symmetric(a1) and asymmetric (b1) normal modes, with MC and MH as the atomic mass of Cand H atoms, respectively. !a1 and !b1 are the vibrational frequencies of the respectivemodes. Then one has
Ra ¼�aac�ccc¼
1þ r� ð1� rÞ cos �
1þ rþ ð1� rÞ cos �
Rb ¼�bbc�ccc¼
2r
1þ rþ ð1� rÞ cos �
R ¼Ra þ Rb
2¼�aac þ �bbc
2�ccc¼
1þ 3r� ð1� rÞ cos �
2 1þ rþ ð1� rÞ cos �½ �:
ð41Þ
Therefore, the Raman depolarization ratio can also be derived from equation (20)as follows:
� ¼3
4þ 20½ð1þ 2rÞ2=ð1� rÞ2ð1þ 3 cos2 �Þ�: ð42Þ
252 H.-F. Wang et al.
Dow
nloa
ded
by [
Nat
iona
l Sci
ence
Lib
rary
] at
18:
31 1
9 Ju
ly 2
012
Because for CH2 the bond angle � ffi 109:58 and cos � ffi �1=3, with 0 r < 1, onehas 2 � Ra ¼ ð2þ rÞ=ð1þ 2rÞ > 1, 1 > Rb ¼ 3r=ð1þ 2rÞ � 0, and R¼ 1. Therefore,with r¼ 0.14, Ra ¼ 1:67 and Rb ¼ 0:33. These are just the same ratios obtained byShen et al. [40, 41].
Another very important relationship is that R¼ 1 is generally true for CH2 group nomatter what r value is for the single bond. This relationship is determined by the factthat � ¼ 109:58. This indicates that �aac þ �bbc � 2�ccc ¼ 0 is generally true for theCH2 group. In the meantime, since for the water molecule � ¼ 104:58, one can showthat the �aac þ �bbc � 2�ccc value for the C2v water molecule has to be very small.This fact can be very useful in quantitative analysis of SFG-VS spectra of the interfacewater molecules.
It is interesting to note that �aca of C2v group is also proportional to 1� r. Therefore,the larger the r, the smaller the asymmetric SFG-VS intensity. This fact can be used tocompare SFG-VS spectral intensity of different CH2 groups in the molecular interfacelayer. A very good example is presented in section 3.4 for vapour/1,5-pentanediolinterface [26].
Finally, the ratio �CH2ccc =�
CHccc can be derived to compare the CH2 and CH SFG-VS
spectral intensities,
�CH3ccc
�CHccc¼
Ga!CH
!a1GCH½ð1þ rÞ þ ð1� rÞ cos �� cos
�
2
� �: ð43Þ
Given MC ¼ 12,MH ¼ 1, � ¼ 109:58, !CH ¼ 2920 cm�1, !CH3�ss ¼ 2850 cm�1, we havecos � ffi �1=3, and �CH2
ccc =�CHccc ¼ 0:384ð1þ 2rÞ:
References
[1] M. J. Shultz, C. Schnitzer, and S. Baldelli, Int. Rev. Phys. Chem. 19, 123 (2000).[2] V. Vogel and Y. R. Shen, Annu. Rev. Mater. Sci. 21, 515 (1991).[3] K. B. Eisenthal, Annu. Rev. Phys. Chem. 43, 627 (1992).[4] K. B. Eisenthal, Acc. Chem. Res. 26, 636 (1993).[5] Y. R. Shen, Nature 337, 519 (1989).[6] K. B. Eisenthal, Chem. Rev. 96, 1343 (1996).[7] P. B. Miranda and Y. R. Shen, J. Phys. Chem. B 103(17), 3292 (1999).[8] M. J. Shultz, S. Baldelli, C. Schnitzer, and D. Simonelli, J. Phys. Chem. B 106, 5313 (2002).[9] G. L. Richmond, Chem. Rev. 102, 2693 (2002).
[10] Y. R. Shen, Annu. Rev. Phys. Chem. 40, 327 (1989).[11] T. F. Heinz, Nonlinear Surface Electromagnetic Phenomena edited by H. E. Ponath and G. I. Stegman
(North-Holland, New York, 1994), pp. 353.[12] R. M. Corn and D. A. Higgins, Chem. Rev. 94, 107 (1994).[13] C. D. Bain, J. Chem. Soc. Faraday Trans. 91, 1281 (1995).[14] C. D. Bain and P. R. Greene, Curr. Opin. Coll. Int. Sci. 6, 313 (2001).[15] M. Buck and M. Himmelhaus, J. Vac. Sci. Technol. A 19, 2717 (2001).[16] J. I. Dadap and T. F. Heinz, Nonlinear optical spectroscopy of surfaces and interfaces, in Encyclopedia of
Chemical Physics and Physical Chemistry, edited by J. H. Morre and D. D. Spencer (Institute of Physics,Bristal, 2001), pp. 1089–1125.
[17] Z. Chen, Y. R. Shen, and G. A. Somorjai, Annu. Rev. Phys. Chem. 53, 437 (2002).[18] F. Vidal and A. Tadjeddine, Rep. Prog. Phys. 68, 1095 (2005).[19] X. Chen, M. L. Clarke, J. Wang, and Z. Chen, Int. J. Mod. Phys. B 19(4), 691 (2005).[20] G. A. Somorjai and G. Rupprechter, J. Phys. Chem. B 103, 1623 (1999).[21] G. A. Somorjai and Rupprechter, J. Chem. Educ. 75, 162 (1998).
Spectral and orientational analysis in surface SFG-VS 253
Dow
nloa
ded
by [
Nat
iona
l Sci
ence
Lib
rary
] at
18:
31 1
9 Ju
ly 2
012

[22] X. Zhuang, P. B. Miranda, D. Kim, and Y. R. Shen, Phys. Rev. B 59, 12632 (1999).[23] Y. Rao, Y. S. Tao, and H. F. Wang, J. Chem. Phys. 119, 5226 (2003).[24] R. Lu, W. Gan, and H. F. Wang, Chin. Sci. Bull. 48(20), 2183 (2003).[25] R. Lu, W. Gan, and H. F. Wang, Chin. Sci. Bull. 49(9), 899 (2004).[26] R. Lu, W. Gan, B. H. Wu, H. Chen, and H. F. Wang, J. Phys. Chem. B 108, 7297 (2004).[27] Ekspla Co., Vilnius, Lithuania. http://www.ekspla.com[28] L. J. Richter, T. P. Petralli-Mallow, and J. C. Stephenson, Opt. Lett. 23, 1594 (1998).[29] E. L. Hommel, G. Ma, and H. C. Allen, Ana. Sci. 17, 1 (2001).[30] A. W. Adamson, Physical Chemistry of Surfaces, 6th ed. (Wiley-Interscience, New York, 1991).[31] The Dynamics and Structure of the Liquid–Liquid Interface, Faraday Discussion Vol. 129 (2004).[32] Y. R. Shen, IEEE Journal on Selected Topics in Quantum Electronics 6, 1375 (2000).[33] Y. R. Shen, The Principles of Nonlinear Optics (Wiley-Interscience, New York, 1984).[34] P. Guyot-Sionnest, J. H. Hunt, and Y. R. Shen, Phys. Rev. Lett. 59, 1597 (1987).[35] J. H. Hunt, P. Guyot-Sionnest, and Y. R. Shen, in Laser Spectroscopy VIII, edited by W. Persson and
S. Svanberg (Springer, Berlin, 1987), pp. 253–266.[36] C. Hirose, N. Akamatsu, and K. Domen, J. Chem. Phys. 96, 997 (1992).[37] C. Hirose, H. Yamamoto, H. N. Akamatsu, and K. Domen, J. Phys. Chem. 97, 10064 (1993).[38] D. Zhang, J. Gutow, and K. B. Eisenthal, J. Phys. Chem. 98, 13729 (1994).[39] G. R. Bell, Z. X. Li, C. D. Bain, P. Fischer, and D. C. Duffy, J. Phys. Chem. B 102, 9461 (1998).[40] X. Wei, S. C. Hong, X. W. Zhuang, T. Goto, and Y. R. Shen, Phys. Rev. E 62, 5160 (2000).[41] X. Wei, PhD Dissertation (Department of Physics, University of California, Berkeley, 2000).[42] Y. R. Shen, private communication.[43] R. Lu, W. Gan, B. H. Wu, Z. Zhang, Y. Guo, and H. F. Wang, J. Phys. Chem. B 109, 14118 (2005).[44] N. Bloembergen and P. S. Pershan, Phys. Rev. 128, 606 (1962).[45] M. B. Feller, W. Chen, and Y. R. Shen, Phys. Rev. A 43, 6778 (1991).[46] C. Hirose, N. Akamatsu, and K. Domen, Appl. Spectro. 46, 1051 (1992).[47] H. Goldstein, Classical Mechanics (Addison-Wesley Publishing Company, Inc., Reeding, Massachusetts,
USA, 1980), p. 147.[48] C. D. Bain, P. B. Davies, T. H. Ong, R. N. Ward, and M. A. Brown, Langmuir 7, 1563 (1991).[49] T. H. Ong, P. B. Davies and C. D. Bain, Langmuir 9, 1836 (1993).[50] M. G. Brown, E. A. Raymond, H. C. Allen, L. F. Scatena, and G. L. Richmond, J. Phys. Chem. A 104,
10220 (2000).[51] R. Superfine, J. Y. Huang, and Y. R. Shen, Chem. Phys. Lett. 172, 303 (1990).[52] K. A. Briggman, J. C. Stephenson, W. E. Wallace, and L. J. Richter, J. Phys. Chem. B 105, 2785 (2001).[53] H. F. Wang, Chin. J. Chem. Phys. 17(3), 362 (2004).[54] G. J. Simpson and K. L. Rowlen, Anal. Chem. 72, 3399 (2000).[55] G. J. Simpson and K. L. Rowlen, Anal. Chem. 72, 3407 (2000).[56] G. J. Simpson and K. L. Rowlen, J. Am. Chem. Soc. 121, 2635 (1999).[57] G. J. Simpson, S. G. Westerbuhr, and K. L. Rowlen, Anal. Chem. 72, 887 (2000).[58] J. Wang, Z. Paszti, M. A. Even, and Z. Chen, J. Am. Chem. Soc. 124, 7016 (2002).[59] J. Michl and E. W. Thulstrup, Spectroscopy with Polarized Light (VCH Publishers, Inc, New York, 1995).[60] S. Jen, N. A. Clark, P. S. Pershan, and E. B. Priestley, J. Chem. Phys. 66, 4635 (1977).[61] A. Szabo, J. Chem. Phys. 72, 4620 (1980).[62] Y. R. Shen, Appl. Phys. B 68, 295 (1999).[63] X. Wei, S. C. Hong, A. I. Lvovsky, H. Hermann, and Y. R. Shen, J. Phys. Chem. B 104, 3349 (2000).[64] H. Hermann, A. I. Lvovsky, X. Wei, and Y. R. Shen, Phys. Rev. B 66, 205110 (2002).[65] R. Superfine, J. Y. Huang, and Y. R. Shen, Phys. Rev. Lett. 66(8), 1066 (1991).[66] R. P. Chin, J. Y. Huang, Y. R. Shen, T. J. Chuang, H. Seki, and M. Buck, Phys. Rev. B 45, 1522 (1992).[67] A. J. Moad, and G. J. Simpson, J. Phys. Chem. B 108, 3548 (2004).[68] P. Fischer and A. D. Buckingham, J. Opt. Soc. Am. B 15, 2951 (1998).[69] J. Wang, M. L. Clarke, and Z. Chen, Ana. Chem. 76, 2159 (2004).[70] Y. L. Yeh, C. Zhang, H. Held, A. M. Mebel, X. Wei, S. H. Lin, and Y. R. Shen, J. Chem. Phys. 114, 1837
(2001).[71] J. Kim, K. C. Chou, and G. A. Somorjai, J. Phys. Chem. B. 107, 1592 (2003).[72] K. Wolfrum, H. Graener, and A. Laubereau, Chem. Phys. Lett. 213, 41 (1993).[73] J. Y. Huang and M. H. Wu, Phys. Rev. E 50, 3737 (1994).[74] C. D. Stanners, Q. Du, R. P. Chin, P. Cremer, G. A. Somorjai, and Y. R. Shen, Chem. Phys. Letts.
232, 407 (1995).[75] G. Ma and H. C. Allen, J. Phys. Chem. B 107, 6343 (2003).[76] K. R. Wilson, R. D. Schaller, D. T. Co, R. J. Saykally, B. S. Rude, T. Catalano, and J. D. Bozek,
J. Chem. Phys. 117, 7738 (2002).
254 H.-F. Wang et al.
Dow
nloa
ded
by [
Nat
iona
l Sci
ence
Lib
rary
] at
18:
31 1
9 Ju
ly 2
012

[77] H. Chen, W. Gan, R. Lu, Y. Guo, and H. F. Wang, J. Phys. Chem. B 109, 8064 (2005).[78] H. Chen, PhD dissertation, Structure and Adsorption of Acetone and Methanol at Vapor/ Liquid
Interfaces by Sum Frequency Generation Vibrational Spectroscopy (Institute of Chemistry, theChinese Academy of Sciences, 2004). No. 200118003202812, Defence date: June 24, 2004.
[79] H. Chen, W. Gan, B. H. Wu, D. Wu, Z. Zhang, and H. F. Wang, Chem. Phys. Lett. 408, 284 (2005).[80] H. Chen, W. Gan, B. H. Wu, D. Wu, Y. Guo, and H. F. Wang, J. Phys. Chem. B 109,
8053 (2005).[81] Unppublished data.[82] T. F. Heinz, H. W. K. Tom, and Y. R. Shen, Phys. Rev. A 28, 1883 (1983).[83] T. G. Zhang, C. H. Zhang, and G. K. Wong, J. Opt. Soc. Am. B 7(6), 902 (1990).[84] Y. Tanaka, S. Lin, M. Aono, and T. Suzuki, Appl. Phys. B 68, 713 (1999).[85] S. Baldelli, N. Markovic, P. Ross, Y. R. Shen, and G. Somorjai, J. Phys. Chem. B 103, 8920 (1999).[86] J. Wang, C. Y. Chen, S. M. Buck, and Z. Chen, J. Phys. Chem. B 105, 12118 (2001).[87] W. Gan, B. H. Wu, H. Chen, Y. Guo, and H. F. Wang, Chem. Phys. Lett. 406, 467 (2005).[88] G. R. Bell, C. D. Bain, and R. N. Ward, J. Chem. Soc. Faraday Trans. 92, 515 (1996).[89] R. Braun, B. D. Casson, and C. D. Bain, Chem. Phys. Lett. 245, 326 (1995).[90] J. A. Ekhoff and K. L. Rowlen, Ana. Chem. 74, 5954 (2002).[91] P. X. Ye and Y. R. Shen, Phys. Rev. B 28, 4288 (1983); with a small correction in, ibid, 30, 6202 (1984).[92] G. Cnossen, K. E. Drabe, and D. A. Wiersma, J. Phys. Chem. 97, 4512 (1992).[93] Z. Xu, W. Y. Lu, and P. W. Bohn, J. Phys. Chem. 99, 7154 (1995).[94] B. D. Casson and C. D. Bain, Langmuir 13, 5465 (1997).[95] D. Roy, Phys. Rev. B 61, 13283 (2000).[96] R. W. Munn, J. Chem. Phys. 97, 4532 (1992).[97] M. in het Panhuis and R. W. Munn, J. Chem. Phys. 112, 6763 (2000).[98] M. in het Panhuis and R. W. Munn, J. Chem. Phys. 113, 10685 (2000).[99] M. in het Panhuis and R. W. Munn, J. Chem. Phys. 113, 10691 (2000).
[100] J. N. Israelachvili, Intermolecular and Surface Forces, 2nd ed. (Academic Press, London, 1991), p. 80.[101] Unpublished data.[102] Q. Du, R. Superfine, E. Freysz, and Y. R. Shen, Phys. Rev. Lett. 70, 2313 (1993).[103] M. J. Colles and J. E. Griffiths, J. Chem. Phys. 56, 3384 (1972).[104] D. A. Long, The Raman Effect: A Unified Treatment of the Theory of Raman Scattering by Molecules
(John Wiley and Sons, Chichester, 2002).[105] H. C. Allen, D. E. Gragson, and G. L. Richmond, J. Phys. Chem. B 103, 660 (1999).[106] V. Pouthier, C. Ramseyer, and C. Girardet, J. Chem. Phys. 108, 6502 (1998).[107] D. Simonelli and M. J. Shultz, J. Chem. Phys. 112, 6804 (2000).[108] Y. Saito, T. Ishibashi, and H. Hamaguchi, J. Raman. Spectrosc. 31, 725 (2000).[109] K. Miyano, J. Chem. Phys. 69, 4807 (1978).[110] L. G. P. Dalmolen and W. H. de Jeu, J. Chem. Phys. 78, 7353 (1983).[111] S. Y. Yakovenko, M. Maiwald, A. Wurflinger, and J. Pelzl, Liq. Crys. 26, 23 (1999).[112] J. L. McHale,Molecular Spectroscopy (Prentice Hall, Inc., Upper Saddle River, NJ, USA, 1999), p. 280.[113] M. Oh-e, H. Yokoyama, and S. Baldelli, Appl. Phys. Lett. 84, 4965 (2004).[114] Hirose, C., A manuscript in Japanese on SFG theory and detailed derivations of the bond
polarizbility expressions. Some revisions were made from the published papers of the author [36, 37].Full text available at http://comp.ims.ac.jp/hirose.html
[115] K. M. Gough, J. Chem. Phys. 91, 2424 (1989).[116] D. A. Long, Proc. Roy. Soc. London Ser. A 217, 203 (1952).[117] D. A. Long and A. G. Thomas, Proc. Roy. Soc. London Ser. A 223, 130 (1954).[118] D. A. Long, A. H. S. Matterson, and L. A. Woodward, Proc. Roy. Soc. London Ser. A 224, 33 (1954).[119] D. A. Long, D. C. Milner, and A. G. Thomas, Proc. Roy. Soc. London Ser. A 237, 197 (1956).[120] D. A. Long, T. V. Spencer, D. N. Waters, and L. A. Woodward, Proc. Roy. Soc. London Ser. A 240, 499
(1957).[121] M. Gussoni, in Advances in Infrared and Raman Spectroscopy, edited by R. J. H. Clark and R. E. Hester
(Heyden and Son, London, 1980), Vol. 6, Chapter 2.[122] R. G. Snyder, A. L. Aljibury, H. L. Strauss, H. L. Casal, K. M. Gough, and W. F. Murphy,
J. Chem. Phys. 81, 5352 (1984).[123] K. M. Gough and W. F. Murphy, J. Chem. Phys. 85, 4290 (1986).[124] K. M. Gough and W. F. Murphy, J. Chem. Phys. 87, 1509 (1987).[125] K. M. Gough and W. F. Murphy, J. Chem. Phys. 87, 3332 (1987).[126] K. M. Gough and W. F. Murphy, J. Chem. Phys. 87, 3341 (1987).[127] K. M. Gough and J. R. Dwyer, J. Phys. Chem. A 102, 2723 (1998).[128] H. C. Allen, E. A. Raymond, and G. L. Richmond, Curr. Opin. Coll. Inter. Sci. 5, 74 (2000).
Spectral and orientational analysis in surface SFG-VS 255
Dow
nloa
ded
by [
Nat
iona
l Sci
ence
Lib
rary
] at
18:
31 1
9 Ju
ly 2
012

[129] J. Y. Huang, R. Superfine, and Y. R. Shen, Phys. Rev. A 42, 3660 (1990).[130] M. R. Watry and G. L. Richmond, J. Phys. Chem. B 106, 12517 (2002).[131] S. R. Goates, D. A. Schofield, and C. D. Bain, Langmuir 15, 1400 (1999).[132] R. N. Ward, D. C. Duffy, P. B. Davies, and C. N. Bain, J. Phys. Chem. 98, 8536 (1998).[133] D. Zimdars, J. I. Dadap, K. B. Eisenthal, and T. F. Heinz, J. Phys. Chem. B 103, 3425 (1999).[134] D. Zimdars and K. B. Eisenthal, J. Phys. Chem. A 103, 10567 (1999).[135] G. Herzberg, Molecular Spectra and Molecular Structure II: Infrared and Raman Spectra of Polyatomic
Molecules (D. Van Nostrand Company, Inc., Princeton, 1945), Chapter V.[136] R. G. Snyder and J. R. Scherer, J. Chem. Phys. 71, 3221 (1979).[137] P. A. MacPhail, H. L. Strauss, R. G. Snyder, and C. A. Elliger, J. Phys. Chem. 88, 334 (1984).[138] R. G. Snyder, S. L. Hsu, and S. Krimm, Spectrochim. Acta A 34, 395 (1978).[139] R. A. MacPhail, R. G. Snyder, and H. L. Strauss, J. Chem. Phys. 77(3), 1118 (1982).[140] Selected Raman Spectral Data, edited by L. B. Beach (Thermodynamic Reseach Center Hydrocarbon
Project Publications, College Station, Texas, 1983), Ser. No. 807, 653, 55.[141] E. L. Hommel, J. K. Merle, G. Ma, C. M. Hadad, and H. C. Allen, J. Phys. Chem. B 109, 811 (2005).[142] M. Saß, M. Lettenberger, and A. Laubereau, Chem. Phys. Lett. 356, 284 (2002).[143] L. Dreesen, C. Humbert, Y. Sartenaer, Y. Caudano, C. Volcke, A. A. Mani, A. Peremans, and
P. A. Thiry, Langmuir 20, 7201 (2004).[144] C. Bilger and B. Pettinger, Chem. Phys. Letts. 294, 425 (1998).[145] L. J. Bellamy, The Infrared Spectra of Complex Molecules (Chapman and Hall, London, 1975).[146] A. Weber, Raman Spectroscopy of Gases and Liquid (Springer-Verlag, Berlin, 1979).[147] N. B. Colthup, L. H. Daly, and S. E. Wiberley, Introduction to Infrared and Raman spectroscopy
(Academic Press, Inc., San Diego, 1990).[148] R. G. Snyder, A. L. Aljibury, H. L. Strauss, H. L. Casal, and W. F. Murphy, J. Chem. Phys. 81, 5352
(1984).[149] R. G. Snyder, H. L. Strauss, and C. A. Elliger, J. Phys. Chem. 86, 5145 (1982).[150] M. G. Brown, E. A. Raymond, H. C. Allen, L. F. Scatena, and G. L. Richmond, J. Phys. Chem. B
104, 10220 (2000).[151] A. G. Lambert, D. J. Neivandt, A. M. Briggs, E. W. Usadi, and P. B. Davies, J. Phys. Chem. B 106, 5461
(2002).[152] J. P. Perchard and M. L. Josien, J. Chim. Phys. 65, 1834 (1968).[153] J. P. Perchard and M. L. Josien, J. Chim. Phys. 65, 1856 (1968).[154] J. Sung, K. Park, and D. Kim, J. Korean Phys. Soc. 44(6), 1394 (2004).[155] J. J. Fox and A. E. Martin, Proc. Roy. Soc. A 175, 208 (1940).[156] A. Pozefsky and N. D. Coggeshall, Anal. Chem. 23(11), 1611 (1951).[157] N. Ji and Y. R. Shen, J. Chem. Phys. 120(15), 7107 (2004).[158] J. Wang, X. Y. Chen, M. L. Clarke, and Z. Chen, Proc. Nat. Acd. Sci. 102, 4978 (2005).[159] D. D. Dlott, Chem. Phys. 266, 149 (2001).[160] Z. H. Wang, A. Pakoulev, and D. D. Dlott, Science 296, 2201 (2002).[161] Unpublished data, in collaboration with Professor Shi-lin Liu at Department of Chemical Physics,
University of Science and Technology of China.[162] T. Shimanouchi, Tables of Molecular Vibrational Frequencies Consolidated, (National Bureau of
Standards, 1972), Vol. I, pp. 1–160. Also in the NIST Chemistry Webbook Database at http://webbook.nist.gov
[163] L. K. Iwaki and D. D. Dlott, J. Phys. Chem. A 104, 9101 (2000).[164] N. Akamatsu, K. Domen, and C. Hirose, J. Phys. Chem. 97, 10070 (1993).[165] C. Y. Wang, H. Groenzin, and M. J. Shultz, J. Phys. Chem. B 108, 265 (2004).[166] W. F. Murphy, Mol. Phys. 36, 727 (1978).
256 H.-F. Wang et al.
Dow
nloa
ded
by [
Nat
iona
l Sci
ence
Lib
rary
] at
18:
31 1
9 Ju
ly 2
012
View publication statsView publication stats