MARKET EFFICIENCY ANALYSIS OF JATROPHA VALUE … · MARKET EFFICIENCY ANALYSIS OF JATROPHA VALUE...
133
MARKET EFFICIENCY ANALYSIS OF JATROPHA VALUE CHAIN: CASE STUDY OF MONDULI AND ARUMERU DISTRICTS BY PENDO-EDNA MAHOO A DISSERTATION SUBMITTED IN PARTIAL FULLFILLMENT OF THE REQUIREMENT FOR THE DEGREE OF MASTER OF SCIENCE IN AGRICULTURAL ECONOMICS OF THE SOKOINE UNIVERSITY OF AGRICULTURE. MOROGORO, TANZANIA. 2011
Transcript of MARKET EFFICIENCY ANALYSIS OF JATROPHA VALUE … · MARKET EFFICIENCY ANALYSIS OF JATROPHA VALUE...

MARKET EFFICIENCY ANALYSIS OF JATROPHA VALUE CHAIN:
CASE STUDY OF MONDULI AND ARUMERU DISTRICTS
BY
PENDO-EDNA MAHOO
A DISSERTATION SUBMITTED IN PARTIAL FULLFILLMENT OF THE
REQUIREMENT FOR THE DEGREE OF MASTER OF SCIENCE IN
AGRICULTURAL ECONOMICS OF THE SOKOINE UNIVERSITY OF
AGRICULTURE. MOROGORO, TANZANIA.
2011
ii
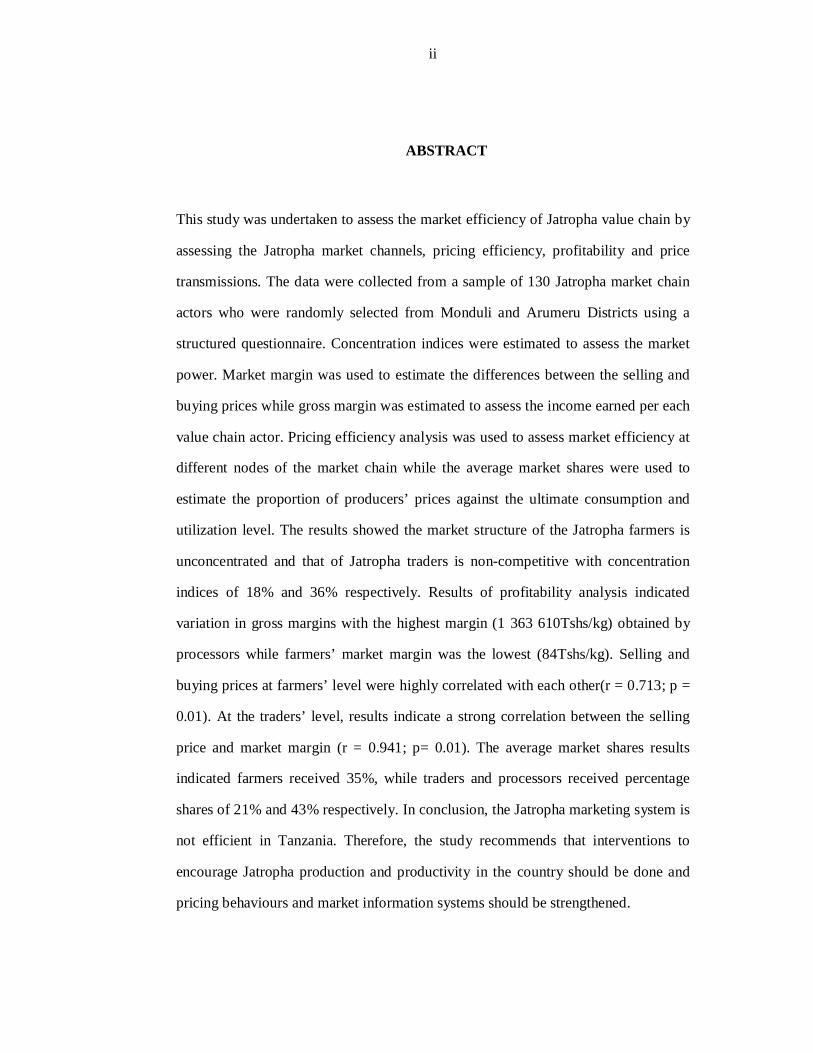
ABSTRACT
This study was undertaken to assess the market efficiency of Jatropha value chain by
assessing the Jatropha market channels, pricing efficiency, profitability and price
transmissions. The data were collected from a sample of 130 Jatropha market chain
actors who were randomly selected from Monduli and Arumeru Districts using a
structured questionnaire. Concentration indices were estimated to assess the market
power. Market margin was used to estimate the differences between the selling and
buying prices while gross margin was estimated to assess the income earned per each
value chain actor. Pricing efficiency analysis was used to assess market efficiency at
different nodes of the market chain while the average market shares were used to
estimate the proportion of producers’ prices against the ultimate consumption and
utilization level. The results showed the market structure of the Jatropha farmers is
unconcentrated and that of Jatropha traders is non-competitive with concentration
indices of 18% and 36% respectively. Results of profitability analysis indicated
variation in gross margins with the highest margin (1 363 610Tshs/kg) obtained by
processors while farmers’ market margin was the lowest (84Tshs/kg). Selling and
buying prices at farmers’ level were highly correlated with each other(r = 0.713; p =
0.01). At the traders’ level, results indicate a strong correlation between the selling
price and market margin (r = 0.941; p= 0.01). The average market shares results
indicated farmers received 35%, while traders and processors received percentage
shares of 21% and 43% respectively. In conclusion, the Jatropha marketing system is
not efficient in Tanzania. Therefore, the study recommends that interventions to
encourage Jatropha production and productivity in the country should be done and
pricing behaviours and market information systems should be strengthened.

iii
DECLARATION
I, Pendo-Edna Mahoo, do hereby declare to the Senate of Sokoine University of
Agriculture that this research dissertation is the result of my own original work and
that it has neither been submitted nor being concurrently submitted for degree award
in any other institution.
Pendo-Edna Mahoo
(MSc Candidate)
Date
The above declaration is confirmed
Dr. K. D. S. Mutabazi
(Supervisor)
Date

iv
COPYRIGHT
No part of this dissertation may be reproduced, stored in any retrieval system or
transmitted in any form or by any means without prior written permission of the
author or Sokoine University of Agriculture in that behalf.

v
ACKNOWLEDGEMENTS
First and foremost I would like to thank my GOD the almighty for making my
studies and my academic years at Sokoine University of Agriculture (SUA) possible.
Several people provided support to me during the two years of my study at SUA and
it is hard to mention them all lest I forget some. Therefore, I would like to register a
general thank to all for the support. However, the following people and institutions
deserve a special mention.
My sincere thanks should go to my supervisors Dr. Khamaldin Mutabazi of Sokoine
University of Agriculture and Mr. Justus Von Geibler of Wuppertal Institute
Germany for their tireless efforts and constructive comments during the preparation
of this dissertation. I feel privileged to have the opportunity to work under them.
I also convey my heartfelt thanks to the Biofuel Evaluation for Technological
Tanzanian Efficiency using Renewable-integrated Strategies (BETTER-iS) project
and the World Agro-forestry Centre (ICRAF) for funding the research work and all
the costs in the production of this dissertation. I would also like to acknowledge the
contribution of all my respondents from Monduli and Arumeru Districts. Thank you
so much for sharing with me your experience on Jatropha. Special thanks should go
to the following people: Zobida, Moses, Ernest, Bruno, Paul and Maria who helped
me during the time of data collection in the field. The driver Mr. Hamad Salum did a
wonderful job during the fieldwork.

vi
I owe much gratitude to my parents Henry and Nadhael Mahoo, my brother Fatael,
my two sisters Irene and Monica and my best friend Tulamwona Dumulinyi for their
love, prayers, support and encouragement. Words cannot express how grateful iam.
Last but not least, I would like to acknowledge the support of my fellow students of
MSc Agricultural Economics (2009/2011). Thank you for your friendship.

vii
DEDICATION
This work is dedicated to my beloved parents, Prof. Henry Fatael Mahoo and Mrs.
Nadhael Henry Mahoo who laid the foundation for my education. I love you so much
and God bless you.

viii
TABLE OF CONTENTS
ABSTRACT ........................................................................................................... ii
DECLARATION .................................................................................................. iii
ACKNOWLEDGEMENTS ....................................................................................v
DEDICATION ..................................................................................................... vii
TABLE OF CONTENTS .................................................................................... viii
LIST OF TABLES .............................................................................................. xiii
LIST OF FIGURES .............................................................................................. xv
LIST OF APPENDICES ......................................................................................xvi
LIST OF PLATES ............................................................................................. xvii
LIST OF ABBREVIATIONS AND SYMBOLS .............................................. xviii
CHAPTER ONE .....................................................................................................1
1.0 INTRODUCTION .......................................................................................1
1.1 Background Information ................................................................................ 1
1.2 Uses of Jatropha ............................................................................................ 2
1.2.1 Jatropha planted as hedge .......................................................................2
1.2.2 Jatropha for oil and fuel production.........................................................3
1.2.3 Soaps and medicinal purpose ..................................................................4
1.2.4 Press cake as organic fertilizer and combustible ......................................4
1.2.5 Other uses of Jatropha .............................................................................4
1.3 Problem Statement and Justification .............................................................. 4

ix
1.4 Objectives ..................................................................................................... 6
1.4.1 General objective ....................................................................................6
1.4.2 Specific objectives ..................................................................................7
1.5 Hypotheses .................................................................................................... 7
1.6 Research Questions ....................................................................................... 7
1.7 Conceptual Framework .................................................................................. 8
1.8 Organization of the Dissertation .................................................................. 10
CHAPTER TWO .................................................................................................. 11
2.0 LITERATURE REVIEW ......................................................................... 11
2.1 Definition of Terms and Concepts ............................................................... 11
2.1.1 Marketing ............................................................................................. 11
2.1.2 Agricultural marketing .......................................................................... 11
2.1.3 Market chain, value chain and supply chain analysis ............................. 12
2.1.4 Marketing channels ............................................................................... 15
2.2 Jatropha Production and Marketing Performance ......................................... 16
2.2.1 Jatropha production and marketing in Africa ......................................... 16
2.2.2 Jatropha production and marketing in Tanzania .................................... 17
2.3 The Market Efficiency ................................................................................. 19
2.4 Marketing Costs .......................................................................................... 21
2.5 Market Margins ........................................................................................... 22
2.6 Price Transmission ...................................................................................... 22
2.7 Review of Analytical Techniques in Marketing Efficiency Analysis ............ 23
2.7.1 Market channel baseline analysis .......................................................... 24
2.7.2 Concentration ratio ............................................................................... 24
x
2.7.3 Regression analysis ............................................................................... 26
2.7.4 Market margin analysis ......................................................................... 28
2.7.5 Gross margin analysis ........................................................................... 28
CHAPTER THREE .............................................................................................. 30
3.0 RESEARCH METHODOLOGY.............................................................. 30
3.1 Description of the Study Area ...................................................................... 30
3.1.1 Geographical location ........................................................................... 30
3.1.2 Land area and administrative units ........................................................ 30
3.1.3 Demography ......................................................................................... 32
3.1.4 Economic activities ............................................................................... 32
3.2 Research Design .......................................................................................... 33
3.3 Sampling of Jatropha Market Practitioners .................................................. 33
3.3.1 Sampling of Jatropha farmers ............................................................... 34
3.3.2 Sampling of Jatropha traders ................................................................. 34
3.3.3 Sampling of Jatropha processors ........................................................... 35
3.3.4 Sampling of Jatropha consumers ........................................................... 35
3.4 Data Collection Methods ............................................................................. 35
3.4.1 Primary data collection ......................................................................... 36
3.4.2 Secondary data ..................................................................................... 36
3.5 Pre-testing of the Questionnaire ................................................................... 36
3.6 Data Processing and Analysis ...................................................................... 36
3.6.1 Jatropha marketing channels and the marketing power among the actors
………………………………………………………………………..37
3.6.1.1 Analysis of Jatropha marketing channels ...................................... 37

xi
3.6.1.2 Analysis of marketing power among the actors ............................ 38
3.6.2 The pricing efficiency of the Jatropha marketing chain ......................... 38
3.6.3 Gross and market margins of Jatropha value chain actors ...................... 39
3.6.4 Price transmission from the producer to ultimate consumption and
utilization ............................................................................................. 41
3.7 Limitations of the Study .............................................................................. 42
CHAPTER FOUR................................................................................................. 44
4.0 RESULTS AND DISCUSSION ................................................................ 44
4.1 The Market Channels for Jatropha and Marketing Power among the actors.. 44
4.1.1 The Jatropha market channels ............................................................... 44
4.1.2 Farmers ................................................................................................ 44
4.1.2.1 Link between farmers and the traders ........................................... 47
4.1.2.2 Link between farmers and the processors ..................................... 47
4.1.3 Traders ................................................................................................. 47
4.1.4 Processing companies and consumers ................................................... 49
4.2 The Market Concentration Ratios for Farmers and Traders .......................... 52
4.3 Marketing Efficiency of the Jatropha Value Chain ....................................... 54
4.3.1 Gross margin analysis ........................................................................... 54
4.3.2 Marketing cost and margin analysis ...................................................... 55
4.3.2.1 Marketing cost and margin of farmers ......................................... 56
4.3.2.2 Marketing cost and margin of traders ........................................... 57
4.4.2.3 Marketing cost and margin of processors ..................................... 57
4.3.3 Interface pricing efficiency analysis ...................................................... 59
4.3.4 Price transmission for Jatropha products ............................................... 61
xii
4.4 Socio-economic characteristics of respondents ............................................ 62
4.4.1 Age of respondents ............................................................................... 62
4.4.2 Education level of respondents.............................................................. 63
4.4.3 Gender of respondents .......................................................................... 64
4.4.4 Main source of income......................................................................... 65
4.4.5 Housing structure of respondents .......................................................... 66
4.4.6 Description of Jatropha production and marketing system in the study
area ....................................................................................................... 67
4.4.6.1 Jatropha production ...................................................................... 67
4.4.6.2 Production constraints .................................................................. 68
4.4.6.3 Jatropha marketing ....................................................................... 69
4.4.6.4 Marketing constraints ................................................................... 70
CHAPTER FIVE .................................................................................................. 71
5.0 CONCLUSIONS AND RECOMMENDATIONS .................................... 71
5.1 Conclusions ................................................................................................. 71
5.2 Recommendations ....................................................................................... 73
5.2.1 Strengthening and promoting groups of actors in the Jatropha
marketing……….. ................................................................................ 73
5.2.2 Formulation of policies guiding Jatropha marketing .............................. 74
5.2.3 Strengthening the pricing behaviours and market information system ... 75
5.2.4 Intervention to increase Jatropha production and productivity ............... 75
REFERENCES ..................................................................................................... 77
APPENDICES ....................................................................................................... 90

xiii
LIST OF TABLES
Table 1: Area (ha) under Jatropha cultivation in Tanzania ................................ 18
Table 2: Detailed sample structure by sample area ........................................... 34
Table 3: Major companies buying Jatropha seeds from farmers ........................ 46
Table 4: Places where farmers meet their buyers .............................................. 46
Table 5: Categories of traders ........................................................................... 47
Table 6: Major buyers of Jatropha seeds among traders .................................... 48
Table 7: Major companies buying Jatropha seeds among traders ...................... 48
Table 8: Major forms of Jatropha products produced by processors .................. 49
Table 9: Major buyers of Jatropha products produced by processors................. 50
Table 10: Preferences for buying Jatropha products............................................ 50
Table 11: Concentration indexes for farmers and traders .................................... 53
Table 12: Gross margins for Jatropha farmers, traders and processors ................ 55
Table 13: Marketing cost and margin of farmers ................................................ 56
Table 14: Marketing cost and margin of traders .................................................. 57
Table 15: Marketing cost and margin of processors ............................................ 58
Table 16: Farmers and traders: correlation between market margin, buying price
and selling prices. ............................................................................... 60
Table 17: Average market shares received by various market participants .......... 62
Table 18: Age of the respondents ....................................................................... 63
Table 19: Education level of the respondents ...................................................... 64
Table 20: Gender of the respondents ................................................................. 65
Table 21: Main income sources of respondents. ................................................. 66

xiv
Table 22: Housing structure of the farmers. ........................................................ 66
Table 23: Main marketing problems facing Jatropha traders and processors ....... 70

xv
LIST OF FIGURES
Figure 1: Conceptual framework for Jatropha market efficiency .......................... 9
Figure 2: Location of the study areas ................................................................. 31
Figure 3: Major buyers of Jatropha seeds ........................................................... 46
Figure 4: The Jatropha market channel .............................................................. 51
Figure 5: Other crops grown by the farmers ....................................................... 68
Figure 6: Main production constraints facing Jatropha farmers .......................... 68
Figure 7: Percent of traders selling other crops apart from Jatropha ................... 69
xvi
LIST OF APPENDICES
Appendix 1: Gross margins for Jatropha farmers and traders .................................. 90
Appendix 2: Gross margins for Jatropha processors. ............................................... 91
Appendix 3: Farmers questionnaire ........................................................................ 92
Appendix 4: Traders questionnaire ....................................................................... 100
Appendix 6: Jatropha seed processors questionnaire ............................................. 105
Appendix 7: Consumers questionnaire .................................................................. 112

xvii
LIST OF PLATES
Plate 1: Jatropha trees used as hedge around the farm in Engaruka village......... 3
Plate 2: Jatropha trees intercropped with vanilla. JPTL, Arusha. ........................ 5
Plate 3: Jatropha trees intercropped with potatoes. JPTL, Arusha. ...................... 5

xviii
LIST OF ABBREVIATIONS AND SYMBOLS
% Percentage
< Less than
> Greater than
APT Asymmetric Price Transmission
ARI-MONDULI Alternative Resources Income project for Monduli women
C° Degree Centigrade
e.g. For example
Eqn Equation
FAO Food and Agriculture Organization of the United Nations
GM Gross Margin Analysis
GTZ Gemeinschaft für Technische Zusammenarbeit (German
Technical Cooperation)
Ha Hectare
JCL Jatropha Curcas Linnaceus
JPTL Jatropha Products Tanzania Ltd
KAKUTE Kampuni ya Kusambaza Teknolojia
KAMA KAMA Herbal Product Limited
Kg Kilogram
LARRI Land Rights Research and Resource Institute
MCBA Market Channel Baseline Analysis
MEM Ministry of Energy and Minerals
MMA Match Makers Associates

xix
n Number
OLIT OXFAM Livelihood Initiative for Tanzania
p Probability
SNAL Sokoine National of Agricultural Library
SPSS Statistical Package for Social Science
SVO’s Straight Vegetable Oils
TaTEDO Tanzania Traditional Energy and Environmental Development
Organization
Tshs Tanzanian shillings
1
CHAPTER ONE
1.0 INTRODUCTION
1.1 Background Information
The global energy supply is currently mainly based on fossil fuels, which have many
disadvantages including global warming and pollution. It is now widely agreed that
more sustainable alternative energy sources will need to be developed. One
potentially promising option is biofuels, since these are derived from biomass, have a
closed carbon cycle and do not contribute to the greenhouse effect (Eijck and
Romijn, 2008).
Biofuel refers to renewable energy produced from biomass, such as organic materials
like plants, fruits or seeds (Alain et al., 2011). It can also be referred to as fuels
derived from biological sources (Von Lampe, 2006). Biofuels come in various forms
and the biomass necessary for the production of biofuels can be derived from several
sources. However, oil-producing crops are prominent. The use of biofuels has long
been promoted as a feasible substitute for conventional fossil petrol and diesel fuels.
Historical records indicate that the inventor of the diesel engine, used biofuel in the
form of vegetable oil in his engine as early as 1900 (Prakash,1998; Shumaker et al.,
2003; CRFA, 2006).
A number of plant species have been considered as dedicated energy crops
(Lewandowski et al., 2003; Walsh et al., 2003; Angelini et al., 2005). These plants
represent both annual and perennial herbaceous crops and short rotation trees.
2
Jatropha Curcas Linnaeus (JCL) is among them. Other crops include palm trees,
maize, and sugarcane. Apart from well adaptation to semi-arid conditions and often
used for soil erosion, Jatropha curcas linnaeus species have been reported to have
wide commercial applications such as oil and fuel production used for electricity
(Gubitz et al., 1999).
Jatropha or physic nut is a shrub or a small tree belonging to the genus
Euphorbiaceae. The plant is drought resistant and easy to establish. It can live up to
50 years and can produce seeds up to three times per annum (Chachage, 2003).
Experts have found that production of Jatropha seeds involves less necessary
working steps and investments. This provides more applications to rural households
compared to sugar/starchy crops which incorporate a number of production activities.
Jatropha seeds are widely used in oil and fuel production (Eijck and Romijn, 2008).
The plant is widely seen to have potential to help combat the greenhouse effect, stop
soil erosion, create additional income for rural poor and provide a major source of
energy both locally and internationally (Eijck, 2006).
1.2 Uses of Jatropha
Jatropha has multiple uses. It can be used as a hedge and for erosion control, produce
oil and fuel, produce soap and medicines and press cake is used as organic fertilizer
and combustible. These are briefly discussed in the following sub-sections.
1.2.1 Jatropha planted as hedge
Traditionally Jatropha has been used as a hedge and markers for graves. Jatropha is
widely cultivated as a living fence around settlements and fields (Plate 1). Cattle do
not browse the plant and it can easily be propagated by cuttings, hence densely
planted for this purpose (Robinson and Beckerlegge, 2008).

3
Plate 1: Jatropha trees used as hedge around the farm in Engaruka village
1.2.2 Jatropha for oil and fuel production
The most interesting uses of Jatropha lie in oil production when the seeds are pressed
and the oil is extracted. The common oils and fuels from Jatropha include Straight
Vegetable Oils (SVO) and biodiesel. The use of Jatropha oil as a fuel is high
especially where many people have seen its an extraordinary potential. First, because
of the limitation of the world’s fossil fuel resources and secondly, because the use of
Jatropha biodiesel is CO2-neutral and therefore does not enhance global warming like
fossil diesel. In rural households, lamps that use Jatropha oil for lighting have been
developed and are being used (Amani, 2006). In addition stoves have been
introduced on a large scale (Henning, 1998).The big potential market however, is in
fuel for combustion engines. Jatropha oil can be used in diesel engines if its high
viscosity is reduced. This can be done in three ways: preheating, mixing with other
fuels and conversion to biodiesel.

4
1.2.3 Soaps and medicinal purpose
Many parts of the Jatropha plant are used in traditional medicine. The seeds are
pressed and the oil is used to produce medicinal soap for local markets. The oil has a
strong purgative action and it is also used to treat skin diseases and to soothe pain
such as that caused by rheumatism. A decoction of leaves is used against cough and
as an antiseptic.
1.2.4 Press cake as organic fertilizer and combustible
Contrary to many sources, Jatropha is not a nitrogen-fixing plant. The press cake
however, is saturated with nitrogen-fixing compounds thus making it a good organic
fertilizer. The press cake has nitrogen content similar to chicken manure and richer
than cow dung.
1.2.5 Other uses of Jatropha
Because of its drought resistance, Jatropha can play a role in combating
desertification and in soil erosion control. In a few places in western Tanzania, it is
used as a support plant for vanilla and also provides a better ground for potatoes
production (Plate 2 and 3). Jatropha wood can also be used as a burning material but
is of poor quality because it is very light (density is below 0.35 t/m3).However, the
fruit hulls, seed shells and press cake can be used as a burning material (Robinson
and Beckerlegge, 2008).
1.3 Problem Statement and Justification
The rush towards biofuel production among foreign investors in Tanzania has created
serious problems for the Government to coordinate and guide such production. In
many countries including Tanzania, investors are on the ground without the existence

5
Plate 2: Jatropha trees intercropped with Plate 3: Jatropha trees intercropped with vanilla JPTL, Arusha potatoes JPTL, Arusha.
of policies and guidelines for such production as well as the marketing for such
products. In Tanzania, Jatropha small-scale farmers could benefit because of the new
agricultural markets by integrating them into biofuel value chains either for local or
international markets (Janssen, 2006; Hazel et al., 2007).
Despite the positive impact made from Jatropha production as an alternative source
of energy and income generation for rural poor (Heller, 1996; Eijck and Romijn,
2008), the marketing chain for Jatropha is still operating poorly. Among the
constraints contributing to this include: i) low technology for processing seeds into
oil which causes the market for Jatropha oil to be very small at the moment and
cause the biodiesel produced from Jatropha seeds on a larger scale to be a dream of
the future, ii) there is also very limited experience with large scale marketing of
biofuels derived from Jatropha to date (Lyewe, 2008; GEXSI, 2007), iii) financial
problems also prevail, for example; there are very few commercial financial
institutions for small scale biofuel producers to obtain credits, to facilitate the

6
marketing activities. Other problems include poor infrastructure (such as roads).
High transaction costs would also cause the marketing chain of Jatropha to operate
poorly; this will deny smallholders the potential market benefits in the Jatropha
subsector.
Some studies have been conducted on Jatropha in Tanzania (Chachage, 2003;
Lyewe, 2008; Eijck, 2006; Loos, 2009). However, most of these studies were limited
to Jatropha production and technical efficiency, farm size, prospects for Jatropha
biofuel `and socio-economic impact of Jatropha on Tanzania smallholder farmers.
None has provided any systematic or adequate information on the existing Jatropha
marketing chain, its efficiency and marketing characteristics.
Based on the afore-said, there is a need of addressing the existing knowledge gaps,
especially on how the existing Jatropha markets in Tanzania perform, what factors
lead to inefficiency in Jatropha marketing and how they can be reduced. Therefore,
this study was carried out in order to contribute towards these knowledge gaps in
order to provide basis for formulating Jatropha marketing policies which will
stimulate efficient marketing systems for Jatropha on a large scale.
1.4 Objectives
1.4.1 General objective
The overall objective of this study was to assess the market efficiency of Jatropha
value chain in Monduli and Arumeru Districts in Northern Tanzania.

7
1.4.2 Specific objectives
1. To assess the Jatropha marketing channels and the marketing power among
the actors.
2. To determine the pricing efficiency of the Jatropha marketing chain.
3. To analyse the market margins and gross margins of the Jatropha farmers,
traders and processors.
4. To analyse the price transmissions from the producer to ultimate consumption
and utilization.
1.5 Hypotheses
The study is guided by the following research hypotheses
1. The organizational and distribution relationships among Jatropha market
actors along the value chain are not a single market channel.
2. The price variation in one market is not associated with other market.
3. Farmers receive the lowest market margins and gross margins compared to
traders and processors.
1.6 Research Questions
1. What is the relationship between concentration and market power?
2. How efficient is the market chain in terms of pricing and margins received by
different actors?
3. What are the prevailing prices, market margins and gross margins for
different actors along the chain?
4. How quickly are farm prices transmitted to the consumer level and vice
versa?

8
1.7 Conceptual Framework
The conceptual framework is shown in Fig. 1. Several components were considered
in the analysis of Jatropha market efficiency. The first component was the pricing
efficiency and followed by the operational efficiency. The Jatropha pricing efficiency
was examined in terms of variables such as prices and margins. Other factors
included how the Jatropha produces were differentiated from one actor to another
and the competition that exists in the market and the market barriers.
The higher the correlation of prices between pairs of markets for a particular product,
the better integrated the markets are for that crop and hence the more efficient they
are operating in terms of price. Operational efficiency was analyzed by calculating
the margins after the costs incurred during the marketing activities. The higher the
market margins the more efficient the market operation. Another aspect examined
was the market chain and information transparency in order to trace the movement of
Jatropha from the point of production to the point of consumption and utilization by
determining the concentration index and market barriers.
The relationship among these factors was based on the fact that structural
characteristics tend to influence behavioural characteristics of the market
participants. This implies that their number and shares can influence pricing aspects.
Barriers to entry can also reduce potential entrants in the market and hence increase
the bigger shares to few participants which in turn increase their market power and
eventually affect the performance as well as efficiency of a competitive market.

9
Figure 1: Conceptual framework for Jatropha market efficiency
Marketing costs Storage cost Transport cost Tech. innovation Processing cost Physical losses
Marketing Margins Weighted average
Pricing efficiency Product
differentiation Barriers to
entry/leave market
Price relation to form, space and time
Marketing costs
Operational efficiency
Technical
efficiency
Input used
Output
produced
Technology
innovations
Marketing efficiency

10
The market efficiency would induce high prices paid to farmers which encourage
high productivity and production and overall output. Farmers’ and traders’ profit will
increase due to reduced operational costs and minimized market losses induced by
improved market efficiency and structures. Better marketing structures and
competition reduce prices and encourage an increase in marketable Jatropha products
and hence increase consumers’ savings. Finally, Jatropha market will be efficient
with tangible benefits to market actors including consumers.
1.8 Organization of the Dissertation
The dissertation is organized into five chapters. Chapter one covers the introduction
which includes the problem statement and justification and objectives. Chapter two
presents the literature review, while chapter three provides the conceptual
framework, methodology and analytical tools employed in the study. Chapter four
presents the major findings and discussion of the results. The conclusions and
recommendations are presented in the chapter five.

11
CHAPTER TWO
2.0 LITERATURE REVIEW
2.1 Definition of Terms and Concepts
2.1.1 Marketing
Marketing is a process that involves planning and executing ideas from production,
pricing, meeting people (customers) through distribution, and promotion of ideas,
goods and services to create and maintain exchange that satisfy individuals,
organization and meet societal objectives in the systematic situation of global
environment (Czinkota et al., 1997). According to (Kotler, 2008) marketing is also
defined as an activity, set of institutions, and processes of creating, communicating,
delivering, and exchanging goods and services that have value for customers, clients,
partners, and society at large. It generates the strategy that underlies sales techniques,
business communication, and business developments; therefore, it is an integrated
process through which companies build strong customer relationships and create
value for their customers and for themselves.
2.1.2 Agricultural marketing
Agricultural marketing refers to all activities essentially associated with agricultural
production and with food, feed and fibers assembly, processing and distribution to
the final consumers. It also includes analysis of consumer’s needs, motivation,
purchasing and consumption behaviour (Ashimogo, 1994).

12
Besides the physical facilitating function of transferring the goods from producers to
consumers, marketing systems also perform the functions of identifying the prices at
different stages of marketing and send back price signals in the marketing chain
(Ebbeden, 2004). Therefore the issues and concerns in marketing relate mainly to the
efficiency of the marketing system which depends on the structure and conduct of the
market (Acharya, 2006). An efficient marketing system helps in the optimization of
resource use, output management, increase in farmer’s income, widening the market,
growth of agro-based industry and addition to national employment creation (Coulter
and Onumah, 2001).
2.1.3 Market chain, value chain and supply chain analysis
i) Market chain analysis
According to FAO (2005), market chain is defined as a process of following a
product from production to consumer, by looking at all points of the chain, prices in
and out of each point, functions performed by each point, market demand and supply
(trends), market constraints and analyzing the market opportunities for the particular
product. Harahap (2003), also defined market chain analysis as a way of gaining
insight into the (1) operations of specific market channels while focusing on their
growth potential, (2) activities and efficiency of actors along the chain, (3) business
support services involved, and (4) policy and regulatory frameworks. Using the
information from the analysis, opportunities and constraints can be identified within
specific market chains, and ways can be seen to improve a defined client's capacity to
compete more effectively.

13
Lundy et al. (2004) clearly stated that a market chain is used to describe the
numerous links that connect all the actors and transactions involved in the movement
of agricultural goods from the farm to the consumer. It means agricultural goods and
products flow up the chain and money flows down the chain.
ii) Value chain analysis
A similar terminology to market chain is value chain. The term value chain has been
used for more than twenty years. It refers to a full range of activities needed to bring
a product or a service from conception, through production and delivery to final
consumers.
Value chain is defined differently by different authors. Kaplinsky and Morris (2000)
defined value chain as “a full range of activities which are required to bring products
and services from conception, through different phases of production (involving a
combination of physical transformation and the input of various producer services),
delivery to the final disposal after use”. A value chain can be viewed as the way in
which a firm develops competitive advantages and creates shareholder value. It can
also demonstrate the interrelationships and dynamics between individual businesses.
A narrow economic-based definition of value chains involves identifying the critical
value-generating activities performed by an organization. A broader system approach
looks at the activities implemented by various actors, from primary producers,
harvesters, processors, traders, service providers, and upstream suppliers to the
downstream customers.

14
Value chain analyses encompass issues such as organizational, coordination, power
relationship between actors, linkages, and governance aspects. The value chain
approach has been a very useful analytical tool for taking a more objective look at an
organization’s position in a market. It allows for examining the consequence of
empowering one group (for example the producer) and identifying how to link them
to importers and consumers. It enables analysis of the implications of who does what,
at which stage in the chain, and what this means for risk, capital needed and margins.
It can help to identify with whom to form partnership in the chain (Ingram, 2009).
iii) Supply chain analysis
Supply chain analysis refers to the overall group of economic agents or a physical
person (such as a farmer, trader or consumer) as well as legal entities (such as
business, an authority or a development organization) that contribute directly to the
determination of a final product. Thus the chain encompasses the complete sequence
of operations which starts from raw material or an intermediate product and finishes
downstream, after several stages of transformation/ value addition of one or several
final products at the level of the consumer (FAO, 2005).
Supply chain can also be defined as i) a network of retail, distribution and storage
facilities supply that participate in the sale, delivery and production of a particular
product, and ii) the flow of goods or services from the raw material, intermediate
products to final products through processes that are performed by firms that are
owned by various actors who are linked in trade and services, each adds value to the
product.

15
According to FAO (2005), the supply chain analysis involves working across
multiple enterprises or companies to shorten the supply chain in time so as to deliver
the goods and services to consumers. It mainly involves the following: reducing
inventories, improving forecasting, improving scheduling and planning, and increase
returns. The ultimate goal of the chain is to facilitate an increase in efficiency and
thereby, increase the total generated value and competitiveness of the intended actors
to increase their shares of the total general income.
2.1.4 Marketing channels
According to Giles (1973), the term ‘channels of distribution’ or market channels
refer to the system of marketing institutions through which goods or services are
transferred from the original producers to the ultimate users or consumers. Most
frequently a physical product transfer is involved, but sometimes an intermediate
marketing institution may take title to goods without actually handling them.
Kohls and Uhl (1990), cited by DucHai (2003) defined marketing channels as the
alternative routes of product flows from producers to consumers. According to Kohls
and Uhl (1990), marketing channel starts at the farm-gate and ends at the consumer’s
front door. The marketing channel approach focuses on firm’s selling strategies to
satisfy consumer preferences.
According to Kotler (2003) marketing channels is a set of interdependent
organizations involved in the process of making a product or services available for
use or consumption. Most producers do not sell their goods directly to the final users.
Between them stands a set of intermediaries performing a variety of functions. These

16
intermediaries constitute a marketing channel also called a trader channel or
distribution channel. Kotler (2005) also defined market channels as a set of
independent organizations involved in the process of making a product or service
available for use or consumption by consumers or business their products while the
middlemen seeks to earn the greatest profit. A good marketing system has to
reconcile with all these points. Few producers sell their goods directly to the final
users. However, most producers use intermediaries to bring their products to the
market. Intermediaries reduce the amount of work that must be done by both
producers and consumers. In effect, consumers need the highest produce value at the
lowest possible price; farmers want the highest possible returns from users.
2.2 Jatropha Production and Marketing Performance
2.2.1 Jatropha production and marketing in Africa
Biomass is an important source of energy for the majority of the population in
developing countries (Agarwal, 1986). In sub-Saharan Africa (excluding South
Africa), it accounts for about 73% of the total energy consumption. In Burkina Faso,
Ethiopia, Malawi, Rwanda, Somalia, Tanzania and Uganda, biomass accounts for
more than 80% of the total energy consumption. Only a few countries, such as
Zimbabwe, Seychelles and Mauritius, depend on biomass fuels for less than 50% of
total energy consumption (Agarwal, 1986).
The recent policy developments towards biofuel production focusing on bioenergy
and liquid biofuels in particular have been on the political agenda of many African
countries. A large group of African ministers signed the statement on renewable in
Nairobi in the year 2004, which calls for the promotion of sustainable production of

17
biomass and its efficient use in all sectors and enhancing the development of
renewable energy sources (GEXSI, 2007). Then in 2007, the first “High-level
Biofuels Seminar in Africa” was held in Addis Ababa, Ethiopia. The seminar
concluded with the adoption of the “Addis Ababa Declaration on Sustainable
Biofuels Development in Africa” and an Action Plan (Conliffe and Kulovesi, 2008).
The Action Plan encompasses the development of ethanol, biodiesel, biogas, biomass
gasification, and cogeneration as priority sectors, and contains a number of cross-
cutting programme areas, including policy and institutional frameworks, financing
mechanisms, resource assessments, capacity building and strengthening technical
expertise. Both conferences represent official statements confirming that a large
number of African countries are willing to promote bioenergy in general and liquid
biofuels in particular. Despite political willingness, biofuel production and marketing
in Africa is still at an infant stage (Conliffe and Kulovesi, 2008).
2.2.2 Jatropha production and marketing in Tanzania
Biofuel production from Jatropha has recently attracted a great deal of attention in
Tanzania. A survey of the emerging Jatropha biofuels sector conducted in March-
June 2005 in Tanzania revealed a number of recently-started Jatropha experiments
(Eijck and Romijn, 2008; Caniels and Romijn, 2008). From these studies there is a
general feeling that Tanzania has a large potential for Jatropha cultivation. One of the
reasons is due to the existing high number of projects compared to other South and
East African countries as shown in Table 1.

18
Table 1: Area (ha) under Jatropha cultivation in Tanzania
Year Expert estimate (Ha)
Projects identified (Ha)
2008/09 11 714 17640 2010 34 286 69870 2015(Projections) 116 000 620 110 Source: GEXSI, 2008.
LARRRI and OLIT (2008) claimed that being located in a region with several net oil
importers places, Tanzania is in a unique position to be the regional major supplier.
The high population growth (2 to 6 times higher) parallel with a rapidly expanding
industrial production growth rate of countries in this sub-region, are pointed out as
other advantages. Tanzania is therefore ideally placed to become among leaders in
biofuel production globally. This is due to factors such as i) ideal geographic and
climatic conditions, ii) availability of land: (about 88 million hectares of suitable
agricultural land, of which less than 6% is utilised, iii) Abundant water resources: 3
large lakes, rivers offering irrigation schemes iv) Sufficient ground work conducted:
a study has been carried out by GTZ and a Task Force established v) Presence of and
interest among local business entities.
According to LARRRI and OLIT (2008), the Government of Tanzania has explicitly
recognized the importance and need to develop alternative fuels such as biofuels. In
the absence of an appropriate system to coordinate development of biofuels in
Tanzania, a mechanism to ensure a shared understanding and setting a framework for
the development of National Biofuel Platform in Tanzania was then put in place.
Therefore, in March 2006 the Government decided to establish the National Biofuel
Task Force with the primary task of formulating and preparing an enabling
19
environment to facilitate the development (promotion and utilization) of biofuels in
Tanzania through putting up the required regulatory frame work.
2.3 The Market Efficiency
An efficient market is one which is capable of moving a product from producers to
consumers at lowest cost consistent with the provision of services that consumers
demand (Scarborough and Kydd, 1992). It is assumed that an efficient marketing
system is a vital means of raising income levels to both farmers and traders engaging
in production and trading (Pickney, 1993). If the market is efficient it will increase
market surplus, and induce regional and inter-regional trade, which increase the
profitability of farming and trading in a short as well as long term period (Amani,
1992).
According to Raju and Von Oppen (1982), before formulating any policies, it is
necessary to find out the degree to which the existing value chain can be “efficient”
and also to identify and quantify the impact of relevant factors that determine
efficiency of marketing system, so that improvements can be directed towards factors
which are crucial in determining efficiency. Increased efficiency is in the best
interests of farmers, traders, processors, wholesalers, retailers, consumers and the
society as a whole. The efficiency of a marketing system is measured in terms of the
level and/or costs of the inputs to the system, to achieve a given level and/or quality
of output. Such inputs are generally in the form of land, finance, time, manpower,
and materials. Efficient marketing optimize the ratio between inputs and outputs.

20
Generally marketing efficiency is measured in three ways: a) Operational efficiency
b) Pricing efficiency and c) Technical efficiency.
i) Operational efficiency
Operational efficiency is measured in terms of marketing costs and marketing
margins. An improved operational efficiency is evident where marketing costs are
reduced but outputs are either maintained or actually increased. Technological
innovations are not the only avenue leading to higher levels of operational efficiency.
An organization that improves its raw material procurement practices, by say
centralizing purchases, buying in larger quantities or taking advantage of unit freight
rates, is likely to increase operating efficiency (FAO, 1999). Therefore, the higher
the losses incurred during the operation the lower the level of operational efficiency.
ii) Pricing efficiency
This is measured in terms of correlation of price movements of the same product
between pairs of markets to test market integration. Such correlation gives an
indication of the degree of integration between markets. Pricing efficiency is
concerned with the ability of the marketing system to allocate resources and
coordinate the entire agricultural/food production and marketing process in
accordance with consumer directives.
Pricing efficiency is evidenced in terms of efficient resource allocation and
maximum economic customers’ willingness to pay in the marketplace for the
produce, commodity or product in question. It is generally accepted that the higher
the correlation of prices between pairs of markets for a particular product, the better
21
integrated the markets are for that crop and hence the higher the efficiency they are
operating in terms of price. Competition plays an important role in determining
pricing efficiency, and at the same time adding more utility to the products in order
to get more market share (FAO, 1999).
iii) Technical efficiency
Technical efficiency refers to the way with which resources are used in marketing, in
terms of physical input and output ratios. It should however be noted that these
measures do not provide an absolute measure of an overall market efficiency. In a
production unit technical efficiency refers to the achievement of the maximum
potential output from given amounts of factor inputs, taking into account physical
production relationships (Zabaleta et al., 2003).
2.4 Marketing Costs
FAO (1999) describes marketing costs as expenses that are incurred when the
commodity moves from the farm to the final market, whether they are moved by
farmers, intermediaries, cooperatives, marketing boards, wholesalers, retailers or
exporters. With increased urbanization and industrialization, marketing costs tend to
increase the relative farm gate price received by the farmer. An example is when the
product moves greater distances, through more intermediaries and is more
sophisticated in its packaging.
Marketing costs can also reflect the state of a country’s development in terms of
increased standards of living, smaller proportions of income expended on raw
products of the farm and greater proportions of income that are spent on additional

22
and improved marketing services. Increasing the value added means, among other
things, that more people in developed countries are involved in marketing
agricultural products than in producing them. Marketing costs include labor,
transport, packaging, containers, rent, utilities (water), depreciation allowances and
interest charges (FAO, 1999).
2.5 Market Margins
Scarborough and Kydd (1992) defined market margins as the difference between
prices at two market levels. The term market margin is commonly used to refer to the
difference between producer and consumer prices of an equivalent quantity and
quality of a commodity. However, it may also describe price differences between
other points in the marketing chain, for example between producer and wholesale, or
wholesale and retail, prices. Price spreads can be calculated on the basis of two
methods: i) The net price received by the farmer which is calculated by deducting the
marketing costs from the original price paid by the farmer by the middlemen and ii)
The net margins are calculated by subtracting the sum of all operating costs from
gross margins.
2.6 Price Transmission
Price transmission usually shows how quickly and to what extent price differentials
(net of transactions costs) between two spatially distant markets are eliminated
(Obstfeld and Taylor, 1997). The assessment of price transmission along the supply
chain, i.e. how much and how fast price changes are passed through between
different stages of the chain, is often used as an indicator of the effectiveness and
efficiency of the chain as well as of the degree of competition in processing and

23
distribution. The assessment of price transmission typically aims at addressing the
following issues: i) The magnitude of the price adjustment, i.e. how much of the
price change at one step of the produce supply chain which is transmitted to the
downwards step, ii) the speed of the price adjustment, i.e. the pace at which changes
in prices at one level of the supply chain are transmitted to the other levels, and iii)
the asymmetry of the price adjustment, i.e. to what extent price increases and
decreases are transmitted differently in terms of magnitude and speed.
Meyer and von Cramon-Taubadel (2004) found that the issue of Asymmetric Price
Transmission (APT) has received a considerable attention in economic literature
because of the size of some markets on which APT takes place (such as petroleum
markets), global dependence on some products (again oil) and the share of income
spent by average household on some products (again petroleum products). APT is
important from the welfare point of view. One must remember that APT implies
welfare redistribution from agents downstream to agents upstream (presumably
consumers to large energy companies), and it has serious political and social
consequences (Babbie, 1990).
2.7 Review of Analytical Techniques in Marketing Efficiency Analysis
The following analytical techniques are frequently used in marketing efficiency
analysis: Market Channel Baseline Analysis, Concentration ratio, Market margin
analysis, and Gross margin analysis. Regression analysis is also used to assess the
factors that contributed to the market efficiency in terms of price (price efficiency) in
the chain for farmers and traders. These are briefly discussed in the following sub-
sections.

24
2.7.1 Market channel baseline analysis
MCBA is an analytical technique used to assess the way a market channel operates.
It records all actors in the value chain from production to final consumers. The actors
carrying out similar functions are grouped together and product flows in and out are
recorded. Finally, the constraints which hamper the facilitation of the product flow
from producers to consumers are assessed. The MCBA is suitable in identification of
the structures, interaction and constraints of the actors (Mgaya, 2008).
The analysis of marketing channels provides a systematic knowledge of the flow of
goods and services from their origin (farmer) to their final destination (consumer).
This knowledge is acquired by studying the participants in the process those who
perform physical marketing functions in order to obtain economic benefits. In
carrying out the functions, marketing agents achieve both personal and social goals.
They add value to production and in so doing help satisfy consumer needs. This price
also serves as a signal to all the actors in the marketing channel, i.e. farmers, rural
assemblers, transporters, wholesalers, and retailers (Mendoza, 1995).
2.7.2 Concentration ratio
Market power is the ability of a firm to alter the market price of a good or service. It
is the ability to raise prices without losing customers to competitors. In perfectly
competitive markets, market participants have no market power. A firm with market
power has the ability to individually affect either the total quantity or the prevailing
price in the market or both (Sexton and Zhang, 2001). Market power can be
measured by different measurements. One of them is the concentration ratio (CR).
The CR can be calculated as a ratio of the total quantity of the products

25
sold/purchased by the four big buyers (wholesale) to the total quantity of the
products sold/purchased in the marketing season.
According to Pomeroy and Trinidad (1995), the concentration ratio plays an
important role in the determination of market behaviour within an industry because it
affects the interdependence action of firms. Similarly, according to Kohls and Uhl
(1990), a CR of over 50% is an indication of strong monopolistic firm, while a CR of
between 33% and 50% indicates weak monopolistic firm. A CR of less than 33%
shows unconcentrated firm. An unconcentrated market structure reflects a high level
of competition, which is necessary for increasing market efficiency (Bryceson,
1994).
The CR analytical tool is useful in the identification of the market structure and
power which determines the degree of competition that exists in the particular
segment (Hervan, 2005). It is generally used to indicate the level of competition
within the segment as well as the absence of an oligopolistic market structure
(Hardwick et al., 1996). Furthermore, CR is used as a guide for indicating the most
likely type of market structure and levels of competition within a given market
segment (Mukwenda, 2005).
The CR analytical tool has been used in the agro-industry by several researchers such
as Mukwenda (2005) for maize marketing in Njombe District, Gabagambi (1998) in
the analysis of rice marketing in Ulanga District and Kohls and Uhl (1990) in the
analysis of spice marketing. The study by Mukwenda (2005) had a CR of 111%

26
which indicates that there is an oligopolistic market structure implying less
competitive of maize market in Njombe District. Furthermore, the CR obtained by
Gabagambi (1998) was low at about 26% indicating that there was no strong group
of traders who controlled rice marketing in Ulanga District. In the study on spice
marketing by Mshote (2006) the CR was determined by looking at the proportion of
total purchase accounted for by few largest buyers to the total volume handled.
Experts of using this analytical technique usually recommend calculating the CR of
homogeneous groups of the sample in order to find out the segment which is not
competitive and inefficient.
It is generally believed that higher market concentration indicates non-competitive
behaviour and thus inefficiency. Devine et al., (1984) concluded that buyer
concentration is analogous to seller concentration, and in principle a range of
absolute and relative measure of buyer concentration corresponding to those of seller
concentration could be constructed. However, such measures have not been
constructed, to the absence of product by purchasing firms. The relationship between
concentration, market behaviour, and performance must not be interpreted in
isolation. Other factors such as the firms’ objectives, barriers to entry and exit,
economics of scale, and assumptions about rival firms’ behaviour are all relevant in
determining the degree of concentration and the relationship between concentration
and behaviour and market efficiency (Scherer, 1980).
2.7.3 Regression analysis
Regression analysis is a statistical forecasting model that is concerned with
describing and evaluating relationship between given variables i.e. the dependent and

27
independent variables. The regression analysis can be used to predict the outcome of
a given dependent variable based on the interaction of other related explanatory
variables. Regression models depend on several assumptions. Firstly, the predictors
must be linearly independent i.e. it must be possible to express any predictor as linear
combination to others. Secondly, error terms must be normally distributed and
independent and, thirdly, the variance of the error terms must be constant (Manage,
2007).
In this study the regression analysis was used to assess the factors that contributed to
the efficiency in terms of price (price efficiency) in the chain for farmers and traders
(Equation 1). This approach was also used by Gabagambi (1998) in pricing
efficiency analysis. Price analysis is an indirect approach for determining market
efficiency. Efficient marketing systems are characterized by a high degree of price
integration loosely correlated movements of connected series of price over space,
form, and time.
Y=α+βXi+μ .......................................................................................................... (1)
Where:
Y = Dependent variable,
Xi = Independent variables,
α = Constant term, μ=error term,
β = Degree to which independent variables influence dependent variable
at a given marketing level.

28
2.7.4 Market margin analysis
Scarborough and Kydd (1992) defined market margins as the difference between
prices at two market levels. The term market margin is commonly used to refer to the
difference between producer and consumer prices of an equivalent quantity and
quality of a commodity. However, it may also describe price differences between
other points in the marketing chain, for example differences between producer and
wholesale, or wholesale and retail, prices. The market margins can be calculated by
using the following equation.
X 100 .............................................. (2)
Where:
TGMM = Total gross market margin.
2.7.5 Gross margin analysis
Gross Margin (GM) is a technique that is used to establish the economic profitability.
It is given as a difference between the gross income accrued and the variable costs
incurred. The analysis is therefore a simplified tool, but in many cases, a sufficiently
powerful tool for economic analysis (Makeham et al., 1986). The GM enables one to
directly compare the relative profitability of similar enterprises and consequently
provides a starting point to deciding or altering the farms overall enterprise mix.
Most often, new technologies in smallholder farmers are aiming at increasing the
farm productivity by the fact that increasing income is one of the immediate
objectives of the individual farmer or group of farmers (Ferris, 2000; Mutayoba,
2005).
29
It is important to compare GM of different market participants to know whether or
not farmers and traders are able to pursue their economic activities sustainably. To
define the concept of gross margin, variable costs and fixed costs have to be
distinguished. Variable costs are those cost that increase or decrease as output
changes (Cramer et al., 2001). Common examples of variable costs in crop
production include seeds, fertilizers, and pesticides. The most important fixed costs
in agricultural production are owned land, farm buildings, machinery and
implements.
According to Mutabazi (2007) gross margin analysis is static and does not take into
consideration the time value of money compared to investment analysis. The key
advantages of GM analysis as an economic analytical tool include its easiness to be
understood, its ability to draw logical interrelation of economic and technological
parameters and its ability of rational variants for the operational structure of an
enterprise or individual farmers (Phillip, 2007). Johnsen (2003) concluded that
although gross margin is not a good measure of profitability, it remains the most
satisfactory measure of profitability in small enterprise.

30
CHAPTER THREE
3.0 RESEARCH METHODOLOGY
3.1 Description of the Study Area
3.1.1 Geographical location
The study was carried out in Arumeru and Monduli Districts (Fig. 2) in Arusha
Region. Arusha Region is located in north-eastern corner of Tanzania. It lies below
the equator between latitudes 2° and 6°. The Region is situated between latitudes 35°
and 38° East and longitudes35° 40′ and 3° 21′ South. The Region has a common
border with Kenya in the North, to the east it borders with Kilimanjaro and Tanga
Regions. To the South it shares with Dodoma Region and to the West with Singida,
Shinyanga and Mara Regions. Monduli District is bordered to the North by Kenya, to
the East by Kilimanjaro Region and Arumeru District, to the South by Manyara
Region and to the West by the Ngorongoro and Karatu Districts. Arumeru District is
bordered to the North and West by Monduli District, to the East by the Kilimanjaro
Region and to the South by Arusha District and the Monduli Districts (URT, 2011).
3.1.2 Land area and administrative units
The total area of Arusha Region is 82 428.5 square kilometres; out of this a total area
of 3 571 square kilometres (4.3 percent) is covered by water bodies of Lakes Eyasi,
Manyara, Babati and Natron. The remaining 78 857.5 square kilometres is land area.

31
Figure 2: Location of the study areas Source: Arusha Municipal Council

32
Arusha Region is the largest Region in the country (Tanzania Mainland) occupying
9.2 percent of Tanzania main land total area of 942 784 square kilometres. Arusha
Region is divided into five Districts namely: Ngorongoro, Arusha, Karatu, Monduli
and Arumeru (NBS, 2002). The total area of Monduli District is 14 201square
kilometres and that of Arumeru Districts 2 896square kilometres. Monduli District
has three divisions, fourteen wards and forty nine villages while Arumeru District
has six divisions, thirty seven wards and hundred and thirty three villages (NBS,
2003).
3.1.3 Demography
According to the National Census in 1988, the population of Arusha was 1 351 675
individuals and the current projections for the National Census in 1998 indicate that
the population is 1 963 200 individuals. Based on 2002 Tanzania national census, the
population of Monduli District is 185 237 and that of Arumeru District is 516 814.
Engaruka village is divided into Engaruka Juu and Engaruka Chini. Engaruka Juu
has 6 214 inhabitants and Engaruka Chini has 5 200 inhabitants (NBS, 2003).
3.1.4 Economic activities
The main activity in both Districts is agriculture (cropping and animal husbandry).
Majority of the population (60%) in these areas depend on agriculture for their
livelihood. Both cropping and livestock keeping are the major economic activities
undertaken in Monduli District. Major crops include: maize, Dolicos lablab (locally
called ngwara or fiwi), banana and cassava and Jatropha. Livestock keeping is very
common in both Districts. All kinds of agricultural activities, including a variety of
food and cash crops, livestock keeping, dairy production are viable in these areas.

33
Despite these activities being highly common around these places, there are other
economic activities such as business activities, tourism and formal employment that
are also undertaken.
3.2 Research Design
The research design used was a cross-section survey done at a single point in time.
This design is useful for descriptive purposes and in obtaining qualitative
information as well as for determination of relationship between variables (Bailey,
1998). Furthermore, it allows a researcher to efficiently utilize the economic
resources in terms of time and funds.
3.3 Sampling of Jatropha Market Practitioners
Selection of the sample of Jatropha market chain actors was initially done using the
stratified random sampling technique, because the targeted population constituted of
heterogeneous groups i.e. farmers, traders, processors and consumers. Based on
organizational considerations and availability of market chain activities, selection of
respondents was based on the available resources to undertake the study as well as
the sample frame of the respondents. Therefore, this led to choosing minimum
selection of sample for certain groups of respondents. For instance, 30 people are the
minimum number of sample size that can be used to represent a population.
However, only five sampled processors were selected in this study. This was due to
their availability in this study area as explained in section 3.3.3. The population was
divided into several strata and then respondents from each stratum were randomly
selected to constitute the sample size. Since each stratum is more homogeneous then
a precise estimate was done. A simple random sampling was then used to obtain a

34
representative sample of Jatropha market participants based on their respective
locations. A total sample of 130 market chain actors consisting of 80 farmers, 25
traders, 5 processors and 20 consumers were selected for the study as shown in Table
2 and described in the following sub-sections.
Table 2: Detailed sample structure by sample area
Market chain actors Sample areas Frequency(n) Percent (%) Farmers Engaruka villages 80 62 Traders Engaruka villages 25 19 Processors Njiro and USA river 5 4 Consumers
Njiro, A-town, Kijenge, Mbauda and Sakina
20 15
Total 130 100
3.3.1 Sampling of Jatropha farmers
From a sampling frame of 309 Jatropha farmers provided by Engaruka village
officers, 80 Jatropha farmers were randomly selected. The choice of Jatropha farmers
from the study area was based on the high availability of Jatropha seeds production
as well as willingness of the farmers to respond to the questions.
3.3.2 Sampling of Jatropha traders
In accordance with the sampling frame of approximately 97 traders provided by
Engaruka village officers, a total number of 25 traders were randomly selected. None
of the sampled Jatropha traders were selected from Arumeru District. This is because
respondents from Arumeru were not engaged in Jatropha seeds marketing. Therefore,
this choice was based on high availability of Jatropha seeds marketing.

35
3.3.3 Sampling of Jatropha processors
A total of 5 processing companies were purposively selected from Arumeru District,
specifically from Njiro and USA river areas. Arumeru District officials assisted in
the identification of the processing plants including their locations and contacts.
Purposive selection of these companies was done mainly because Jatropha
investment is still at small scale therefore Jatropha processing plants in Tanzania,
particularly in Arumeru are also few in number. Therefore, the distribution in
selection was based on location.
3.3.4 Sampling of Jatropha consumers
Selection of Jatropha products consumers was very tricky because there was no
specific sampling frame that was used as a benchmark for sample selection.
Regarding that Jatropha products are still new to majority of Tanzanians; therefore it
was hard to identify who used these products looking at household level. Therefore,
according to this circumstance, the approach used to draw the sample involved
selecting consumers randomly at the processing companies. This means consumers
who came to buy Jatropha products were randomly selected and they were asked to
respond to questions. A total of 20 consumers were randomly selected to constitute
the sample.
3.4 Data Collection Methods
Data for this study were obtained through primary and secondary sources during
field survey that was carried out in November 2010.

36
3.4.1 Primary data collection
Primary data were collected in two Districts namely Monduli and Arumeru using a
semi-structured questionnaire with closed and open ended questions. Pre-testing of
the questionnaire was done to check for any ambiguity. Therefore, addition, deletion
of some of the questions and the modification of several models was done.
3.4.2 Secondary data
Secondary data were obtained from Sokoine National Agriculture Library (SNAL)
and internet. Other sources included books, publications and journals. Some
information was obtained from the District offices and Companies as well as from
people (village officials and District officers) who had information relevant to the
study.
3.5 Pre-testing of the Questionnaire
Pre-testing of questionnaire was conducted prior to the main fieldwork as the basis of
improving the instrument. Questionnaire pre-testing involved 20 respondents from
Engaruka village and Arusha town and was conducted one week before the general
survey. This activity was done in order to check if the questionnaires were
comprehensive enough to collect the required data. After the pre-testing,
modifications were made to the questionnaires and improved versions of the
questionnaires were developed.
3.6 Data Processing and Analysis
The Statistical Package for Social Science (SPSS) and Microsoft excel were used for
both qualitative and quantitative data analysis in order to achieve the stated
objectives. The responses from the interviewed respondents were coded and
37
summarized and then the above mentioned software packages were used for analysis.
Descriptive analysis was then employed for means, frequencies, percentages, graphs
and ranges, while quantitative analysis involved the use of correlation, market
concentration index, gross margin, market margin and price transmissions analysis.
The results were then presented in terms of percentages and graphs such as
histograms, pie and line charts. Details are described in the following sub-sections.
3.6.1 Jatropha marketing channels and the marketing power among the
actors
3.6.1.1 Analysis of Jatropha marketing channels
(a) Market channels analysis
Market Channel Baseline Survey (MCBS) was used to identify the market channels
of the Jatropha market participants. The MCBS helped to record all the actors in the
Jatropha value chain from production to final consumers. The actors carrying out
similar functions were grouped together and recorded product flows in and out were
mapped. Data on product sources, customers and costs of marketing were overlaid on
the market chain map.
(b) Descriptive analysis
Frequency analysis was used to assess the opportunities and the constraints which
hampered the facilitation of Jatropha flow from the producers to consumers during
production and marketing activities.
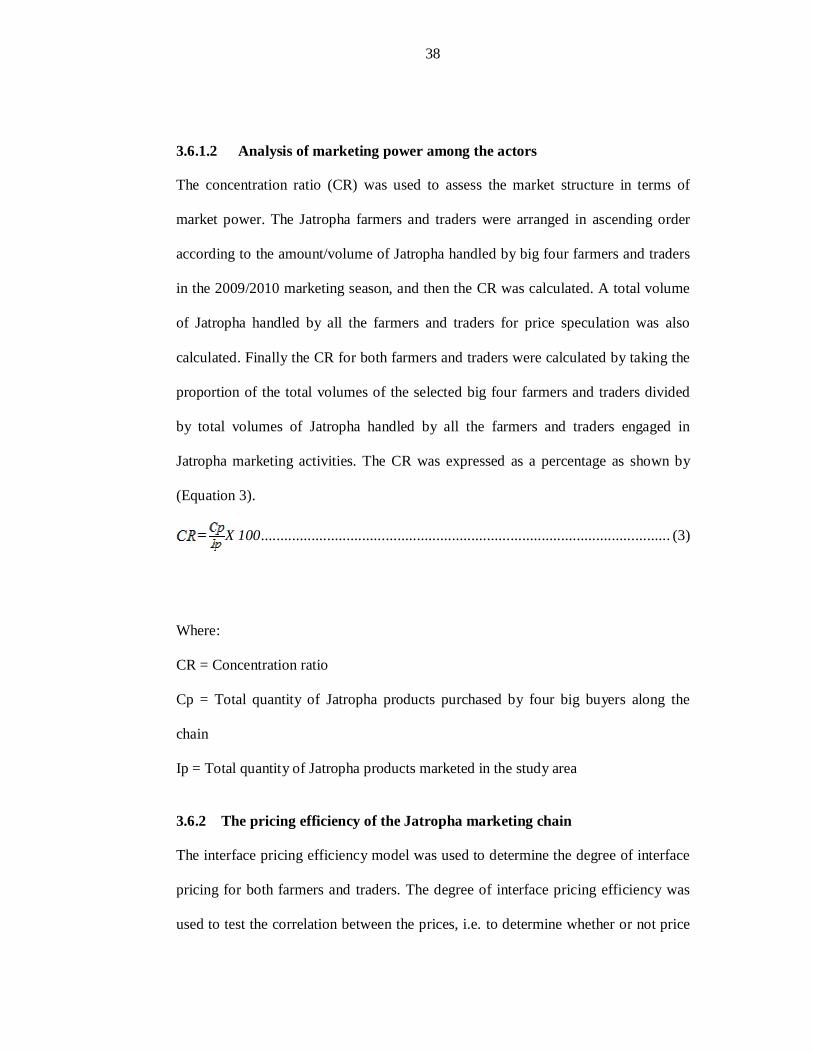
38
3.6.1.2 Analysis of marketing power among the actors
The concentration ratio (CR) was used to assess the market structure in terms of
market power. The Jatropha farmers and traders were arranged in ascending order
according to the amount/volume of Jatropha handled by big four farmers and traders
in the 2009/2010 marketing season, and then the CR was calculated. A total volume
of Jatropha handled by all the farmers and traders for price speculation was also
calculated. Finally the CR for both farmers and traders were calculated by taking the
proportion of the total volumes of the selected big four farmers and traders divided
by total volumes of Jatropha handled by all the farmers and traders engaged in
Jatropha marketing activities. The CR was expressed as a percentage as shown by
(Equation 3).
X 100 ......................................................................................................... (3)
Where:
CR = Concentration ratio
Cp = Total quantity of Jatropha products purchased by four big buyers along the
chain
Ip = Total quantity of Jatropha products marketed in the study area
3.6.2 The pricing efficiency of the Jatropha marketing chain
The interface pricing efficiency model was used to determine the degree of interface
pricing for both farmers and traders. The degree of interface pricing efficiency was
used to test the correlation between the prices, i.e. to determine whether or not price

39
changes were passed onto the market level (Schmidt, 1979). This was done through
running a simple regression model (Equation 4).
MM = f (Pi+μ) ....................................................................................................... (4)
Where:
MM = Market Margin,
Pi = Buying price at a specified market,
μ = Error term
3.6.3 Gross and market margins of Jatropha value chain actors
(a) Analysis of gross margin
The GM was done to determine the returns realized by the farmers, traders and
processors. The GM provides insights into marketing characteristics to assess the
contribution of Jatropha marketing to the income of the respondents. According to
Mutabazi et al. (2006) gross margin analysis is static and does not take into
consideration the time value of money compared to investment analysis. GM
technique does not take into account variations in fixed cost structure within and or
among enterprises. However, the GM can still assist in enhancing the overall
management as it addresses resource productivity in a given period. An added
advantage of GM is that it can easily be understood and it has logical
interrelationship between economic and technological parameters (Castle et al.,
1987; Senkondo et al., 2004). GM was derived using the data on variable costs and
the revenue based on prices. The formula is given as follows (Equation 5):
GMi=TRi–TVCi ...................................................................................................... (5)
Where:
GM = Gross Margin of either farmers, traders, processors (Tshs/kg);

40
TR = Average total revenue of either farmers, traders, processors (Tshs/kg);
TVC = Average total variable cost of either farmers, traders, processors
(Tshs/kg);
i = 1-nth farmers, traders, processors.
Average total revenue was calculated by multiplying the average yield in kilogram
by the average market price of the crop. Total variable costs were obtained directly
from the respondents during the interviews. The costs involved include the
production costs, storage cost, transportation cost, processing cost, loss due to
damage and hired labor cost. Labour is arguably the most significant investment in
subsistence agriculture and failing to introduce labour as an input may not allow for
an accurate representation of agricultural production. Therefore, taking into account
of the inadequate development of the labour markets and complexity surrounding
valuation of family labour, the family labour was not valued in terms of monetary
terms in this study but rather as man-days. Studies like Senkondo et al., (2004) and
Fox et al. (2005) provide an understanding of different views on how to handle
valuation of family labour in rural communities.
(b) Analysis of market margin
Market margin analysis was used to assess the difference between prices at two
market levels (sellers and buyers). It was used to describe price differences between
other points in the marketing chain, for example between producer and wholesale, or
wholesale and retail, prices. According to Scarborough and Kydd (1992), the term
market margin is commonly used to refer to the difference between producer and
consumer prices of an equivalent quantity and quality of a commodity. MM was
derived using the data on buying and the selling prices based on prices.

41
The formula is given as follows (Equation 6):
X 100.................................................. (6)
Where:
TGMM = Total gross market margin
3.6.4 Price transmission from the producer to ultimate consumption and
utilization
Price transmission was assessed by calculating the shares for Jatropha market
participants i.e. (i) Producers’ share (ii) Traders’ share and (iii) Processors’ share.
Through these relationships the issue of price transmission was then observed since
APT implies welfare redistribution from agents downstream to agents upstream
(presumably consumers to large energy companies) and it has serious political and
social consequences (Meyer and von Cramon-Taubadel, 2004).
i) Producer’s share equation
= .................................................................. (7)
Where:
PS = Producer’s share,
PX= Producer’s price, Rp =Retail price,
MMf = Market Margin of farmers,
S= Sum of average share (throughout).

42
ii) Trader’s share equation
................................................................ (8)
Where:
TS = Trader’s share,
TX= Trader’s price,
Rp =Retail price,
MMt = Market Margin of traders,
S= Sum of average share (throughout).
iii) Processor’s share equation
= ............................................................ (9)
Where:
PRS = Processor’s share,
PRX= Processor’s price, Rp =Retail price,
MMpr = Market Margin of processors,
S= Sum of average share (throughout).
3.7 Limitations of the Study

43
In some cases, it was difficult to locate some of the respondents (especially traders
and consumers from Arumeru District); majorities were busy engaging in other
economical activities. Language barrier was another problem because majority of
respondents from Engaruka villages were unable to understand and speak good
Kiswahili. Also, the information sought from some of the respondents was based on
past experiences; therefore, it was somehow hard to recall especially considering that
majority of those respondents did not keep records. Again, some respondents were a
bit reluctant to provide sensitive details such as questions involved their income
earned, number of children and size of land owned. Due to bad weather including
frequent rains and storms particularly in Engaruka villages, the process of data
collection became hard and time consuming.
In overcoming these limitations, the researcher had to translate many questions into
the Masaai language through a third party although this might have led to inaccuracy
of some answers. Moreover, the research team spent some additional time looking
for respondents and sometimes call-backs and physical revisits were done. Whenever
there was rain, interviews had to be cancelled until the rain stopped; however, this
caused some of the respondents not to come back for another session when they left.

44
CHAPTER FOUR
4.0 RESULTS AND DISCUSSION
4.1 The Market Channels for Jatropha and Marketing Power among the
actors
4.1.1 The Jatropha market channels
The MCBA undertaken found that there were various channels through which
Jatropha seeds pass from the producers via middlemen and finally to the ultimate
consumers. The assessment of market channels aimed at explaining roles played by
Jatropha market participants in the chain in order to provide the product with time,
form and place utilities. Market efficiency thus requires a well planned network that
assigns well defined functions to its members. From this network, market
participants attained their individual and social targets. In this study, the following
market participants in the Jatropha market chain were identified: i) Farmers from
both villages i.e. Engaruka Juu and Engaruka Chini, ii) traders (including both
wholesalers and retailers from both Engaruka Juu and Engaruka Chini), iii)
processing companies from Arumeru, and iv) consumers who are the buyers of the
Jatropha products such as oil or fuel, soaps and fertilizers.
4.1.2 Farmers
Farmers were the first link in the Jatropha market chain, since they were the primary
producers of Jatropha seeds. Results in Fig.3 show that Jatropha farmers sold their
seeds through different channels. The main three buyers identified were the local

45
individual buyers, companies and both local buyers and companies (Table 3).
However, according to these results the most prominent buyers of Jatropha seeds
from farmers were the local buyers (71%).This might be attributed by that the
majority of farmers relied on middlemen to facilitate their trading activities and
moreover they were unable to facilitate transportation costs to market places in town,
where many companies are located. It was also observed that about 30% of the
farmers (included those who sold to either individual companies or to both the local
buyers and companies) also sold their seeds to the four major companies which
include KAKUTE, DILIGENT, JPTL and TaTEDO. Results in Table 3 indicate that
DILIGENT Company bought the seeds from the farmers in large quantities (37.5%)
compared to the other companies.
During the focus group discussions with farmers, they informed that most of their
customers (59%) came directly to negotiate prices with their customers at the village
market (Table 4) due to a higher concentration of buyers around these places.
However, village markets were regarded as seasonal markets having specific days of
the week for operating.
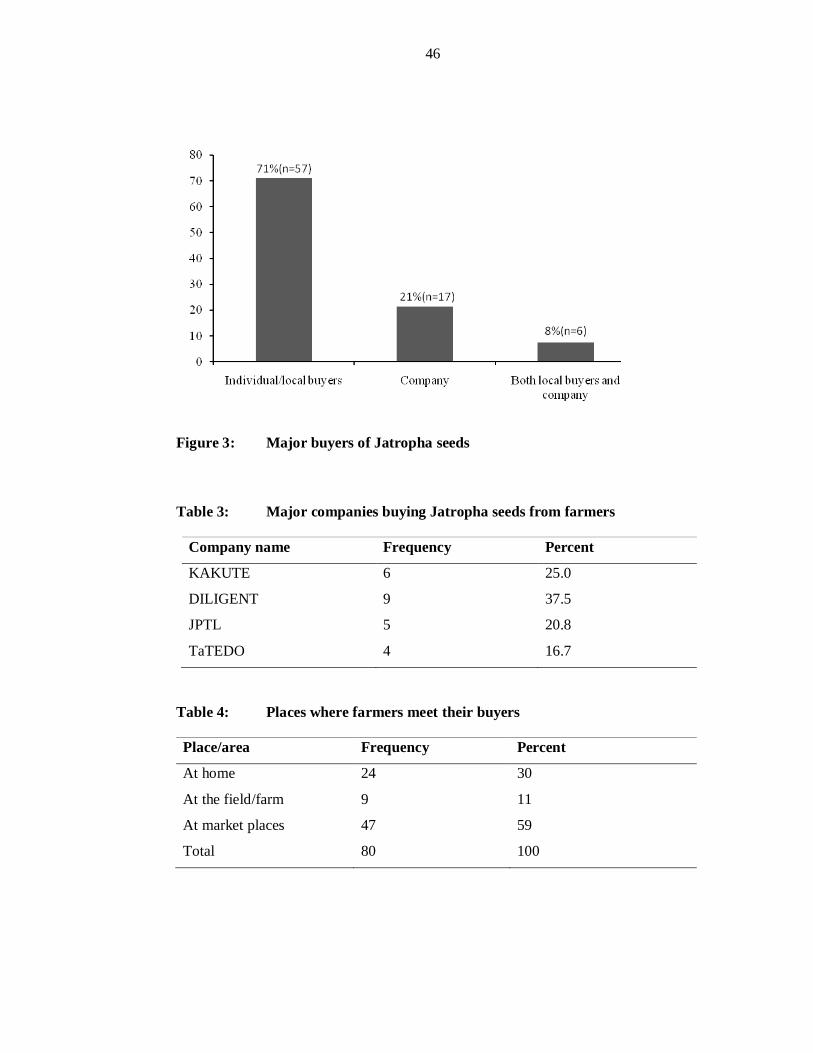
46
Figure 3: Major buyers of Jatropha seeds
Table 3: Major companies buying Jatropha seeds from farmers
Company name Frequency Percent
KAKUTE 6 25.0
DILIGENT 9 37.5
JPTL 5 20.8
TaTEDO 4 16.7
Table 4: Places where farmers meet their buyers
Place/area Frequency Percent
At home 24 30
At the field/farm 9 11
At market places 47 59
Total 80 100

47
4.1.2.1 Link between farmers and the traders
The wholesalers go straight to farmers where they negotiate prices. Once they have
reached an agreement, the wholesalers purchase the seeds from the farmers. Farmers
reported sometimes wholesalers do not stick to the agreements made and fail to buy
the seeds at the agreed prices, therefore when this happens farmers directly sell their
seeds to retailers or companies.
4.1.2.2 Link between farmers and the processors
The company agents usually buy the seeds either from the farmers directly or from
the traders i.e. wholesalers and retailers. The farmers and the company agents
negotiate prices and once an agreement is reached, the processors purchase the seeds
from the villages and transport them to their processing companies in Arusha town.
4.1.3 Traders
The results show that majority of traders (48%) were the retailers of the Jatropha
seeds (Table 5). This group occupies a larger percent of Jatropha seeds traders, and
provides necessary marketing information such as prices and customers’ preferences
to other functionaries.
Table 5: Categories of traders
Category Frequency Percent Wholesaler 11 44 Retailer 12 48 Both whole seller and retailer 2 8
Total 80 100
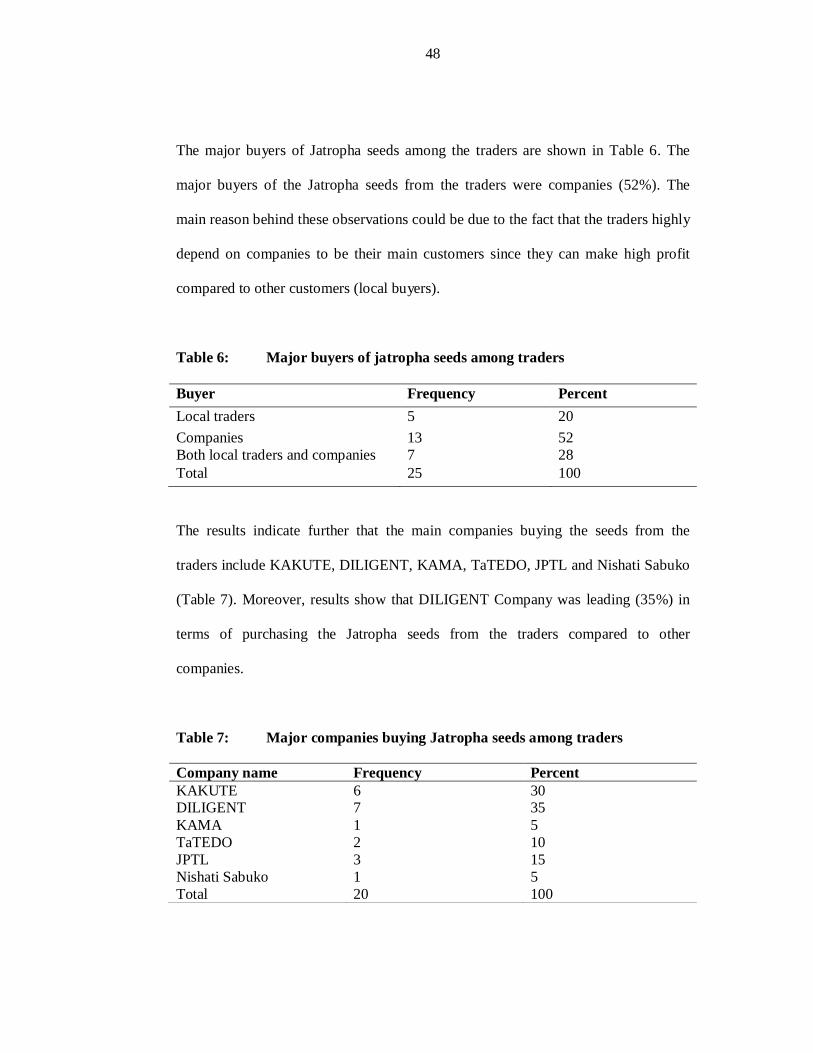
48
The major buyers of Jatropha seeds among the traders are shown in Table 6. The
major buyers of the Jatropha seeds from the traders were companies (52%). The
main reason behind these observations could be due to the fact that the traders highly
depend on companies to be their main customers since they can make high profit
compared to other customers (local buyers).
Table 6: Major buyers of jatropha seeds among traders
The results indicate further that the main companies buying the seeds from the
traders include KAKUTE, DILIGENT, KAMA, TaTEDO, JPTL and Nishati Sabuko
(Table 7). Moreover, results show that DILIGENT Company was leading (35%) in
terms of purchasing the Jatropha seeds from the traders compared to other
companies.
Table 7: Major companies buying Jatropha seeds among traders
Company name Frequency Percent KAKUTE 6 30 DILIGENT 7 35 KAMA 1 5 TaTEDO 2 10 JPTL 3 15 Nishati Sabuko 1 5 Total 20 100
Buyer Frequency Percent Local traders 5 20 Companies 13 52 Both local traders and companies 7 28 Total 25 100
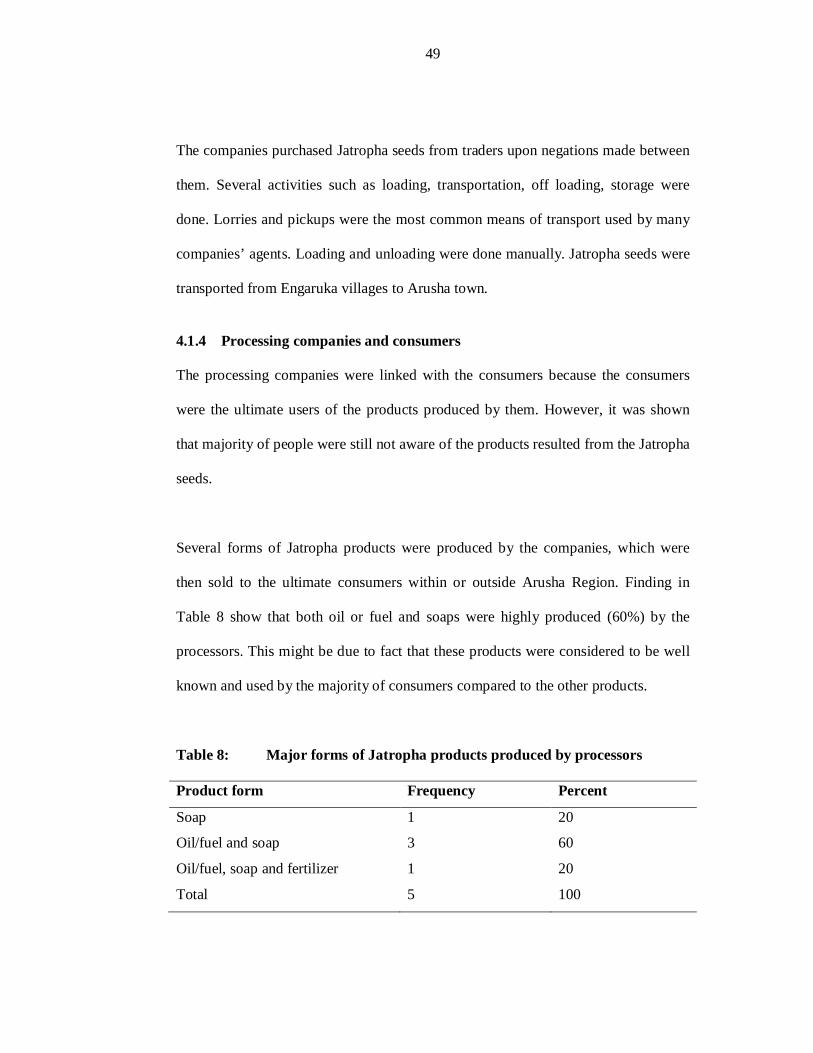
49
The companies purchased Jatropha seeds from traders upon negations made between
them. Several activities such as loading, transportation, off loading, storage were
done. Lorries and pickups were the most common means of transport used by many
companies’ agents. Loading and unloading were done manually. Jatropha seeds were
transported from Engaruka villages to Arusha town.
4.1.4 Processing companies and consumers
The processing companies were linked with the consumers because the consumers
were the ultimate users of the products produced by them. However, it was shown
that majority of people were still not aware of the products resulted from the Jatropha
seeds.
Several forms of Jatropha products were produced by the companies, which were
then sold to the ultimate consumers within or outside Arusha Region. Finding in
Table 8 show that both oil or fuel and soaps were highly produced (60%) by the
processors. This might be due to fact that these products were considered to be well
known and used by the majority of consumers compared to the other products.
Table 8: Major forms of Jatropha products produced by processors
Product form Frequency Percent
Soap 1 20
Oil/fuel and soap 3 60
Oil/fuel, soap and fertilizer 1 20
Total 5 100

50
The major buyers of these products included local consumers (40%), local traders
and consumers (40%), and local consumers and traders and interregional traders
(20%) as shown in Table 9.
Table 9: Major buyers of Jatropha products produced by processors
Majority of the consumers (55%) reported to have bought Jatropha products from
KAKUTE Company. The main reasons which made them to buy Jatropha products
are summarized in Table 10.
Table 10: Preferences for buying Jatropha products
The study revealed that the existing Jatropha market channels involved a number of
channels and not just one single channel (Fig. 4).Four main channels were identified.
Buyer Frequency Percent
Local consumers 2 40
Local consumers and traders 2 40
Local consumers, traders and inter
regional traders
1 20
Total 5 100
Reason Frequency Percent
Cheap 1 5
Quality/good products 11 55
Cheap/quality/economical 8 40
Total 20 100
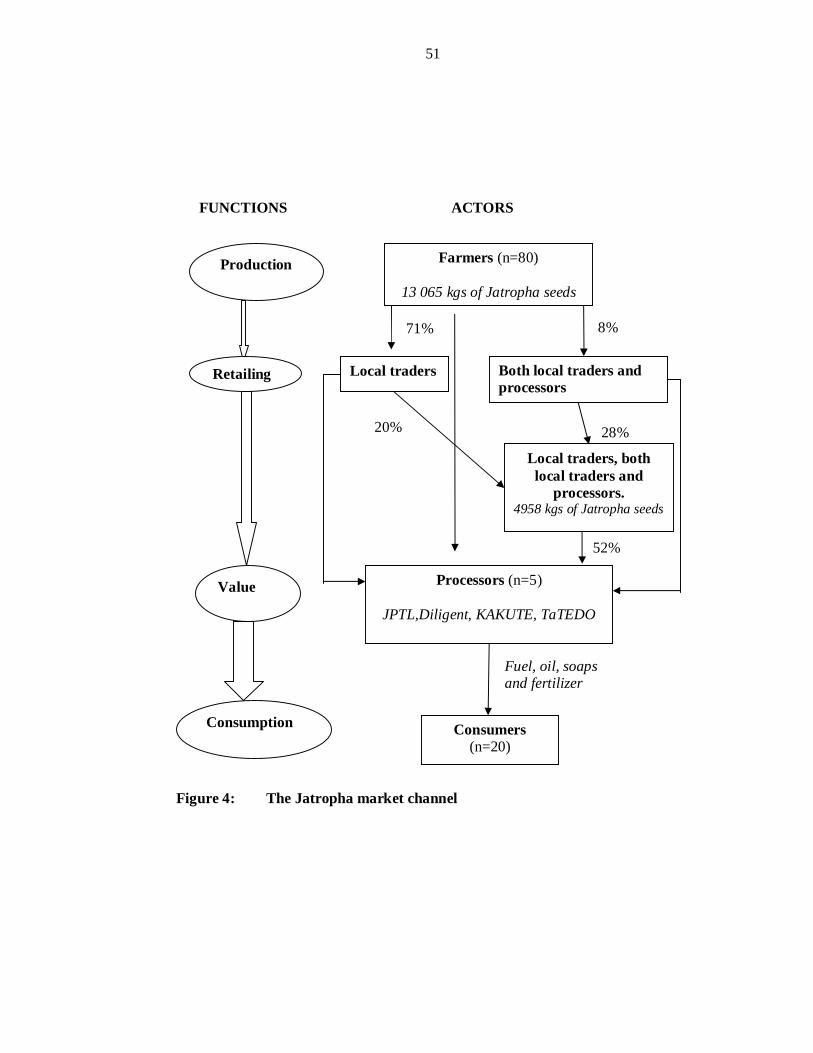
51
Figure 4: The Jatropha market channel
Farmers (n=80)
13 065 kgs of Jatropha seeds
Local traders Both local traders and processors
Processors (n=5)
JPTL,Diligent, KAKUTE, TaTEDO
Consumers (n=20)
Production
Retailing
Value
Consumption
FUNCTIONS ACTORS
8% 71%
28%
Local traders, both local traders and
processors. 4958 kgs of Jatropha seeds
20%
52%
Fuel, oil, soaps and fertilizer

52
Channel I: Farmers – processors – consumers
Channel II: Farmers – local traders – processors – consumers
Channel III: Farmers – both local traders and processors – processors – consumers
Channel IV: Farmers – local traders – both local traders and processors – processors
– consumers
The channels show the total quantity of Jatropha seeds produced by sampled farmers
was about 13 065 kg. As can be understood from Fig. 4, the main receivers of
Jatropha seeds from farmers were local traders, both local traders and processors,
processors with an estimated percentage share of 71, 8, and 52 respectively.
Consumers received Jatropha products such as soap, oil and fertilizers from the
processors. Besides, the volume and number of actors involved through each channel
was compared and based on the results; channel IV was considered the longest. The
shortest of all channels was channel I because it involved direct sale of Jatropha
seeds from farmers to processors and finally to the ultimate consumers hence few
number of actors involved and less volume compared to other channels.
4.2 The Market Concentration Ratios for Farmers and Traders
Market concentration ratio (CR) was determined for both farmers and traders so as to
assess their market power. The ratio obtained helped to provide an understanding on
the concentration of the Jatropha sellers in the market using Khols and Uhl (1990)
rule of thumb market concentration indicative indices. According to Kohls and Uhl
(1990), the CR of over 50% is an indication of strong monopolistic firm, while a CR

53
of between 33% and 50% indicates weak monopolistic firm. A CR of less than 33%
shows unconcentrated firm.
The CR analytical approach has been used by several researchers such as Kotler and
Armstrong (2006) who noted that marketing of cotton in Kahama District is an
oligopoly, since the CR was high (77%). The study by Mukwenda (2005) had a CR
of 111% which indicated that there is an oligopolistic market structure implying less
competitive of maize market in Njombe District. However, different and contrasting
results were reported by Gabagambi (1998) in the case of rice marketing in Ulanga
District where the CR was found to be 26% indicating that there was no strong group
of traders who controlled the rice marketing Ulanga District.
The concentration for Jatropha farmers was calculated from the total quantity that
was sold by the farmers to the four big Jatropha buyers (wholesalers) divided by the
total quantity of the same number of farmers sold to different buyers (total quantity
of the products sold in the marketing season 2009/10).The same procedure was used
to calculate Jatropha sellers’ concentration ratio. It was found that the CR for farmers
and traders were18% and36% respectively (Table 11). These results indicate that the
market for Jatropha farmers is unconcentrated while that for traders was found to
have weak oligopolistic behaviour. Tendency of small number of consumers’
preference on purchasing Jatropha products might be one of the reasons that make
Jatropha farmers unconcentrated.
Table 11: Concentration indexes for farmers and traders
Variables Farmers (n=80)
Traders (n=25)
Cp(kgs) 2370 1760

54
Cp =Total quantity of Jatropha products purchased by the four big buyers, Ip=Total quantity of Jatropha products marketed in the marketing season. The results also indicate that the Jatropha marketing for traders is non- competitive
due to the existence of a weak oligopolistic market structure. This encourages the
existence of traders’ who potentially collude to set prices of the Jatropha seeds. Price
collusion by traders reduces market competitiveness which in turn, reduces market
efficiency. When the market is competitive, a normal profit is encouraged which
limits any tendency for customers services and satisfaction levels to fall.
4.3 Marketing Efficiency of the Jatropha Value Chain
Market efficiency measures selected included the gross margins, market margins and
the interface price efficiency (measured in terms of correlation of price movements
of the same product between pairs of markets to test market integration). Both the
gross and market margins were used to measure producers, traders and processors
performance.
4.3.1 Gross margin analysis
The profitability of Jatropha marketing was estimated using the Gross margin
analysis (GM). The results in Table 12 give a summary of the GM for farmers,
traders and processors. The results show that the GMs for farmers, traders and
processors were 10 929 Tshs/kg, 37 235Tsh/kg, and 1 363 610Tsh/kg respectively.
This indicates that Jatropha processing is the most profitable (1 363 610Tsh/kg)
marketing enterprise compared to Jatropha farming and trading. These observations
could be attributed by the fact that Jatropha processing involved value addition to
new products such as oil, fertilizer and soaps, which when sold they bring profit to
Ip(kgs) 13065 4958 Market CR(%)=(Cp/Ip)*100 18.06 35.49

55
the companies. Moreover, value addition of the products tends to allow the
processors to fetch relatively higher selling prices at the market compared to that for
farmers and traders. The GM for farmers was lowest (10 929Tsh/kg) compared to
other actors. This could be due to the fact that majority of Jatropha farmers sold their
seeds at lower prices and they are still facing a number of production and marketing
challenges, the most critical being high production costs incurred during farming
activities. Therefore, this shows that the Jatropha farmers are still not benefiting from
Jatropha production due to the lower returns earned.
Table 12: Gross margins for Jatropha farmers, traders and processors
Actors Description
Sales/Costs (Tshs)
Percent (%)
Farmers Average revenue (Tshs) Less Average costs (Tshs) Average Gross Margin (Tshs/kg)
51249.02 40 320 10929.02
21%
Traders Average revenue (Tshs) Less Average costs (Tshs) Average Gross Margin (Tshs/kg)
134897.44 97 662 37235.44
27.6%
Processors Average revenue (Tshs) Less Average costs (Tshs) Average Gross Margin (Tshs/kg)
3 643 110 2 279 500 1 363 610
37.42%
4.3.2 Marketing cost and margin analysis
The marketing margin refers to the difference between prices at different levels in the
marketing system. The total marketing margin is the difference between what the
consumers pay and what the producers/farmers receive for their produce. In other
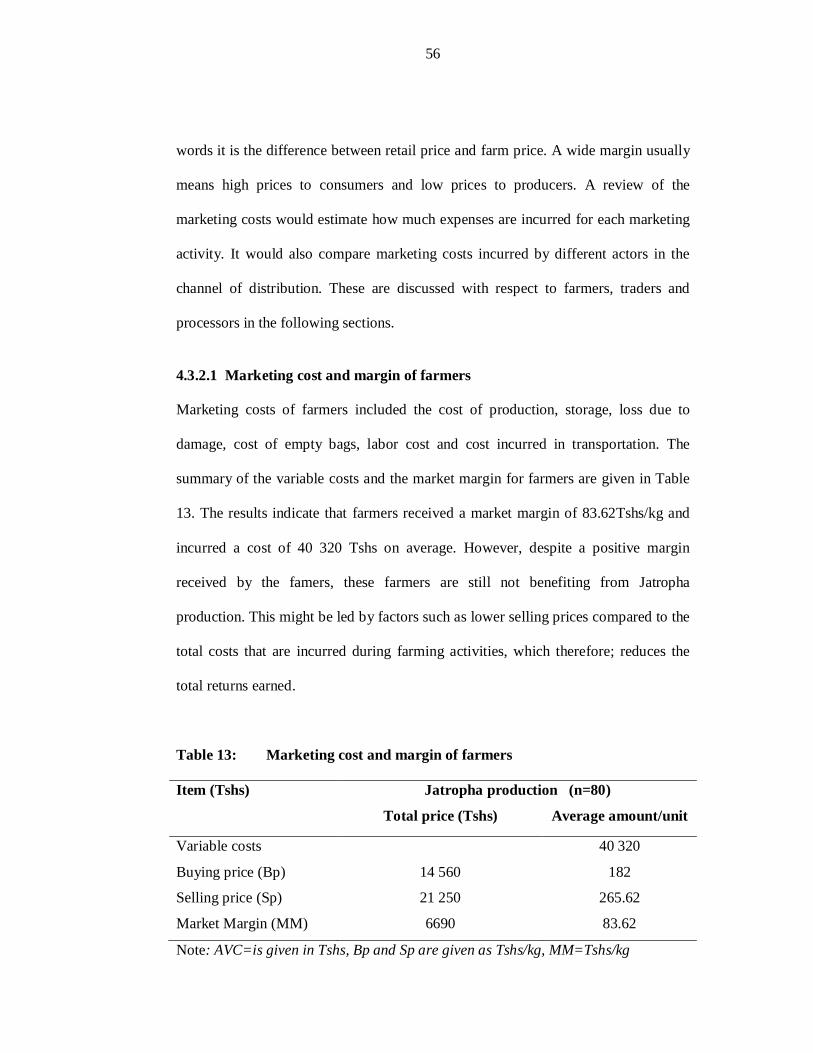
56
words it is the difference between retail price and farm price. A wide margin usually
means high prices to consumers and low prices to producers. A review of the
marketing costs would estimate how much expenses are incurred for each marketing
activity. It would also compare marketing costs incurred by different actors in the
channel of distribution. These are discussed with respect to farmers, traders and
processors in the following sections.
4.3.2.1 Marketing cost and margin of farmers
Marketing costs of farmers included the cost of production, storage, loss due to
damage, cost of empty bags, labor cost and cost incurred in transportation. The
summary of the variable costs and the market margin for farmers are given in Table
13. The results indicate that farmers received a market margin of 83.62Tshs/kg and
incurred a cost of 40 320 Tshs on average. However, despite a positive margin
received by the famers, these farmers are still not benefiting from Jatropha
production. This might be led by factors such as lower selling prices compared to the
total costs that are incurred during farming activities, which therefore; reduces the
total returns earned.
Table 13: Marketing cost and margin of farmers
Item (Tshs) Jatropha production (n=80)
Total price (Tshs) Average amount/unit
Variable costs 40 320
Buying price (Bp) 14 560 182
Selling price (Sp) 21 250 265.62
Market Margin (MM) 6690 83.62
Note: AVC=is given in Tshs, Bp and Sp are given as Tshs/kg, MM=Tshs/kg

57
4.3.2.2 Marketing cost and margin of traders
The marketing cost and margin for traders in the study area are summarized in Table
14. On average, the total marketing cost of the Jatropha traders was 97 662 Tshs. The
main costs covered by the traders included storage costs, loss due to damage, cost of
empty bags, labor/wage cost and transportation cost. The market margin for the
traders was 302Tshs/kg. The results show that the traders bought Jatropha seeds from
the farmers at a lower price compared to the price set by the farmers. This might be
one of the reason which justifies that majority of the agricultural farmers in Tanzania
in a monopolistic market are still not price setters. Moreover, the marketing costs of
the traders were higher compared to those of the farmers.
4.4.2.3 Marketing cost and margin of processors
The most important costs covered by the processers included the expelling service
fees (processing cost), production cost of soaps, labour and transportation cost (Table
15). On average, the total marketing cost for processors were 2 279 500 Tshs. Results
obtained show that the market margins of the processors for oil/fuel, soaps, and
fertilizer were 250Tshs/litre, 500Tshs/piece and 500Tshs/kg respectively.
Table 14: Marketing cost and margin of traders
Item (Tshs) Jatropha marketing (n=25) Total price
(Tshs) Average amount/unit
Variable costs 97 662 Buying price (Bp) 5250 210 Selling price (Sp) 12 800 512

58
Market Margin (MM) 7550 302 Note: AVC=is given in Tshs, Bp and SP are given as Tshs/kg, MM=Tshs/kg Table 15: Marketing cost and margin of processors
Cost item (Tshs/unit) Jatropha processing (n=5) Average cost/unit
(Tshs/ltr/pc/kg) Average Variable Costs (AVC) 2 279 500 Buying price (oil) 3500 Selling price (oil) 3750 Market Margin(1) 250 Buying price (soaps) 500 Selling price (soaps) 1000 Market Margin(2) 500 Buying price (fertilizer) 2500 Selling price (fertilizer) 3000 Market Margin(3) 500 Market Margin pr (1+2+3) 1250 Consumer price (oil) 3750 Consumer price (soaps) 1000 Consumer price (fertilizer) 3000 Note: AVC=is given in Tshs, Bp fertilizer and Sp fertilizer are given in Tshs/kg, Bp oil and Sp oil are given in Tshs/litre, Bp soaps and Sp soaps are given in Tshs/piece.
The overall margin was 1 250 Tshs. Jatropha processors seemed to have received a
higher market margin compared to other actors in the Jatropha market chain.
Consumer prices for different Jatropha products are also shown in the Table 15.
According to the results in Table 15, it is clear that the market margin for processors
was higher compared to the rest ranging from 250 to 500 Tshs. Farmers seemed to
have received lower market margin (83.62Tshs/kg) compared to the rest. Selling and
buying prices were used to calculate the market margins for the farmers, traders and
processors. The high market margin reflects less income for the farmer and more
benefit for the other market functionaries. This therefore, brings a justification as to
why the Tanzanian Government should intervene in order to facilitate the actors
especially Jatropha farmers to increase production and productivity of Jatropha per

59
unit area of land, since it is a better alternative to increase marketable supply of
Jatropha produces and increase their income. Introduction of improved varieties,
application of chemical fertilizers, use of modern technologies, controlling disease
and use of pesticides should be promoted to increase Jatropha production.
4.3.3 Interface pricing efficiency analysis
A simple regression analysis was done in order to find the correlation between
market margin, buying and selling prices. The interface pricing efficiency model
(Schmidt, 1979) was used for this particular analysis so as to determine whether or
not price changes were passed onto the next market level i.e. the perfect market
transparency. This approach was also used by Gabagambi (1998) in his study of rice
marketing in Ulanga District.
The analysis was carried out to find the extent to which selling price, buying price
and market margin are correlated to each other from farmers and traders. The
analysis was performed and the results are presented in Table 16. Positive correlation
coefficient between marketing margin and selling prices at various levels suggest that
as selling price increase at one level, marketing margins increases as well. Results
indicate that selling and buying prices at the farmers’ level were highly correlated
with each other (r > 0.713; p=0.01). At the traders’ level it is observed that there was
a correlation between the selling prices and the market margin (r > 0.941; p=0.01)
and (r>-.346; p=0.05). The findings indicate that buying and selling prices at
farmers’ level were highly correlated with one another. The positive correlation
coefficient between marketing margin and selling price implies that as selling price
increases at the farmer’ level, marketing margin increases as well. This suggests that
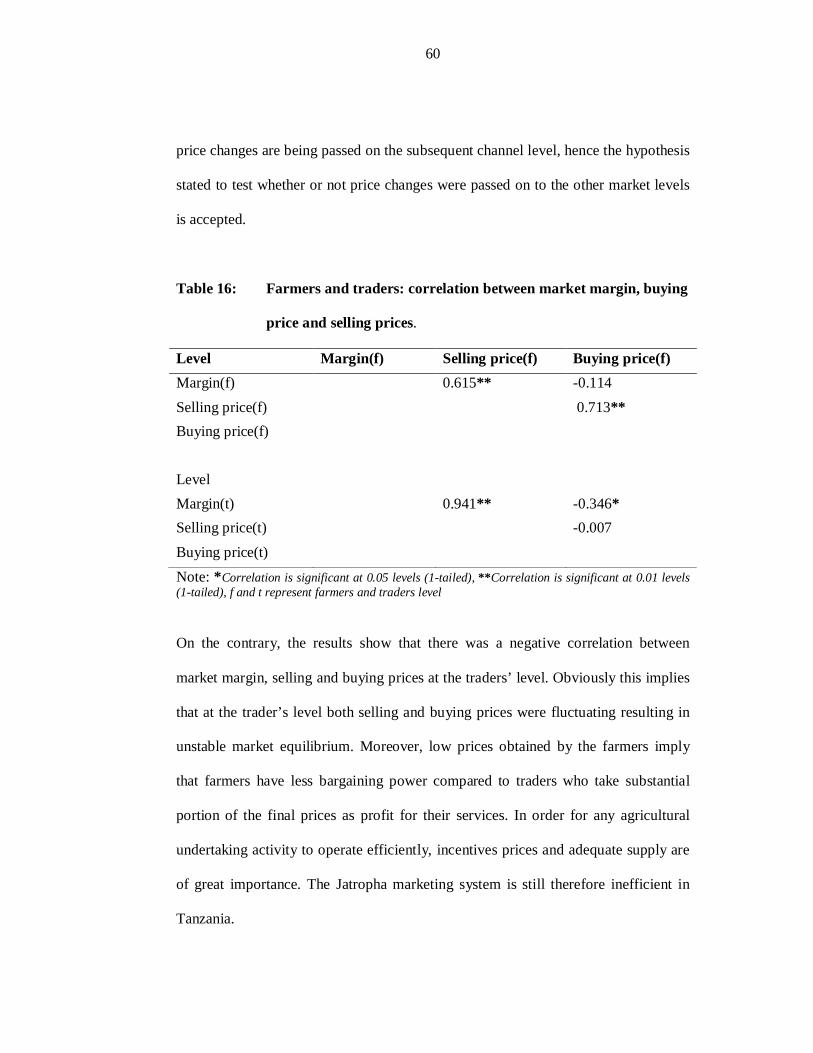
60
price changes are being passed on the subsequent channel level, hence the hypothesis
stated to test whether or not price changes were passed on to the other market levels
is accepted.
Table 16: Farmers and traders: correlation between market margin, buying
price and selling prices.
Level Margin(f) Selling price(f) Buying price(f) Margin(f) 0.615** -0.114 Selling price(f) 0.713** Buying price(f) Level Margin(t) 0.941** -0.346* Selling price(t) -0.007 Buying price(t) Note: *Correlation is significant at 0.05 levels (1-tailed), **Correlation is significant at 0.01 levels (1-tailed), f and t represent farmers and traders level
On the contrary, the results show that there was a negative correlation between
market margin, selling and buying prices at the traders’ level. Obviously this implies
that at the trader’s level both selling and buying prices were fluctuating resulting in
unstable market equilibrium. Moreover, low prices obtained by the farmers imply
that farmers have less bargaining power compared to traders who take substantial
portion of the final prices as profit for their services. In order for any agricultural
undertaking activity to operate efficiently, incentives prices and adequate supply are
of great importance. The Jatropha marketing system is still therefore inefficient in
Tanzania.
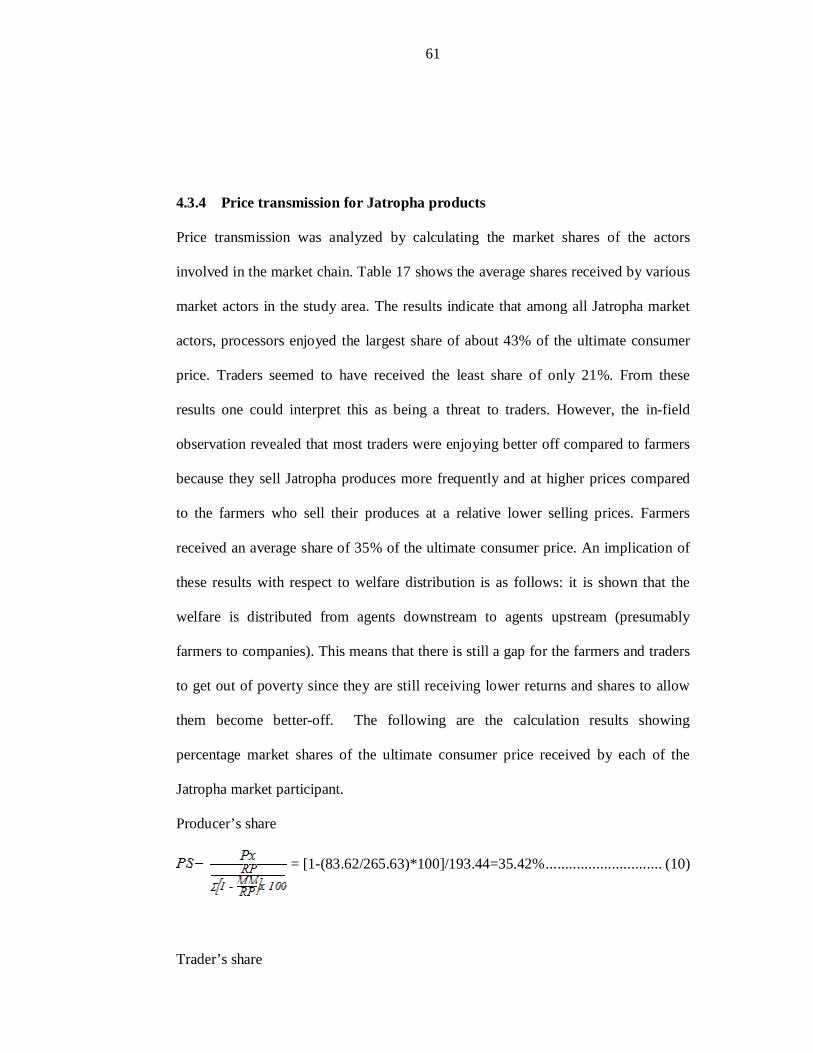
61
4.3.4 Price transmission for Jatropha products
Price transmission was analyzed by calculating the market shares of the actors
involved in the market chain. Table 17 shows the average shares received by various
market actors in the study area. The results indicate that among all Jatropha market
actors, processors enjoyed the largest share of about 43% of the ultimate consumer
price. Traders seemed to have received the least share of only 21%. From these
results one could interpret this as being a threat to traders. However, the in-field
observation revealed that most traders were enjoying better off compared to farmers
because they sell Jatropha produces more frequently and at higher prices compared
to the farmers who sell their produces at a relative lower selling prices. Farmers
received an average share of 35% of the ultimate consumer price. An implication of
these results with respect to welfare distribution is as follows: it is shown that the
welfare is distributed from agents downstream to agents upstream (presumably
farmers to companies). This means that there is still a gap for the farmers and traders
to get out of poverty since they are still receiving lower returns and shares to allow
them become better-off. The following are the calculation results showing
percentage market shares of the ultimate consumer price received by each of the
Jatropha market participant.
Producer’s share
= [1-(83.62/265.63)*100]/193.44=35.42% .............................. (10)
Trader’s share

62
= [1-(302/512)*100]/193.44=21.21% ..................................... (11)
Processor’s share
= [1-(1250/7750) x 100]/193.44 = 43.37% ........................... (11)
Table 17: Average market shares received by various market participants
Market
participant
AVC ASP MM Average share
(Sum)
Percent
(%)
Producers 40 320 265.63 83.62 68.52 35.42
Traders 97 662 512 302 41.02 21.21
Processors 2 279 500 7750 250 83.9 43.37
Overall 2 417 482 8527.63 1635.62 193.44 100
Note: ASP, AVC, MM stand for Average selling price, Average variable cost and Market Margin respectively.
4.4 Socio-economic characteristics of respondents
4.4.1 Age of respondents
Regnard (2006) urges that the total accumulation of wealthy is highly dependent on
age of an individual, whereby a direct relationship is experienced. Likewise, age
determines individual maturity and ability to make rational decisions. Moreover,
Mlambiti, (1994) shows that age structure can be used to facilitate an understanding
about labour potential of a specific population. Results in Table 18 give a summary
of average ages for Jatropha farmers and traders interviewed. Farmers across the
study area were middle aged ranging between 26-55 years with an average of 46
years of age. This means that majority of Jatropha farmers were within the working

63
age group. This brings an implication on the roles and responsibilities in the society
in terms of Jatropha production and marketing throughout the year. The mean age of
traders was 41 years and about 80% of traders’ age was ranging from 26 to 55 years,
implying that Jatropha marketing along the market chain is performed by the
economically active group in the population.
Table 18: Age of the respondents
Statistics Farmers (80) Traders (25) Total (80) Average age 46 41 43.5 Age group Percent (%) distribution within the group 18- 25 14 20 8.5 26 –55 75 80 74.6 Above 56 11 16.9
4.4.2 Education level of respondents
Existing literatures show that education contributed 50% of variation in the total
agricultural output in Tanzania (Amani et al., 1989). Table 19 gives a summary of
education levels of the Jatropha market participants interviewed. Results show that
majority of farmers (65%) have acquired primary education. This implies that
Jatropha farmers in the study area have a modest basic knowledge that can be used to
improve production of Jatropha which does not require much agronomic skills since
it is a perennial crop that is self caring (Ohler, 1979). Moreover, results indicate that
majority of the traders (56%) have acquired primary education. This implies that
traders in the study area have a basic knowledge that can be used to improve
agricultural marketing for Jatropha. This literacy level of the traders is encouraging
because it has an influence on carrying out basic marketing activities at optimal
level. However, Jatropha marketing has still remained underdeveloped in these areas.
It is also shown that large populations (80%) of the respondents from the companies
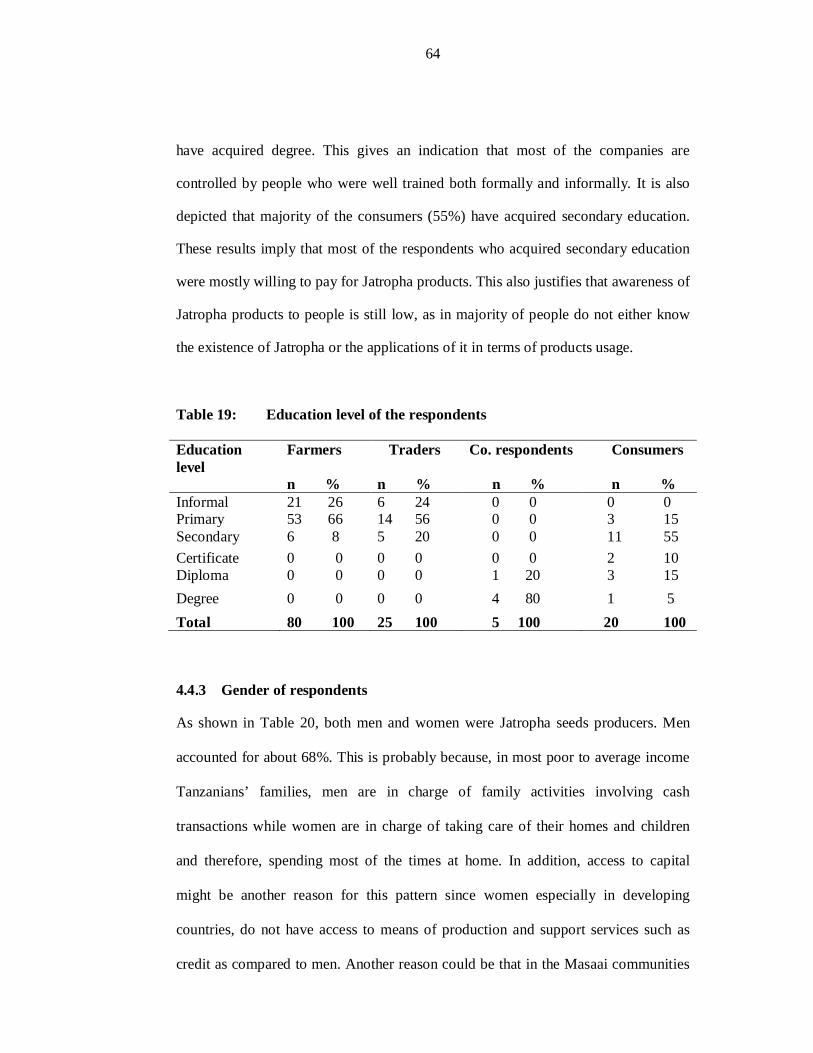
64
have acquired degree. This gives an indication that most of the companies are
controlled by people who were well trained both formally and informally. It is also
depicted that majority of the consumers (55%) have acquired secondary education.
These results imply that most of the respondents who acquired secondary education
were mostly willing to pay for Jatropha products. This also justifies that awareness of
Jatropha products to people is still low, as in majority of people do not either know
the existence of Jatropha or the applications of it in terms of products usage.
Table 19: Education level of the respondents
Education level
Farmers Traders Co. respondents Consumers
n % n % n % n % Informal 21 26 6 24 0 0 0 0 Primary 53 66 14 56 0 0 3 15 Secondary 6 8 5 20 0 0 11 55 Certificate 0 0 0 0 0 0 2 10 Diploma 0 0 0 0 1 20 3 15 Degree 0 0 0 0 4 80 1 5 Total 80 100 25 100 5 100 20 100
4.4.3 Gender of respondents
As shown in Table 20, both men and women were Jatropha seeds producers. Men
accounted for about 68%. This is probably because, in most poor to average income
Tanzanians’ families, men are in charge of family activities involving cash
transactions while women are in charge of taking care of their homes and children
and therefore, spending most of the times at home. In addition, access to capital
might be another reason for this pattern since women especially in developing
countries, do not have access to means of production and support services such as
credit as compared to men. Another reason could be that in the Masaai communities

65
normally men are the heads of their families as well as owners of the production
resources like capital and land. This is the common phenomena in African traditional
societies (Misana, 1995). Moreover, 52% of the traders were women. The reason
behind this observation could be that women were the main participants of the
trading activities in their villages. That is, women play a greater role in trading
activities since majority of men in masaai societies were particularly engaged in
livestock keeping and farming while women performed other activities as household
keeping and business. Results also indicate over fifty percent (60%) of the workers
from Company were men. Consumers of the Jatropha products were equally
distributed; this means both men and women accounted for about 50%.
Table 20: Gender of the respondents
Variable category
Farmers (n=80)
Traders (n=25)
Processors (n=5)
Consumers (n=20)
n % n % n % n % Sex
Male 54 68 12 48 3 60 10
50
Female 26 32 13 52 2 40 10 50
4.4.4 Main source of income
Most of the interviewed farmers (68%) were involved in other income generating
activities such as farming and livestock keeping. The reason for diversification is
probably that Jatropha marketing is still an emerging market and cannot be relied
upon as a sole source of income to cater for the basic needs during the whole year.
Results also indicate that 44% of the traders earned income from both business and
farming activities implying that Jatropha traders also diversified their main source of
income generation (Table 21).

66
Table 21: Main income sources of respondents.
Activity Farmers
n %
Traders
n %
Farming activities 4 5 10 40
Livestock keeping 0 0 3 12
Business activities 0 0 1 4
Farming & business activities 8 10 11 44
Farming & livestock keeping 54 68 0 0
Farming, livestock keeping & business
activities 14 18 0 0
4.4.5 Housing structure of respondents
The study results identified that 87.5% of the farmers were living in simple mud
walls with thatched roofing houses while only 12.5% of the respondents lived in
consolidated mud walls with iron sheet roofing. None of the respondents lived in the
brick walls tiled or iron sheet roofing (Table 22). Therefore, majority of farmers in
the study area were still living under poor settlement reflecting a low level of income
from their Jatropha production activities.
Table 22: Housing structure of the farmers.
House structure Frequency Percent
Brick walls tiled or iron sheet roofing
0 0
Consolidated mud walls with iron sheet roofing
10 12.5
Simple mud wall with thatched 70 87.5
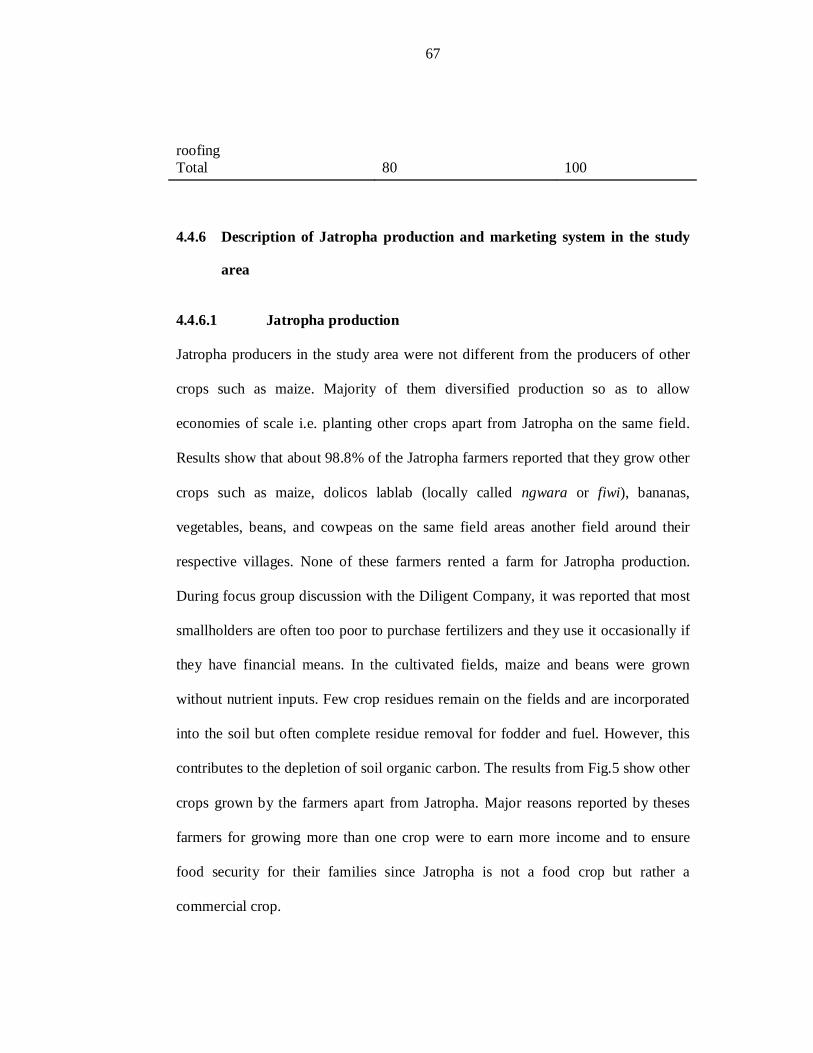
67
roofing Total 80 100
4.4.6 Description of Jatropha production and marketing system in the study
area
4.4.6.1 Jatropha production
Jatropha producers in the study area were not different from the producers of other
crops such as maize. Majority of them diversified production so as to allow
economies of scale i.e. planting other crops apart from Jatropha on the same field.
Results show that about 98.8% of the Jatropha farmers reported that they grow other
crops such as maize, dolicos lablab (locally called ngwara or fiwi), bananas,
vegetables, beans, and cowpeas on the same field areas another field around their
respective villages. None of these farmers rented a farm for Jatropha production.
During focus group discussion with the Diligent Company, it was reported that most
smallholders are often too poor to purchase fertilizers and they use it occasionally if
they have financial means. In the cultivated fields, maize and beans were grown
without nutrient inputs. Few crop residues remain on the fields and are incorporated
into the soil but often complete residue removal for fodder and fuel. However, this
contributes to the depletion of soil organic carbon. The results from Fig.5 show other
crops grown by the farmers apart from Jatropha. Major reasons reported by theses
farmers for growing more than one crop were to earn more income and to ensure
food security for their families since Jatropha is not a food crop but rather a
commercial crop.
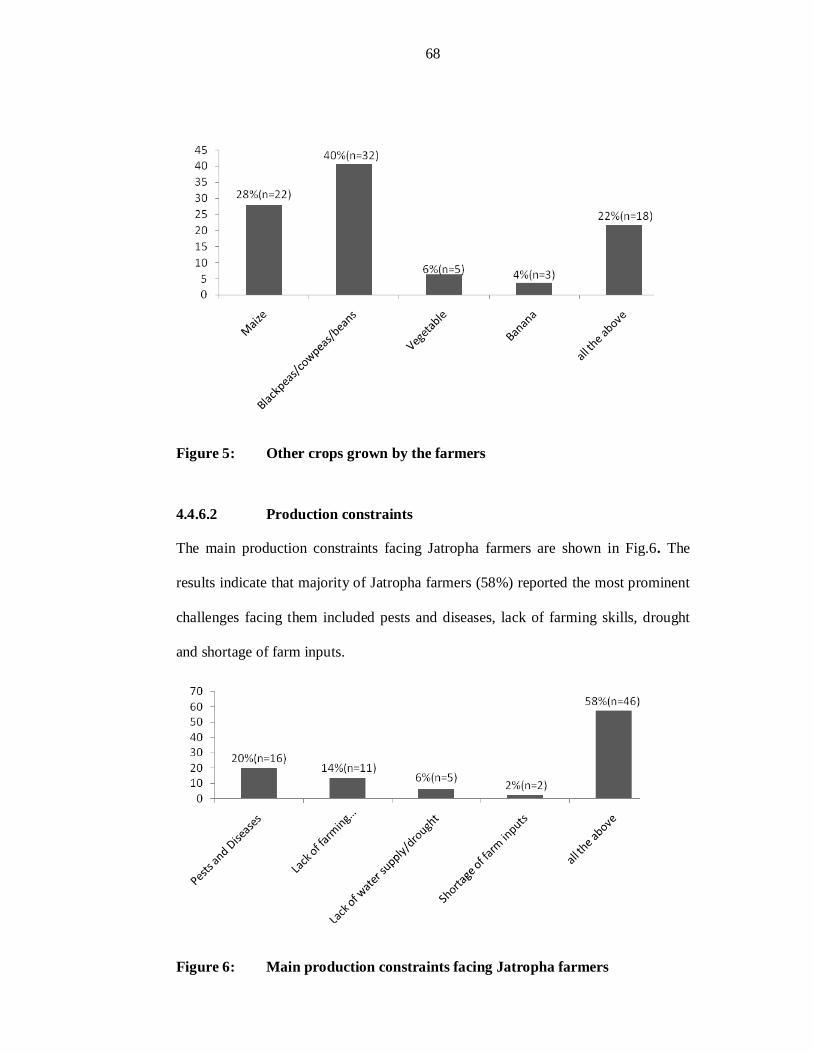
68
Figure 5: Other crops grown by the farmers
4.4.6.2 Production constraints
The main production constraints facing Jatropha farmers are shown in Fig.6. The
results indicate that majority of Jatropha farmers (58%) reported the most prominent
challenges facing them included pests and diseases, lack of farming skills, drought
and shortage of farm inputs.
Figure 6: Main production constraints facing Jatropha farmers

69
4.4.6.3 Jatropha marketing
The results for market supply of Jatropha seeds in the study area show that the
majority of farmers (87%) did not sell Jatropha seeds throughout the year. This
observation could be due to reasons that majority of farmers were still facing
production problems such as pests and diseases, lack of farming skills, training and
extension services, lack of reliable water supply and shortage of farm inputs which
limit Jatropha production and therefore, limits the availability of enough seeds to sell
throughout the year. Traders were affected in one way or another by the nature of the
market supply for Jatropha seeds. Further evidence is given by the results in Fig. 7
that many traders were forced to sell other crops apart from Jatropha seeds because
they could not just rely on it as their sole marketing crop because its availability was
seasonal. The results indicate that the majority of traders (68%) did not just sell
Jatropha seeds but also other crops such as maize, dolicos lablab (locally known as
ngwara or fiwi), bananas, beans and vegetable. Maize (32%) and dolicos lablab
(40%) farming was reported to be dominant grown basically due to their socio-
economic role in terms of food security for the household.
Figure 7: Percent of traders selling other crops apart from Jatropha

70
4.4.6.4 Marketing constraints
The main marketing problems facing Jatropha traders and processors while selling
the Jatropha seeds are shown in Table 23. The results indicate that transportation
barriers, shortage of seeds/seasonal supply of seeds, low selling prices and limited
markets accounted for 52% of the marketing constraints experienced by the Jatropha
traders while low availability of Jatropha seeds, low technology used in processing,
pricing problems, promotion and distribution problems, lack of market and
marketing skills accounted for 80% of the marketing problems faced by Jatropha
seed processors.
Table 23: Main marketing problems facing Jatropha traders and processors
Constraints Frequency Percent For traders Transportation problems 3 12 Shortage of seeds/seasonal supply of seeds
3 12
Low selling price 4 16
Limited market 2 8 All the above 13 52 Total 25 100
For processors Promotion and distribution problems
1 20
All the above 4 80 Total 5 100

71
CHAPTER FIVE
5.0 CONCLUSIONS AND RECOMMENDATIONS
The main objective of the study was to analyze the market efficiency for Jatropha in
Monduli and Arumeru Districts. Moreover, the study intended to achieve the
following specific objectives: (i) to assess the Jatropha marketing channels and
marketing power among actors, (ii) to determine the pricing efficiency of the
Jatropha marketing chain, (iii) to analyse the market margins and gross margins of
the Jatropha farmers, traders and processors and (iv) to analyse the price
transmissions from the producer to ultimate consumption and utilization. Both
secondary and primary data were collected for the study. This chapter presents the
conclusions and recommendations emerging from the major findings of the study.
5.1 Conclusions
The study revealed that the existing Jatropha market channels involved a number of
channels and not just one single channel. The Jatropha market channels are limited to
farmers, traders (wholesalers and retailers), Jatropha processors and ultimately to
consumers. Tendency of small number of consumers’ preference on purchasing
Jatropha products might be one of the reasons that make Jatropha farmers
unconcentrated. The Jatropha marketing for traders is non- competitive due to the
existence of a weak oligopolistic market structure.
Buying and selling prices at the producers’ level were highly correlated with one
another. The positive correlation coefficient between marketing margin and selling

72
price indicate that as selling price increases at the farmers’ level, marketing margin
increases as well. On the contrary, there was a negative correlation between market
margin, selling and buying prices at the traders’ level. Obviously this implies that at
the trader’s level both selling and buying prices were fluctuating resulting in unstable
market equilibrium. Low prices obtained by the producers suggests that they have
less bargaining power compared to traders who take substantial portion of the final
prices as profit for their services. In order for any agricultural undertaking activity to
operate efficiently, incentive prices and adequate supply are of great importance. The
Jatropha marketing system is still therefore inefficient in Tanzania.
Processors were found to earn higher gross margins compared to Jatropha farmers
and traders. Processors also received a large share of the final consumer price
compared to the farmers and traders. However, Jatropha traders seemed to have
higher market margins compared to the farmers. Farmers have been found to accept
low prices because of factors such as lack of awareness of the prevailing market
prices, lack of cash, or means to efficiently transport their produce to the markets.
Furthermore, processors incurred higher costs compared to farmers and traders.
Generally, the Jatropha marketing is still inefficient.
The most prominent constraints facing the Jatropha farmers included pests and
diseases, unreliable rainfall, lack of farming skills, training and extension services for
Jatropha production and the shortage of farming inputs. These problems reduced
production and prevented the realization of potential income gained by Jatropha
farmers. Traders and processors faced the following marketing problems: high

73
transportation costs, low selling prices, limited markets, low technology for
processing, promotion and distribution problems and lack of markets and marketing
skills.
From above findings, this study indicates clearly that Jatropha production and
marketing are potentially profitable activities, not only to the actors’ perspective but
also in the environment basis. However, it is evident that these actors especially the
farmers and traders in the study areas have not yet received full potential benefits of
producing and marketing Jatropha produces. Marketing arrangements in terms of
prices arrangement also do not provide adequate satisfaction to Jatropha farmers,
traders and processors. Therefore, immediate measures on how to solve these
problems should be undertaken so as to enable the Jatropha market chain to be
efficient and profitable to all the actors especially the farmers who are the backbone
of the whole system.
5.2 Recommendations
Based on the results of the study, the following are the recommendations and policy
implications directed towards improving the performance of the Jatropha production
and marketing.
5.2.1 Strengthening and promoting groups of actors in the Jatropha
marketing
Efficient coordination of this Jatropha value chain is critical. The integration can be
realized if deliberate efforts are made to have a well coordinated information flow on
proper Jatropha production and marketing methods and a targeted training of actors

74
including consumers. The establishment of well coordinated and organized Jatropha
marketing will bring development in the energy sector as well as increase income
and provide employment for the majority. A variety of approaches are possible and it
would be important to explore and introduce potential interventions such as
formation of cooperatives and marketing groups. Such kind of associations and
groups are usually influential in provision of information and influencing price
formation. They will also provide a forum for training, networking and organizing
marketing of Jatropha in the country as a whole. Furthermore, knowledge on good
agronomic practices, storage systems, market activities, group-formations and credits
accessibility should be imparted to the chain actors. The provision of extension
services can help to improve market participation among the Jatropha actors. The
Government should also seek for a possibility of promoting farm-level processing of
Jatropha seeds to enable forward linkage of farmers in value addition-hence more
benefits.
5.2.2 Formulation of policies guiding Jatropha marketing
The policy implication in this aspect is for the government to formulate a policy to
stimulate local markets for the Jatropha products and exportation of surplus products.
The government also needs to develop a policy that restricts monopolization of the
development of Jatropha activities in order to develop a fair balance of demand and
supply and ensure biofuel development ‘by local people for local people’ in a
sustainable manner. Another policy implication is for the government to facilitate the
development of many demonstration sites that use Jatropha oil as a fuel for road
transport. Moreover, public and private sector partners to promote Jatropha industry
are needed. The promotional activities might include seminars, conferences and

75
Jatropha uses demonstrations in a massive way to create customer, producer and
other stakeholders’ awareness. There is a need to have an institutional framework to
guide Jatropha contracts or to develop a contractual model to help rural dwellers
when signing contracts with Jatropha private investors. Implementing all these will
therefore provide an efficient Jatropha market system in the country.
5.2.3 Strengthening the pricing behaviours and market information system
Generally the traders are capable of sourcing reliable price and buyer information
from different sources whereas farmers rely on other farmers and government
extension staff for the same information. There is therefore a great need to make
market information available to farmers at the right time and place. In response to
this challenge, it is good to develop an integrated agricultural marketing information
system that will be linked to Jatropha traders and processors and finally to the
Government Biofuel Task Force which is connected to the energy sector.
5.2.4 Intervention to increase Jatropha production and productivity
The quantity of Jatropha produced at the farm level tends to affect the market supply
of Jatropha produces positively and significantly. However, farmers are still working
under limited plots of land without using improved technologies and inputs. Jatropha
producers in the study areas used limited inputs (like improved seeds, pesticides and
insecticides and modern technologies) or in some cases not any at all. Hence,
increasing production and productivity of Jatropha seeds as per unit area of land are
better alternatives to increase marketable supply of Jatropha produce. Application of
fertilizers, controlling pests and disease practices should be encouraged so as to
increase Jatropha production. Availability of enough seeds will also allow other

76
actors in the chain such as processors to increase production of other outputs such as
fuel or oil, soaps and fertilizers which are of use to many consumers. Jatropha
processors should also be provided with modern machines for processing the
Jatropha seeds so as to allow extraction of a high quality products i.e. fuel or oil
consistently in order to meet the requirements of energy demand not only at the
national level but also at the international level.

77
REFERENCES
Acharya, S. S. (2006). Agricultural Marketing and Rural Credit for Strengthening
Indian Agriculture. Asian Development Bank, New Dehli, India. 12pp.
Agarwal, S. P. (1986). Sense of deprivation and intelligence. Journal Institute of
Educational Research 10 (3): 1 – 4.
Alain, V. Y., Qureshi, N., Yukawa, H. and Blaschek, H. P. (2011). Biomass to
Biofuels: Strategies for Global Industries. John Wiley and Sons, New York,
United State of America. 120pp.
Amani, H. K. R. (2006). Agricultural Development and Food Security in the Sub-
Saharan Africa (SSA), Case of Tanzania. Economic and Social Research
Foundation (ESRF), Rome, Italy. 2pp.
Amani, H. K. R. (1992). Agricultural Market Reforms in Tanzania: Evolution,
Performance and Future Policy Issues. In: Market Reforms and Parastatal
Restructuring in Tanzania. (Edited by Bagachwa, M.), University of Dar es
Salaam, Dar es Salaam, Tanzania. pp. 116 - 132.
Angelini, L. G., Ceccarini, L., and Bonari, E. (2005). Biomass yield and energy
balance of giant reed (Arundodonax L.) cropped in central Italy as related to
different management practices. Europeen Journal of Agronomy 22: 375 –
389.

78
Ashimogo, G. (1994). Peasant grain storage and marketing in Tanzania: A Case
Study of Maize in Sumbawanga District. Thesis for Award of PhD at
University of Berlin, Berlin, Germany, 208pp.
Babbie, E. (1990). The Practice of Social Research. Wadswohrt Publishing
Company, California, United State of America. 101pp.
Bailey, T. C. (1998). Multivariate statistical analysis for geographers. Journal of
Regional Science 38 (4): 682 – 686.
Bryceson, D. F. (1994). Too many assumptions: researching grain markets in
Tanzania. Nordic Journal of African studies 3(1): 29 - 44.
Caniëls, M. and Romijn, H. (2008). Strategic niche management: towards a policy
tool for sustainable development. Journal of Technology Analysis and
Strategic Management 20 (2): 245 - 266.
Castle, E. N., Manning, H., Becker, M. H. and Gene Nelson, A. G. (1987). Farm
Business Management: the Decision-Making Process. Macmillan
Publishing, New York, United State of America. 335pp.
Chachage, B. (2003). Jatropha Oil as a Renewable Fuel for Road Transport: Policy
Implications for Technology Transfer in Tanzania. International Institute for
Industrial Environmental Economics, Stockholm, Sweden. 147pp.

79
Conliffe, A. and Kulovesi, K. (2008). Renewable Energy in Africa. International
Institute for Sustainable Development (IISD), Winnipeg, Canada. 149pp.
Coulter, J. and Onumah, G. E. (2001). The impact of government policy and
regulation on the effectiveness of warehouse receipt systems, the case of
Africa. In: Proceedings of Warehouse Financing: Making the Difficult
Deals Easier and Profitable. (Edited by Elizabeth, B. A. et al.), 9 - 11 July
2001, Amsterdam Netherland. 125 – 130pp.
Cramer, G. L., Jensen, C. W. and Southgate, D. D. (2001). Agricultural Economics
and Agribusiness. Wileysons Inc., Newyork, United State of America.
925pp.
CRFA (June 2006). Biofuels around the world. [http://www.greenfuels.org/biodiesel
/world.htm] site visited on 24/1/2011.
Crizontoka, M., Kotabe, M. and Mercer, D. (1997). Marketing Management: Text
and Cases. Blackwell Business, Massachusetts, United State of America.
19pp.
Devine, P. S., Lee, N., Jones, R. M., and Tyson, W. J. (1984). An Introduction to
Industrial Organization. George Allen and Unwin, London, United
Kingdom. 32pp.

80
DucHai, L. T. (2003). The organization of the liberalized rice market in Vietnam.
Thesis for Award of PhD Degree at University of Groningen, Groningen,
Netherlands, 236pp.
Ebbeden, J. (Mai 2004). The importance of gross margin. [http://www.inc.com/
resources/ starlamp/article/20041201/gmhtm] site visited on 17/1/2011.
Eijck, J. A. J. (2006). Transition towards Jatropha biofuels in Tanzania: an analysis
with strategic niche management. Dissertation for Award of MSc Degree at
Eindhoven University of Technology, Eindhoven, Netherlands, 102pp.
Eijck, J. and Romijn, H. (2008). Prospects for Jatropha biofuels in Developing
Countries: analysis for Tanzania with niche management. Energy Policy 36:
311 - 325.
FAO (1999). A Guide to Maize Marketing for Extension Workers. Food and
Agricultural Organization, Rome, Italy. 15pp.
Ferris, A. and Malcolm, B. (2000). Farm Management of Economic Analysis.
University of Melbourne Parkville Victoria, Melbourne, Australia. 679pp.
Food and Agriculture Organization of the United Nations (2005). Addressing
Marketing and Processing Constraints that Inhibit Agri-Food Experts: a
Guide for Policy Analysts and Planners. Food and Agriculture
Organization. Rome, Italy. 90pp.
81
Fox, P., Rockstrom, J. and Barron, J. (2005). Risk analysis and economic viability of
water harvesting for supplemental irrigation in semi-arid Burkina Faso and
Kenya. Agricultural Systems 83: 231 - 250.
Gabagambi, D. M. (1998). Production and marketing of paddy and cotton in Ulanga
District. Dissertation for Award of MSc Degree at Sokoine University of
Agriculture, Morogoro, Tanzania, 122pp.
GEXSI (2008). From Aid to Market: the Global Exchange for Social Investment.
World Wide Fund for Nature, Berlin, Germany. 36pp.
GEXSI (2007). Global Jatropha study. [http://www.Jatropha-alliance.org/fileadmin
/documents/GEXSI_Global-Jatropha-Study_FULL-REPORT.pdf] site
visited on 11/3/2011.
Giles, G. B. (1973). Marketing the English Language Book Society and Macdonald.
Evans ltd, London, United Kingdom. 43pp.
Gubitz, G. M., Mittelbach, M. and Tradi, M. (1999). Exploitation of the tropical oil
seed plant Jatropha curcus. Elsevier Journal of Bioresource Technology
67: 73 - 82.

82
Harahap, H. (2003). Rice Chain Analysis in North Sumatra, Indonesia. Institute Rice
improvement in Eastern, Central and Southern Africa. In: Proceedings of
the International Rice Workshop. (Edited by Pathak, M. D. and Zeyaur, R.
K.), 9 -19 April 2003, Lusaka, Zambia. 67 - 82pp.
Hardwick, P., Khan, B. and Langmead, J. (1996). An Introduction to Modern
Economics. Addison Wesley Longman Publishing, New York, United State
of America. 589pp.
Hazel, P., Poulton, C., Wiggins, S. and Dorward, A. (2007). The Future of Small
Farms for Poverty Reduction and Growth. International Food Policy
Research Institute (IFPRI), Washington, DC, United State of America.
68pp.
Heller, J. (January 1996). Promoting the conservation and use of underutilized and
neglected crops like Jatropha curcas. [http://www.ipgri.cgiar.org/
publications /pdf/161.pdf] site visited on 14//1/2011.
Henning, K. (April 1998). Integrated utilization of Jatropha curcas plant. [http://
www. Jatropha.de] site visited on 19/1/2011.
Hervan, A. (March 2005). Oligopsony over oligopoly power and factor market
performance. [http://economics.csusb.ed/faculty/nilsson/courses/econ200/1]
site visited on 22/1/2011.
83
Ingram, V. (2009). Bees trade and success. Leisa Magazine 25: 22 - 24.
Janssen, R. (2006). Opportunities for biofuels in Tanzania. In: Global Forum in
Sustainable Energy – 6th Meeting Africa is Energizing Itself. (Edited by
WIP), 29 November – 1 December 2006, Vienna, Austria. 8 - 10pp.
Johnsen, F. H. (2003). Using gross margin analysis in the TARP 11-SUA projects.
Impacts: Lessons Learnt from Farmers-Oriented Research 4 (1): 19 - 21.
Kaplinsky, R. and Morris, M. (2000).A Handbook for Value Chain Research.
International Development Research Centre, Ontario, Canada. 324pp.
Kohls, R. L. and Uhl, O. N. (1990). Marketing of Agricultural Products. Macmillan
Publications Co., New York, United State of America. 170pp.
Kohls, R. L. and Uhl, J. N. (1985). Marketing of Agricultural Product. McMillan
Publishing Company, New York, United State of America. 52pp.
Kotler, P. (2008). Marketing Documentaries. Financial Times Prentice Hall, London,
United Kingdom. 209pp.
Kotler, P. (2005). Marketing Management. Pearson Education, New Jersey, United
State of America. 135pp.

84
Kotler, P. (2003). Analysis, Planning, Implementation, and Control of Marketing
(4thed.). Prentice Hall, New Jersey, United State of America. 121pp.
Kotler, P. and Armstrong, G. (2006). Principles of Marketing. Pearson Education,
New Jersey, United State of America. 651pp.
LARRRI and JOLIT (2008). Biofuel development in Africa: opportunities, threats
and challenges for rural small-holders in Tanzania. [http://tatedo.org
/cms/images/researchdocs/land-biofuel.pdf] site visited on 03/08/2011.
Lewandowski, I., Scurlock, J. M. O., Lindvall, E., Christou, M. (2003). The
development and current status of perennial rhizomatous grasses and energy
crops in the us and Europe. Biomass and Bioenergy 25: 335 - 361.
Loos, T. (2009).Socio-economic impact of a Jatropha-project on smallholder farmers
in Mpanda, Tanzania. A Case Study of a public-private-partnership project
in Tanzania. Thesis for Award of MSc Degree at University of Hohenheim,
Baden-Württemberg, Germany, 76pp.
Lundy, M. M. V., Gottret, W., Cifuentes, C. F., Ostertag, and Best, R., Peters, D. and
Ferris, S. (2004). Increasing the Competitiveness of Market Chains
Smallholder Producers. Centro Interactional de Agricultura Tropical, Cali,
Colombia. 21pp.
85
Lyewe, M. A. (2008). The local Jatropha value chain analysis in Tanzania.
Dissertation for Award of MBA Degree at Sokoine University of
Agriculture, Morogoro, Tanzania, 126pp.
Makeham, J. P. and Malcolm, L. R. (1986). Economics of Tropical Farm
Management. Cambridge University Press, United Kingdom. 468pp.
Manage, E. (June 2007). Regression analysis. [http://www.12manage.com/method
/regression/analysis.utml] site visited on 17/1/2011.
Menduoza, G. (1995). A Primer on Marketing Channels and Margins. Prices,
Products and People: Analyzing Agricultural Markets in Developing
Countries. Lynne Reinner Publishers, London, United Kingdom. 498pp.
Meyer, J. and von Cramon-Taubadel, S. V. (2004). Asymmetric price transmission: a
survey. Journal of Agricultural Economics 55(3): 581 - 611.
Mgaya, L. B. (2008). Value chain analysis of rice marketing in Kilosa district,
Morogoro, Tanzania. Dissertation for award of MSc Degree at Sokoine
University of Agriculture, Morogoro, Tanzania, 44 pp.
MoA/GTZ (2008). A Roadmap for Biofuels in Kenya. Ministry of Agriculture Kenya,
Nairobi. [http://regionalenergy-net.com/images/GoK-GTZ%20Biofuels%
20 Study.pdf] site visited on 04/07/11.

86
Mukwenda, E. B. J. (2005). Potential of using warehouse receipt system in financing
marketing in Tanzania under market liberalization. Dissertation for Award
of MSc Degree at Sokoine University of Agriculture, Morogoro, Tanzania,
56pp.
Mutabazi, K. D. S. (2007). Farmers’ Perceptions, attitude and adaptability to Rainfall
variability risks in dry land areas of Tanzania. A thesis submitted in
fulfilment of the Requirements for the Degree of doctor of philosophy of
SUA, Morogoro, Tanzania. 178pp.
Mutayoba, V. (2005). Economic analysis of vanilla production and marketing: case
study of Bukoba District in Kagera Region. Dissertation for Award of MSc
Degree at Sokoine University of Agriculture, Morogoro, Tanzania, 92pp.
NBS, Planning and Privatization (2003). Population and Housing Census. National
Bureau of Statistic, Dar es Salaam, Tanzania. 70pp.
NBS, Planning and Privatization (2002). Population and Housing Census. National
Bureau of Statistic, Dar es Salaam, Tanzania. 67pp.
Obstfeld, M. and Taylor, A. M. (1997). Non-linear aspects of goods-market arbitrage
and adjustment: Heckscher’s commodity points revisited. Journal of the
Japanese and International Economies 11: 441 - 479.
87
Philip, D. (2007). An exploration of the potential of producing biofuels and the
prospective influence of biofuels production on poverty alleviation in
Tanzania. [http://hss.ulb.uni-bonn.de/diss_online/landw _ fak/2007 /philip_
damas/1182. pdf] site visited on 06/3/2011.
Phiri, M. A. R., Mekuria, M, M. and Banziger, M. (2003). Assessment of
smallholder farmers’ utilization of improved maize seed in SADC Region:
A Study of Malawi, Tanzania, Zambia and Zimbabwe. CIMMYT, Harare,
Zimbabwe. 194pp.
Pickney, T. C. (1993). Is market liberalization compatible with food security?
Storage, trade and prices policy for maize in South Africa. Food Policy
Journal 18(4): 352 - 333.
Pomeroy, R. S. and Trinidad, A. C. (1995). Industrial Organization and Market
Analysis: Fish Marketing. In: Products and People: Analysing Agricultural
Markets in Developing Countries. (Edited by Scott, G. J.), Lynne Rienner
Publishers, London, United Kingdom. pp. 217 - 238.
Prakash, C. B. (1998). A Critical Review of Biodiesel as a Transportation Fuel in
Canada. Global Change Strategies International, Otawa, Canada. 12pp.
Raju, V. T. and Von Oppen, M. (1982). Marketing Efficiency for Selected Crops in
Semi-Arid Tropical India. International Crops Research Institute for the
Semi-Arid Tropics, Hyderabad, India. 50pp.
88
Robinson, S. and Beckerlegge, J. (2008). Jatropha in Africa, Economic Potential: the
Jatropha Miracle: a Quiet Revolution is Spreading Through Africa that
Could Have Enormous Economic Consequences and Yet is Attracting Very
Little Attention. Bio Diesel Fuels Inc., London, United Kingdom. 18pp.
Scarborough, V. and Kydd, J. (1992). Economic Analysis of Agricultural Markets.
Natural Resource Institute, Chatham, United Kingdom. 75pp.
Scherer, F. M. (1980). Industrial Market Structure and Economics Performance.
Rand Mealally College Publisher, Chicago, United State of America. 32pp.
Schmidt, G. (1979). Maize and Beans Marketing in Kenya: the Effectiveness and
Interaction of the Formal and Informal Systems. Institute of Development
Studies of University of Nairobi, Nairobi, Kenya. 36pp.
Senkondo, E. M. M., Msangi, A. S. K., Xavery, P., Lazaro, E. A. and Hatibu, N.
(2004). Profitability of rainwater harvesting for agricultural production in
selected semi-arid areas of Tanzania. Journal of Applied Irrigation Science
39(1): 65 – 81.
Sexton, R. and Zhang, M. (2001).An assessment of the impact of food industry
market power on U.S consumers. Agribusiness 17 (1): 59 - 79.

89
Shumaker, G. A. J., McKissick, C. F., and Doherty, B. (May 2003). A Study on the
feasibility of biodiesel production in Georgia. [http://www.agecon.uga.edu]
site visited on 22/1/2011.
URT (2011). Guidelines for the Preparation of Plan and Budget for 2011/12 within
the Five Year Development Plan Framework (2011/12 – 2015/16). Ministry
of Finance, Dar es Salaam, Tanzania. 179pp.
Von Lampe, M. (2006). Agricultural Markets Impacts of Future Growth in the
production of Biofuels. Organization for Economic Cooperation and
Development, Paris, France. 41pp.
Walsh, M. E., Ugarte, T. D. G., Shapouri, H. and Slinsky, S. P. (2003). Bioenergy
crop production in the United States: potential quantities, land use changes,
and economic impacts on the agricultural sector. Environmental Research
Economy 24: 313 - 333.
Zabaleta, I., Rapu, M., and Izoz, B. (2003). Assessing the technical efficiency of
horticultural production in Navarra, Spain. Agricultural Systems 78: 387 –
403.

90
APPENDICES
Appendix 1: Gross margins for Jatropha farmers and traders
Description Sales/Costs Percent (Tshs) (%)
Sales/Costs Percent (Tshs) (%)
Farmers GM Traders GM Average yield (kgs) 192.9375 268.72 Average price (Tshs/kg) 265.625 502 Average revenue (Tshs) 51249.02 134897.44 Less Averagevariablecost(Tshs) 40 320 97 662 AGM 10929.02 21.3
37235.44 27.6
Note: GM is given as (Tshs/kg) and AGM= Average gross margin

91
Appendix 2: Gross margins for Jatropha processors.
Activity(Sale/Cost) Quantity/unit
Selling price (Tshs)
Average amount(Tshs/kg/lrts/ pcs)
Average sale of seedcake (1) 361.56 Kgs 3000 1 084 680 Average sale of Jatropha oil/fuel (2)
162 Ltrs 3750 609 150
Average sale of Jatropha soaps (3) 1949 Pcs 1000 1 949 280 Sale of Jatropha seeds/seedlings to farmers (4)
1550 Kgs 250 387 500
Average expelling service charge/fee (5)
1 100 000
Average production cost of soaps (6)
419 500
Average transport charges + labor fees (7)
760 000
Average sale (1+2+3+4) 3 643 110 Average variable cost (5+6+7) 2 279 500 AGMpr 1363610 (37.42%) Note: AGMpr= Average gross margin for processors; ltrs=litres, pcs=pieces Average quantity of the seeds bought by the processors is 524kgJCL seeds, 0.69 of JCL seed content is cake, 0.31 of JCL seed content is oil

92
Appendix 3: FARMERS QUESTIONNAIRE
General information
Questionnaire no. … ……………Date of interview.……….. ………………………..
Interviewer’s name……………Farmer’s name ……………………………………
Division…………………………….Ward …………………………………………
Village………………………………
SECTION 1: FARMER’S CHARACTERISTICS (Fill the gap or circle one)
1.1 Respondent’s name……………………………………………………….
1.2 Gender i) Male ii) Female
1.3 Age i) under 18 years ii) Between 18-25 years iii) Between 26-55 years
iv) Above 56 years.
1.4 Marital status i) Single ii) Married iii) Widow(er) iv) Divorced/Separated
1.5 Education level i) No formal schooling ii) Adult literacy classes iii)
Primary school
iv) Secondary school v) Certificate vi) Diploma vii) Degree
1.6 Age of household head……………(years)
1.7 Gender of the household head i) Male ii) Female
1.8 What is your household size? i) Adults……………
ii) Children…………….
1.9 Type of shelter owned by respondent (if more than one, please
characterize the main building) i) Brick walls, tiled or iron sheet roofing
ii) Consolidated mud walls, with iron-sheet roofing iii)Simple mud walls
with thatched roofing iv) Others……………………..

93
1.10 List your main sources of income
i)………………………….ii)……………………………….iii)…………
…………….iv)…………………………….v)………………………
vi)…………………………..
1.11 List your most important/main occupation?
i)………………………….ii)……………………………….iii)…………………
1.12 Why do you cultivate Jatropha?
i) Hedge/Fence ii) Own energy supply iii) Rehabilitating
degraded land iv) Commercialization so as to diversify
income sources
1.13 Do you grow other crops apart from Jatropha? i) Yes ii) No
If yes list the crops
i)………………………….ii)……………………………….iii)………………
……
1.14 How much land do you own and/or rent?
1.15 What is the total size of your farmland under agriculture (size in acres)?
..............
1.16 How much income did you get from selling livestock products this
season?............(Tshs)
Description Size(area) Value (Tshs/area) Owned land Rented land Others

94
SECTION 2: OBJECTIVE #1
Identification of the marketing and distribution channel of Jatropha products
including marketing power among marketing actors.
Marketing and distribution channel of Jatropha products
2.1 Who are the major buyers of your seeds?
i)……………………… ii)………………… iii)………………….
2.2 Where do you normally meet your buyers?
i) At home ii) At the field/farm iii) At the market iv) Others
(specify)………………
2.3 Are they the only buyers of your seeds? i) Yes ii) No
2.4 List the reasons for selling to them most of your seeds relative to others?
i) Better price ii) Only buyer available iii) Market convenient iv) Others
(specify)……………………
2.5 Do you supply Jatropha seeds throughout the year? i) Yes ii) No
2.6 If yes to qn. 2.4, which months in a year there is a high demand of Jatropha
seeds?
2.7 What is the peak month(s) of Jatropha seeds production?
..........................................
2.8 Do you normally have enough seeds to meet demand? i) Yes ii) No
2.9 If no to qn. 2.7, how do you ensure constant supply of Jatropha
seeds?............
Challenges hampering the facilitation of Jatropha flow
2.9 What are the major challenges facing Jatropha seeds production?

95
i ………..
ii ……..
iii ……..
iv ……..
2.10 What should be done to improve Jatropha seeds production?
i …….
ii …….
2.11 What are the major challenges facing Jatropha seeds marketing?
i ………..
ii ……..
2.12 What should be done to improve Jatropha seeds marketing?
i …….
ii …….
iii
Concentration ratio to assess the market power of the farmers
2.13 What is the total quantity (kg/bags) of Jatropha seed is purchased by big
buyers along the chain? ...............
2.14 What is the total quantity (kg/bags) of Jatropha seeds did you produce in
this production season? ............
2.15 What is the total quantity (kg/bags) of Jatropha seeds did you sell in this
marketing season? ............
SECTION 3: OBJECTIVE #2

96
Analysis of marketing efficiency in performing different operations in the chain
in terms of pricing and margins obtained by different actors
Marketing and Gross margins of Jatropha seeds farmers
3.1 Revenue and operational cost of Jatropha seeds production
Particulars (Tshs) Units Price/unit Average price/kgs
Remarks
Buying price (Bp) Selling price (Sp) Marketing margin (MM) Operational Cost Production costs Land preparation Seedlings Planting Harvesting Winnowing
Storage infrastructure cost (if hired)
Loss due damage Cost of bags, string any protective materials (if any)
Transport cost Taxes Insurance cost (if incurred) Other operational cost (specify)
Total operational costs Gross Margin (GM)
3.2 Do you have access to any market information? i) Yes ii) No
3.3 if yes to qn. 3.2 list the type of information to you access/get?
i)…………………………….. ii)……………………………….
iii)…………………………………. iv)……………………………….

97
3.4 Where do you get market information? i) From traders ii) From neighbors iii) From friends and relatives iv) Radio broadcasting v) Magazines vi) Others (specify) 3.5 How do you access this information? i) By physical visit ii) By using telephone iii) By asking traders who come to buy iv) By listening to radios and watching televisions v) Others (specify)………………… 3.6 Do you incur any cost to acquire that information? i) Yes ii) No 3.7 If yes to qn 3.6, how much (Tshs)? .................. 3.8 What strategies do you set to have always this information on time?
i)………………………. ii)……………..
iii)…………………………. iv)…………..
3.9 What kind of marketing costs do you incur on marketing your Jatropha seeds?
3.10 Do you face any market competition from other farmers in doing your
marketing activities? i) Yes ii) No 3.11 If yes, how strong is the degree of competition? i) Very strong ii) Strong iii)
Moderate/Normal 3.12 How many farmers (roughly) are doing the same activities as the one you are
doing? i) Less than 50farmers ii) 50-100 farmers iii) More than 100 farmers 3.13 Did you face any problem/barriers before you entered/doing this kind of
business/marketing of Jatropha seeds? i) Yes ii) No 3.14 If yes to qn 3.12, what where the main barriers to entry? i)…….. ….. iii)…………….. 3.15 Do you differentiate your product? i) Yes ii) No 3.16 If yes to qn.3.14, what criteria do you use to differentiate your products? i)…….. iii)……….. ii)………. 3.17 Are you able to respond to any market opportunities? i) Yes ii) No 3.18 If yes to qn 3.17; what kind of the market opportunities are you able to acquire? i) The use of technology on production and marketing ii) Others (specify)…………………….. SECTION 5: ASSETS, OFF FARM ACTIVITIES AND ENERGY SECURITY
Type of cost Unit Tshs/unit Transportation Taxes Processing Labor charges Market fee Others Total costs

98
Assets 5.1 Which of the following items does your household own? (Multiple answers possible)
i) Car □Plough □Mobile phone ii) Tractor □Television □Water tank ii) Motor cycle □Satellite dish □Bicycle iv) Radio □Solar panel/dish
*Please specify others: _____________________________________________ 5.1 Do you have the following financial assets?
i) Support from children (e.g. in town or abroad) ii) Savings iii) Money from credits
Off-farm activities 5. 3 Do you have any of the following sources of off-farm income? Source of income Frequency
/yr Income (Local currency per period)
Comment
Salary from employment Salary from business Salary as agricultural worker Salary from public work . Remittances from family/ friends
Income from sale of charcoal Income from renting land Other (Specify):
Energy security
5.4 Please rank these energy sources according to their importance for your
household?
(rank no 1-7= very important-decreasing importance, Write 0 if not. used) i) Jatrophaoil ii) Jatrophadiesel iii) Kerosene iv) Diesel/Petrol
v) Firewood vi) Charcoal vii) Electricity viii) Other (please
specify):_____________________________________
5.5 Could energy from Jatropha in your opinion play a role to cover the local energy needs? i) Yes* ii) No*

99
*Why do you think so? ______________________________________
Thank you for your cooperation

100
Appendix 4: Traders questionnaire
General information
Questionnaire no. … …………Date of interview.……….. ………………………..
Interviewer’s name………………Trader’s name ……………………………………
Division…………………………Ward name…………………………………………
Village/town………………………………
SECTION 1: TRADER’S CHARACTERISTICS (fill the gap or circle one)
1.1 Respondent’s name……………………………………………………….
1.2 Gender of the respondent i) Male ii) Female
1.3 Age of the respondent i) under 18 years ii) Between 18-25 years old iii)
Between 26-55 years old iv) Above 55 years old.
1.4 Marital status of the respondent i) Single ii) Married iii) Widow(er) iv)
Divorced/Separated
1.5 Education level of the respondents i) No formal schooling ii) Adult
literacy classes iii) Primary school iv) Secondary school v) Certificate
vi) Diploma vii) Degree
1.6 Age of household head……………(years)
1.7 Gender of the household head i) Male ii) Female
1.8 What is your household size? i) Adults……………
ii) Children…………….
1.9 List your main sources of income
i)………………………….ii)…………………………….iii)……………
1.10 List your most important/main occupation?

101
i)………………………….ii)……………………………….iii)……………………
1.11 How much income did you get from doing Jatropha seed marketing this
season? (Tshs)
SECTION 2: OBJECTIVE #1
Identification of the marketing and distribution channel of Jatropha products
including marketing power among marketing actors.
Marketing and distribution channel of Jatropha products
2.1 Type of trader i) Wholesaler ii) Retailer iii) Other (specify)………………
2.2 Years in business i) Below one year ii) One year iii) Two years iv) Three years
v) Above three years
2.3 Who are your major customers/buyers?
i)……
ii)……
2.4 Which months the Jatropha seeds are sold mostly? ...............................
2.5 Why the seeds are sold mostly in such months? i) Cash demand increases ii)
Accessibility of transport to the market iii) Customers demand increase iv) Other
(specify)
2.6 Do you sell other crops/seeds apart from Jatropha? i) Yes ii) No
If yes list the crops
i)………………………….ii)……………………………….iii)………………………. 2.7 What are the major marketing constraints facing you?

102
i) ………..
ii) ……..
iii) ……..
2.8 What should be done to improve Jatropha seeds marketing?
i) …….
ii) …….
iii) …….
Concentration ratio to assess the market power of the trader
2.9 What is the total quantity (kg/bags) Jatropha seed purchased by big buyers along
the chain? …………..
2.10 What is the total quantity (kg/bags) of Jatropha seeds did you produce in this
production season? ............
2.11 What is the total quantity (kg/bags) of Jatropha seeds did you sell in this
marketing season? ............
SECTION 3: OBJECTIVE #2
Analysis of marketing efficiency in performing different operations in the chain
in terms of pricing and margins obtained different actors
Marketing and Gross margins of Jatropha seed traders
3.1 Revenue and operational cost of Jatropha seeds production
Particulars (Tshs) Units Price/unit Average price/kgs
Remarks
Buying price (Bp) Selling price (Sp) Marketing margin (MM) Operational Cost Storage infrastructure cost (if hired)

103
Loading and unloading Cost of bags, string any protective materials (if any)
Transport cost Premises charges (if any) Labor/wage cost (if any) Taxes Other operational cost (specify)
Total operational costs Gross Margin (GM)
3.2 Do you have access to any market information? i)Yes ii) No
3.3 Ifyes to qn. 3.2 what type of information to you access/get? i) Price of inputs
Others (specify) i)…………………………….. ii)……………………………….
iii)…………………………………. iv)……………………………….
3.4 Where do you get market information? i) From farmers ii) From neighbors iii) From friends and relatives iv) Radio broadcasting v) Magazines vi) Others (specify) 3.5 How do you access this information? i) By physical visit ii) By using telephone iii) By asking traders who come to buy iv) By listening to radios and watching televisions v) Others (specify)………………… 3.6 Do you incur any cost to acquire that information? i) Yes ii) No 3.7 If yes, how much (Tshs)? .................. 3.8 What strategies do you set to have always this information on time?
i)………………………. ii)……………..
iii)………………………….
3.9 Do you normally know the price in advance before taking your produce to the
market? i)Yes ii) No. If yes how do you get price information? i) Visit to the farm
place/market ii) From other traders iii) (Specify)……………..
3.10 What is the normal paying condition in Jatropha marketing?
i) In advance ii) In cash iii) Exchange trade iv) Others (specify)………
3.11 What kind of marketing costs do you incur on marketing your Jatropha seeds?
Type of cost Unit Tshs/unit

104
3.12 Do you face any market competition from other traders in doing your marketing
activities? i) Yes ii)No 3.12 If yes, how strong is the degree of competition? i) Very strong ii) Strong
iii) Moderate/Normal 3.13 How many traders (roughly) are doing the same activities as the one you are
doing? i) Less than 50 traders ii)50-100 traders iii)More than 100 traders 3.14 Did you face any problem/barriers before you entered/doing this kind of
business/marketing of Jatropha seeds? i)Yes ii)No 3.15 If yes to qn 3.14, what where the main barriers to entry? i)…….. ii)….. iii)…………….. ii3.16 Do you differentiate your product? i) Yes ii) No 3.17 If yes to qn.3.16, what criteria do you use to differentiate your products? i)… ii).................. iii)……….. 3.18 Are you able to respond to any market opportunities? i)Yes ii)No 3.19 If yes to qn 3.18; what kind of the market opportunities are you able to acquire? i) The use of technology marketing ii)Others (specify)…………………….
Thank you for your cooperation
Transportation Taxes Processing Labor charges Others Total costs

105
Appendix 5: Jatropha seed processors questionnaire General information
Questionnaire no. … …………….Date of interview.……….. ……………………
Interviewer’s name……………Processor /Company name ….………………………
Division…………………………Ward name…………………………………………
Village/town………………………………
SECTION 1: RESPONDENT CHARACTERISTICS (Fill the gap or circle one)
1.1 Respondent’s name……………………………………………………….
1.2 Gender of the respondent i) Male ii)Female
1.3 Age of the respondent i) under 18 years ii) Between 18-25 years old iii)
Between 26-55 years old iv)Above 55 years old.
1.4 Marital status of the respondent i) Single ii) Married iii)Widow(er)
iv)Divorced/Separated
1.5 Education level of the respondents i) No formal schooling ii)Adult
literacy classes iii) Primary school iv)Secondary school v)Certificate
vi)Diploma viii) Degree
1.6 What is your household size? i) Adults…………… ii)
Children…………….
SECTION 2: TRADING INFORMATION
2.1 Business head i)Male ii)Female
2.2 Experience in business i) Below one year ii) One year iii)Two years iv)Three
years v) Above three years

106
2.3 What is a form of ownership of your processing company? i) Individual ii)
Partnership iii) State/cooperative iv)Others (specify)…………
2.4 How did you obtain the start-up capital? i) Own saving from other activities
ii) Informal money lenders iii) Bank loan/SACCOS iv) Others (specify)…….
2.5 How much capital did you use to start this processing enterprise (in Tshs)?
i) Below 100,000 ii) Between 100,000-500,000 iii) Between 500,000-1,000,000
iv) above1,000,000
2.6 How frequently, do you operate the Jatropha seed processing? i)Full time
ii) Part-time
2.7 a) Do you have any technical knowledge on Jatropha seed processing? i)Yes
ii) No
b) If yes, how did you obtain the processing knowledge? i) Formal training ii)
Informal training.
2.8 Have you registered your processing machine enterprise? i)Yes ii)No
If yes, when……………….. (year)
2.9 Why is it important to register the company?
.........................................................
2.10 Did you obtain the license easily? i)Yes ii) No
If no, give reasons…………………………………………………….
2.11 How did the premises of your processing machine obtained? i) Rented
ii)Bought
iii) Inherited.If hired, at what rent do you pay per month? .................... (Tshs)

107
SECTION 3: OBJECTIVE #1
Identification of the marketing and distribution channel of Jatropha products
including marketing power among marketing actors.
Marketing and distribution channel of Jatropha products
2.12 What form of products do you produce from the Jatropha seeds?
i) Oil/fuel ii) Fertilizers iii) Soaps iv) Others (specify)……………..
2.12 ho are your major customers/buyers?
i) Local consumers ii) Local traders iii) Interregional traders iv) Others
(list)………
2.14 What kind of effort have you made to ensure the customers know your
processing
machine? i) Advertisement posters ii)Location of machine is near high population
area
iii)Informing friends/relatives iv)Others (list)………
2.15 Which months do processing mostly done? (Number the months in order of
highest
operation).
2.16 Why processing is mostly operated in those months?
i) Availability of Jatropha seeds ii) Market convenient iii) Availability of many
traders/Middlemen iv) Others (specify)………
2.17 Do you process other crops/seeds apart from Jatropha? i) Yes ii)No
If yes list the crops
J F M A M J J A S O N D

108
i)………………………….ii)……………………………….iii)……………………… 2.18 What are the major marketing constraints facing you?
i)………..
ii)……
iii)………
2.19 What should be done to improve Jatropha seeds marketing?
i)………..
ii)……
iii)………
Concentration ratio to assess the market power of the processors
2.20 What is the total quantity (kg/bags) Jatropha seed purchased by big buyers
along the chain? …………..
2.21 What is the total quantity (kg/bags) of Jatropha seeds did you process in this
season? ............
2.22 What is the total quantity of the processed products did you sell in this
marketing season? ............
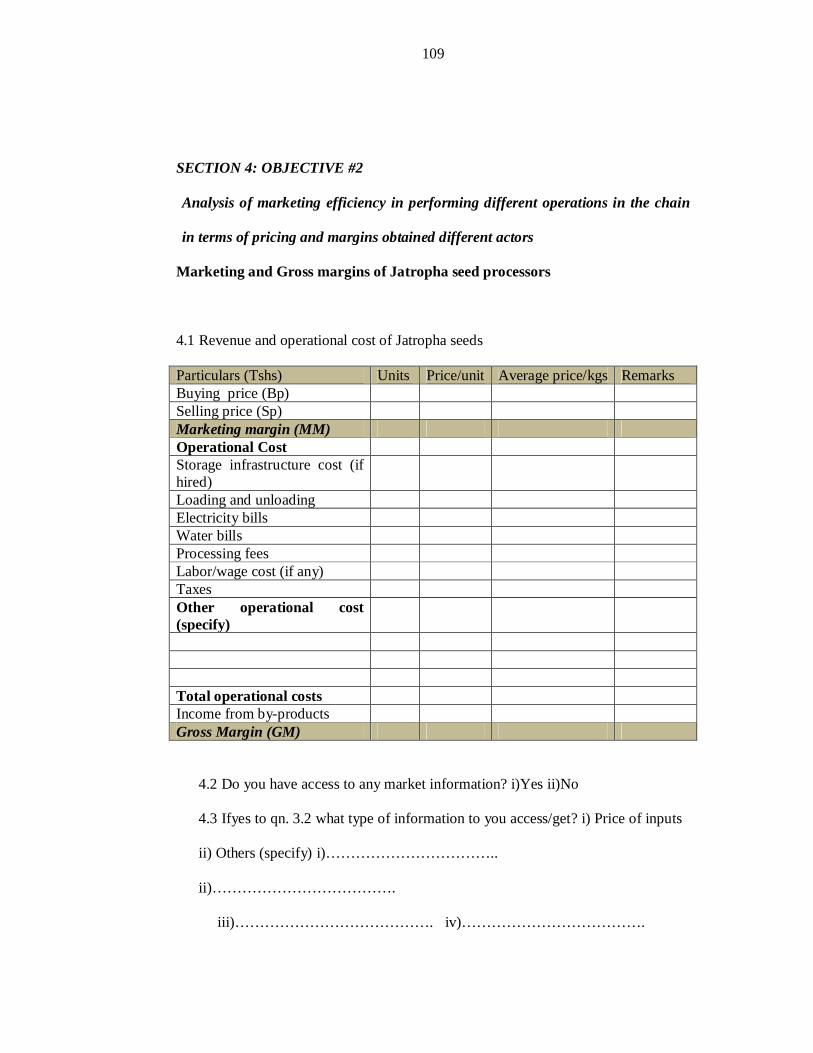
109
SECTION 4: OBJECTIVE #2
Analysis of marketing efficiency in performing different operations in the chain
in terms of pricing and margins obtained different actors
Marketing and Gross margins of Jatropha seed processors
4.1 Revenue and operational cost of Jatropha seeds
Particulars (Tshs) Units Price/unit Average price/kgs Remarks Buying price (Bp) Selling price (Sp) Marketing margin (MM) Operational Cost Storage infrastructure cost (if hired)
Loading and unloading Electricity bills Water bills Processing fees Labor/wage cost (if any) Taxes Other operational cost (specify)
Total operational costs Income from by-products Gross Margin (GM)
4.2 Do you have access to any market information? i)Yes ii)No
4.3 Ifyes to qn. 3.2 what type of information to you access/get? i) Price of inputs
ii) Others (specify) i)……………………………..
ii)……………………………….
iii)…………………………………. iv)……………………………….

110
4.4 Where do you get market information? i)From farmers ii)From neighbors iii)From friends and relatives iv)Radio broadcasting v)Magazines vi) Others (specify)……… 4.5 How do you access this information? i)By physical visit ii)By using telephone iii)By asking traders who come to buy iv)By listening to radios and watching televisions v) Others (specify)………………… 4.6 Do you incur any cost to acquire that information? i)Yes ii)No 4.7 If yes, how much (Tshs)? .................. 4.8 What strategies do you set to have always this information on time?
i)………………………. ii)……………..
iii)………………………….
4.9 Do you normally know the price in advance before selling your produce to the
market?i)Yes ii) No. If yes how do you get price information? i) Visit to the
farm place/market ii) From other traders iii) (Specify)……………..
4.10 What is the normal paying condition in Jatropha marketing?
i) In advance ii) In cash iii) Exchange trade iv) Others (specify)………
4.11 What kind of marketing costs do you incur on marketing your Jatropha seeds?
4.12 Do you face any market competition from other companies/traders in doing your marketing? i)Yes ii) No 4.12 If yes, how strong is the degree of competition? i) Very strong ii) Strong iii) Moderate/Normal 4.13 How many companies/traders (roughly) are doing the same activities as the one you aredoing? i)Less than 5 companies /traders ii) 6-10 companies / traders iii) More than 10 companies /traders 4.14 Did you face any problem/barriers before you entered/doing this kind of business? i)Yes ii) No
Type of cost Unit Tshs/unit Loading and unloading Taxes Processing Transport Labor charges Others Total costs

111
4.15 If yes to qn 3.12, what where the main barriers to entry? i)…….. ii)….. iii)…………….. 4.16 Do you differentiate your product? i) Yes ii) No 4.17 If yes to qn.3.14, what criteria do you use to differentiate your products? i)…….. ii) iii)……….. 4.18 Are you able to respond to any market opportunities? i)Yes ii) No 4.19 If yes to qn 3.17; what kind of the market opportunities are you able to acquire? i)The use of technology marketing ii) Others (specify)……………………..
Thank you for your cooperation

112
Appendix 6: Consumers questionnaire
General information
Questionnaire no. … …………Date of interview.……….. ………………………..
Interviewer’s name………………Consumer’s name ……………………………….
Division…………………………Ward name…………………………………………
Village/town………………………………
SECTION 1: CONSUMER’S CHARACTERISTICS (Fill the gap or circle one)
2.13 Respondent’s name……………………………………………………….
2.14 Gender i) Male ii) Female
2.15 Age i) under 18 years ii) Between 18-25 years old iii) Between 26-55 years
old iv)Above 56 years old.
2.16 Marital status i) Single ii) Married iii) Widow(er) iv)Divorced/Separated
2.17 Education level i)No formal schooling ii) Adult literacy classes iii)Primary
school iv)Secondary school v) Certificate vi) Diploma vii)Degree
2.18 Age of household head……………(years)
2.19 Gender of the household head i) Male ii)Female
2.20 What is your household size? i) Adults…………… ii) Children…………….
2.21 List your main sources of income
i)………………………….ii)……………………………….iii………..
2.22 List your most important/main occupation?
i)………………………….ii)……………………………….iii)……………

113
SECTION 2: OBJECTIVE #1
Identification of the marketing and distribution channel of Jatropha
products including marketing power among marketing actors.
Marketing and distribution channel of Jatropha products
1.1 What form of Jatropha products do you buy?
i) Oil/fuel ii)Fertilizers iii) Soaps iv)Others (specify)…………….
2.2 Who are your major seller(s) of your products?
i)……………………… ii)………………… iii)………………….
2.2 Where do you normally contact your sellers?
i) At home ii) At the field/farm iii) At the market iv) Others
(specify)………………
2.3 Why do you prefer to buy the Jatropha products?
i)……………
ii)…………..
iii)…………
2.4 Do you buy Jatropha products throughout the year? i) Yes ii) No
2.5 If yes to qn. 2.4, which months in a year there is a high demand of Jatropha
products? ……………………..
Challenges hampering the facilitation of Jatropha flow and its measures
2.6 What do you think are the major challenges facing Jatropha products
marketing?
i)…………..
ii)…………..

114
2.7 What do you think should be done to improve Jatropha products
marketing?
i)…………..
ii)…………..
SECTION 3: OBJECTIVE #2
Analysis of marketing efficiency in performing different operations in the chain
in terms of pricing and margins obtained different actors
Marketing margins of consumers
3.1 Revenue and operational cost of Jatropha seeds
Particulars (Tshs) Units Price/unit Average price/units Remarks End buying price (Bp) First selling price (Sp) Marketing margin (MM)
Thank you for your cooperation