Logical Calculations, Pivot Tables & Charts Supplemental Resources on Class Website.
40
Logical Calculations, Pivot Tables & Charts Supplemental Resources on Class Website
-
Upload
donald-young -
Category
Documents
-
view
221 -
download
2
Transcript of Logical Calculations, Pivot Tables & Charts Supplemental Resources on Class Website.
Logical Calculations, Pivot Tables & ChartsSupplemental Resources on Class
Website
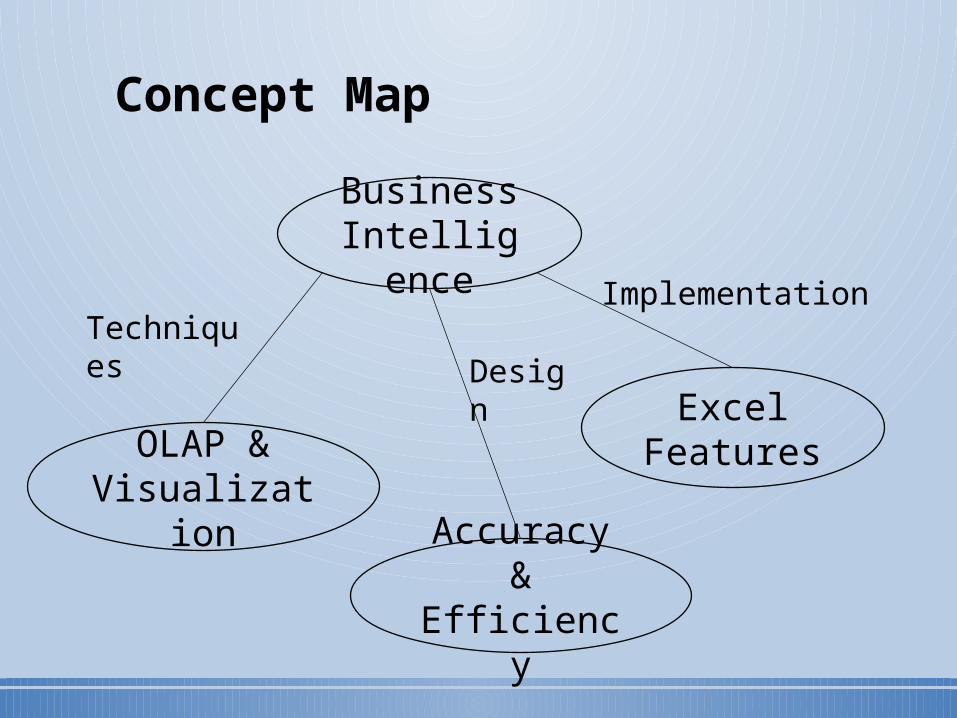
Concept Map
Business Intelligenc
e
Excel Features
Implementation
OLAP & Visualizatio
n
Techniques
Accuracy & Efficiency
Design
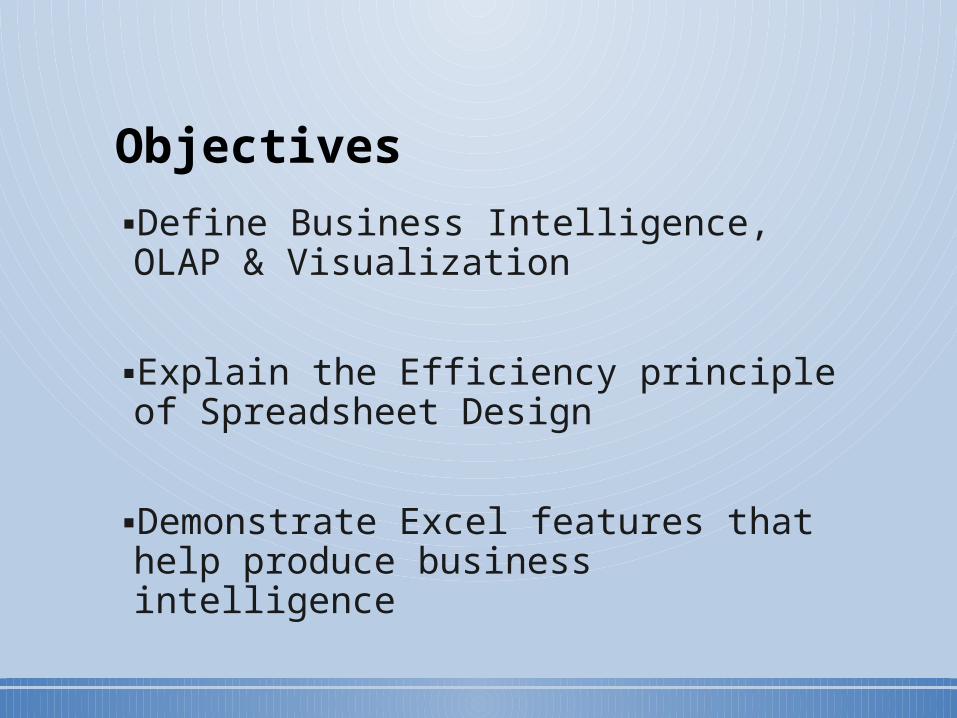
Objectives
▪Define Business Intelligence, OLAP & Visualization
▪Explain the Efficiency principle of Spreadsheet Design
▪Demonstrate Excel features that help produce business intelligence

Pandora Internet Radio
▪Recommender Software
Music Genome Project
• Arrangement• Beat• Harmony• Lyrics• Melody• Rhythm• Tempo• Voice
Business Intelligence (BI)
▪software that searches vast amounts of data to derive information for improved decision making
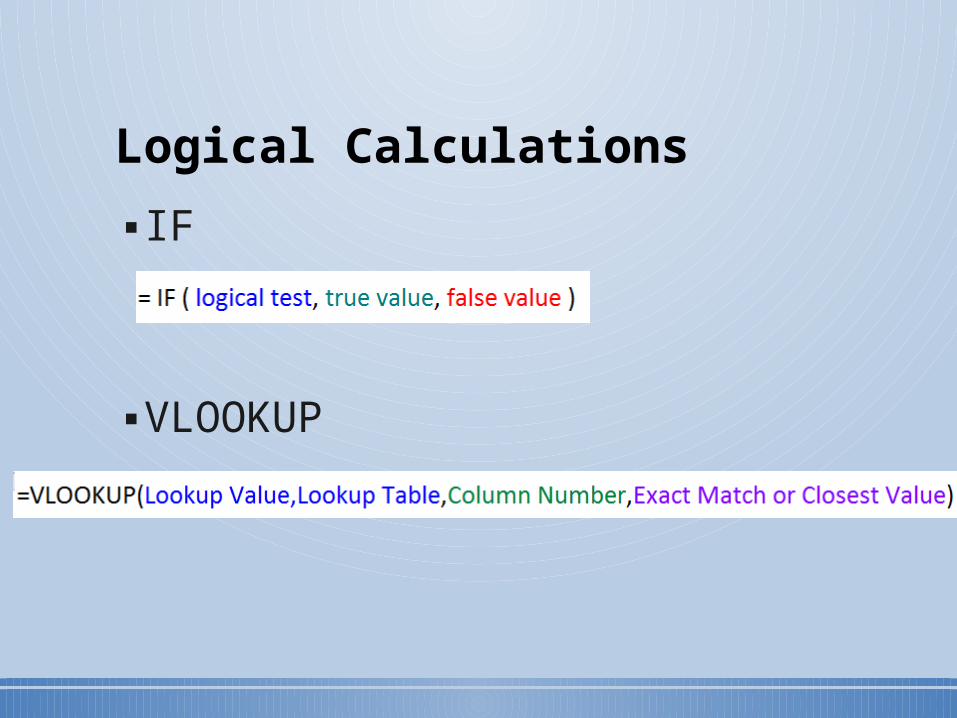
Logical Calculations
▪IF
▪VLOOKUP
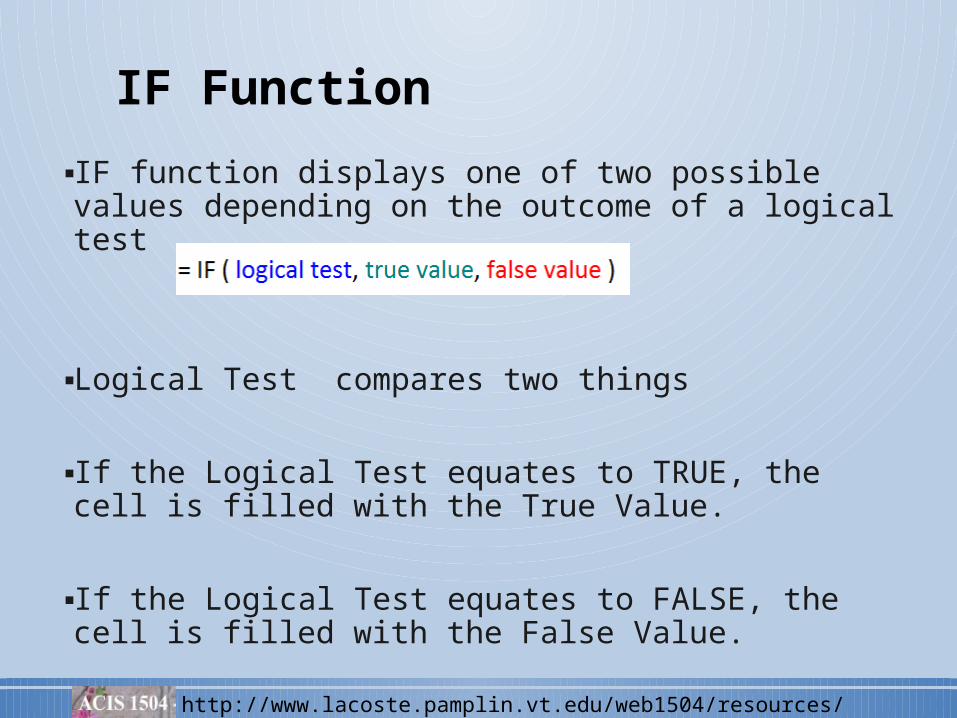
▪ IF function displays one of two possible values depending on the outcome of a logical test
▪Logical Test compares two things
▪ If the Logical Test equates to TRUE, the cell is filled with the True Value.
▪ If the Logical Test equates to FALSE, the cell is filled with the False Value.
IF Function
http://www.lacoste.pamplin.vt.edu/web1504/resources/video/ss.html
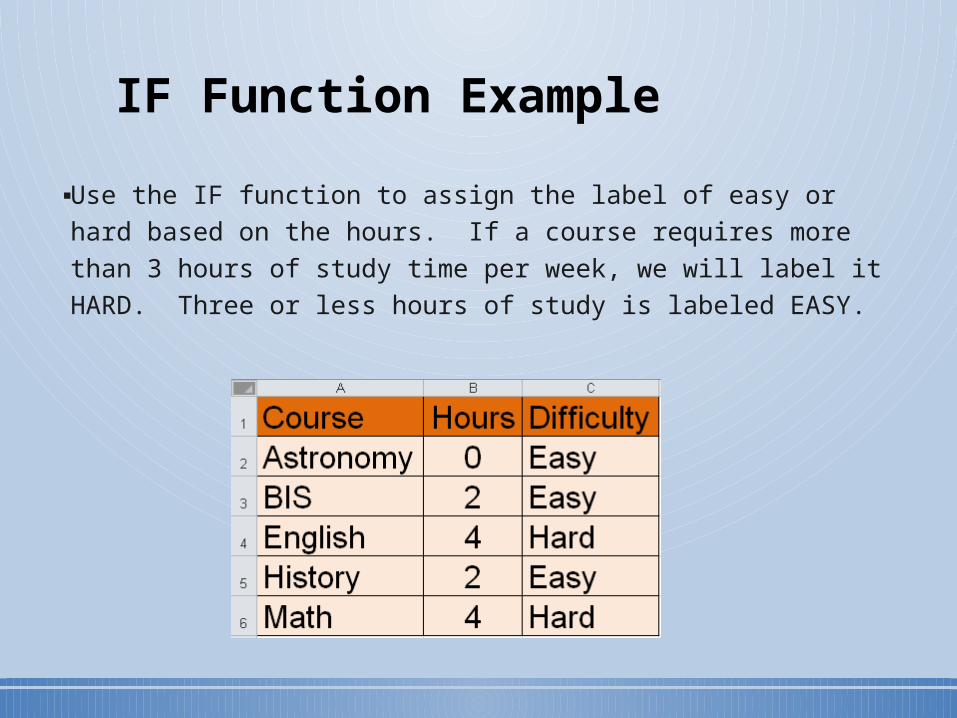
▪ Use the IF function to assign the label of easy or hard based on the hours. If a course requires more than 3 hours of study time per week, we will label it HARD. Three or less hours of study is labeled EASY.
IF Function Example
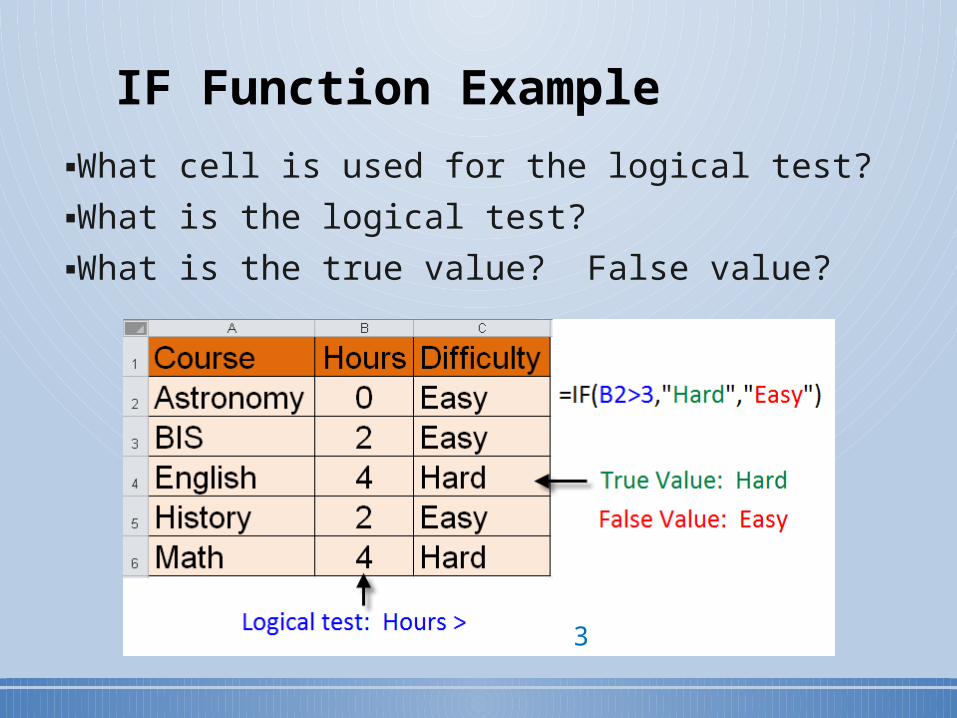
▪What cell is used for the logical test?
▪What is the logical test?
▪What is the true value? False value?
IF Function Example
3
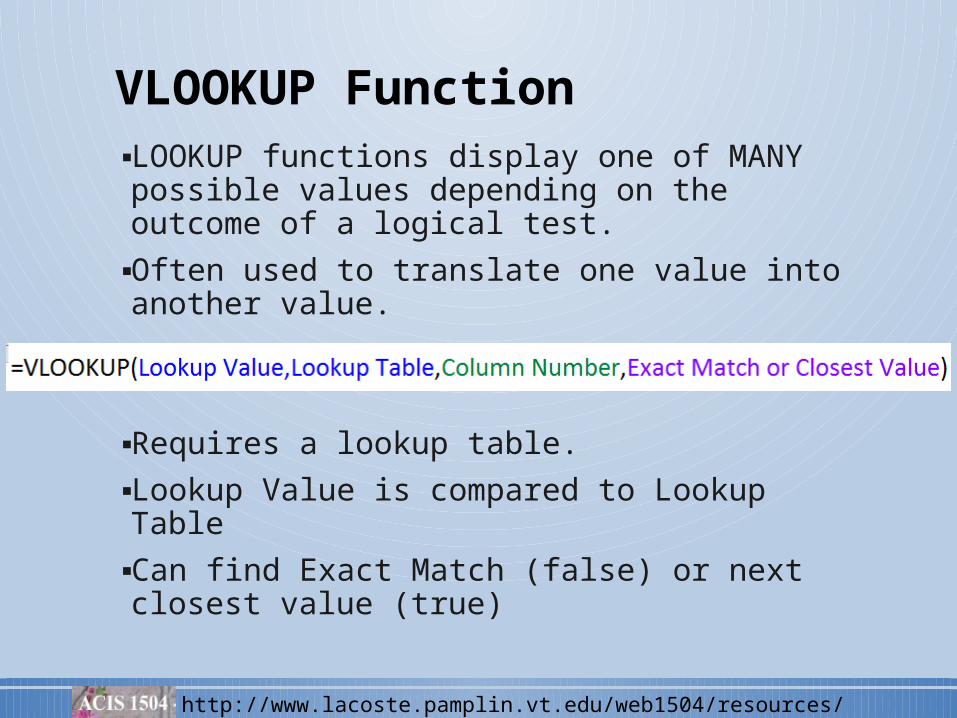
▪LOOKUP functions display one of MANY possible values depending on the outcome of a logical test.
▪Often used to translate one value into another value.
▪Requires a lookup table.
▪Lookup Value is compared to Lookup Table
▪Can find Exact Match (false) or next closest value (true)
VLOOKUP Function
http://www.lacoste.pamplin.vt.edu/web1504/resources/video/ss.html
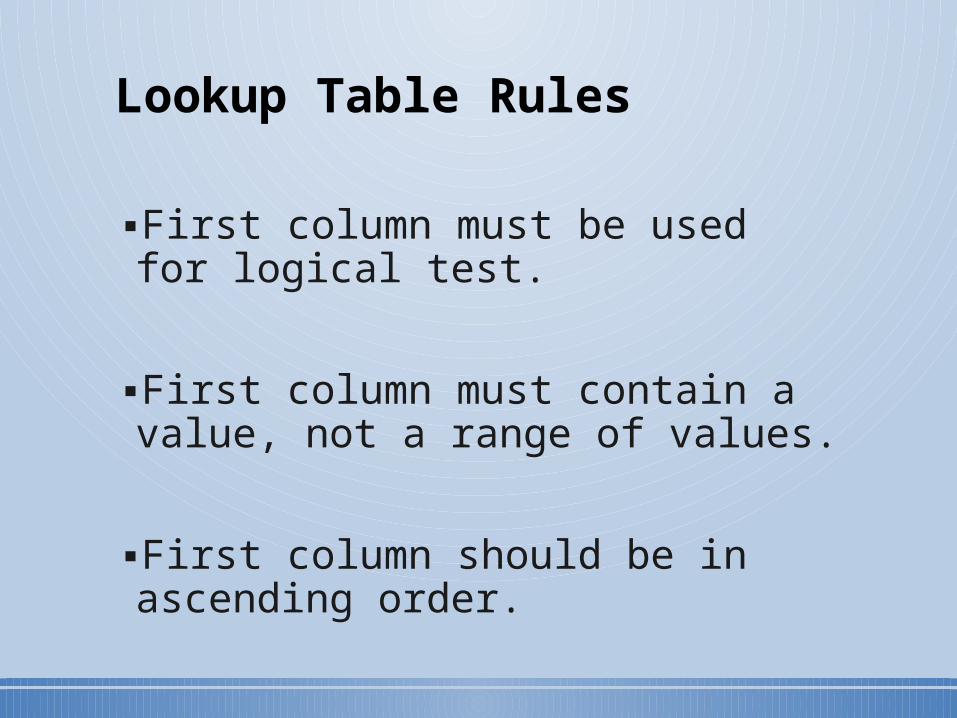
▪First column must be used for logical test.
▪First column must contain a value, not a range of values.
▪First column should be in ascending order.
Lookup Table Rules
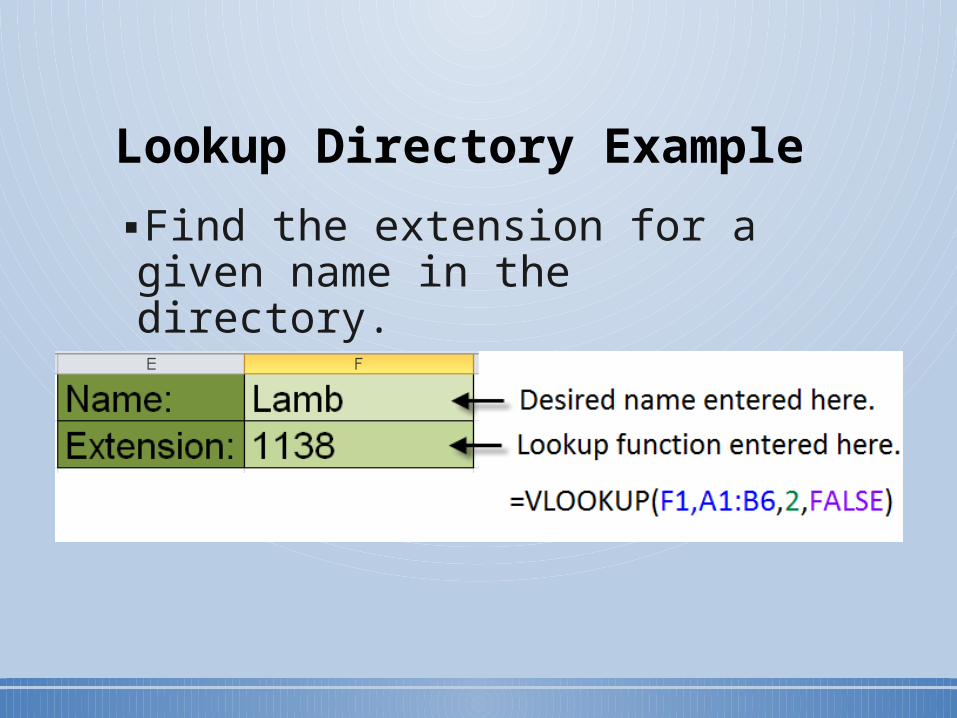
Lookup Directory Example
▪Find the extension for a given name in the directory.

Lookup Table for Directory Example
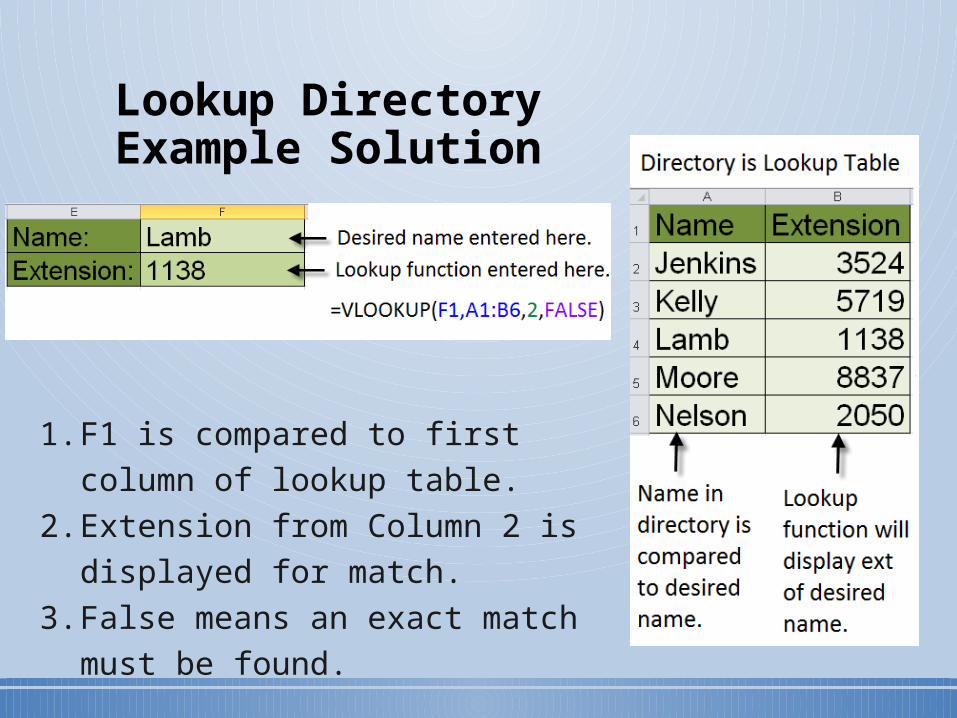
Lookup Directory Example Solution
1. F1 is compared to first column of lookup table.
2. Extension from Column 2 is displayed for match.
3. False means an exact match must be found.
Spreadsheet Design: Efficiency
▪All calculations, including comparisons, should be done by the spreadsheet.
BI – Data Visualization
On-Line Analytical Processing
▪Drill-Down
▪Consolidation
▪Slicing and Dicing
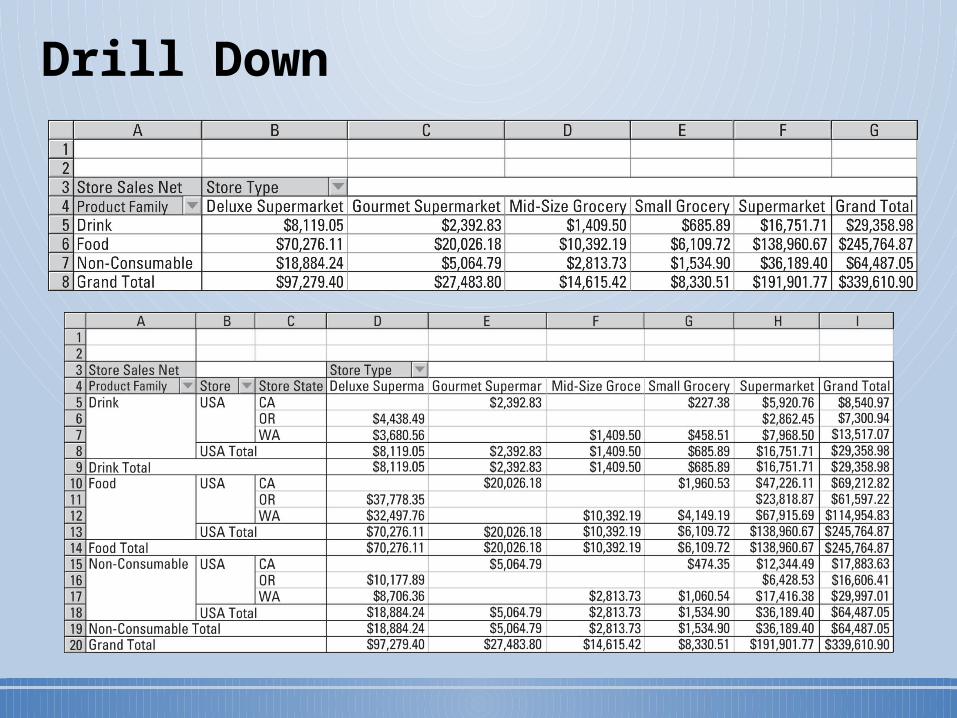
Drill Down
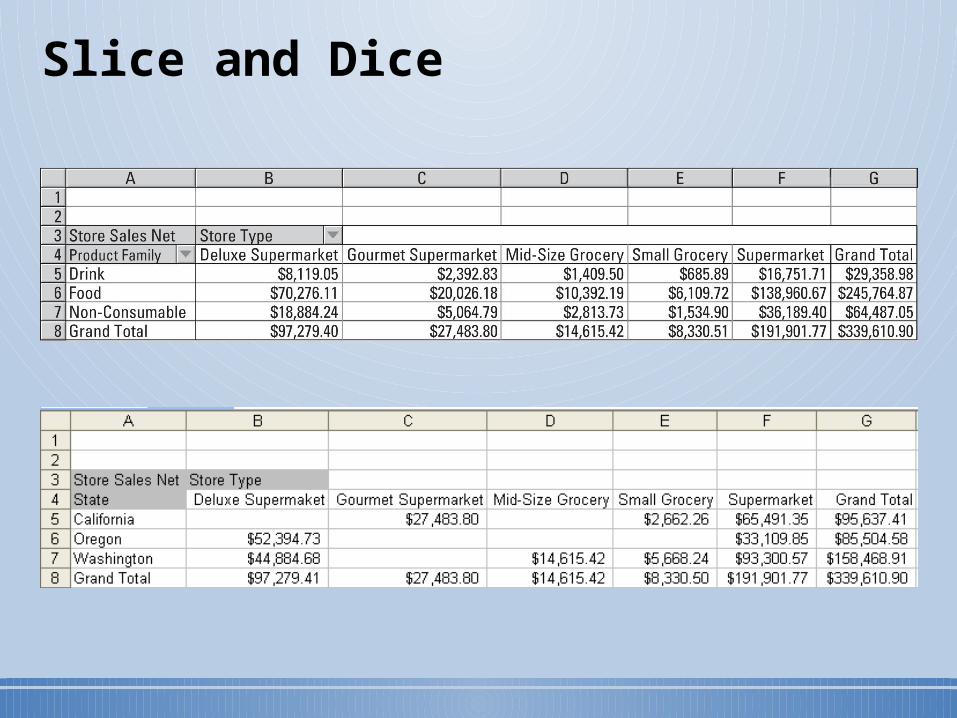
Slice and Dice
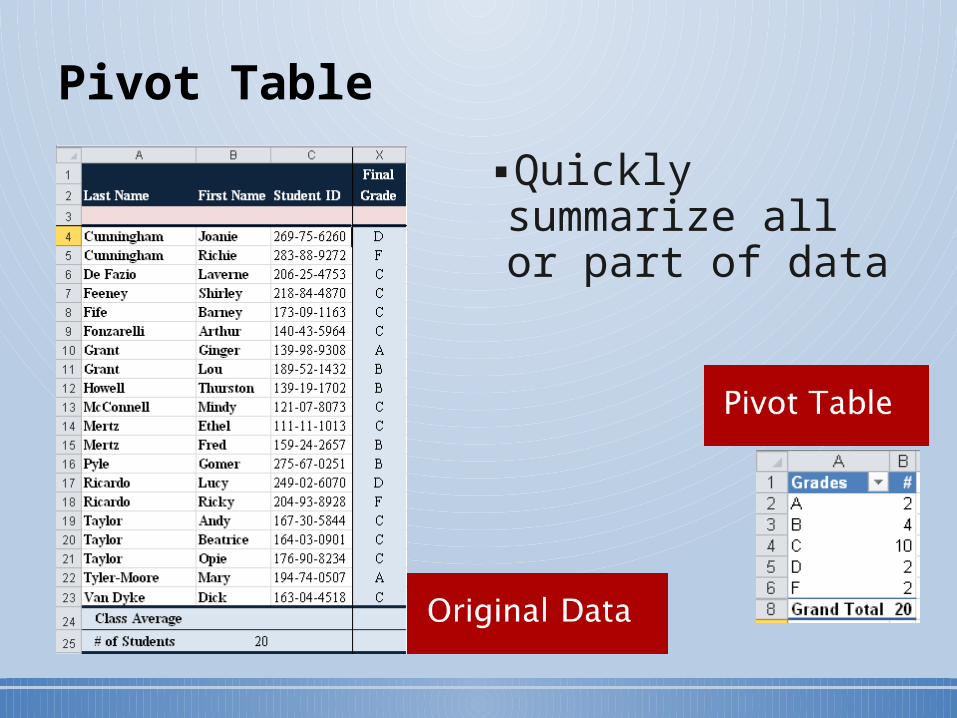
▪Quickly summarize all or part of data
Pivot Table
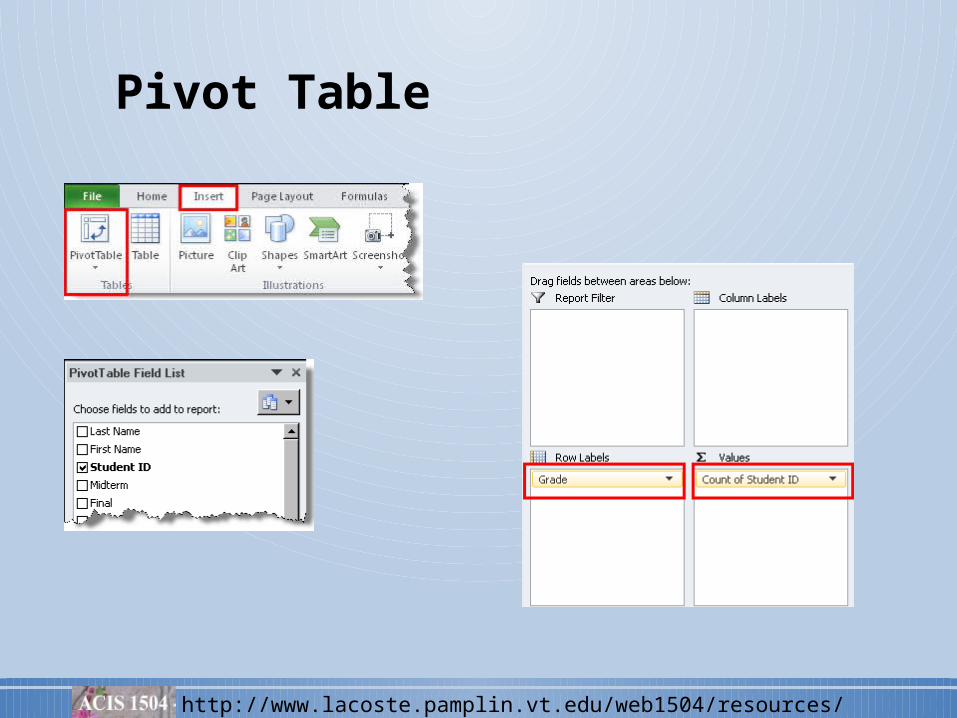
Pivot Table
http://www.lacoste.pamplin.vt.edu/web1504/resources/video/ss.html
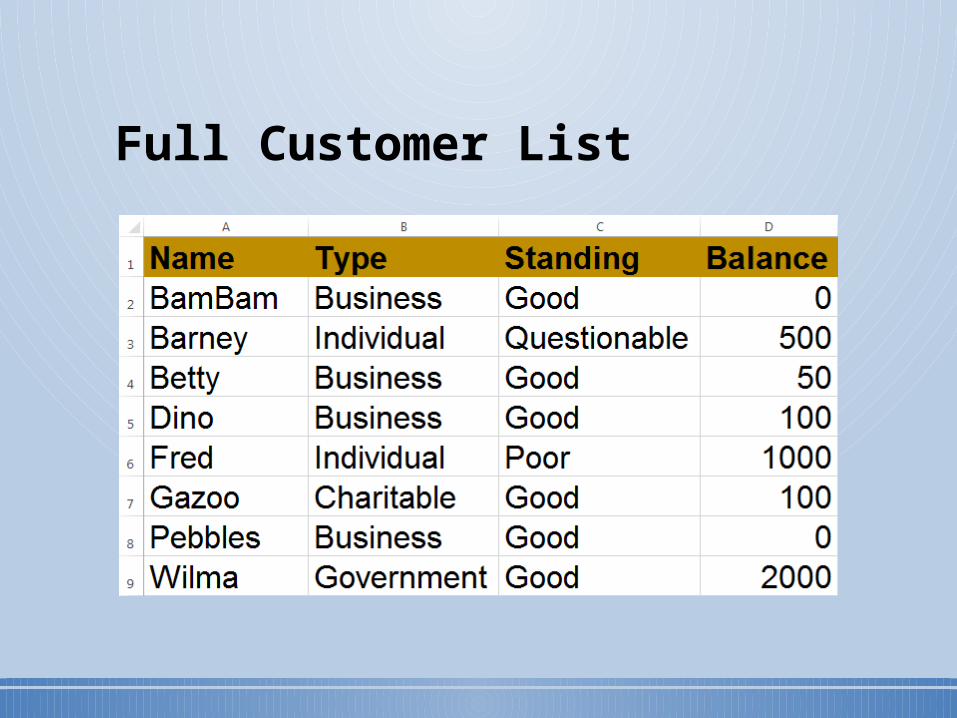
Full Customer List
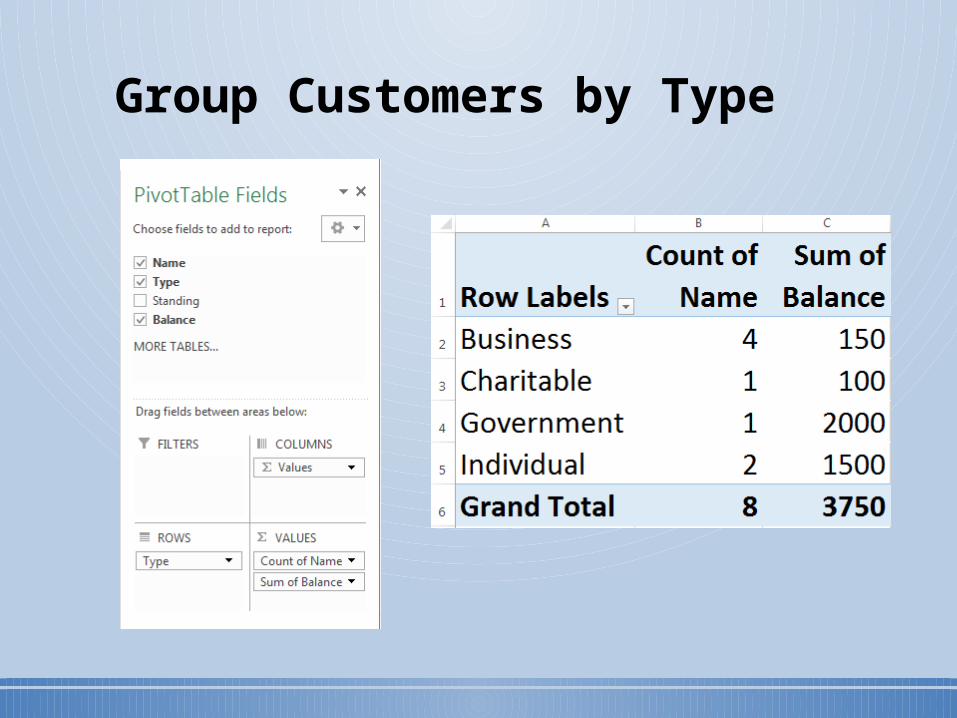
Group Customers by Type
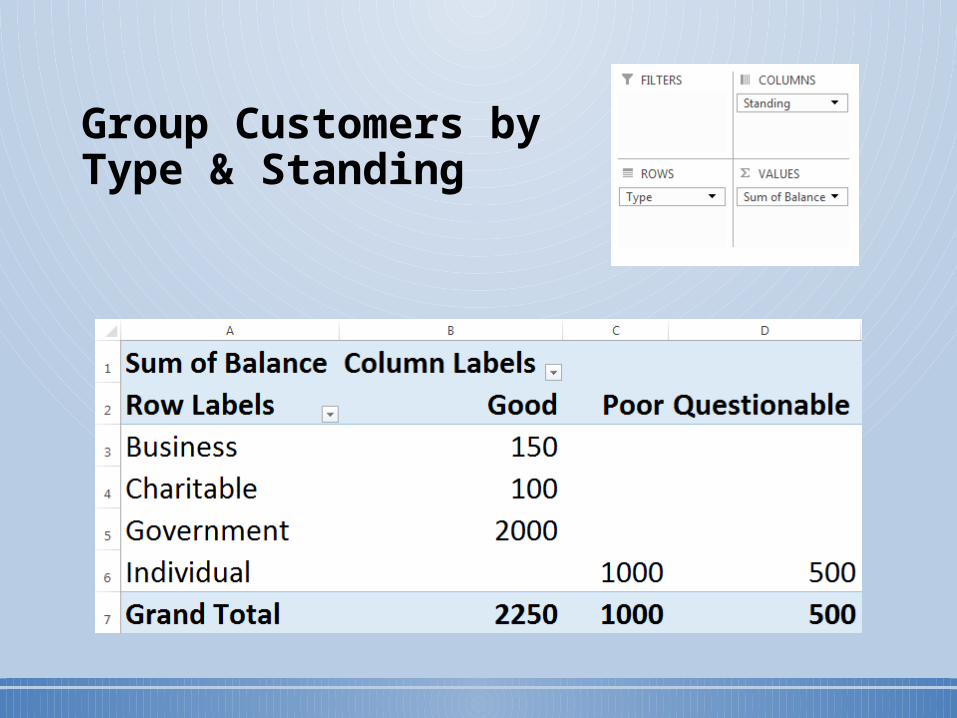
Group Customers by Type & Standing
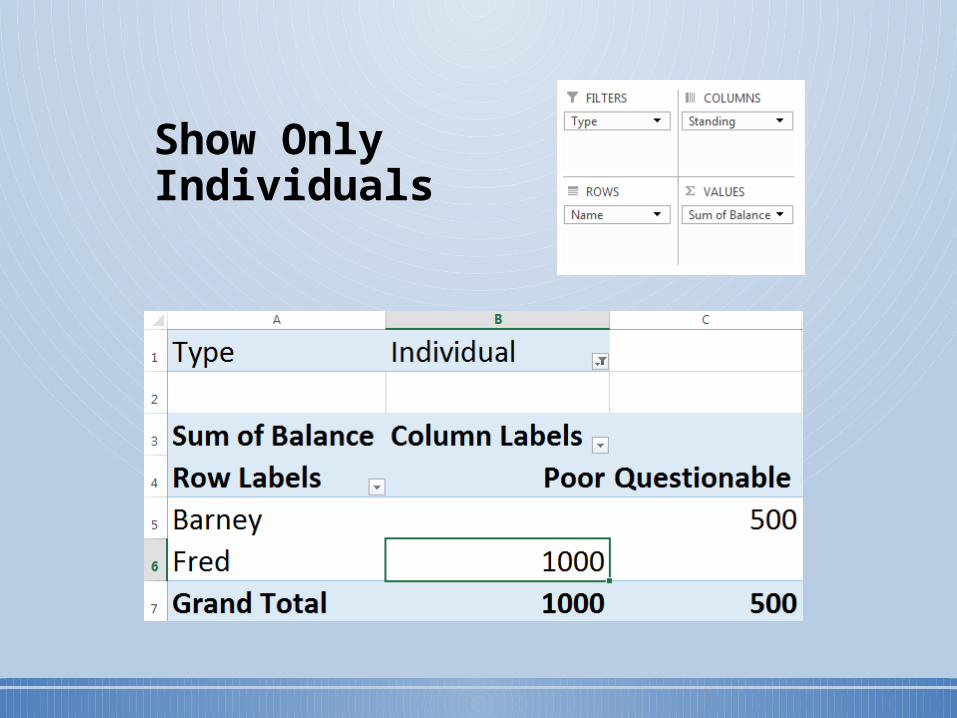
Show Only Individuals
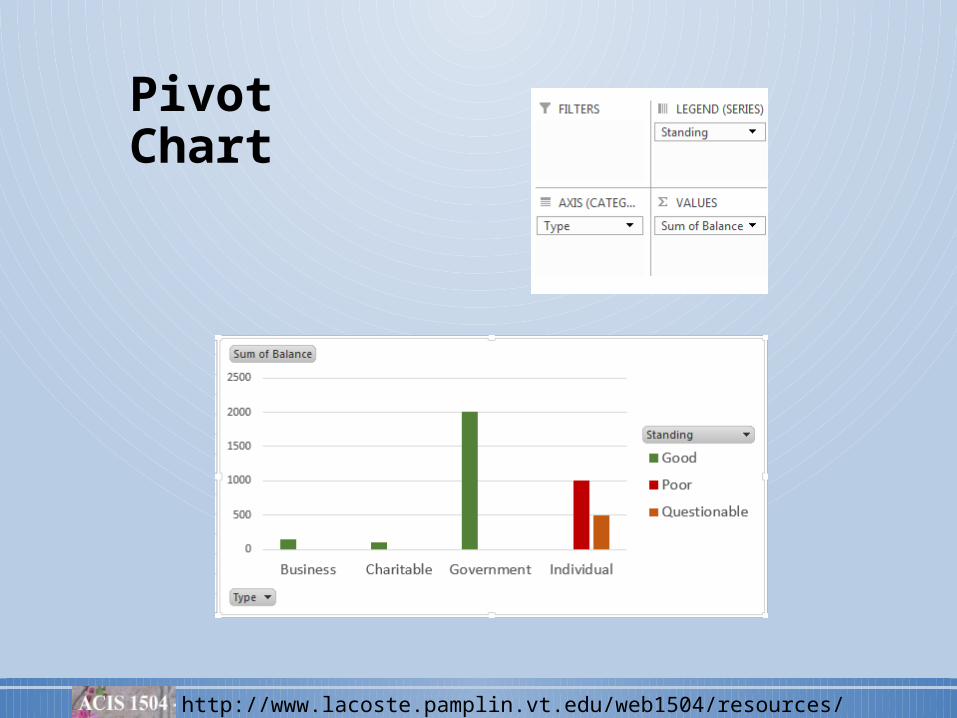
Pivot Chart
http://www.lacoste.pamplin.vt.edu/web1504/resources/video/ss.html
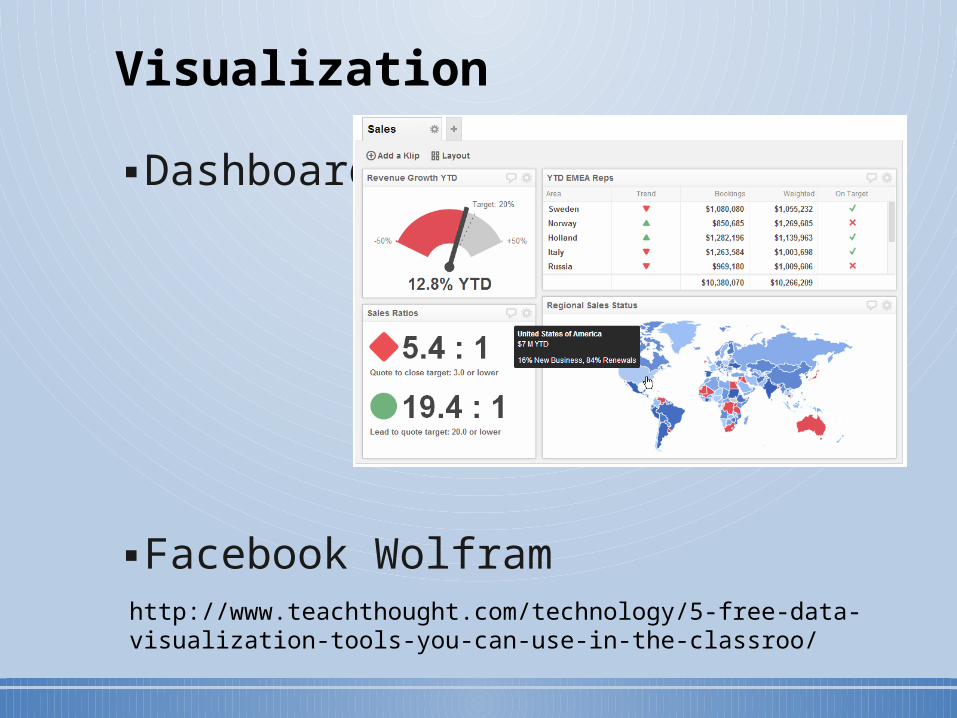
▪Dashboard
▪Facebook Wolfram
Visualization
http://www.teachthought.com/technology/5-free-data-visualization-tools-you-can-use-in-the-classroo/
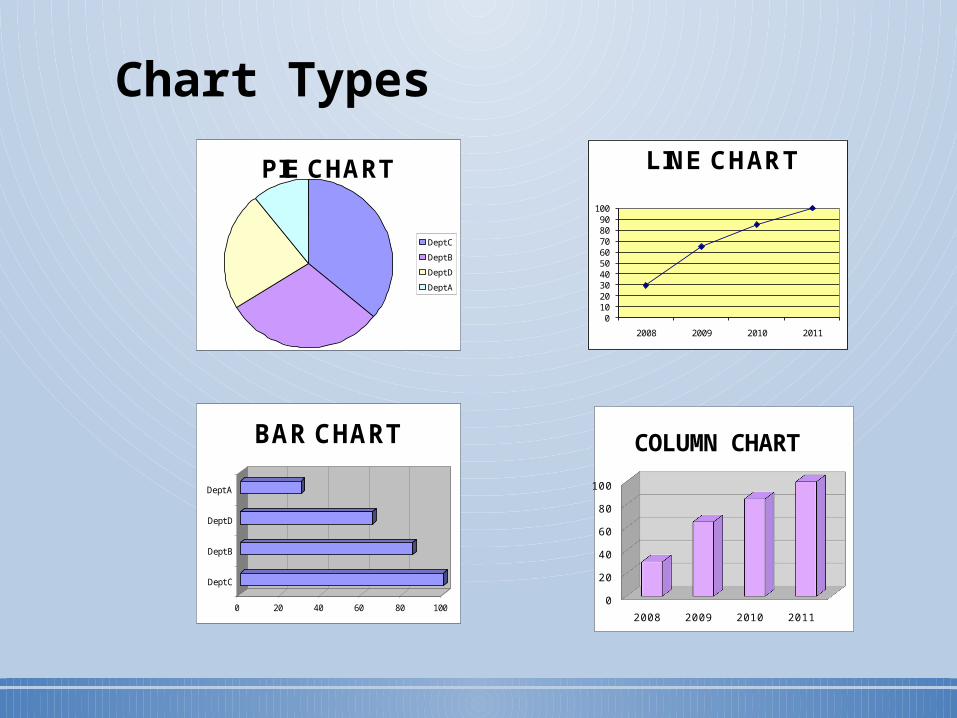
Chart Types
PIE CHART
Dept C
Dept B
Dept D
Dept A
0102030405060708090
100
2008 2009 2010 2011
LINE CHART
0 20 40 60 80 100
Dept C
Dept B
Dept D
Dept A
BAR CHART
2008 2009 2010 2011
0
20
40
60
80
100
COLUMN CHART
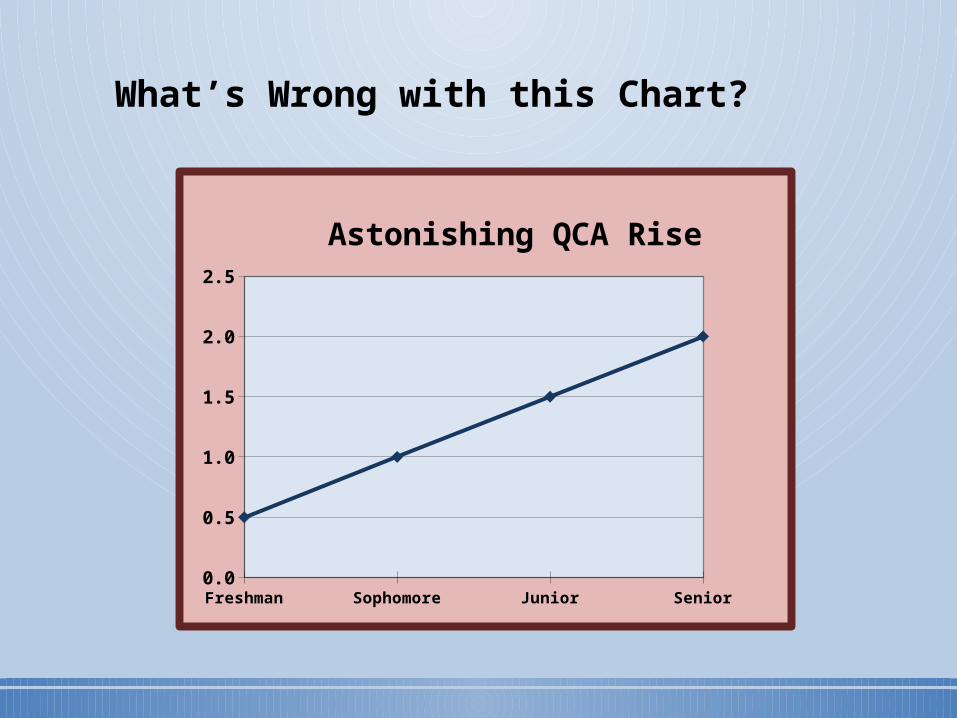
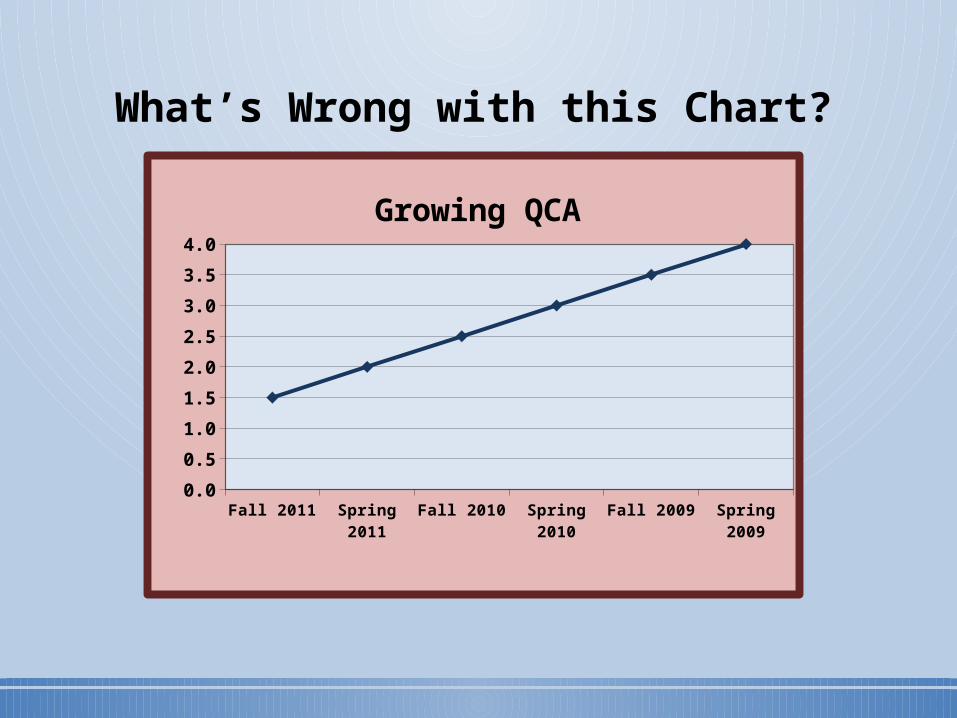
What’s Wrong with this Chart?
Freshman Sophomore Junior Senior0.0
0.5
1.0
1.5
2.0
2.5
Astonishing QCA Rise
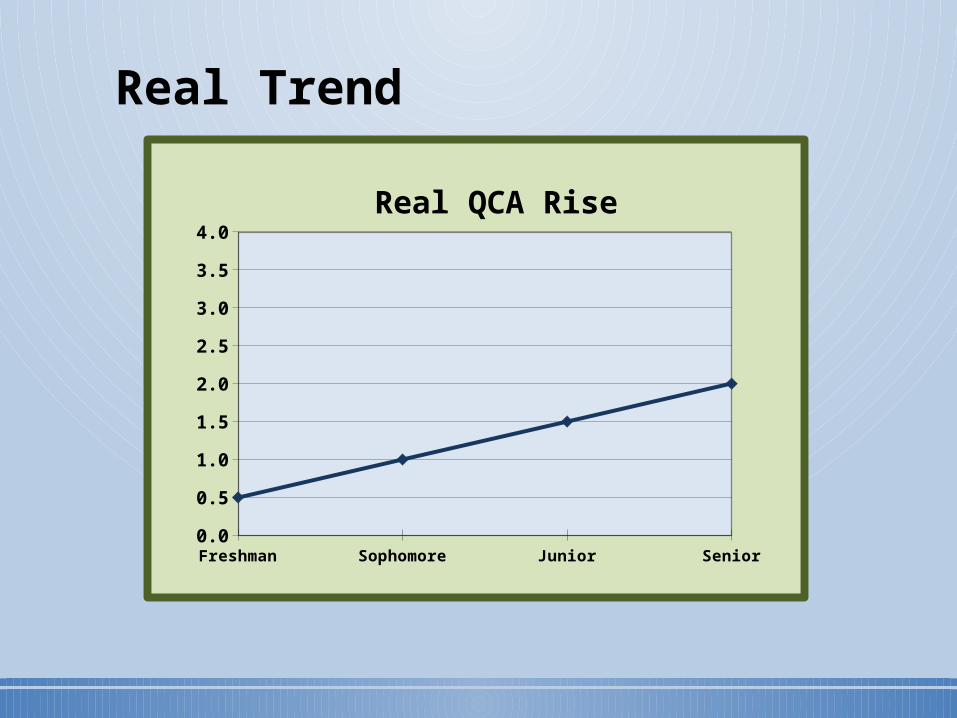
Real Trend
Freshman Sophomore Junior Senior0.0
0.5
1.0
1.5
2.0
2.5
3.0
3.5
4.0
Real QCA Rise
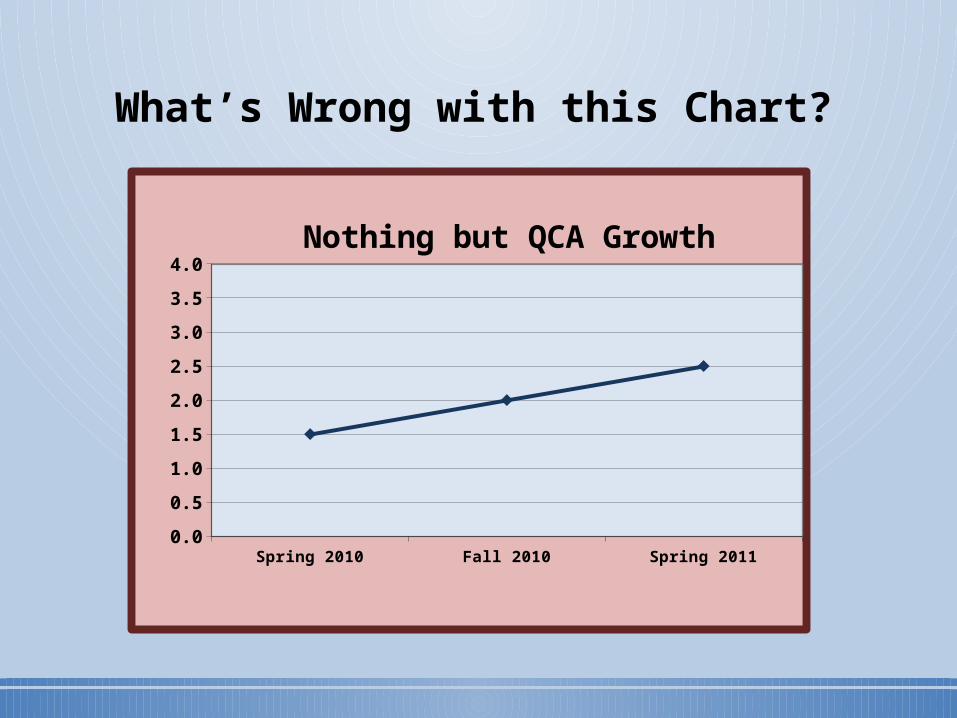
What’s Wrong with this Chart?
Spring 2010 Fall 2010 Spring 20110.0
0.5
1.0
1.5
2.0
2.5
3.0
3.5
4.0
Nothing but QCA Growth
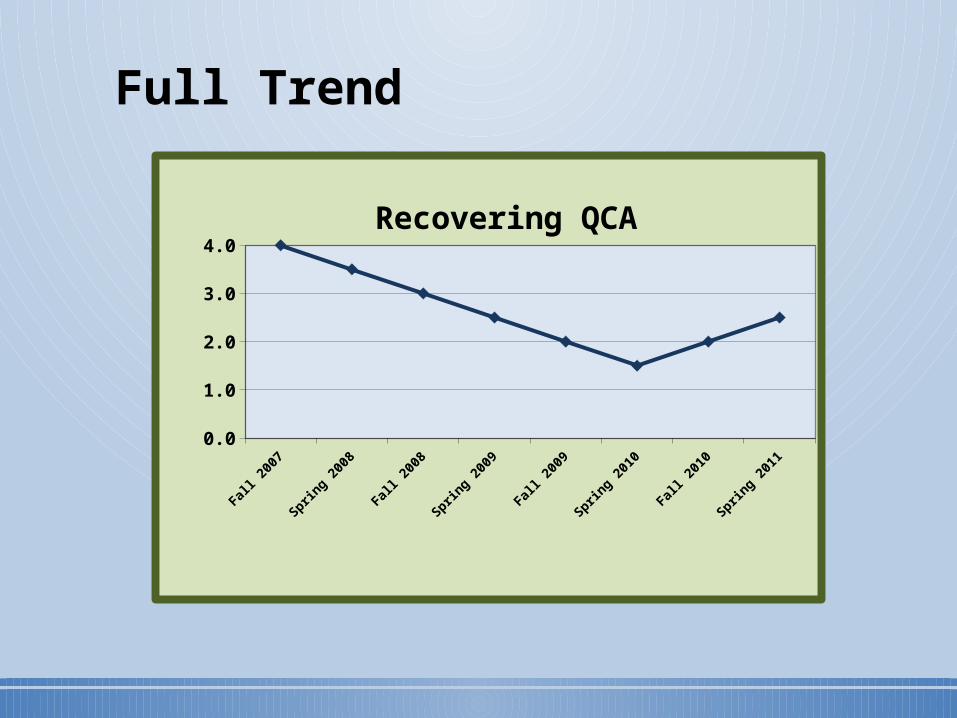
Full Trend
0.00.51.01.52.02.53.03.54.0
Recovering QCA
What’s Wrong with this Chart?
Fall 2011 Spring 2011 Fall 2010 Spring 2010 Fall 2009 Spring 20090.0
0.5
1.0
1.5
2.0
2.5
3.0
3.5
4.0
Growing QCA
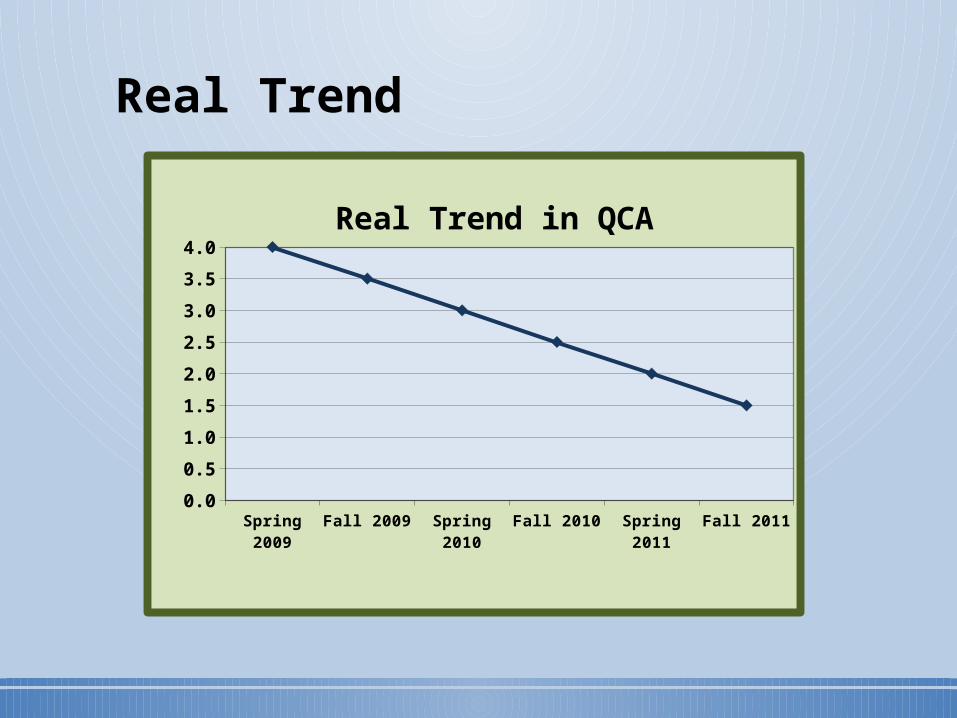
Real Trend
Spring 2009 Fall 2009 Spring 2010 Fall 2010 Spring 2011 Fall 20110.0
0.5
1.0
1.5
2.0
2.5
3.0
3.5
4.0
Real Trend in QCA
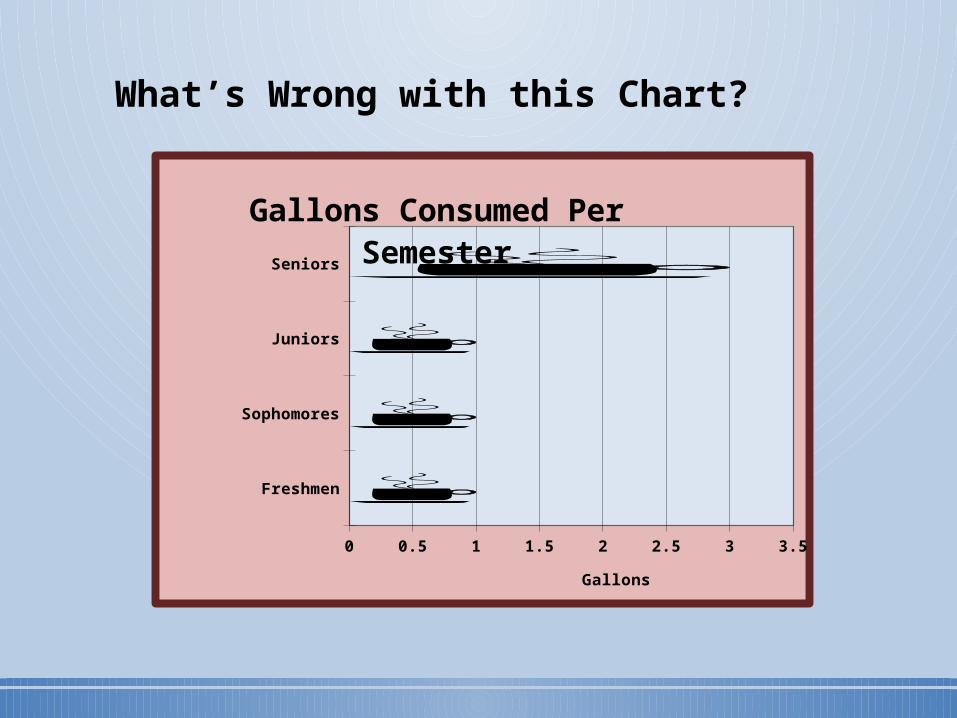
What’s Wrong with this Chart?
Freshmen
Sophomores
Juniors
Seniors
0 0.5 1 1.5 2 2.5 3 3.5
Gallons Consumed Per Semester
Gallons
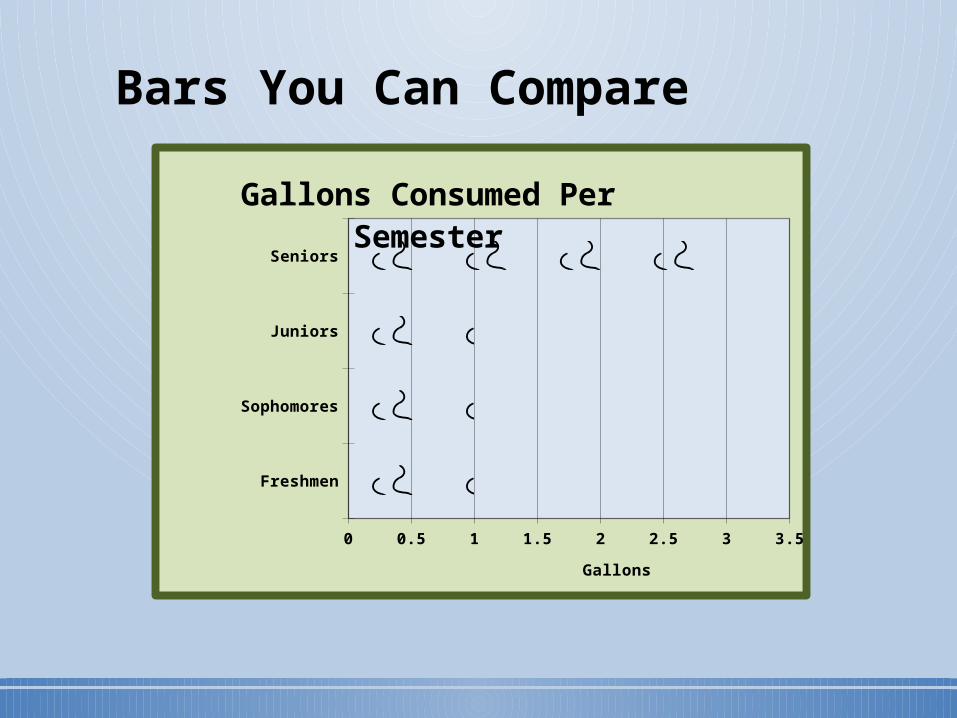
Bars You Can Compare
Freshmen
Sophomores
Juniors
Seniors
0 0.5 1 1.5 2 2.5 3 3.5
Gallons Consumed Per Semester
Gallons
What’s Wrong with this Chart?
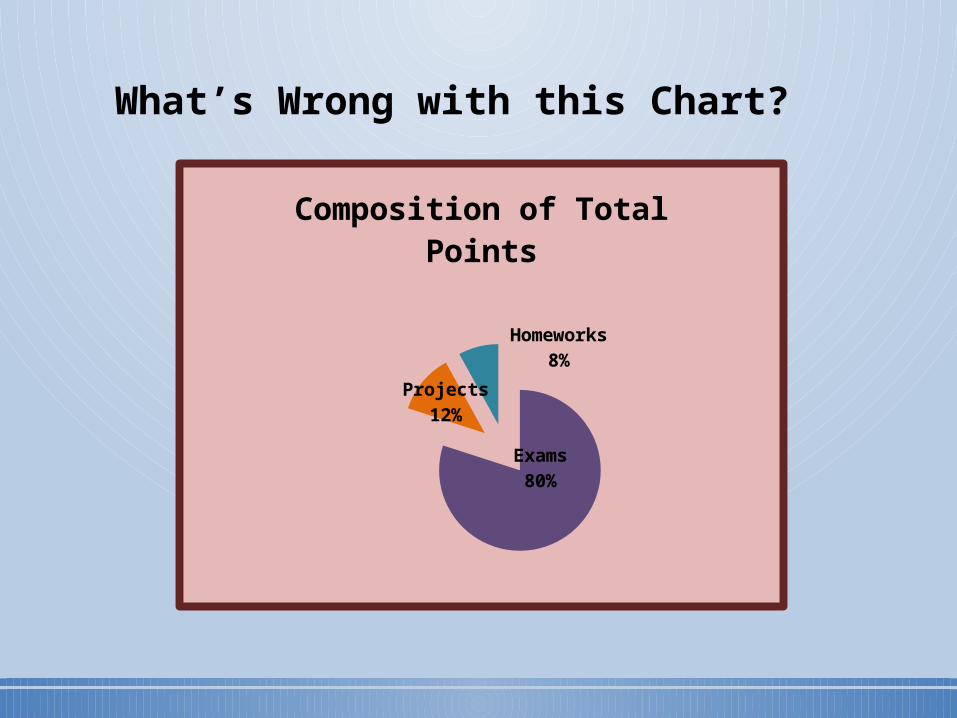
Exams80%
Projects12%
Homeworks8%
Composition of Total Points
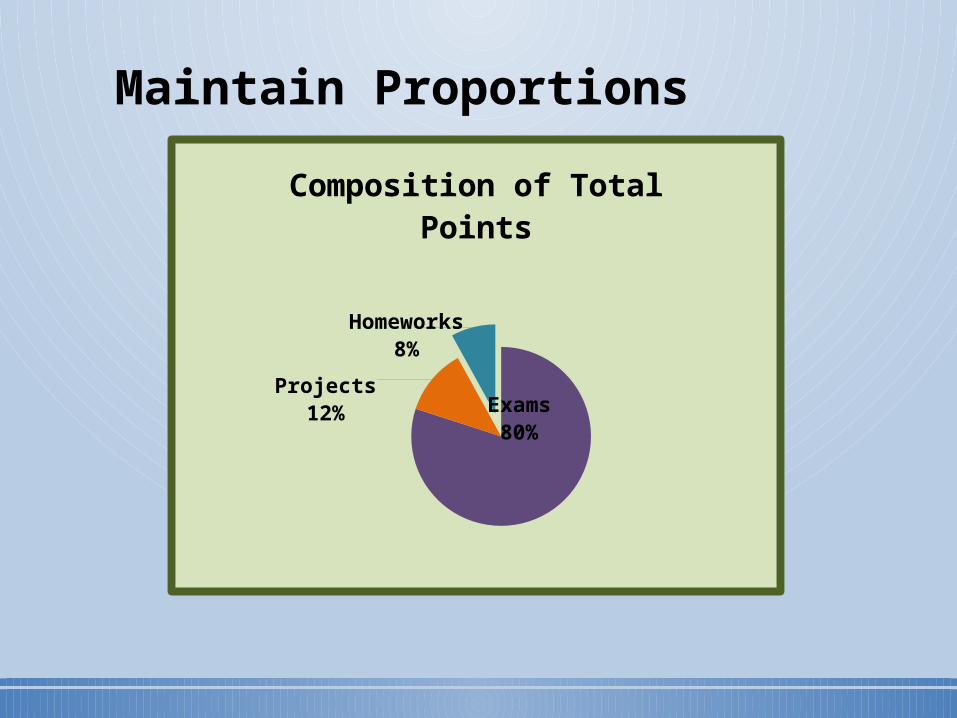
Maintain Proportions
Exams80%
Projects12%
Homeworks8%
Composition of Total Points
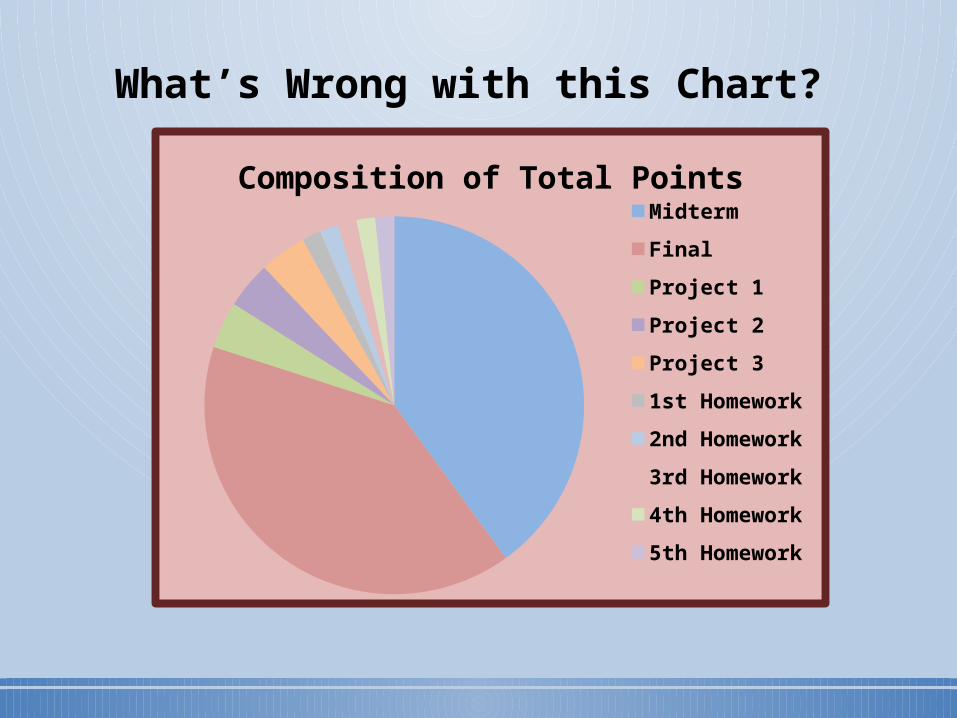
What’s Wrong with this Chart?
Composition of Total PointsMidterm
Final
Project 1
Project 2
Project 3
1st Homework
2nd Homework
3rd Homework
4th Homework
5th Homework
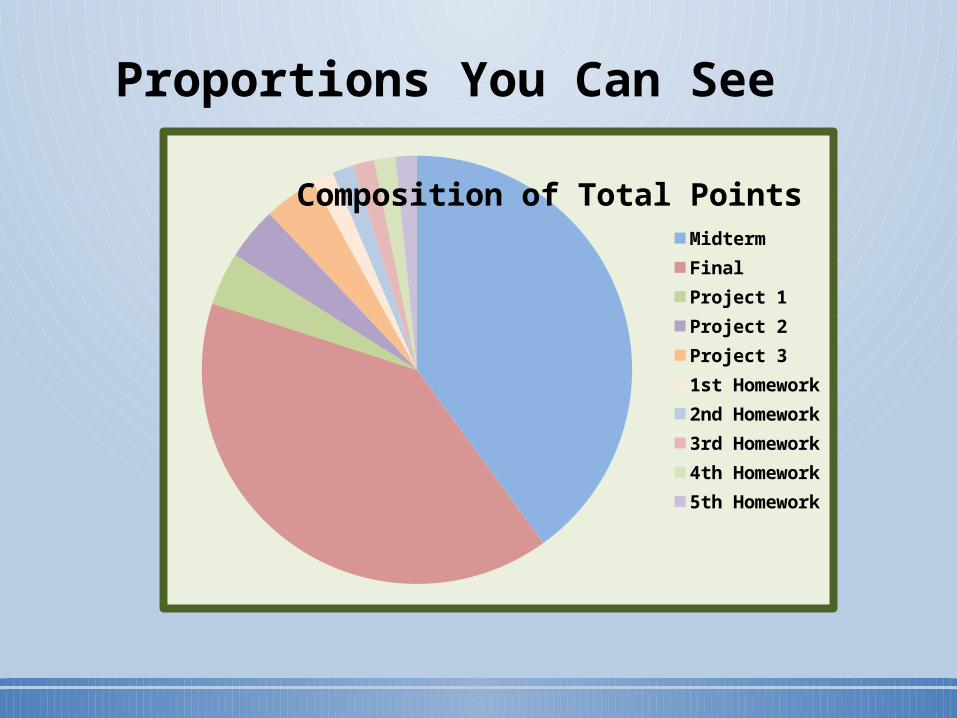
Proportions You Can See
Composition of Total Points
MidtermFinalProject 1Project 2Project 31st Homework2nd Homework3rd Homework4th Homework5th Homework
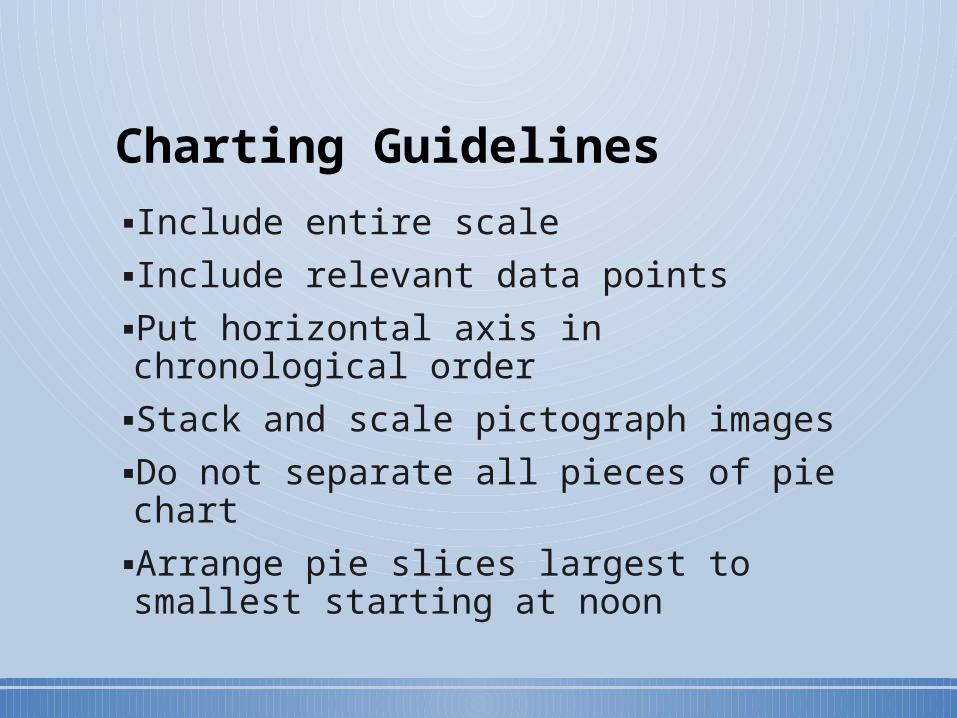
▪Include entire scale
▪Include relevant data points
▪Put horizontal axis in chronological order
▪Stack and scale pictograph images
▪Do not separate all pieces of pie chart
▪Arrange pie slices largest to smallest starting at noon
Charting Guidelines