Aggregate features for relational data Claudia Perlich, Foster Provost
date post
20-Dec-2015Category
view
221download
0
Lab 5:Pivot Tables / Pivot ChartsSimon: Chapters 7 & 8
URBPL 5/6010: Urban AnalysisUniversity of Utah
Pam Perlich
Files for this Lab
CreatePivotTable.xlsAddCalcField.xlsGetPivotTable.xlsPivotChartDB.mdbPop_Age_Sex_GOPB.xls

Pivot Tables
Summarize and analyze database filesDatabase files
Record basedEvery column must have a titleMaximum size: 8,000 total items and 256 fields
Data Pivot tableCross tabs of dataRow by Column for Data
Create a Pivot Table
Open CreatePivotTable.xlsStudy the rectangular data setNotice the columns with headingsSelect the entire data blockData PivotTable and PivotChartPivot Table / Chart Wizard appears

Pivot Table Wizard
Data source is an excel databaseObjective is to create a pivot tableMake sure you have the entire data block selected (including headings)Step 3
Put data in a new worksheetClick “Layout” to specify configuration
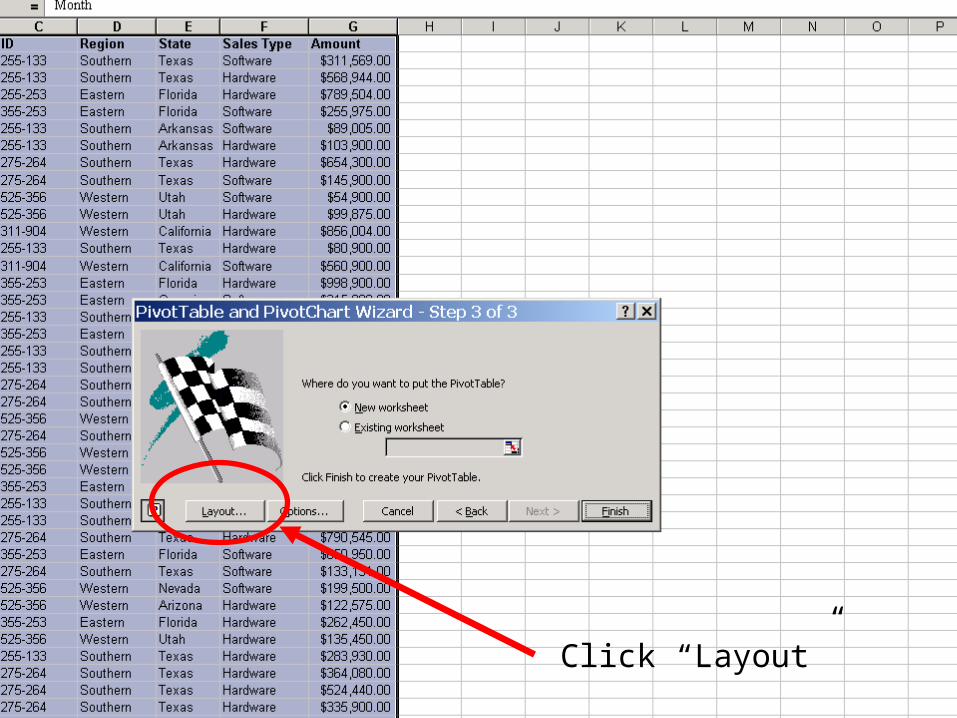
Click “Layout”

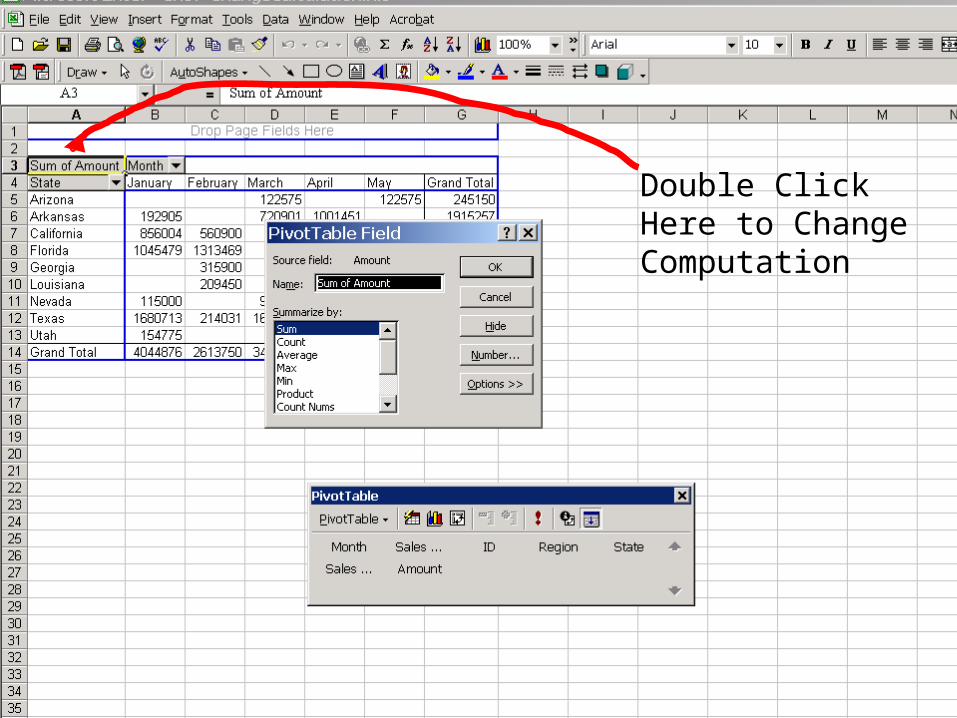
Double Click Here to Change Computation
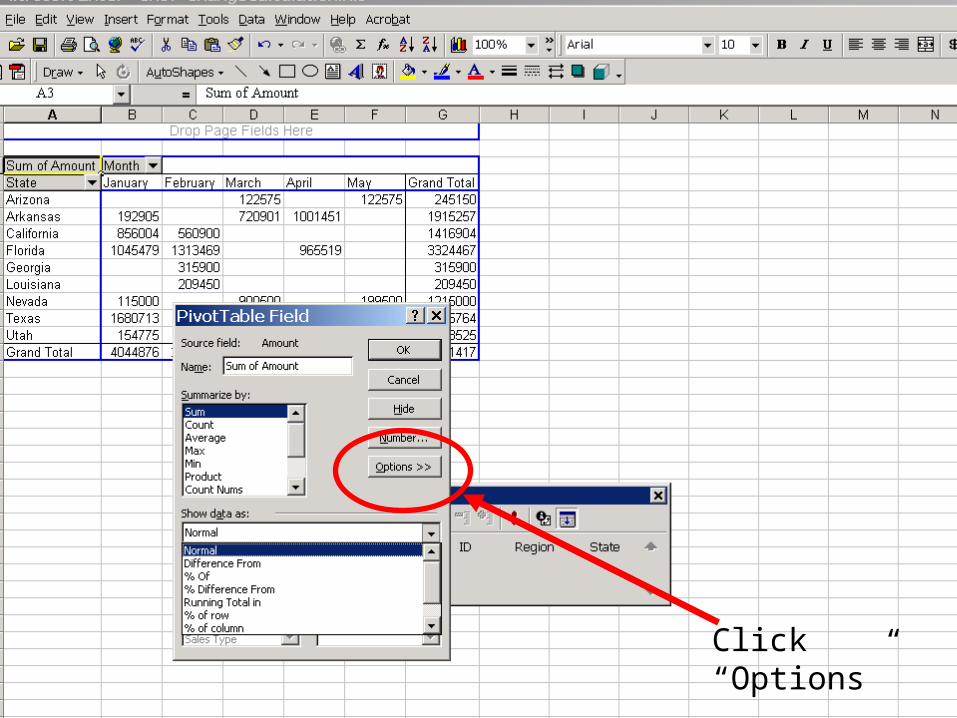
Click “Options”

Insert a Calculated Field
Open AddCalcField.xlsSelect a specific location (cell) for calculation (e.g., F6)Insert Calculated FieldWithin dialogue box
Name the fieldSpecify the formulaInsert variable names if necessary
Notice how Excel automatically adds fields to all products and areas

Insert a calculated field
1) Select cell
2) Insert => calculated field

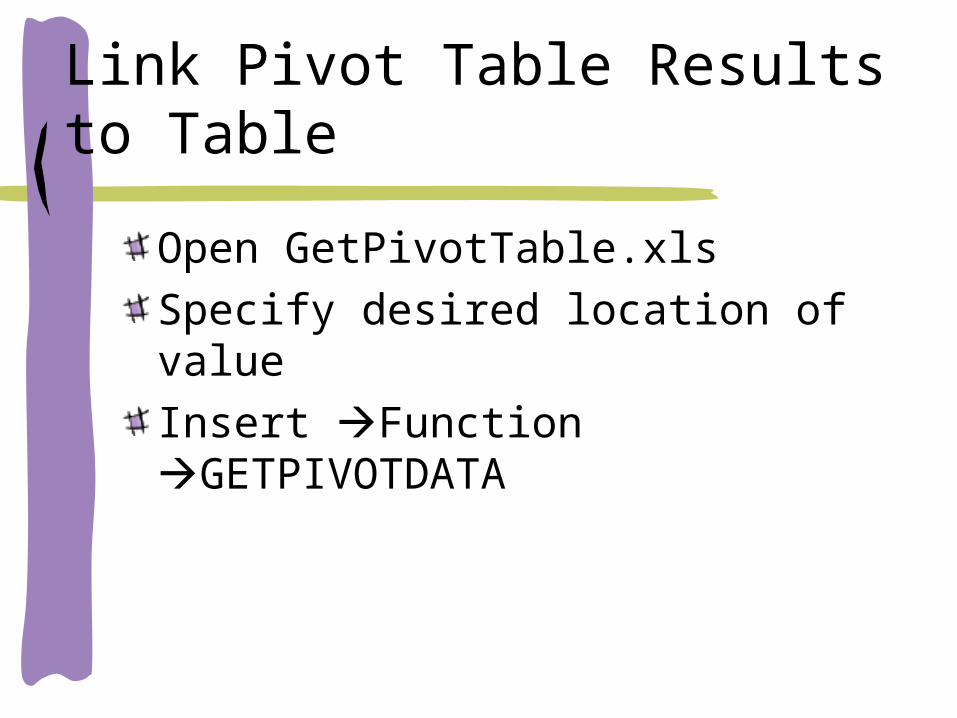
Link Pivot Table Results to Table
Open GetPivotTable.xlsSpecify desired location of valueInsert Function GETPIVOTDATA

Retrieve value from pivot table
1) Insert => Function => GETPIVOTDATA
2) Specify function arguments
3) =GETPIVOTDATA(PivotTable!C4,PivotTable!A5)

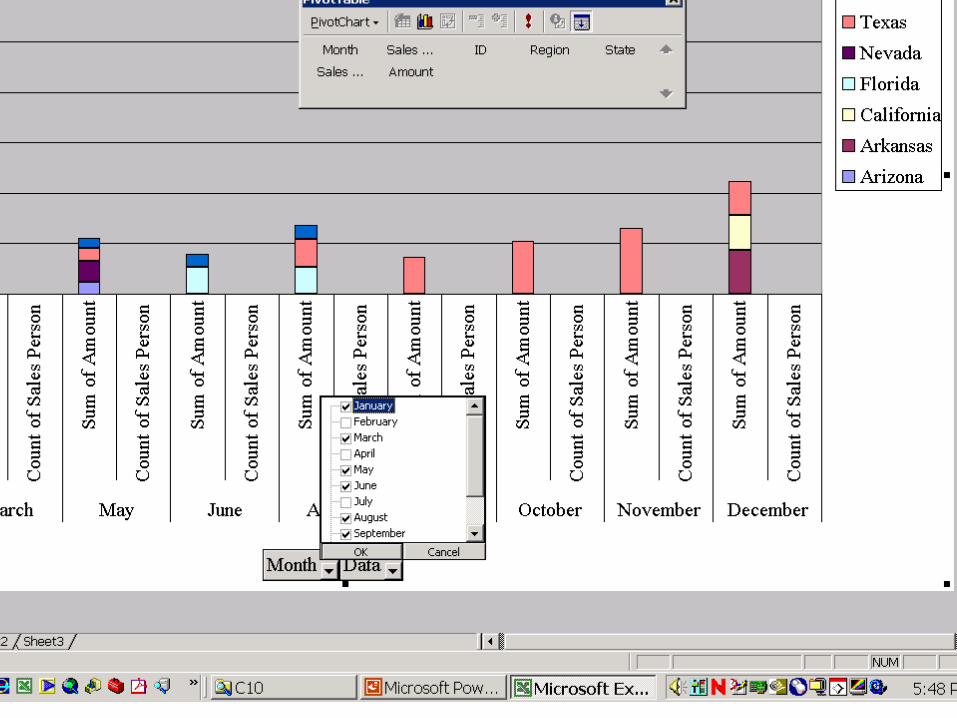
Pivot Chart
Create with same principlesCapabilities
Change chart typeChange computation (from sum to average, etc.)Add and alter fieldsFormat charts

Pivot Chart from Database
Open a new blank excel workbookDataPivot ChartExternal data sourceDialogue box opens Get DataMS Access DatabaseNavigate to and select PivotChartDB.mdbSelect and import all fieldsDrag fields onto graph to create crosstabulations

Change Crosstabulations / Format
Experiment with the features availableChange chart typesChange data elementsNotice how many of the standard charting features are available (e.g., data tables, chart type, etc.)

Demographic Data – Pivot Tables
Open Pop_Age_Sex_GOPB.xlsCreate a pivot table with various crosstabulation and filteringExample: School age populations for a selection of counties in 2050Explore pivot chart possibilities