Labour Market Analysis and Business Process Outsourcing in...
64
Labour Market Analysis and Business Process Outsourcing in Kenya: Poverty Reduction through Information and Digital Employment Initiative Research Report 2013 No 3 August 2013 Authors: Agnes Wausi, Robert Mgendi and Rosemary Ngwenyi Author Contact: Agnes N Wausi , University of Nairobi, School of Computing and Informatics, email [email protected]
Transcript of Labour Market Analysis and Business Process Outsourcing in...
Labour Market Analysis and Business Process
Outsourcing in Kenya: Poverty Reduction through
Information and Digital Employment Initiative
Research Report 2013 No 3 August 2013
Authors: Agnes Wausi, Robert Mgendi and Rosemary Ngwenyi
Author Contact: Agnes N Wausi , University of Nairobi, School of Computing and Informatics,
email [email protected]
2
Table of Contents
Executive Summary ...................................................................................................................................... 9
1 Introduction .............................................................................................................................................. 12
2 Data ......................................................................................................................................................... 13
2.1 Data sources .............................................................................................................................. 13
2.2 Age groups ................................................................................................................................ 13
2.3 Information on the BPO sector................................................................................................... 14
3 The labour market .................................................................................................................................... 15
3.1 Overall labour force size and recent trends ............................................................................... 15
3.2 Employment, unemployment, labour force participation rates by age group ............................. 16
3.3 Employment by sector ............................................................................................................... 20
3.4 Youth unemployment by urban/rural and gender...................................................................... 23
3.5 Description of sectors, industries and occupations .................................................................... 25
3.6 Job security/working conditions of the youth (with employment) ............................................... 28
3.7 Skills/capacity of the youth ........................................................................................................ 28
4 The BPO-ITES sector and its contribution to economic growth, job creation and poverty reduction ....... 33
4.1 Overview of the Kenyan BPO-ITES sector ................................................................................ 36
4.2 Types of BPO services offered and services description ........................................................... 42
4.3 Emerging domestic customer contact market and other local BPO clientele ............................. 44
4.4 Wages, working conditions and other contractual relations with BPO employers ..................... 44
4.5 Skills requirements/qualifications for the sector ......................................................................... 46
4.6 Policy initiatives aimed at creating a conducive environment for BPO growth ........................... 49
4.7 Connectivity and access to ICT (mobile, computer, internet) equipment ................................... 49
4.8 Computer literacy and use ......................................................................................................... 50
4.9 Kenya‟s BPO/ITES in relation to Impact Sourcing ..................................................................... 51
5 Discussion and implications for Impact Sourcing ..................................................................................... 55
5.1 Youth and the BPO workforce ................................................................................................... 55
5.2 Implications for urban/rural absorption into the BPO sector....................................................... 55
6 References ............................................................................................................................................... 57

3
List of Tables
Table 1: Total employment, unemployment and labour force participation (age 15-64, inclusive) .............. 15
Table 2: Total employment, unemployment and labour force participation rates ........................................ 16
Table 3: ILO estimated participation rate – 2007-2010 ............................................................................... 16
Table 4: Total labour force by age group .................................................................................................... 17
Table 5: Absorption Rate,* unemployment rate and labour force participation rate by age group ............... 19
Table 6: Employment by sector ................................................................................................................... 21
Table 7: Total recorded employment,1 2007-2011 ...................................................................................... 21
Table 8: Percentage distribution of employed persons by status in employment ........................................ 22
Table 9: Youth unemployment rates by gender and region ........................................................................ 25
Table 10: Distribution of employed persons aged 15-64 years by industry and sex in 2005/06 ................. 25
Table 11: Wage employment by industry and sector, 2007-2011 „000s...................................................... 27
Table 12: Current structure of education system ........................................................................................ 28
Table 13: School enrolment by level and gender (1998/1999) .................................................................... 29
Table 14: Education enrolment „000 ........................................................................................................... 30
Table 15: Distribution of adult literacy by region in 2005/06 ........................................................................ 31
Table 16: Summary of progress in implementation of Kenya‟s first BPO strategic priorities ....................... 34
Table 17: ICT sector (mobile, fixed, data, and postal) revenue and investment trends .............................. 37
Table 18: Growth prospect for the BPO-ITES industry ............................................................................... 39
Table 19: Summary of the job growth prospects of the BPO sector in Kenya............................................. 40
Table 20: A sample of some competitive BPO firms in Kenya .................................................................... 43
Table 21: Kenya BPO-ITES skills requirement ........................................................................................... 46
Table 22: Basic BPO/KPO skills and competencies taught in the Kenyan education system ..................... 47
4
List of Figures
Figure 1: Employed and unemployed workers by age group ...................................................................... 17
Figure 2: Primary completion rate and primary to secondary transition rate ............................................... 30
Figure 3: Service access gaps .................................................................................................................... 36
Figure 4: Direct BPO jobs trend (2007-2012 [April]) .................................................................................... 41
Appendix
Appendix A: Estimating Missing Values for the BPO inudstry ..................................................................... 61
5
Key Terms
Labour market terms
Total population
The total population of Kenya includes individuals of all ages. The total population in
2011 is estimated to be 41.61 million people.
Youth
Working age
population
This study identifies youth as 15-24 year olds. In Kenya, the government defines youth
from 15-34 however we use the International Labour Organisation definitions for
purposes of cross-country review.
The working age population of Kenya is the total number of people between the ages of
15 and 64 (inclusive). This includes the sum of the employed, the unemployed and the
economically inactive within the 15-64 age population.
Absorption rate The absorption rate is the percentage of the total working age population (or the
specified age group) that is employed.
Unemployment The strictly (or also called narrowly or official) defined unemployed are working-age
individuals who wanted work and looked for employment in the reference period
specified in the surveys. Those who wanted work but did not take any steps to look for
employment are classified as economically inactive according to this definition.
Labour force
The labour force includes all individuals who are economically active. This group
includes all those who are employed (including both formal and informal work) and all of
those who are unemployed. It does not include those who are currently in school or who
have identified themselves as economically inactive.
Labour force
participation rate
The labour force participation rate is the percentage of the total working age population
(or the specified age group) that is economically active (i.e. employed or unemployed).
Unemployment rate
Economically
inactive
Informal work
The unemployment rate (either strict or broad) is the percentage of the labour force that
is unemployed.
This includes persons who did not work or hold a job during the reference period and did
not seek work because they were either full-time students, the infirm/incapacitated,
retired or did not need work due to unspecified reasons.
Informal employment identifies persons who are in precarious employment situations
irrespective of whether or not the entity for which they work is in the formal or informal
sector. Persons in informal employment therefore consist of all persons in the informal

6
Informal sector
sector, employees in the formal sector, and persons working in private households who
are not entitled to basic benefits such as pension or medical aid contributions from their
employer, and who do not have a written contract of employment.
The informal sector has the following two components: i) Employees working in
establishments that employ less than five employees, who do not deduct income tax
from their salaries/wages; and ii) Employers, own-account workers and persons helping
unpaid in their household business who are not registered for either income tax or value-
added tax. A popular name for the informal sector in Kenya is „Jua Kali.‟
7
BPO industry terms
Business Process
Outsourcing and
Offshoring
When a company relocates voice and non-voice business processes that it used to
perform in-house:
Outsourcing occurs when it uses third party-providers to perform these
activities/services, rather than directly by internal employees of the company that owns
the business process and/or;
Offshoring occurs when these outsourced activities/services are performed in a foreign
location. These are usually managed by means of a contract or service level agreement.
Onshore Onshore refers to business processes that are handled within their home jurisdiction.
Impact sourcing An emerging sub-sector within BPO which refers to employing people who are most
disadvantaged, with limited opportunity for employment, and will be the principal workers
in business process outsourcing centres to help service clients both domestically and
internationally.
Contact centres Some examples include: inbound customer service, inbound helpdesk, inbound sales,
inbound technical support, outbound data cleaning and data capturing, outbound debt
collections, outbound customer interview, research and surveys, outbound
telemarketing/sales, web sales and marketing, advertising creative processes and
marketing research services.
Back office
processes
Some examples include: administration, data entry/preparation, data entry – scanning
and archiving, document management, translation and transcription service, forms and
report generation.
Captive A contact or business process outsourcing centre that is owned and managed by the
organisation for which the services are being provided.
Inbound Communications traffic that originates from customers and is received by agents in a
contact centre; also refers to centres that handle such work. An example would be
technical support calls.

8
Acronyms
BoP Bottom of the pyramid
BPO-ITES Business Process Outsourcing – Information Technology Enabled Services
CCK Communications Commission of Kenya
EIA Environmental impact assessment
EOI Expression of interest
FTE Full-time employment/full-time equivalent
GoK Government of Kenya
IBM International Business Machines
IEA Institute of Economic Affairs
IS Impact sourcing
KNBS Kenya National Bureau of Statistics
KES Kenya Shillings
KICTB Kenya ICT Board
KIHS Kenya Integrated Household survey
KKV Kazi Kwa Vijana
MSA Mombasa
MSE Medium and small enterprises
MTP Medium-term plan
NBI Nairobi
NHIF National Hospital Insurance Fund
NSSF National Social Security Fund
PS Permanent Secretary
SAP System Analysis and Programme Development (German company)
SEZ Special economic zones
TIVET Technical, industrial and vocational education training
UNDP United Nations Development Programme
USD United States Dollars
9
Executive Summary
Substantial attention has been paid on employment and labour strategies in Kenya within this recent period of slow
economic growth. The 2005/2006 unemployment rate in Kenya sits at 12.7% and youth unemployment rate is found
at 24.2% (using strict definition) within the age group of 20-24 years. This has resulted in a marginal decrease of the
absorption rate in the workforce. A recent Manpower survey in Kenya was carried out in 2011. However the report of
this labour-related survey had not yet been released and therefore this report mainly uses the available Kenya
integrated household survey of 1998/99 and 2005/06.
Absolute numbers of workers has increased over time in Kenya with many of the current employment opportunities
being found in the informal sector. Between the period of 2007 and 2011, reports show employment in the informal
sector grow from 7.5 million to 9.2 million and slightly increase in the formal (modern sector) from 1.9 million to 2.1
million (GoK, 2012). From these results, the government recognises the informal sector in providing employment
through its recent Micro and Small Enterprises Bill (2012).
Labour of Youth in Kenya
When looking closely at unemployment for youth, the urban labour force of youth has higher rates of unemployment
than their rural counterparts. It is evident that most of the rural youth are engaging in agriculture and informal sector.
The rural-urban migration among the youth may be the trigger for high urban unemployment rates especially among
20-24 year old cohort. With regard to gender between 1998/1999 to 2005/2006, the results were diverse for both
men and women. Unemployment rates for women increased within both urban and rural regions for those aged 15-
19 years, but decreased between the time period for 20-24 year old urban women. Youth men (in both age groups of
15-19 and 20-24) saw a slight increase in rural unemployment between 1998 and 2006. However, urban men found a
decrease in unemployment for ages 15-19 from 56.2% to 42.3% but then a slight unemployment increase for those
men ages 20-24 years old.
Youth Labour (employment)
Out of the 750,000 youth entering the job market as new job seekers, only 125,000 are absorbed into formal
employment. Few opportunities are secured in the industrial sector. Initiatives such as “Kazi Kwa Vijana” (translated
as work for the youth) undertaken by the Government of Kenya have responded to this challenge by engaging
unemployed youth in a six-month public works programme. Other Ministry of Labour initiatives such as loan provision
for youth are helping to facilitate youth employment and enterprises. Presently, over 200,000 youth have been
trained on entrepreneurship and 1,800 youth have been assisted in marketing their products and services through
government loans and 6,000 youth have gained employment abroad.
10
BPO Services Sector
The country is adopting both long-term and medium-term strategies to mitigate the unemployment trends. One
strategy is for Kenya to position itself in the global and vibrant Information and Communication Technology (ICT)
industry, and specifically to become a regional ICT centre within the East African region. To achieve this goal, the
Government of Kenya has embarked on strengthening ICTs as a driver for key industries and as enhancing
development of technology entrepreneurs and businesses as strategic pillars. However, the disproportion of ICT
access between rural and urban areas has challenged the expansion of the sub-sectors such as Business Process
Outsourcing and Information Technology-enabled services (BPO-ITES) in rural and undeserved communities in
Kenya. Several targeted Kenyan ICT initiatives have been formed within this sub-sector of BPO-ITES called Impact
Sourcing, which is specifically geared towards creating sustainable job opportunities for people at the bottom of the
pyramid. It is important to note that the BPO-ITES is an emerging sector in Kenya and limited knowledge exists on
its potential and its current position as a source of employment. To date, an estimated 7,000 BPO-ITES jobs have
been created by 2012. Most of the BPO-ITES companies are located in the capital city of Nairobi, employing mainly
urban workers. Kenya is embarking on the launching of Konza Technology city plans that estimates the creation of
about 200,000 digital jobs in the next 20 years. This initiative hopes to create an urban centre in the outskirts of
Nairobi and generate further BPO-ITES employment in more peri-rural areas where agriculture has been the
dominate source of income.
BPO Growth Prospects
Complementary strategies to support the ICT strategy include increased access to education at all levels, from
primary school up to the university level, increased access to financing and credit facilities for the youth, and
extended access to ICT broadband through undersea fibre to spur developments in the ICT sector. Kenya has high
literacy levels which stand at 79%, produces over 30,000 university graduates and over 250,000 high school
graduates annually, respectively and hosts a population with a good command of neutral English. The ICT sector
therefore can be earmarked to provide possible employment opportunities for the Kenyan youth. As Impact Sourcing
(IS) looks for potential of underserved populations, the implications of Impact Sourcing initiatives can mean the
empowerment of rural and urban youth to job placements as their work entry point. Kenya‟s BPO-ITES industry has
made strides to build the supporting infrastructure such as ensuring there are facilities with seats to help offset some
of the initial set-up costs of BPO-ITES investments. Adequate ICT training is being realised through public-private
partnerships by BPO-ITES companies and call centres that may recruit and offer in-house trainings and self-
improvement support to their employees to meet the needed skills of the BPO-ITES sector.
11
Current ICT usage and Infrastructure
Other contributors that are helping to build a digitally-prepared labour force include emerging technological spaces
and universal ICT services. The Government of Kenya has also put in place current policies that include a legal
framework conducive to boost the BPO-ITES sector. Kenya is gaining particular reputation for its technological
innovation particularly from the recent developments of innovation technology hubs where emerging entrepreneurs
have available creative space to build and promote their own mobile and software applications. From the universal
ICT services, Pasha centres or rural ICT centres are also helping to develop local digital literacy. The Kenyan
integration of mobile applications in various mobile-enabled services such as banking, and agricultural pricing are
highly adopted in Kenya. Electronic government services have also seen the increase of digitization of local content.
This growth of digitalization and digital integration are potential signs for BPO-ITES sector growth in-house or within
the country. Efforts to improve ICT infrastructure connectivity across the country would allow for the enhancement to
ICT services in rural and underserved areas, which are the prerequisites for online digital work.

12
1. Introduction
The Government of Kenya (GoK), since independence, has continuously attempted to create sufficient employment
opportunities to absorb the country‟s growing labour force. These employment creating initiatives are guided by
various policies and programmes which are further planned through sessional papers and development plans for
specific periods (IEA, 2010). However, unemployment and underemployment have been identified as difficult and
persistent problems in Kenya, and are attributed to slow economic growth, weak absorptive capacity, job selectivity
among school leavers, mismatch of skills in the labour market, failure to institute employment-intensive development
programmes, rapid growth of the population and hence the growth of the labour force (Republic of Kenya, 2008;
GoK, 2003; 2008). According to the Institute of Economic Affairs (IEA), virtually all the country‟s development plans,
sessional papers on employment, and the current long-term development blueprint: Vision 2030, promote economic
growth as the panacea to employment creation (IEA, 2010).
The Kenyan government, since the late 1980s, has pursued a number of macroeconomic interventions targeting
renewed economic growth and employment creation. These include a fiscal framework, which seeks to ensure that
the bulk of government expenditure is met from its tax revenue. It also intends to manage overall government deficit
by ensuring discipline in government spending. Also implemented is the monetary policy which targets containing
inflation to single digit levels (IEA, 2010). Over the last three decades, Kenya has experienced only two short
episodes when economic growth exceeded 5% and was sustained for at least three consecutive years: 1986-88 and
2004-07. More recently, there was a recorded growth of 5.8% in 2010 which dropped to 4.4% in 2011 (GoK, 2012).
The slow economic growth was associated with high oil and food prices, unfavourable weather conditions in most
parts of the country, the weakening Kenyan shilling in the foreign market, and the overall high annual inflation rate
(GoK, 2012). Despite the slow economic growth, a total of 520,100 new employment opportunities were created in
2011, representing an increase of 4.7% over 2010 levels, with the majority of the jobs created in the informal sector
(GoK, 2012). Although unemployment cuts across all age groups and regions, it has predominantly been a problem
for the youth and this group‟s unemployment rate has continued to grow.
The purpose of this report is to provide a labour market analysis of Kenya which will help inform the country context
for initiatives around impact sourcing (IS). Impact sourcing is an emerging sub-sector of business process
outsourcing which aims to provide work opportunities for target populations. The current worker profiles who are
targeted for IS (i.e. youth and women) are highlighted in this labour market analysis. This country report on the
Kenyan labour market environment will also provide available information on labour within Kenya‟s Business Process
Outsourcing and Information Technology Enabled Services (BPO-ITES). The research concentrates on workers‟ data
around labour participation, employment, worker characteristics and wages. The remainder of the report is structured
as follows: Section Two describes the data sources that are used for the labour market analysis as well as some of
the key sources of information on the BPO sector in Kenya. In Section Three, the general employment trends and an
analysis of the youth labour market trends as well as key characteristics of the employed and unemployed youth are
presented. Section Four then presents a brief overview of the BPO sector and employment potential in Kenya.

13
2. Data
2.1 Data sources
To date, there have been two Labour Force surveys carried out in Kenya, one in 1998/99 and the other in 2005/06.
Both surveys have been used to analyse this report‟s labour market trends and sector developments. The national
surveys are carried out by the Kenya National Bureau of Statistics (KNBS), a semi-autonomous government agency
established by the Kenya Act of Parliament – the Statistics Act, 2006, whose mandate is for the: 1) collection of
statistical information; 2) compilation of statistical information; 3) analysis of statistical information, publication and
dissemination of statistical information for public use; and 4) coordination, monitoring and supervision of the National
Statistical System.
The 1998/99 survey was dubbed the Integrated Labour Force survey and was the first of its kind in Kenya that
incorporated three modules: the Labour Force, Informal Sector and Child Labour. The report was released in March
2003. The second survey, carried out in 2005/06, was the Kenya Integrated Household Budget survey (KIHS) that
incorporated a labour force module, with the objective of updating the 1998/99 labour force information. These two
surveys are the core sources of the labour market analysis of this report.1 One should note that there is a paucity of
most current labour market data currently available in Kenya especially amongst youth unemployment figures. The
Ministry of Labour in collaboration with KNBS and other line ministries undertook a National Manpower Survey from
April to August 2011, to obtain data and a skills inventory necessary to guide the development of the nation‟s human
resources and prepare labour legislation. The report for this survey was not yet released at the time of writing this
report. However, the Ministry of Labour is in the process of preparing the 2010 report which should then provide more
recent statistics on the Kenya labour market.
2.2 Age groups
The International Labour Organisation (ILO) defines the youth as those aged between 15 and 24 (inclusive), while
the Kenyan Constitution defines youth as all individuals in the republic who have attained the age of 18 years, but
have not attained the age of 35 (GoK, 2010). For purposes of this report and to have comparative results with other
countries, unless specified, the definition of the youth shall be those in the 15-24 age bracket.
When at times this report adopts the wider Kenya definition, the 18-34 age bracket, we speculate that the analysis
will produce different results and will be noted in the report.
1 In both surveys, the labour force framework adopted is the Labour Force Framework (ICLS 1982) which as a set of international guidelines, sets the measurement rules for classifying persons according to their activities during a short reference period. It defines three mutually exclusive and exhaustive population categories, namely, the employed, the unemployed and the economically inactive population. This framework has succeeded in encouraging the production of regular statistics on employment and unemployment which are reasonably comparable between a large number of countries. We can therefore be confident of the comparability of the labour force estimates derived from these two surveys – i.e. the employment and unemployment estimates are directly comparable.

14
2.3 Information on the BPO sector
The Business Process Outsourcing and Information Technology Enabled Services (BPO-ITES) sector in Kenya is still
in its infancy. Information collected for this sector in this report mainly consists of GoK papers, industry reports and
research articles. The Kenya ICT Board (KICTB), a government parastatal under the Ministry of Information and
Communication, has been actively involved in spearheading the growth of the BPO-ITES sector. The board has
produced research and working reports that have helped to inform the analysis of the BPO-ITES sector contained
herein. A further source of data is the Communications Commission of Kenya (CCK), which is charged with
regulating the communications industry in Kenya. Most of the referenced articles have been limited to 2006 onwards,
and the available reports reflect on previous barriers to creating an enabling business environment for the BPO-ITES
sector, such as tax incentives, training subsidies, and the cost of internet which are being mitigated by the
government of Kenya.

15
3. The labour market
3.1 Overall labour force size and recent trends
The Kenyan 2009 Census reported that the population of Kenya was at 38.6 million, compared to 28.7 million in
1999. This is an increase of 9.9 million over a period of ten years. The World Bank in 2011 reported an estimated
annual population growth rate of 2.7%, resulting in a population estimate of 41.61 million in 2011.2
According to the most recently released Kenyan Integrated Household survey (2005/06), the economically active
population (between the ages of 15-64) was constituted of 12.7 million employed persons and 1.9 million
unemployed persons while the inactive population3 amounted to around 5.3 million persons. In comparison to the
1998/99 Labour Force survey, the number of those who were employed was 10.5 million, unemployed was
1.8 million and inactive was 3.6 million. The overall size of the labour force was 14.5 million in 2005/06 and
12.3 million in 1998/99, as presented in Table 1.
Table 1: Total employment, unemployment and labour force participation (age 15-64, inclusive)
1998/99 2005/06
Employed 10,525,610 12,708,035
Unemployed 1,800,622 1,856,294
Total labour force (employed + unemployed) 12,326,232 14,564,329
Inactive 3,599,232 5,266,112 Source: GoK 2003; 2008
The data presented in Table 1 suggests that there was an 18.6% increase in the Kenyan labour force between 1998
and 2006. This can be attributed to the general increase of the population over the period. During the same period
there was a 47.2% increase in the inactive population. Out of the inactive population, 68.2% were reported to be full-
time students in 2005/06 compared to 47.3% recorded as full-time students in the 1998/1999 survey. The 15-19 age
group contributes to 61% of the inactive population, which is expected as the age majority of the population is school
going. The numbers of the inactive population aged between 20-24 and 25-29 also increased over the same period
from 485,067 and 165,931 to 992,053 and 445,359 respectively.
In addition the increase of the inactive population for the age group 20-24 may suggest that government made
successful efforts in persuading post-secondary youth to join technical and vocational training institutes. These
tertiary institutions and universities thereby extended the time for the 19-22 age group to be away from the work
force. Within the inactive population, some youth may also be identified as discouraged workers.
2 http://data.worldbank.org/country/Kenya
3 Read definition under the report section: key labour terms.
16
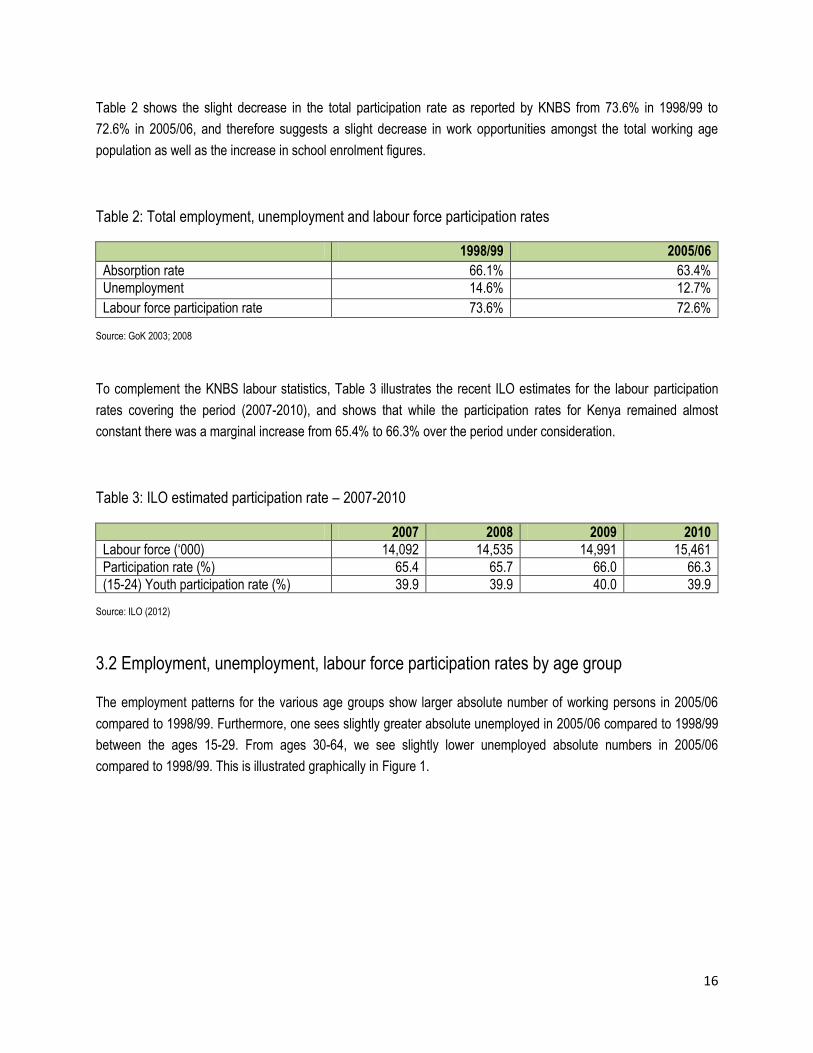
Table 2 shows the slight decrease in the total participation rate as reported by KNBS from 73.6% in 1998/99 to
72.6% in 2005/06, and therefore suggests a slight decrease in work opportunities amongst the total working age
population as well as the increase in school enrolment figures.
Table 2: Total employment, unemployment and labour force participation rates
1998/99 2005/06
Absorption rate 66.1% 63.4%
Unemployment 14.6% 12.7%
Labour force participation rate 73.6% 72.6% Source: GoK 2003; 2008
To complement the KNBS labour statistics, Table 3 illustrates the recent ILO estimates for the labour participation
rates covering the period (2007-2010), and shows that while the participation rates for Kenya remained almost
constant there was a marginal increase from 65.4% to 66.3% over the period under consideration.
Table 3: ILO estimated participation rate – 2007-2010
2007 2008 2009 2010
Labour force („000) 14,092 14,535 14,991 15,461
Participation rate (%) 65.4 65.7 66.0 66.3
(15-24) Youth participation rate (%) 39.9 39.9 40.0 39.9 Source: ILO (2012)
3.2 Employment, unemployment, labour force participation rates by age group
The employment patterns for the various age groups show larger absolute number of working persons in 2005/06
compared to 1998/99. Furthermore, one sees slightly greater absolute unemployed in 2005/06 compared to 1998/99
between the ages 15-29. From ages 30-64, we see slightly lower unemployed absolute numbers in 2005/06
compared to 1998/99. This is illustrated graphically in Figure 1.

17
Figure 1: Employed and unemployed workers by age group
Source: GoK 2003; 2008
Table 4 shows the labour force composition broken down by age group. As an absolute number, the unemployed
amongst the 20-24 year olds represent the largest group of unemployed persons followed by those amongst the 25-
29 year olds.
A further analysis indicates that when looking at the total labour force, the labour force percentage aged between 20-
24 years was 16.0% (1998/99) and 17.2% (2005/06), while for the 25-29 age bracket, it was 15% (1998/99) and 17%
(2005/06). This is a slight proportional increase of these age groups out of the total labour force for this
time period.
Table 4: Total labour force by age group
1998/99 2005/06
15-19
Employed 843,909 1,056,015
Unemployed 270,217 352,357
Total labour force (employed + unemployed) 1,114,126 1,408,372
Inactive 2,349,270 3,210,685
20-24
Employed 1,435,405 1,895,834
Unemployed 533,078 605,167
Total labour force (employed + unemployed) 1,968,483 2,501,001
Inactive 485,067 992,053

18
1998/99 2005/06
25-29
Employed 1,584,271 2,088,468
Unemployed 291,679 388,747
Total labour force (employed + unemployed) 1,875,950 2,477,215
Inactive 165,931 335,359
30-34
Employed 1,541,604 1,897,206
Unemployed 185,927 154,360
Total labour force (employed + unemployed) 1,727,531 2,051,566
Inactive 94,668 169,531
35-39
Employed 1,533,196 1,497,662
Unemployed 140,147 122,725
Total labour force (employed + unemployed) 1,673,343 1,620,387
Inactive 91,739 101,214
40-44
Employed 1,128,190 1,357,371
Unemployed 113,165 92,262
Total labour force (employed + unemployed) 1,241,355 1,449,633
Inactive 68,964 91,978
45-49
Employed 992,261 1,070,783
Unemployed 88,596 64,636
Total labour force (employed + unemployed) 1,080,857 1,135,419
Inactive 67,260 81,760
50-54
Employed 702,199 787,417
Unemployed 66,839 38,666
Total labour force (employed + unemployed) 769,038 826,083
Inactive 82,769 95,607
55-59
Employed 412,639 624,308
Unemployed 64,235 26,350
Total labour force (employed + unemployed) 476,874 650,658
Inactive 87,107 91,389
60-64
Employed 351,936 432,972
Unemployed 46,739 11,024
Total labour force (employed + unemployed) 398,675 443,996
Inactive 106,457 96,536 Source: GoK 2003; 2008
19
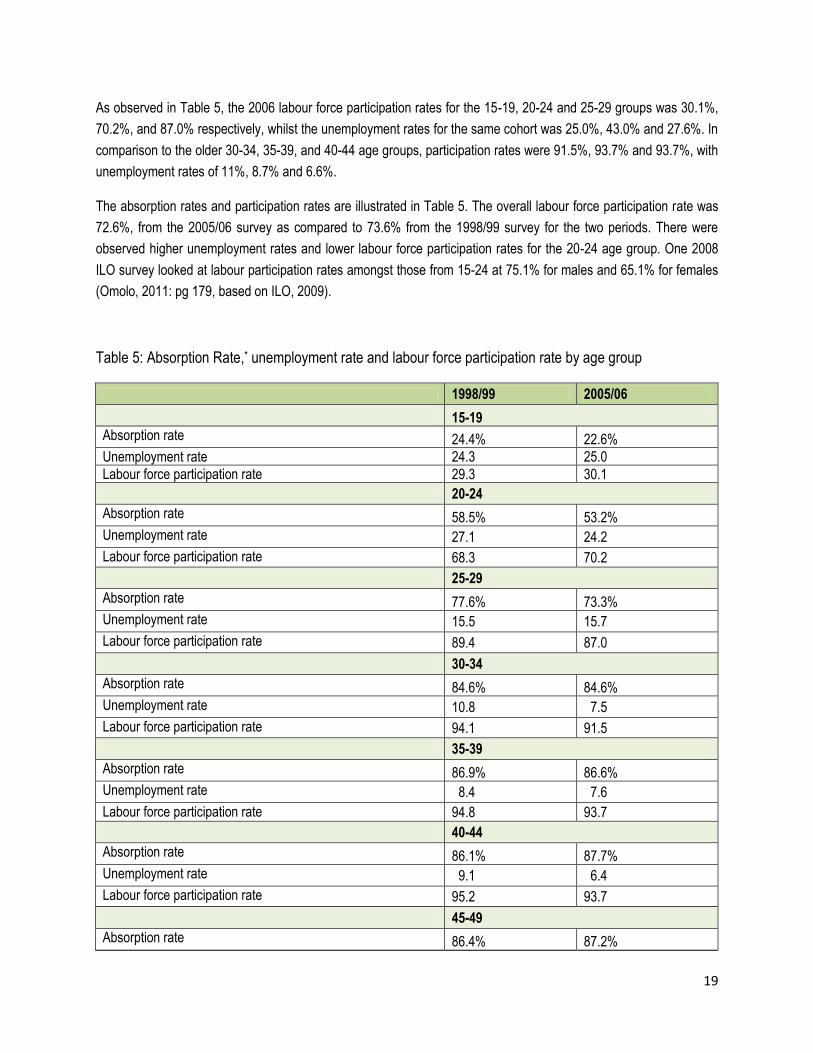
As observed in Table 5, the 2006 labour force participation rates for the 15-19, 20-24 and 25-29 groups was 30.1%,
70.2%, and 87.0% respectively, whilst the unemployment rates for the same cohort was 25.0%, 43.0% and 27.6%. In
comparison to the older 30-34, 35-39, and 40-44 age groups, participation rates were 91.5%, 93.7% and 93.7%, with
unemployment rates of 11%, 8.7% and 6.6%.
The absorption rates and participation rates are illustrated in Table 5. The overall labour force participation rate was
72.6%, from the 2005/06 survey as compared to 73.6% from the 1998/99 survey for the two periods. There were
observed higher unemployment rates and lower labour force participation rates for the 20-24 age group. One 2008
ILO survey looked at labour participation rates amongst those from 15-24 at 75.1% for males and 65.1% for females
(Omolo, 2011: pg 179, based on ILO, 2009).
Table 5: Absorption Rate,* unemployment rate and labour force participation rate by age group
1998/99 2005/06
15-19
Absorption rate 24.4% 22.6%
Unemployment rate 24.3 25.0
Labour force participation rate 29.3 30.1
20-24
Absorption rate 58.5% 53.2%
Unemployment rate 27.1 24.2
Labour force participation rate 68.3 70.2
25-29
Absorption rate 77.6% 73.3%
Unemployment rate 15.5 15.7
Labour force participation rate 89.4 87.0
30-34
Absorption rate 84.6% 84.6%
Unemployment rate 10.8 7.5
Labour force participation rate 94.1 91.5
35-39
Absorption rate 86.9% 86.6%
Unemployment rate 8.4 7.6
Labour force participation rate 94.8 93.7
40-44
Absorption rate 86.1% 87.7%
Unemployment rate 9.1 6.4
Labour force participation rate 95.2 93.7
45-49
Absorption rate 86.4% 87.2%

20
1998/99 2005/06
45-49
Unemployment rate 8.2 5.7
Labour force participation rate 93.4 92.5
50-54
Absorption rate 82.4% 85.0%
Unemployment rate 8.7 4.7
Labour force participation rate 90.3 89.2
55-59
Absorption rate 73.2% 83.7%
Unemployment rate 13.5 4.0
Labour force participation rate 85.1 87.2
60-64
Absorption rate 69.7% 79.9%
Unemployment rate 11.7 2.5
Labour force participation rate 80.9 82.0 Source: GoK 2003; 2008 * derived by authors
3.3 Employment by sector
The total number of employed people in the Kenyan economy is further categorised into three broad employment
sectors: a) informal; b) formal or modern; and c) the small scale agriculture and/or pastoralist (referred to as
agriculture).
Informal sector: The Kenyan informal sector is defined to cover all semi-organised and unregulated activities that
are small-scale in terms of employment. The activities are largely undertaken by self-employed persons or employers
of a few workers in the open markets, in market stalls, in both developed and undeveloped premises, in residential
houses or on street pavements. Agricultural activities are excluded in the coverage of informal sector activities.
Formal sector: This sector is defined to include the entire public sector and private enterprises that are formal in
terms of registration, taxation and official recording (incorporated enterprises).
Small scale farming and pastoralists activities: This category includes farm-related economic activities that are
mainly located in rural areas. Due to their non-registration nature, they are neither within the formal or modern sector
nor are they in the informal sector.
21
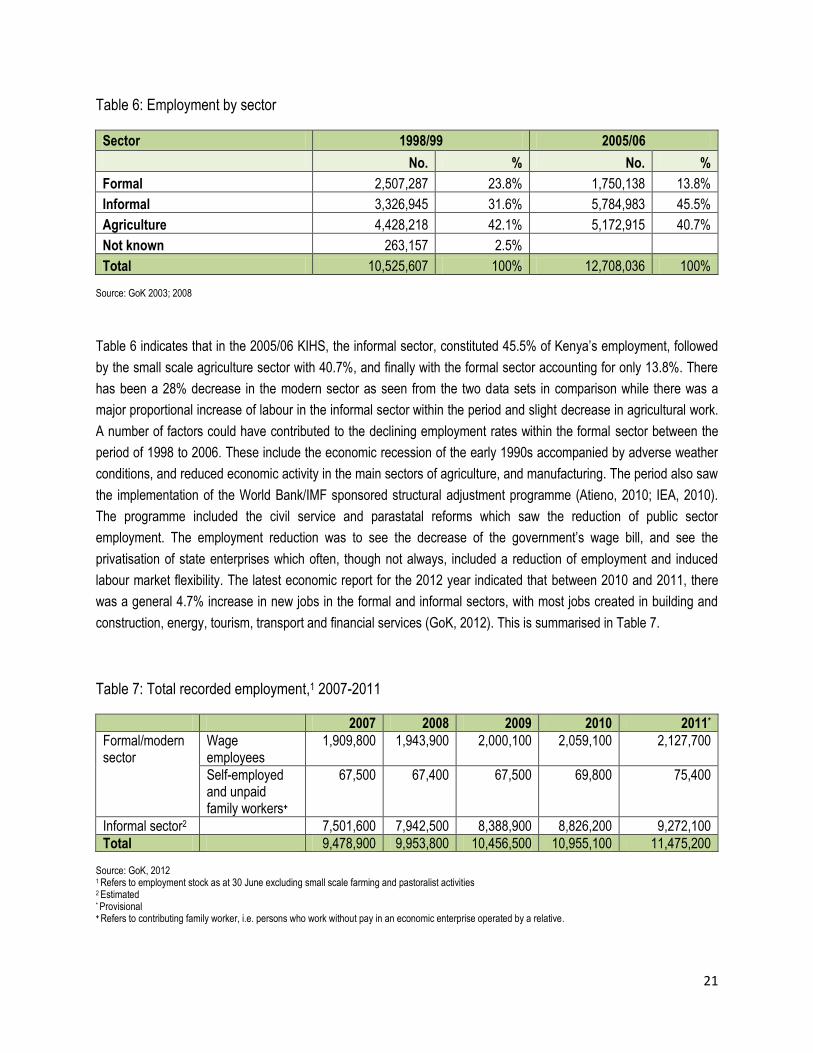
Table 6: Employment by sector
Sector 1998/99 2005/06
No. % No. %
Formal 2,507,287 23.8% 1,750,138 13.8%
Informal 3,326,945 31.6% 5,784,983 45.5%
Agriculture 4,428,218 42.1% 5,172,915 40.7%
Not known 263,157 2.5% Total 10,525,607 100% 12,708,036 100%
Source: GoK 2003; 2008
Table 6 indicates that in the 2005/06 KIHS, the informal sector, constituted 45.5% of Kenya‟s employment, followed
by the small scale agriculture sector with 40.7%, and finally with the formal sector accounting for only 13.8%. There
has been a 28% decrease in the modern sector as seen from the two data sets in comparison while there was a
major proportional increase of labour in the informal sector within the period and slight decrease in agricultural work.
A number of factors could have contributed to the declining employment rates within the formal sector between the
period of 1998 to 2006. These include the economic recession of the early 1990s accompanied by adverse weather
conditions, and reduced economic activity in the main sectors of agriculture, and manufacturing. The period also saw
the implementation of the World Bank/IMF sponsored structural adjustment programme (Atieno, 2010; IEA, 2010).
The programme included the civil service and parastatal reforms which saw the reduction of public sector
employment. The employment reduction was to see the decrease of the government‟s wage bill, and see the
privatisation of state enterprises which often, though not always, included a reduction of employment and induced
labour market flexibility. The latest economic report for the 2012 year indicated that between 2010 and 2011, there
was a general 4.7% increase in new jobs in the formal and informal sectors, with most jobs created in building and
construction, energy, tourism, transport and financial services (GoK, 2012). This is summarised in Table 7.
Table 7: Total recorded employment,1 2007-2011
2007 2008 2009 2010 2011*
Formal/modern sector
Wage employees
1,909,800 1,943,900 2,000,100 2,059,100 2,127,700
Self-employed and unpaid family workers+
67,500 67,400 67,500 69,800 75,400
Informal sector2 7,501,600 7,942,500 8,388,900 8,826,200 9,272,100
Total 9,478,900 9,953,800 10,456,500 10,955,100 11,475,200 Source: GoK, 2012 1 Refers to employment stock as at 30 June excluding small scale farming and pastoralist activities
2 Estimated
* Provisional + Refers to contributing family worker, i.e. persons who work without pay in an economic enterprise operated by a relative.
22
As illustrated in Tables 6 and 7, the largest employment sector is the informal sector, popularly known in Kenya as
the „jua kali‟ sector. By 2011, the wage employee accounted for 2.1 million Kenyans in the formal sector, which has
only had incremental increases since 2007.
Kenya has high numbers of employees in the informal sector as a result of interventions by the government. The
publication of Sessional Paper No. 1 of 1986: Economic Management for Renewed Growth (1986) acknowledged the
crucial role of the informal sector in creating jobs. As the first significant national policy document, the publication
recommended that the informal sector be recognised as a dynamic force. In 1992, there was a further Sessional
Paper titled, „Small Enterprise and Jua Kali Development in Kenya,‟ which focused solely on the potential of the
informal economy. The paper targeted all possible activities that were related to the informal sector, and urged all
ministries to take a series of specific actions to approach the informal sector. The publishing of the Sessional Paper
(No. 2 of 1992) is an indication that the Kenyan government acknowledges the potential of the informal sector to
create employment and grow the economy. In 1992, the Sessional Paper introduced the term, „jua kali‟ sector. After
deliberations, the Micro and Small Enterprises or MSE bill has now materialized with the MSE bill passed as an act of
parliament, referred to as MSE Act 2012. The MSE Act 2012 intends to support the growth of the MSE sector.
Indeed the MSE Act 2012 defines "farm enterprise" to include micro and small scale agricultural, livestock and fishing
enterprises. The document points out that „small farms are also small businesses.‟ These policies have resulted in an
improved availability of micro-credit, support services to micro and small enterprises (Ministry of Labour, 2012).
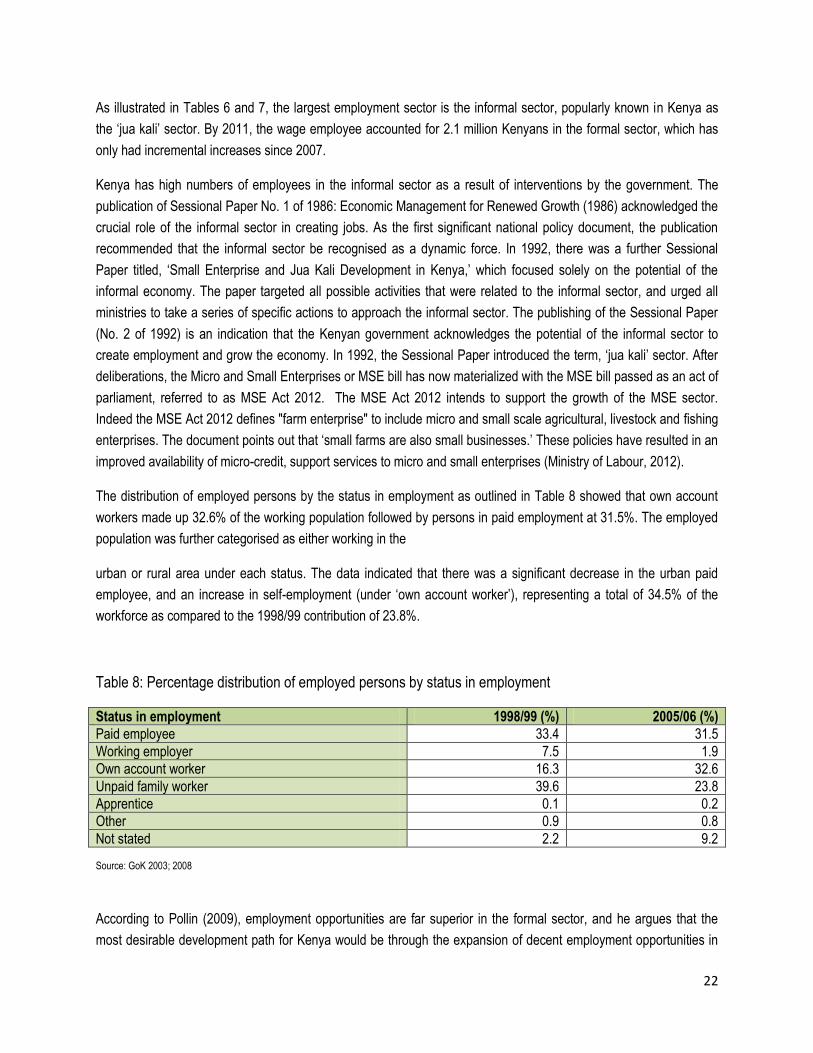
The distribution of employed persons by the status in employment as outlined in Table 8 showed that own account
workers made up 32.6% of the working population followed by persons in paid employment at 31.5%. The employed
population was further categorised as either working in the
urban or rural area under each status. The data indicated that there was a significant decrease in the urban paid
employee, and an increase in self-employment (under „own account worker‟), representing a total of 34.5% of the
workforce as compared to the 1998/99 contribution of 23.8%.
Table 8: Percentage distribution of employed persons by status in employment
Status in employment 1998/99 (%) 2005/06 (%)
Paid employee 33.4 31.5
Working employer 7.5 1.9
Own account worker 16.3 32.6
Unpaid family worker 39.6 23.8
Apprentice 0.1 0.2
Other 0.9 0.8
Not stated 2.2 9.2 Source: GoK 2003; 2008
According to Pollin (2009), employment opportunities are far superior in the formal sector, and he argues that the
most desirable development path for Kenya would be through the expansion of decent employment opportunities in
23
its formal economy. The formal sector is regulated through tax and law while the informal sector is not. For example
in the formal sector employees may join trade unions which gives them bargaining power, they have regular income,
and they are entitled to annual leave, sick leave, maternity and paternity leave, and medical cover (National Hospital
Insurance Fund is mandatory in Kenya). Furthermore, formal sector workers are enrolled in pension schemes
(National Social Security Fund is mandatory), employers are expected to maintain certain security standards and
workman‟s compensation in case of injury. Formal employment provides new entrants with training opportunities
(formal or in-house), mentorship by skilled and experienced workers, and career growth prospects. In addition, the
new entrants also learn or pick up on work ethics. Due to these working conditions, „new entrants‟ to the labour
market will tend to seek employment opportunities in the formal sector.
The informal sector however continues to play an important employment role in complementing the formal sector
through job opportunities for the youth and the older population who exit from employment in the formal sector either
through early/normal retirement and retrenchment. This is attributed to the ease of entry into and exit from this sector,
the use of low-level technology, availability of credit from micro-credit finance institutions, the government policies,
and co-operative societies (GoK, 2012). The informal sector jobs, however, are precarious in nature as characterised
by job insecurity, poor wages and terms and conditions of employment, lack of social protection, weak safety and
health standards, and low job tenure (Omolo, 2010).
A general observed trend in Kenya is that there is an increasing tendency to engage workers on casual terms of
employment. Employers in Kenya, including in the public sector, have recently adopted the use of casual, temporary,
part-time, contract, sub-contract and outsource employment as a strategic measure to gain control and manage
labour. This is driven by the need to reduce labour costs, achieve flexibility and avoid labour legislation and the rights
won by trade unions. This trend is not favourable to the youth who are the majority of the new workers or job seekers.
These cadres of employees are not entitled to many of the usual rights and benefits of employment. A case in point is
casual employees are employed and paid on a daily basis and there is no guarantee of work the following day.
From the observed data, the slight rise in modern sector employment and the greater growth in informal work cannot
go unobserved. The Kenyan labour market is considered to be dually represented in both the formal sector alongside
the informal sector.
3.4 Youth unemployment by urban/rural and gender
Youth unemployment is a growing issue in Kenya. According to the 2009 population and housing census, 34% of the
Kenyan population are aged between 15 and 34. This is a substantial workforce that could contribute significantly to
economic growth. However, much of this labour force is unutilised. According to the Kenya Household Integrated
Budget Survey (KIHBS) of 2005/06, unemployment stood at 25.0% for 15-19 year-olds, 24.2% for 20-24 year-olds,
15.7% for those aged 25-29 and 7.5% for the age group 30-34.

24
The Kenya Integrated Household Budget Survey of 2005/06 also indicated that rising unemployment and increasing
poverty have been critical development concerns in Kenya since independence. The report particularly noted that
unemployment had been predominantly a problem of the youth. The causes of unemployment were identified as:
rapid growth of population and the consequent growth of the labour force;
lack of economic growth and job creation sufficiently to absorb job seekers;
job selectivity among school leavers;
skills imbalance in the labour market;
inappropriate technology applications; and
failure to institute employment intensive development programmes.
Furthermore, the government introduced free primary education to equip the youth with basic life skills and to lay the
foundation for a well-equipped workforce. As mentioned earlier, many youth among the economically inactive remain
in the secondary and post-secondary education programme. However these education interventions play part of the
long-term plan and the current problem of youth unemployment needs a complementary intervention in the short to
medium term (African Economic Outlook 2012 – Kenya country note).
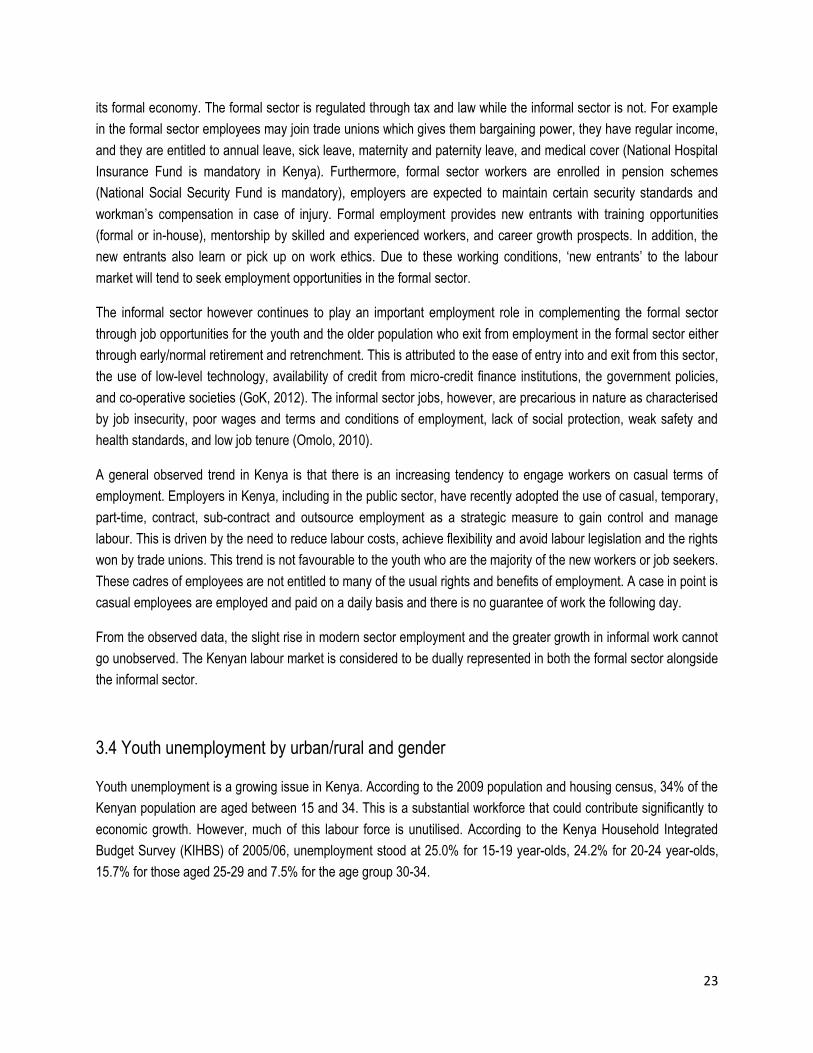
According to Table 9, the unemployment rate for the total 15-19 age group in the rural regions is observed to be
lower than in the urban areas. This can be explained by two factors. Firstly, besides informal sector work, agriculture
is the next leading sectors that absorb the highest number of people within the population. Most of the agricultural
industry is rural based and hence most youth residing in the rural region could find work in the agricultural sector.
Secondly, the rural-urban migration of youth, especially those rural residents seeking decent jobs in urban cities
contributes to the higher unemployment rates in the urban areas.
With regard to gender, the unemployment rates for females increased within both urban and rural regions for those
aged 15-19 years. Youth males (in both age groups of 15-19 and 20-24) saw a slight increase in rural unemployment
between 1998 and 2006. However, the male urban found a decrease in unemployment for ages 15-19 from 56.2% to
42.3% but then a slight increase for those aged 20-24 from 27.2% to 30.1%. There was also a marked increase in
the unemployment rates of the females in the rural areas, while a reduction in the 20-24 and 25-29 female cohort in
the urban areas. The decrease of unemployment for males and females in urban areas between 1998 and 2006 may
be due to the changes of education policy for the country (which draws young people into the education initiatives as
well as under the economically inactive category) with clear implementation in the urban areas.
25
Table 9: Youth unemployment rates by gender and region
1998/99 2005/06 1998/99 2005/06
Rural Urban
Age group/ gender Male Female Total Male Female Total Male Female Total Male Female Total
15-19 14.3 17.8 15.9 18.2 21.1 19.6 56.2 42.8 47.0 42.3 47.8 45.5
20-24 15.5 14.5 15.1 16.8 20.3 18.6 27.2 58.7 47.3 30.1 40.8 35.8
25-29 7.6 9.5 8.6 11.1 12.1 11.6 9.0 38.8 25.1 17.3 29.1 22.8
30-34 4.8 10.9 8.2 5.6 7.2 6.4 4.8 27.5 14.3 6.8 14.3 14.3 Source: GoK 2003; 2008
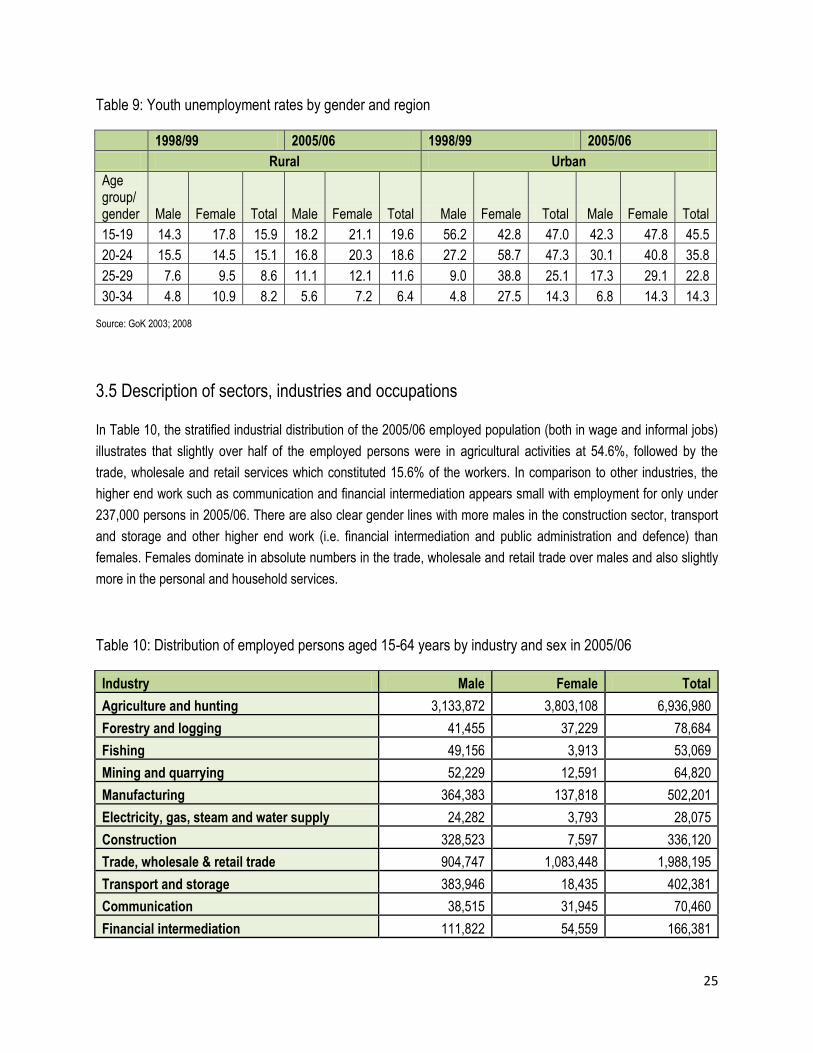
3.5 Description of sectors, industries and occupations
In Table 10, the stratified industrial distribution of the 2005/06 employed population (both in wage and informal jobs)
illustrates that slightly over half of the employed persons were in agricultural activities at 54.6%, followed by the
trade, wholesale and retail services which constituted 15.6% of the workers. In comparison to other industries, the
higher end work such as communication and financial intermediation appears small with employment for only under
237,000 persons in 2005/06. There are also clear gender lines with more males in the construction sector, transport
and storage and other higher end work (i.e. financial intermediation and public administration and defence) than
females. Females dominate in absolute numbers in the trade, wholesale and retail trade over males and also slightly
more in the personal and household services.
Table 10: Distribution of employed persons aged 15-64 years by industry and sex in 2005/06
Industry Male Female Total
Agriculture and hunting 3,133,872 3,803,108 6,936,980
Forestry and logging 41,455 37,229 78,684
Fishing 49,156 3,913 53,069
Mining and quarrying 52,229 12,591 64,820
Manufacturing 364,383 137,818 502,201
Electricity, gas, steam and water supply 24,282 3,793 28,075
Construction 328,523 7,597 336,120
Trade, wholesale & retail trade 904,747 1,083,448 1,988,195
Transport and storage 383,946 18,435 402,381
Communication 38,515 31,945 70,460
Financial intermediation 111,822 54,559 166,381

26
Public administration and defence 160,498 42,618 203,116
Education services 248,058 213,380 461,438
Research and scientific institutes 13,871 10,590 24,461
Health 39,105 62,848 101,953
Other community and social services 147,625 57,470 205,095
Personal and household services 398,077 456,405 854,482
International and other extra-territorial bodies 5,061 3,151 8,212
Activities not adequately defined 131,640 90,274 221,914
Total 6,576,865 6,131,170 12,708,035 Source: GoK 2008
The United Nations Development Programme (UNDP) indicates that of the 750,000 youth entering the job market
every year, barely 125,000 are employed in formal employment (UNDP, 2010). The bulk of job market entrants is
absorbed in the informal sector, 90 percent of which are below 25 years old and further that approximately 45 percent
of young people are employed in services and sales businesses. The fewest opportunities for youth are employment
opportunities within the industrial sector. The informal sector created approximately 445,900 new jobs and thereby
absorbed most job entrants (GoK, 2012), many of whom are below 25 years (UNDP, 2010). As a temporary
governmental measure, one public works programme, Kazi Kaw Vijana (translated as „Work for the youth‟) has been
put into place to provide young people with three to six month projects which earn them some income (IEA, 2010;
Omolo, 2010). This medium-term initiative also provides youth access to the Youth Enterprise Development Fund to
start up new small businesses. The fund was set up in 2006 and would also allow young people to work abroad
under the Ministry of Labour (Ministry of Labour, 2012). Finally during the recent Mashujaa Day celebrations, held on
20 October 2012, the President of Kenya urged financial institutions to grant financing to youth. Their creative ideas
would need the financial support of flexible and affordable credit facilities to spur their innovative ideas to businesses
which in turn will create jobs for others.4
According to the Ministry of Labour in the Labour Perspectives newsletter (Ministry of Labour, 2012), approximately
USD$60 million has been advanced to youth enterprises, over 200,000 youth were trained in entrepreneurship, 1,800
youth were assisted to market their products/services, and 6,000 youth were helped to obtain employment abroad
(Ministry of Labour, 2012).
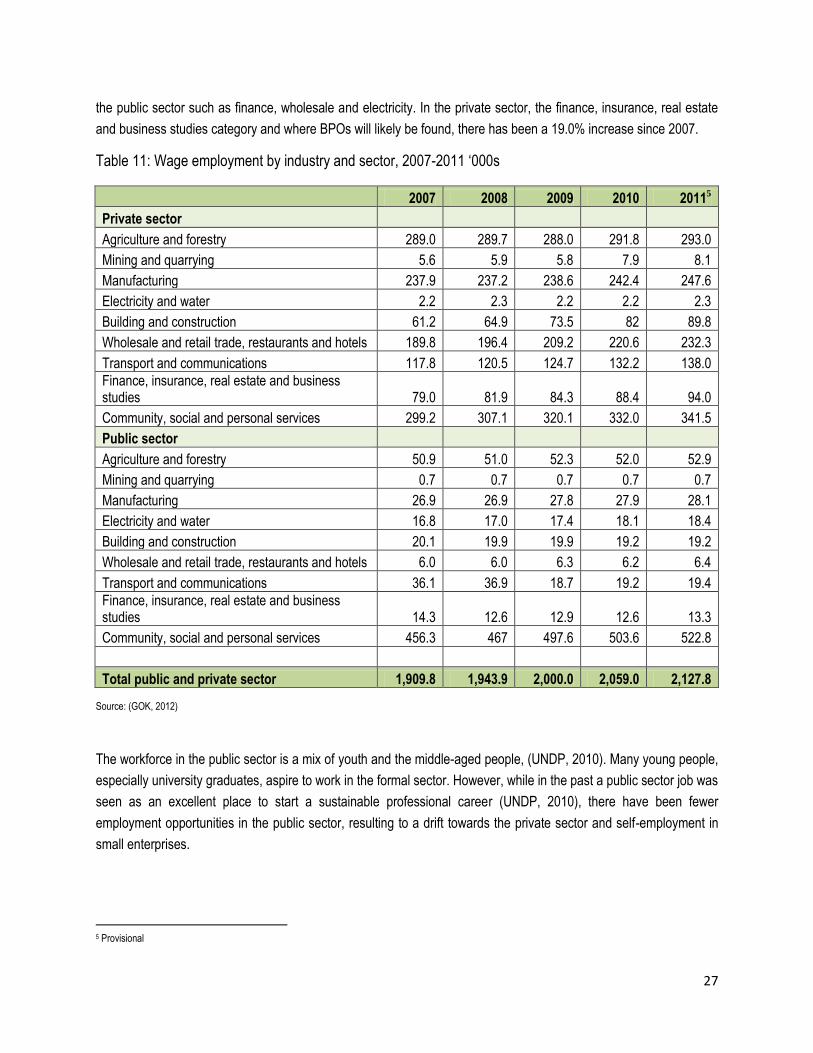
The modern sector created 74,200 new jobs in 2011, most of which were in the building and construction, energy,
tourism, transport and financial services sectors (Ministry of Labour, 2012). According to industry, Table 11 displays
the majority of wage employment is found in „community social and personal services‟ within the public sector. The
private sector also provides wage employment to over 341,000 people in the community services field. Manufacturing
and transport appears to follow closely in wage employment in 2011. Overall, there appears to be slight yet
continuous increases in wage employment numbers from 2007 to 2011 with exception to some smaller employers in
4 http://www.standardmedia.co.ke/?articleID=2000068860&story_title=Kibaki%E2%80%99s-Mashujaa-Day-Speech
27
the public sector such as finance, wholesale and electricity. In the private sector, the finance, insurance, real estate
and business studies category and where BPOs will likely be found, there has been a 19.0% increase since 2007.
Table 11: Wage employment by industry and sector, 2007-2011 „000s
2007 2008 2009 2010 20115
Private sector Agriculture and forestry 289.0 289.7 288.0 291.8 293.0
Mining and quarrying 5.6 5.9 5.8 7.9 8.1
Manufacturing 237.9 237.2 238.6 242.4 247.6
Electricity and water 2.2 2.3 2.2 2.2 2.3
Building and construction 61.2 64.9 73.5 82 89.8
Wholesale and retail trade, restaurants and hotels 189.8 196.4 209.2 220.6 232.3
Transport and communications 117.8 120.5 124.7 132.2 138.0
Finance, insurance, real estate and business studies 79.0 81.9 84.3 88.4 94.0
Community, social and personal services 299.2 307.1 320.1 332.0 341.5
Public sector Agriculture and forestry 50.9 51.0 52.3 52.0 52.9
Mining and quarrying 0.7 0.7 0.7 0.7 0.7
Manufacturing 26.9 26.9 27.8 27.9 28.1
Electricity and water 16.8 17.0 17.4 18.1 18.4
Building and construction 20.1 19.9 19.9 19.2 19.2
Wholesale and retail trade, restaurants and hotels 6.0 6.0 6.3 6.2 6.4
Transport and communications 36.1 36.9 18.7 19.2 19.4
Finance, insurance, real estate and business studies 14.3 12.6 12.9 12.6 13.3
Community, social and personal services 456.3 467 497.6 503.6 522.8
Total public and private sector 1,909.8 1,943.9 2,000.0 2,059.0 2,127.8 Source: (GOK, 2012)
The workforce in the public sector is a mix of youth and the middle-aged people, (UNDP, 2010). Many young people,
especially university graduates, aspire to work in the formal sector. However, while in the past a public sector job was
seen as an excellent place to start a sustainable professional career (UNDP, 2010), there have been fewer
employment opportunities in the public sector, resulting to a drift towards the private sector and self-employment in
small enterprises.
5 Provisional
28
3.6 Job security/working conditions of the youth (with employment)
Kenya does have specific laws to govern employment and working conditions that apply to all employees and not
necessary only the youth. Formal employment is governed by the general law of contract, as much as by the
principles of common law. Thus, employment is basically seen as an individual relationship negotiated by the
employee and the employer according to their special needs.
However, in an effort to create conducive environments for the employer and wage employee, a number of laws have
been passed specifically dealing with different aspects of the employer-employee relationship. These laws define the
terms and conditions of employment, and consist mainly of four Acts of Parliament:
Employment Act 2007
Labour Relations Act 2007
Labour Institutions Act 2007
Occupational Safety and Health Act 2007
Work Injury Benefit Act 2007
These Acts govern working conditions which include wages, leave and rest, health and safety, whilst promoting
fundamental rights of employees including matters of discrimination, forced labour and sexual harassment among
other matters that concern employment.
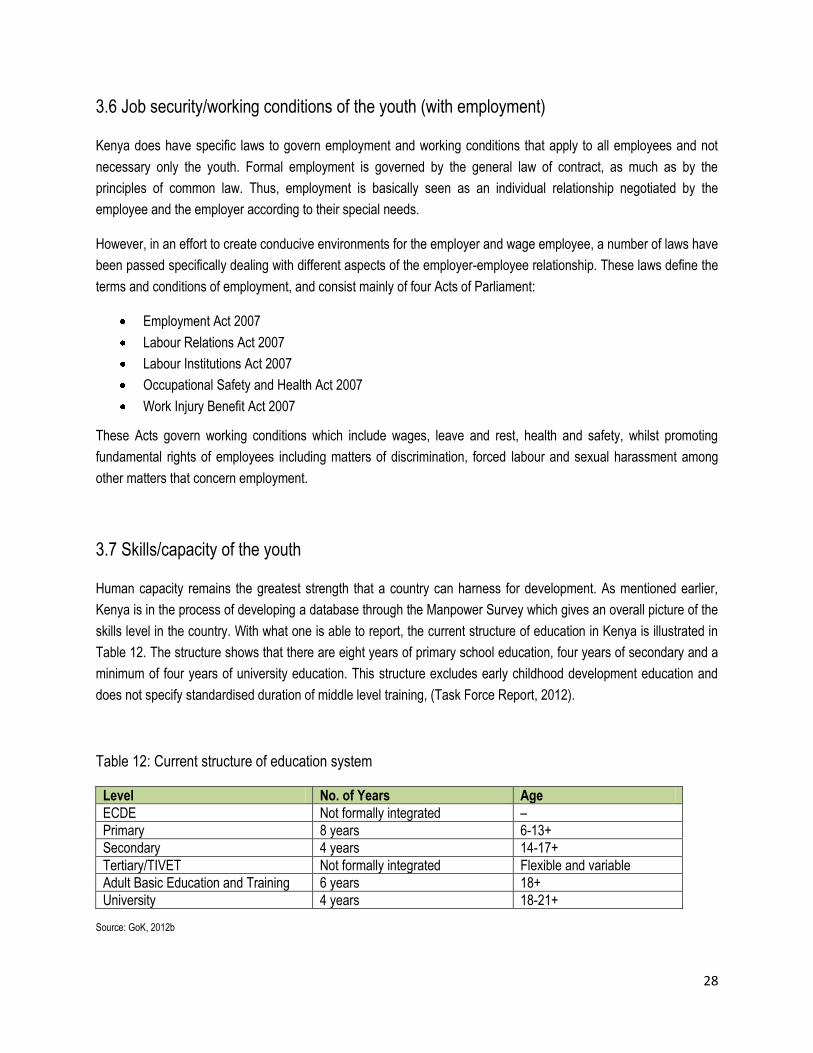
3.7 Skills/capacity of the youth
Human capacity remains the greatest strength that a country can harness for development. As mentioned earlier,
Kenya is in the process of developing a database through the Manpower Survey which gives an overall picture of the
skills level in the country. With what one is able to report, the current structure of education in Kenya is illustrated in
Table 12. The structure shows that there are eight years of primary school education, four years of secondary and a
minimum of four years of university education. This structure excludes early childhood development education and
does not specify standardised duration of middle level training, (Task Force Report, 2012).
Table 12: Current structure of education system
Level No. of Years Age
ECDE Not formally integrated –
Primary 8 years 6-13+
Secondary 4 years 14-17+
Tertiary/TIVET Not formally integrated Flexible and variable
Adult Basic Education and Training 6 years 18+
University 4 years 18-21+ Source: GoK, 2012b

29
The Government introduced the free primary education programme in 2003, in efforts to achieve the second
Millennium Development Goal (MDG) on Universal Primary Education (UPE). The increased enrolments at the
various levels of education are an indication of more youth engaged in educational activities and not available in the
labour force (otherwise categorised as the economically inactive). Between 1998 and 2006, the 48.3% increase in
primary school enrolment is one reflection of the UPE efforts. The increased school enrolment is further reflected in
the secondary schools with a 59.4% increase from 1998/99 to 2005/06 and one sees the enrolment ratios increase
accordingly for both genders. There have also been substantial enrolments at universities as seen in Table 13 and
Table 14.
Table 13: School enrolment by level and gender (1998/1999)
1998/1999
Male Female Total
Nursery Primary Population (6-13) Enrolment Ratio Secondary Population (14 - 17) Enrolment Ratio University Level not stated
406,757 381,194 787,951
3,276,566 3,029,410 6,305,976
3,671,582 3,403,607 7,075,135
89.2 89.0 89.1
517,474 429,937 947,411
1,561,397 1,523,344 3,084,741
33.1 28.2 30.7
27,552 19,413 46,965
26,219 48,181 74,400
Total 4,254,568 3,908,135 8,162,703
Source: GoK 2003
Table 14 shows more recent statistics on the continued increasing trend in the enrolments at primary school,
secondary school, and university levels, all of which are indications of greater access to education by the general
populace.
30
Table 14: Education enrolment „000
2005 2006 2007 2008 2009 2010 2011
Enrolment in primary school 7,591.5 7,632.1 8,253.8 8,563.8 8,831.4 9,380.2 9,857.9
Enrolment in secondary school 934.2 1,030.1 1,180.3 1,382.2 1,507.6 1,701.5 1,767.7
Enrolment in universities 92.3 112.2 118.3 121.8 159.2 174.4 198.3
Enrolment in other institutions 70.5 93.8 76.5 85.2 71.5 66.8 133.8
Source: KNBS (2012), Key Facts and Figures, various issues
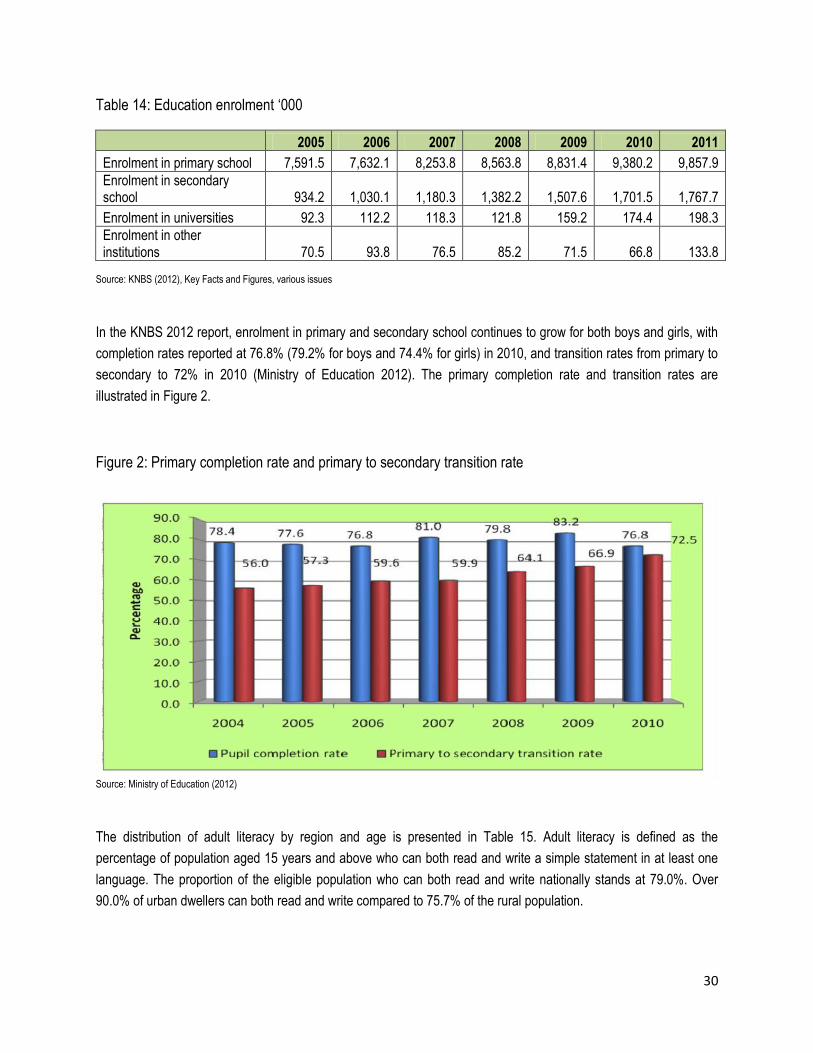
In the KNBS 2012 report, enrolment in primary and secondary school continues to grow for both boys and girls, with
completion rates reported at 76.8% (79.2% for boys and 74.4% for girls) in 2010, and transition rates from primary to
secondary to 72% in 2010 (Ministry of Education 2012). The primary completion rate and transition rates are
illustrated in Figure 2.
Figure 2: Primary completion rate and primary to secondary transition rate
Source: Ministry of Education (2012)
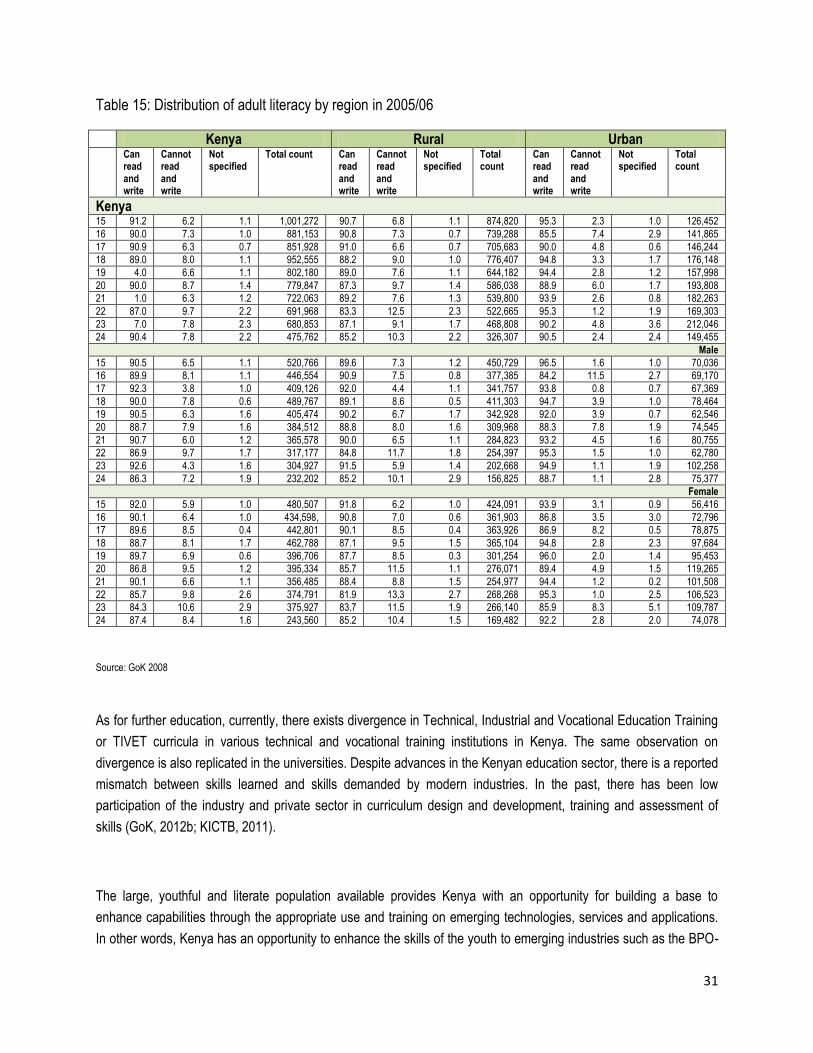
The distribution of adult literacy by region and age is presented in Table 15. Adult literacy is defined as the
percentage of population aged 15 years and above who can both read and write a simple statement in at least one
language. The proportion of the eligible population who can both read and write nationally stands at 79.0%. Over
90.0% of urban dwellers can both read and write compared to 75.7% of the rural population.
31
Table 15: Distribution of adult literacy by region in 2005/06
Kenya Rural Urban
Can read and write
Cannot read and write
Not specified
Total count Can read and write
Cannot read and write
Not specified
Total count
Can read and write
Cannot read and write
Not specified
Total count
Kenya 15 91.2 6.2 1.1 1,001,272 90.7 6.8 1.1 874,820 95.3 2.3 1.0 126,452
16 90.0 7.3 1.0 881,153 90.8 7.3 0.7 739,288 85.5 7.4 2.9 141,865
17 90.9 6.3 0.7 851,928 91.0 6.6 0.7 705,683 90.0 4.8 0.6 146,244
18 89.0 8.0 1.1 952,555 88.2 9.0 1.0 776,407 94.8 3.3 1.7 176,148
19 4.0 6.6 1.1 802,180 89.0 7.6 1.1 644,182 94.4 2.8 1.2 157,998
20 90.0 8.7 1.4 779,847 87.3 9.7 1.4 586,038 88.9 6.0 1.7 193,808
21 1.0 6.3 1.2 722,063 89.2 7.6 1.3 539,800 93.9 2.6 0.8 182,263
22 87.0 9.7 2.2 691,968 83.3 12.5 2.3 522,665 95.3 1.2 1.9 169,303
23 7.0 7.8 2.3 680,853 87.1 9.1 1.7 468,808 90.2 4.8 3.6 212,046
24 90.4 7.8 2.2 475,762 85.2 10.3 2.2 326,307 90.5 2.4 2.4 149,455
Male
15 90.5 6.5 1.1 520,766 89.6 7.3 1.2 450,729 96.5 1.6 1.0 70,036
16 89.9 8.1 1.1 446,554 90.9 7.5 0.8 377,385 84.2 11.5 2.7 69,170
17 92.3 3.8 1.0 409,126 92.0 4.4 1.1 341,757 93.8 0.8 0.7 67,369
18 90.0 7.8 0.6 489,767 89.1 8.6 0.5 411,303 94.7 3.9 1.0 78,464
19 90.5 6.3 1.6 405,474 90.2 6.7 1.7 342,928 92.0 3.9 0.7 62,546
20 88.7 7.9 1.6 384,512 88.8 8.0 1.6 309,968 88.3 7.8 1.9 74,545
21 90.7 6.0 1.2 365,578 90.0 6.5 1.1 284,823 93.2 4.5 1.6 80,755
22 86.9 9.7 1.7 317,177 84.8 11.7 1.8 254,397 95.3 1.5 1.0 62,780
23 92.6 4.3 1.6 304,927 91.5 5.9 1.4 202,668 94.9 1.1 1.9 102,258
24 86.3 7.2 1.9 232,202 85.2 10.1 2.9 156,825 88.7 1.1 2.8 75,377
Female
15 92.0 5.9 1.0 480,507 91.8 6.2 1.0 424,091 93.9 3.1 0.9 56,416
16 90.1 6.4 1.0 434,598, 90.8 7.0 0.6 361,903 86.8 3.5 3.0 72,796
17 89.6 8.5 0.4 442,801 90.1 8.5 0.4 363,926 86.9 8.2 0.5 78,875
18 88.7 8.1 1.7 462,788 87.1 9.5 1.5 365,104 94.8 2.8 2.3 97,684
19 89.7 6.9 0.6 396,706 87.7 8.5 0.3 301,254 96.0 2.0 1.4 95,453
20 86.8 9.5 1.2 395,334 85.7 11.5 1.1 276,071 89.4 4.9 1.5 119,265
21 90.1 6.6 1.1 356,485 88.4 8.8 1.5 254,977 94.4 1.2 0.2 101,508
22 85.7 9.8 2.6 374,791 81.9 13.3 2.7 268,268 95.3 1.0 2.5 106,523
23 84.3 10.6 2.9 375,927 83.7 11.5 1.9 266,140 85.9 8.3 5.1 109,787
24 87.4 8.4 1.6 243,560 85.2 10.4 1.5 169,482 92.2 2.8 2.0 74,078
Source: GoK 2008
As for further education, currently, there exists divergence in Technical, Industrial and Vocational Education Training
or TIVET curricula in various technical and vocational training institutions in Kenya. The same observation on
divergence is also replicated in the universities. Despite advances in the Kenyan education sector, there is a reported
mismatch between skills learned and skills demanded by modern industries. In the past, there has been low
participation of the industry and private sector in curriculum design and development, training and assessment of
skills (GoK, 2012b; KICTB, 2011).
The large, youthful and literate population available provides Kenya with an opportunity for building a base to
enhance capabilities through the appropriate use and training on emerging technologies, services and applications.
In other words, Kenya has an opportunity to enhance the skills of the youth to emerging industries such as the BPO-

32
ITES. Yet due to a mismatch between the skills of the unemployed and the skill requirements of potential employers,
a significant proportion of trained youths tend to remain unemployed for long periods. The mismatch is particularly
marked for school leavers and fresh graduates, providing a partial explanation for the high unemployment rate
among younger people and new entrants into the job market (UNDP, 2010). Such employment inventories will need
further work and collaboration in order to ensure the skills of unemployed youth can match the necessary skills of the
future.
33
4. The BPO-ITES sector and its contribution to economic growth, job
creation and poverty reduction
Kenya, in an effort to become an emerging economy, is in the course of implementing projects envisioned in its
development plan titled, Vision 2030. One of the key outcomes of the Vision 2030 is enhancing equity and wealth
creation opportunities for the poor. As stated in the Vision 2030, no social cohesion can be gained if significant
sections of the Kenyan society live in abject poverty. In the Vision 2030 plan, attention to investments is focused
more in the problem areas, which are in the arid and semi-arid districts, communities with high incidence of poverty,
unemployed youth, women and all vulnerable groups. Accordingly, one of the emerging sectors seen as an avenue
for creating wealth and employment is the emerging ICT sector, and specifically the Business Process Outsourcing –
Information Technology Enabled Services or BPO-ITES sector (Kenya Vision 2030, 2007). Private companies that
were keen to be players in the BPO-ITES sector in the early 2000s cited the following as the key hindrances to the
growth in the industry: high cost of communication, high cost of training skilled labourers as the industry lacked
skilled labour for the sector, lack of tax incentives, etc. The government of Kenya (GoK) has been keen to intervene
and accommodate the concerns of the BPO-ITES industry players. The strategic pursuits of using ICT as an enabler
to achieving Vision 2030, and the enhancements/implementation of appropriate policies to enable growth in the BPO-
ITES sector was identified as one avenue to contribute to the economic growth rate of 10% per annum, as reflected
in Vision 2030.
Kenya‟s BPO strategy as captured in the Kenya Vision 2030 (2007) centred on infrastructural and human capacity
development, incentive packages to attract BPO investments, and marketing Kenya as a viable BPO destination. A
flagship project, to build the state-of-art BPO Park and four key initiatives (marketing, training, infrastructure
development and incentives) were earmarked as channels through which this strategy would be operationalised. The
park envisaged would be a state-of-the-art facility which would consolidate the key enabling factors critical for a
competitive BPO industry, including superior telecommunications infrastructure, easy access to international
transport facilities, and affordable and readily available electricity. The logic behind the establishment of this park is
that since it may take a considerable amount of time to provide these facilities across the entire country, there is a
need to start by establishing a state-of-the-art BPO facility where these requirements are guaranteed. The park will
be used as an accelerating institution for Kenya‟s BPO industry (Kenya Vision 2030, 2007).
However, building of the BPO Park, now referred to as the Konza Technology City, will take considerable time before
being operational. Hence the government had in 2010 offered to rent the Sameer Business Park, which is under the
Export Processing Zone, to incubate BPO start-ups.
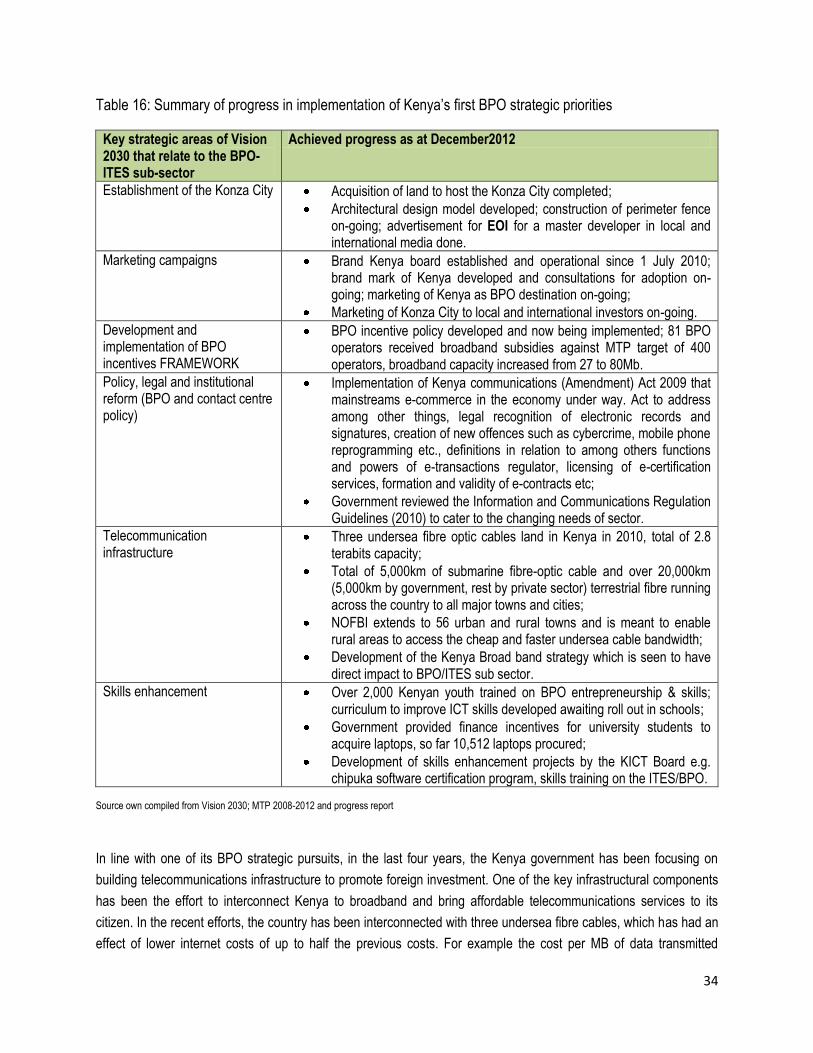
To date, some progress has been achieved in the implementation of these strategic parameters. The progress
includes: marketing initiatives involving the proactive and targeted promotion of Kenya‟s BPO sector with a
geographic focus; training initiatives involving targeted training programmes around primary business processes and
for specific industries; incentive packages, which involves putting together a comprehensive set of fiscal and
business incentives; telecom infrastructure programme which aims at achieving massive reduction in telecom costs
and improvement in quality levels; and the BPO Park project, the Konza City, which is a flagship project for the
sector. Table 16 further details the achievements on the BPO strategic priorities.
34
Table 16: Summary of progress in implementation of Kenya‟s first BPO strategic priorities
Key strategic areas of Vision 2030 that relate to the BPO-ITES sub-sector
Achieved progress as at December2012
Establishment of the Konza City Acquisition of land to host the Konza City completed;
Architectural design model developed; construction of perimeter fence on-going; advertisement for EOI for a master developer in local and international media done.
Marketing campaigns Brand Kenya board established and operational since 1 July 2010; brand mark of Kenya developed and consultations for adoption on-going; marketing of Kenya as BPO destination on-going;
Marketing of Konza City to local and international investors on-going.
Development and implementation of BPO incentives FRAMEWORK
BPO incentive policy developed and now being implemented; 81 BPO operators received broadband subsidies against MTP target of 400 operators, broadband capacity increased from 27 to 80Mb.
Policy, legal and institutional reform (BPO and contact centre policy)
Implementation of Kenya communications (Amendment) Act 2009 that mainstreams e-commerce in the economy under way. Act to address among other things, legal recognition of electronic records and signatures, creation of new offences such as cybercrime, mobile phone reprogramming etc., definitions in relation to among others functions and powers of e-transactions regulator, licensing of e-certification services, formation and validity of e-contracts etc;
Government reviewed the Information and Communications Regulation Guidelines (2010) to cater to the changing needs of sector.
Telecommunication infrastructure
Three undersea fibre optic cables land in Kenya in 2010, total of 2.8 terabits capacity;
Total of 5,000km of submarine fibre-optic cable and over 20,000km (5,000km by government, rest by private sector) terrestrial fibre running across the country to all major towns and cities;
NOFBI extends to 56 urban and rural towns and is meant to enable rural areas to access the cheap and faster undersea cable bandwidth;
Development of the Kenya Broad band strategy which is seen to have direct impact to BPO/ITES sub sector.
Skills enhancement Over 2,000 Kenyan youth trained on BPO entrepreneurship & skills; curriculum to improve ICT skills developed awaiting roll out in schools;
Government provided finance incentives for university students to acquire laptops, so far 10,512 laptops procured;
Development of skills enhancement projects by the KICT Board e.g. chipuka software certification program, skills training on the ITES/BPO.
Source own compiled from Vision 2030; MTP 2008-2012 and progress report
In line with one of its BPO strategic pursuits, in the last four years, the Kenya government has been focusing on
building telecommunications infrastructure to promote foreign investment. One of the key infrastructural components
has been the effort to interconnect Kenya to broadband and bring affordable telecommunications services to its
citizen. In the recent efforts, the country has been interconnected with three undersea fibre cables, which has had an
effect of lower internet costs of up to half the previous costs. For example the cost per MB of data transmitted
35
dropped significantly from about Sh6000 in 2007 to around Sh500 in 2010 attributed to connection to the fibre optic
cable in 2009. This led to an increased connection among operators as reported in a local daily in May 20116. The
fibre optic cable became operational in Kenya in the year 2009/10. The project had been in the pipeline since
2007/08.
Additionally, Kenya recently linked to the undersea global fibre optic submarine cable as of 2009, giving the country
an improved bandwidth capacity to move BPO strategies forward (IST Africa, 2012). Furthermore, the cable will
reach across the country and has shown an increase in effective data transmission between 2008/09 and 2009/10
(IST Africa, 2012).
While tremendous efforts have been made to improve the telecommunications infrastructure that has increased the
speeds and access to stable internet services, the majority of the rural areas and urban cities located away from the
northern corridor have not yet benefited, resulting to access gaps as illustrated in Figure 1. This is particularly
relevant to broadband data access, which would be a key driver for a growing ICT sector in these underserved areas.
In Kenya, the mobile operators are the leading providers of data/internet services (they account for 98% of total
internet subscriptions) (CCK, 2012). The observed access gap has been the result of low penetration of licensed
telecommunications operators to these areas, occasioned by other compounding factors such as access to
electricity, accessibility by roads and commercial viability by telecommunications operators. However the
government, through the recently published „National Broadband Strategy‟ has formulated strategies to encourage
the penetration of data and voice services to the rural areas.
6 www.the-star.co.ke/news/article.../bpo-sector-slow-job-creation-report
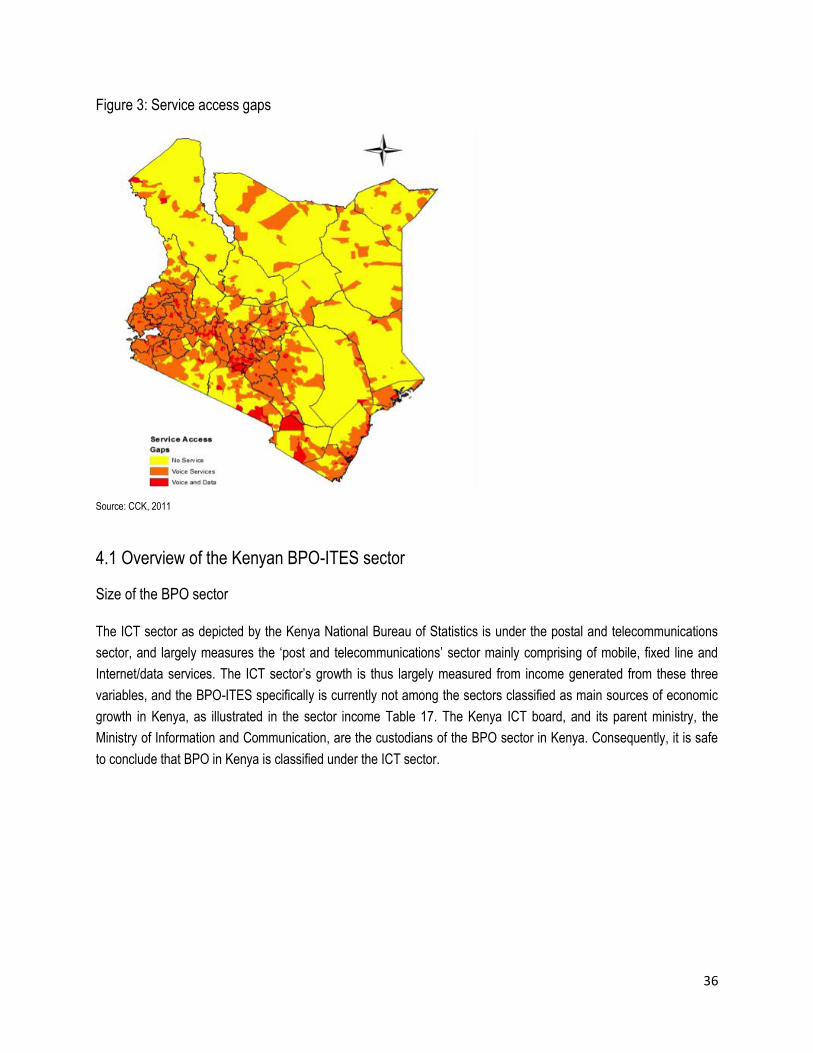
36
Figure 3: Service access gaps
Source: CCK, 2011
4.1 Overview of the Kenyan BPO-ITES sector
Size of the BPO sector
The ICT sector as depicted by the Kenya National Bureau of Statistics is under the postal and telecommunications
sector, and largely measures the „post and telecommunications‟ sector mainly comprising of mobile, fixed line and
Internet/data services. The ICT sector‟s growth is thus largely measured from income generated from these three
variables, and the BPO-ITES specifically is currently not among the sectors classified as main sources of economic
growth in Kenya, as illustrated in the sector income Table 17. The Kenya ICT board, and its parent ministry, the
Ministry of Information and Communication, are the custodians of the BPO sector in Kenya. Consequently, it is safe
to conclude that BPO in Kenya is classified under the ICT sector.
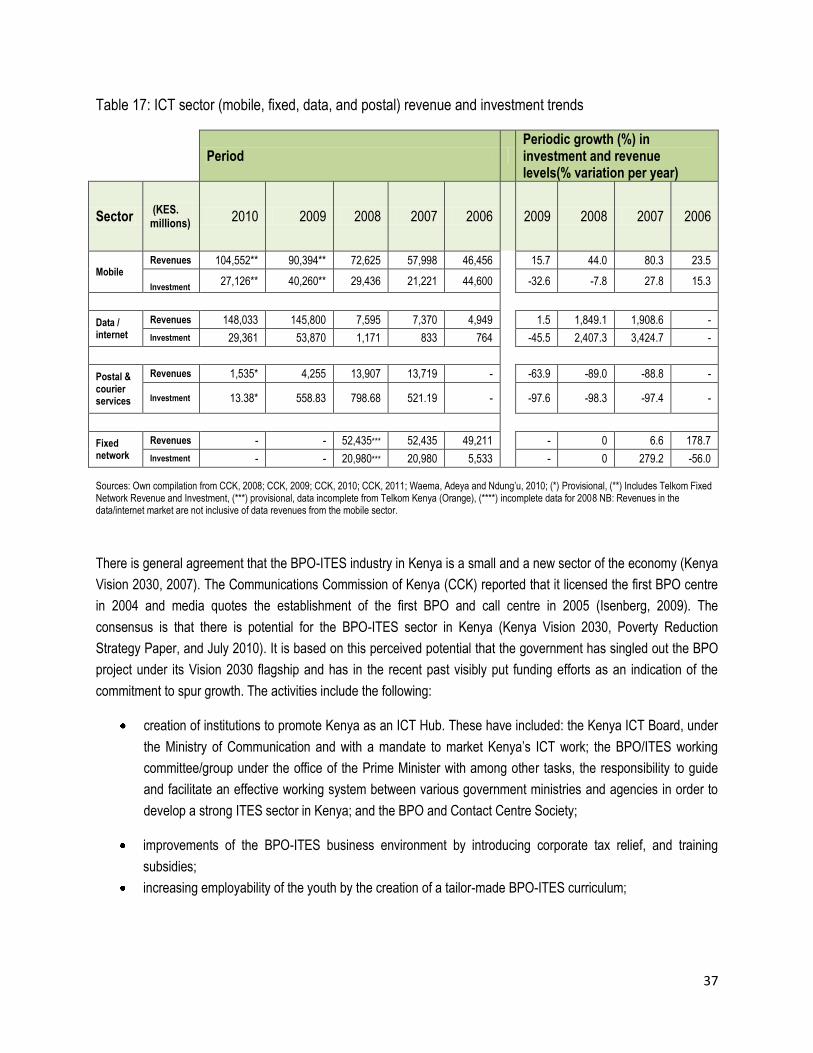
37
Table 17: ICT sector (mobile, fixed, data, and postal) revenue and investment trends
Period
Periodic growth (%) in investment and revenue levels(% variation per year)
Sector (KES. millions)
2010 2009 2008 2007 2006
2009 2008 2007 2006
Mobile Revenues 104,552** 90,394** 72,625 57,998 46,456
15.7 44.0 80.3 23.5
Investment
27,126** 40,260** 29,436 21,221 44,600
-32.6 -7.8 27.8 15.3
Data / internet
Revenues 148,033 145,800 7,595 7,370 4,949
1.5 1,849.1 1,908.6 -
Investment 29,361 53,870 1,171 833 764
-45.5 2,407.3 3,424.7 -
Postal & courier services
Revenues 1,535* 4,255 13,907 13,719 -
-63.9 -89.0 -88.8 -
Investment 13.38* 558.83 798.68 521.19 -
-97.6 -98.3 -97.4 -
Fixed network
Revenues - - 52,435*** 52,435 49,211
- 0 6.6 178.7
Investment - - 20,980*** 20,980 5,533 - 0 279.2 -56.0
Sources: Own compilation from CCK, 2008; CCK, 2009; CCK, 2010; CCK, 2011; Waema, Adeya and Ndung‟u, 2010; (*) Provisional, (**) Includes Telkom Fixed Network Revenue and Investment, (***) provisional, data incomplete from Telkom Kenya (Orange), (****) incomplete data for 2008 NB: Revenues in the data/internet market are not inclusive of data revenues from the mobile sector.
There is general agreement that the BPO-ITES industry in Kenya is a small and a new sector of the economy (Kenya
Vision 2030, 2007). The Communications Commission of Kenya (CCK) reported that it licensed the first BPO centre
in 2004 and media quotes the establishment of the first BPO and call centre in 2005 (Isenberg, 2009). The
consensus is that there is potential for the BPO-ITES sector in Kenya (Kenya Vision 2030, Poverty Reduction
Strategy Paper, and July 2010). It is based on this perceived potential that the government has singled out the BPO
project under its Vision 2030 flagship and has in the recent past visibly put funding efforts as an indication of the
commitment to spur growth. The activities include the following:
creation of institutions to promote Kenya as an ICT Hub. These have included: the Kenya ICT Board, under
the Ministry of Communication and with a mandate to market Kenya‟s ICT work; the BPO/ITES working
committee/group under the office of the Prime Minister with among other tasks, the responsibility to guide
and facilitate an effective working system between various government ministries and agencies in order to
develop a strong ITES sector in Kenya; and the BPO and Contact Centre Society;
improvements of the BPO-ITES business environment by introducing corporate tax relief, and training
subsidies;
increasing employability of the youth by the creation of a tailor-made BPO-ITES curriculum;
38
provision of tax incentives (are not available to all players in the cluster). Firms located in the special
economic zones are the ones that receive significant tax incentives, whereas firms not physically located
there do not receive such incentives;
acquisition of land for the development of a BPO business park, dubbed Konza City.
However it is important to note that to date, there are no concrete statistics provided publicly on the overall BPO
sector in Kenya.
Number of firms in the BPO industry
The first Business Process Outsourcing service provider was licensed by the CCK Commission in 2004 as a call
centre and since then the number has grown to 32 service providers as at the end of February 2012 (CCK Register,
February 2012). CCK has also licensed other firms under the Application Service Providers and Content Service
Providers. The actual number of BPOs however has been continuously changing with new and exiting entrants. This
has in part, been attributed to the slow pace at which Kenya seems to be establishing herself as a viable BPO
destination globally, necessitating a slight shift in strategic priorities.
From an initial focus on an aggressive go-to-market campaign after the launch of the fibre optic infrastructure, the
results after five years of attempting to establish Kenya as a globally competitive outsourcing destination have been
unimpressive. Recent comments by the permanent secretary (PS) in the Ministry of Information and Communication
appear to mean a shift in priorities, “first deal with internal efficiencies, which will lead to $5 billion in savings as well
as develop enormous human resource capacity.” The PS further noted that, “building such capacity will also enable
us to provide services to BPO areas we have always targeted” (Wanjiku, 2012).
The local BPO clientele base is also set to grow with the government as some local services are outsourced to local
firms through partnerships and overcoming delays of the legal framework (Wanjiku, 2012). These developments
indicate a shift in strategic focus from an external market focus to an internal focus, all aimed at improving growth in
the sector.
Job growth prospects
The growth experienced in Kenya‟s BPO industry includes the jump in contribution to total GDP from < 0.01% in
2008 to 6.00% in 2012. Cumulatively, 7,000 jobs were created by mid-2012 (Republic of Kenya, 2012). In Kenya‟s
Vision 2030, the overall goal for the sector leading up to 2012 was the creation of 7,500 direct jobs and an additional
GDP contribution of KShs.10 billion (approximately USD$133 million). Table 18 summarises the sector‟s growth
prospects based on the five-year implementation starting in 2007, highlighting infrastructure development, the
incentives framework and the go-to-market marketing campaigns that were the main focus of Kenya‟s BPO strategy
during this period leading to 2012.
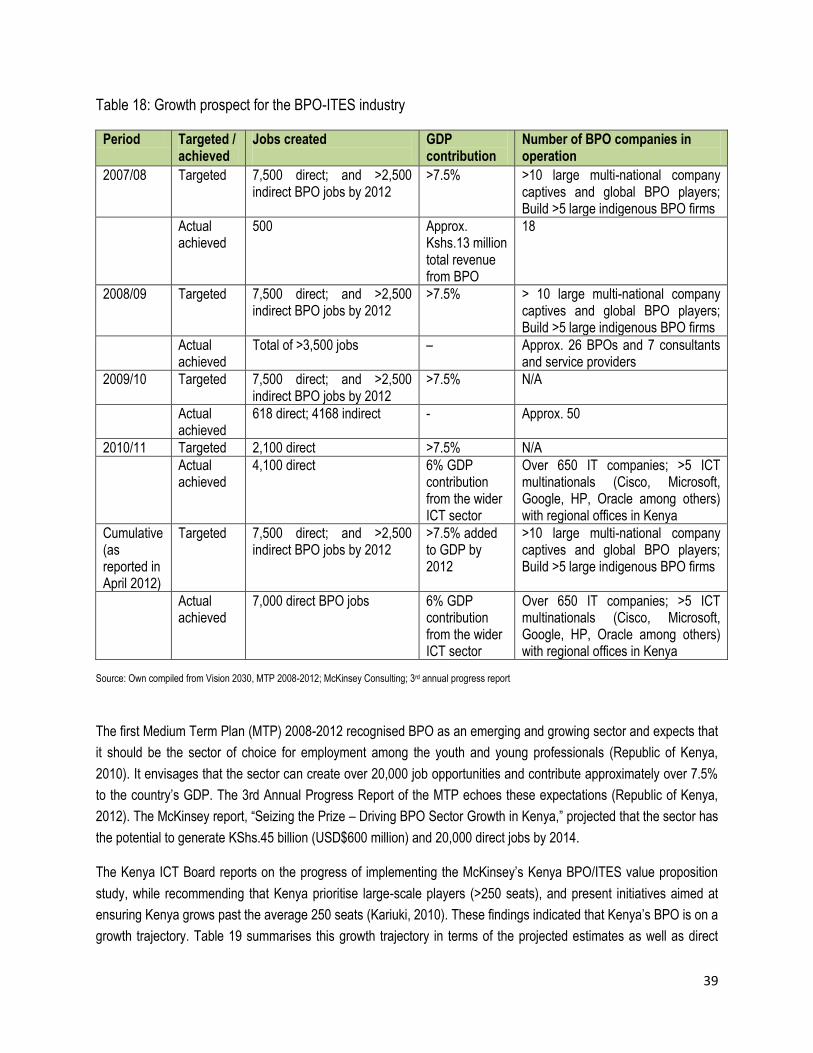
39
Table 18: Growth prospect for the BPO-ITES industry
Period Targeted / achieved
Jobs created
GDP contribution
Number of BPO companies in operation
2007/08 Targeted 7,500 direct; and >2,500 indirect BPO jobs by 2012
>7.5% >10 large multi-national company captives and global BPO players; Build >5 large indigenous BPO firms
Actual achieved
500 Approx. Kshs.13 million total revenue from BPO
18
2008/09 Targeted 7,500 direct; and >2,500 indirect BPO jobs by 2012
>7.5% > 10 large multi-national company captives and global BPO players; Build >5 large indigenous BPO firms
Actual achieved
Total of >3,500 jobs – Approx. 26 BPOs and 7 consultants and service providers
2009/10 Targeted 7,500 direct; and >2,500 indirect BPO jobs by 2012
>7.5% N/A
Actual achieved
618 direct; 4168 indirect - Approx. 50
2010/11 Targeted 2,100 direct >7.5% N/A
Actual achieved
4,100 direct 6% GDP contribution from the wider ICT sector
Over 650 IT companies; >5 ICT multinationals (Cisco, Microsoft, Google, HP, Oracle among others) with regional offices in Kenya
Cumulative (as reported in April 2012)
Targeted 7,500 direct; and >2,500 indirect BPO jobs by 2012
>7.5% added to GDP by 2012
>10 large multi-national company captives and global BPO players; Build >5 large indigenous BPO firms
Actual achieved
7,000 direct BPO jobs 6% GDP contribution from the wider ICT sector
Over 650 IT companies; >5 ICT multinationals (Cisco, Microsoft, Google, HP, Oracle among others) with regional offices in Kenya
Source: Own compiled from Vision 2030, MTP 2008-2012; McKinsey Consulting; 3rd annual progress report
The first Medium Term Plan (MTP) 2008-2012 recognised BPO as an emerging and growing sector and expects that
it should be the sector of choice for employment among the youth and young professionals (Republic of Kenya,
2010). It envisages that the sector can create over 20,000 job opportunities and contribute approximately over 7.5%
to the country‟s GDP. The 3rd Annual Progress Report of the MTP echoes these expectations (Republic of Kenya,
2012). The McKinsey report, “Seizing the Prize – Driving BPO Sector Growth in Kenya,” projected that the sector has
the potential to generate KShs.45 billion (USD$600 million) and 20,000 direct jobs by 2014.
The Kenya ICT Board reports on the progress of implementing the McKinsey‟s Kenya BPO/ITES value proposition
study, while recommending that Kenya prioritise large-scale players (>250 seats), and present initiatives aimed at
ensuring Kenya grows past the average 250 seats (Kariuki, 2010). These findings indicated that Kenya‟s BPO is on a
growth trajectory. Table 19 summarises this growth trajectory in terms of the projected estimates as well as direct

40
BPO jobs created by the sector since its inception in the year 2007. On average, it is estimated that 775* jobs were
created annually during the 2007-2010 period, against annual projections of 1,300* jobs, while in the year 2011, jobs
created rose exponentially to 4,100 against a projection of 2,200. These figures demonstrate the potential Kenya‟s
BPO sector has in employment creation.
Following a recent investor conference, the Ministry of Information and Communication hopes to launch its new
Konza Technology City plans which have ambitious projections of 200,000 jobs in the next 20 years. In the 5,000
acre land (2,000 hectares), Konza City7 hopes to derive some 15,000 ITES/electronic manufacturing direct jobs in its
Phase 1. Once the first phases come to fruition, the aim is to create ready-to-run BPO/ITES facilities.
Table 19: Summary of the job growth prospects of the BPO sector in Kenya
BPO jobs
Period
2007 2008 2009 2010 2011 Cumulative 2012
Direct
Targeted 1,000 1,300* 1,300* 1,300* 2,200 7,500; 8,400***
Actual achieved
1,000 775* 775* 619 4,100 7,000**; 8,044***
(*) Estimate for missing data calculated using the interpolation formula; (**) cumulative direct actual achieved jobs as at April 2012 as reported in the 3rd annual MTP; (***) cumulative direct jobs as would be reported at end of 2012 if the calculated values (*) were used.
7 http://www.konzacity.co.ke
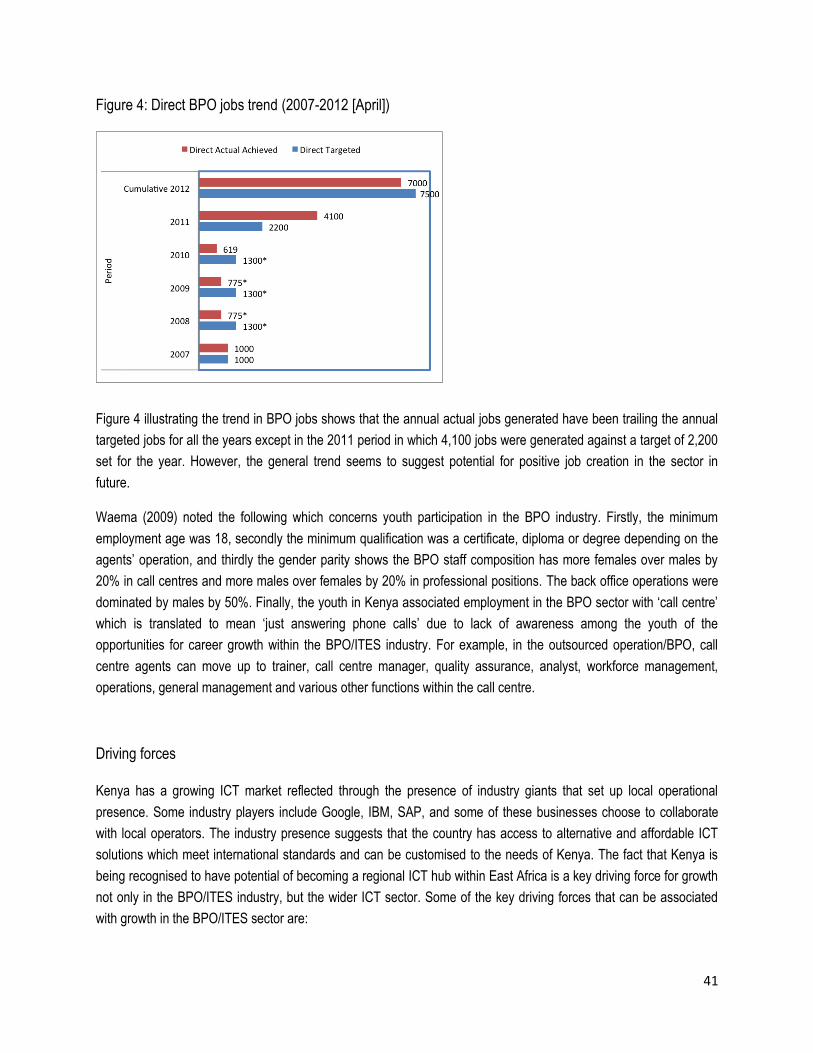
41
Figure 4: Direct BPO jobs trend (2007-2012 [April])
Figure 4 illustrating the trend in BPO jobs shows that the annual actual jobs generated have been trailing the annual
targeted jobs for all the years except in the 2011 period in which 4,100 jobs were generated against a target of 2,200
set for the year. However, the general trend seems to suggest potential for positive job creation in the sector in
future.
Waema (2009) noted the following which concerns youth participation in the BPO industry. Firstly, the minimum
employment age was 18, secondly the minimum qualification was a certificate, diploma or degree depending on the
agents‟ operation, and thirdly the gender parity shows the BPO staff composition has more females over males by
20% in call centres and more males over females by 20% in professional positions. The back office operations were
dominated by males by 50%. Finally, the youth in Kenya associated employment in the BPO sector with „call centre‟
which is translated to mean „just answering phone calls‟ due to lack of awareness among the youth of the
opportunities for career growth within the BPO/ITES industry. For example, in the outsourced operation/BPO, call
centre agents can move up to trainer, call centre manager, quality assurance, analyst, workforce management,
operations, general management and various other functions within the call centre.
Driving forces
Kenya has a growing ICT market reflected through the presence of industry giants that set up local operational
presence. Some industry players include Google, IBM, SAP, and some of these businesses choose to collaborate
with local operators. The industry presence suggests that the country has access to alternative and affordable ICT
solutions which meet international standards and can be customised to the needs of Kenya. The fact that Kenya is
being recognised to have potential of becoming a regional ICT hub within East Africa is a key driving force for growth
not only in the BPO/ITES industry, but the wider ICT sector. Some of the key driving forces that can be associated
with growth in the BPO/ITES sector are:
42
Commitment by government – placing BPO as a key flagship project in the Vision 2030 is an indication that
Kenya recognises that ICT is a key enabler in the economy;
Quality service – This is particularly important given that the English accent for Kenyans is quite neutral for
voice related services such as customer care, telemarketing, e.g. KenCall was voted the top Non-European
Call Centre in the World in September 2008. The award is based on high performance in training, quality,
security, technology, employee satisfaction and client satisfaction;
Strong presence of communication infrastructure – With a relatively stable fibre optic infrastructure, internal
transport (road and air) provides an attractive location;
Large pool of graduates – This provides for a group of youth who can be trained for knowledge process
outsourcing. Annually Kenya produces approximately 300,000 high school graduates each year; many of
whom are not absorbed into universities. Of this number, more than 20,000 join polytechnics and tertiary
institutions, secretarial and computer colleges, as well as teacher training institutions. At university level
approximately 20,000 graduates join the job market annually;
Strong capabilities in the English language especially given that English is used as the official
communication language used to teach in schools and one of the official communication language of the
nation in addition to Kiswahili;
Comparatively low labour costs; and
Ease of doing business in Kenya.
4.2 Types of BPO services offered and services description
According to the BPO-ITES Skills Gap Report for Kenya (2010), there is no specific niche that Kenya has adopted,
but the various BPO-ITES firms are contracted on a variety of jobs outsourced both locally and internationally. The
types of contracts in which BPO-ITES firms have engaged range from simple telemarketing to the back-office tasks
such as accounting, requiring graduate professionals. The report thus identified five categories of BPO services as:
information technology outsourcing such as software solution design and development, data entry,
document management;
knowledge process outsourcing, such as internet marketing, management consulting;
medical process outsourcing, mostly transcription;
human resource outsourcing, e.g. training, and recruitment; and
legal process outsourcing and transcription.
A review of the top eight BPO-ITES firms in Kenya as illustrated in Table 20 revealed the following as common
services in the firms:
contact centre is a common service, and includes, both inbound and outbound services (customer
service/lead generation/market surveys/telesales/telemarketing/appointment booking);
back office processes (data entry/data captioning/data conversion);
transcription (medical/financial);

43
animation;
software and web development; and
accounting processes and HR processes.
Table 20: A sample of some competitive BPO firms in Kenya
Name of BPO Location Capacity (no. of employees / seats
Areas of service
KenCall Nbi (Sameer Industrial Park, Msa Rd)
300 seats, 650-700 agents in 3 shifts
Level 1 tech support; sales; customer information; billing; admin & data management
Horizon Contact Centre (HCC)
Nbi (Gateway Park, Msa Rd)
Over 300 (Scalable to house over 1,200 agents)
Contact centre; collections; training & content solutions; finance & accounting; HR solutions; analytics & data management; procurement; IT services; re-engineering; quality assurance; workforce management
Technobrain
Nbi (Red Commercial Complex, Msa Rd)
130 permanent employees
Customer care; finance & accounting; HR; knowledge services; order management; web services
Craft Silicon Nbi (Craft Silicon Ltd. Waiyaki Way)
250
Global software company, providing solutions to banking, financial and insurance industries across 4 continents in different languages. >200 customers
Digital Divide Data, Kenya (DDD)
Nbi (7th Fl. Paramount Plaza, Off Globe Cinema Roundabout)
Approx. 125 employees, (3 shifts with 20 workers per shift); plans to train & employ >=300 slum youth in 2 years
Digital marketing; data entry; digital publishing & eBooks; digital libraries; and records management
Daproim Nbi (Hughes Building, Muindi Mbingu st.)
123 employees; 232 part-time employed university students
Data entry, desktop publishing, web design, creative design, software dev. Eng. services and a variety of transcription services (medical, legal, webcast, video, audio, academic, business, foreign language etc.)
Source: Various company websites
44
4.3 Emerging domestic customer contact market and other local BPO clientele
There is also an emerging local market that industry players are now embracing which has been driven by the growth
in the telecommunication sector, especially the mobile sector. Local industries are now creating call centres with
capacities larger than the average BPO-ITES player. For example, Safaricom has developed a customer contact
centre with a seating capacity of 1,200 seats. The trend of use of technology includes the integration of DIY (do-it-
yourself) platforms. An example of DIY technology is the M-Pesa mobile money platform where the user is provided
with guidelines by the mobile operator on how to operate their account or the step-by-step query solutions services,
rather than querying a human customer care agent. In other words, a machine-generated voice service guides you in
solving your mobile problem. This technology is an example of alternative ways of dealing with customer service
experiences and reducing the waiting time of a customer to talk to a human call centre agent. These services, that
are technologically supported, result in emerging customer call centres, operating like BPO call centres whilst
focusing on local clientele from the technology side. This has been observed in the telecom sector (Safaricom),
banking sector (Barclays Card services, Kenya Commercial Bank), and airline services (Kenya Airways).
Other than local contact centre clientele, the government is also set to join as a source of local BPO demand. The
government appears to be shifting its strategy from marketing to attract external clients to findings ways to create
government services outsourcing some of its services to local firms (Wanjiku, 2012). Many projects are planned by
39 government ministries to enhance its information technology infrastructure and applications for data and planning
management. The e-government will be an integral part of government services outsourced to local firms to create
employment. According to IST Africa (2012), the achievement of e-government in Kenya has been one of the main
priorities towards the realisation of national development goals and objectives for wealth and employment creation,
as stipulated in the Kenya Vision 2030. Other universal services initiatives such as the Pasha centres or digital
villages (described later) could also potentially facilitate online delivery of government services and capturing of
statistical data right from the constituency level (IST Africa, 2012).
4.4 Wages, working conditions and other contractual relations with BPO employers
The Kenya BPO/ITES investor fact sheet (Kariuki, 2011) pegged basic monthly salaries as at November 2011 to be
between USD $300 – $500 inclusive of incentives for voice profile agents and USD $500 – $1,000 inclusive of
performance based pay for team leaders. A regular working week is 40 hours, calculated as eight working hours for
five working days. Payment for extended work hours is at 1.5 times the pay for regular timing, and the pay rate for
work on national holidays is 2 times the pay for regular timing.
Additional wage-related information includes: mandatory health insurance contribution, the National Hospital
Insurance Fund (NHIF) of USD $3.20 per employee per month, payable one-half by employee and the other half by
employer. The mandatory social security contribution, the National Social Security Fund (NSSF) of USD $4.00 per
employee per month again means employees contribute half the amount and the employer contributes the reminder.
In addition, Kenyan law permits a maximum pension fund contribution of 5% of basic salary, though additional in-
45
house pension policies do exist in different firms. Salary increases are tied to inflation and on average range between
8-15%. The government announces minimum wage reviews during the annual Labour Day celebrations, on 1 May.
At KenCall, the base salaries for agents as at 2009 were about USD$200 per month with a possible addition of USD$
150 – $200 as performance based compensation (Isenberg, 2009). Agents in captive contact centres were reported
to receive about 50-100% higher wages. Nevertheless, KenCall‟s remuneration package was considered competitive.
In addition to the salary package, KenCall incurred additional costs of transport and benefits to the tune of 10% per
agent. Other than salaries, additional contractual agreements between employers and employees in the BPO/ITES
sector in Kenya include: leave, insurance, performance monitoring, academic requirements, good conduct, terms of
employment (casual/permanent), termination procedures, work hours and overtime. By law, all formal employment
must be by written contract.
Regarding leave agreements, the law as practiced by employers provides 21 working days of annual leave, seven
days sick leave (with an additional seven days at 50% salary), 90 days of maternity leave, 14 days of paternity leave,
five days of compassionate leave (for funerals, etc.) and 11 days of public holidays per year. Carry forward of leave
days is not mandated, though some in the industry allow for this practice. Others discourage it by requiring
employees to forfeit their leave days if they fail to take them within the year they are due.
With regard to insurance, the standard practice is to provide group insurance, medical insurance and workman‟s
compensation cover to employees. Medical insurance premiums costs approximately USD $11 per person per
month, which provides outpatient cover of up to USD $400 and inpatient cover of up to USD $30,000.
The law provides that casual employment be allowed for six months at a stretch or a maximum of 12 months in a
period of 18 months, after which the terms must be converted to full-time employment/full-time equivalent (FTE)
status. In cases where the period is exceeded, the employee is deemed permanent automatically. Any employment
of more than three months has to be covered by a written contract and is deemed as a contract in which the wage is
paid monthly. This also impacts on the notice period for termination.
Notice period for employment termination is on a per contract basis. In cases where it is not mentioned, it is usually
assumed to be 28 days, and the notice has to be given in writing. In cases of redundancy, 15 days wages per year
worked plus notice period has to be paid by the employer.
There can be no discrimination for employment on the basis of a health condition, unless it inhibits the employee
from discharging their basic duties.
Work hours include: nine hour shift, 60 minutes lunch break paid, two 15 minutes tea breaks and 15 minutes for
huddle. Overtime is gauged weekly and starts after clocking 48 hours per six day week. As stated earlier, payment
for overtime is pegged at 1.5 times the basic salary of the applicable day of work. Overtime hours do not include
break times.
Finally, for one to be hired, academic qualifications and two references are required. An optional Criminal
Investigations Department (CID) certificate of good conduct is also recommended before hiring.

46
4.5 Skills requirements/qualifications for the sector
A key factor that service providers and buyers consider for a BPO/ITES location is the scalability and employability of
the labour pool. With the infrastructural developments in Kenya, KICTB believes that the lack of industry-specific
skills is now the most important binding constraint to the growth of the offshore outsourcing industry in Kenya
especially in the BPO sector, (KICTB, 2010). The KICTB has conducted a skills gap analysis for the BPO/ITES sector
in order to understand the necessary talent needed to meet needs of the BPO industry. BPO-ITES Skills Gap Report
for Kenya (2010) summarised the BPO-ITES skills requirement as the following:
Computer skills: keyboard/typing skills, browsing skills, and middle level IT skills of hardware & software;
Knowledge: of specialisation in the specific industry such as medical, law, finance;
Communication skills: (voice, accent and language neutralisation): grammar, intonation and pitch,
business English, accent;
Cultural sensitisation: (with emphasis on target markets): history and geography of the target market,
lifestyle and aspirations, sports, cultural nuances;
Customer interaction: listening and rapport development, customer etiquette;
Data skills: numerical ability, logical reasoning, data interpretation, accuracy and diligence; and
Business ethics and organisational culture: understanding of clients‟ values, moral and work ethics.
Further analysis of the required industry skills against the available skills set revealed that the following were the key
BPO-ITES skills requirement for the industry.
Table 21: Kenya BPO-ITES skills requirement
Skills area Description
Communication English fluency Business communication skills Basic writing skills Listening and questioning skills Email communication Interpersonal communication
Personality development skills Aptitude Reliability, dependability and integrity Self-sufficient, self-motivated, resourcefulness
Typing and transcription skills Speed and accuracy
Technology skills and knowledge Computer and application savvy Internet browsing and search engine skills
Customer service skills Handling difficult customers and situations Identifying customer needs Multitasking – strategies for applying techniques in various scenarios
Principles of telemarketing Effective sales skills
Team dynamics Developing positive team environment
Leadership skills Decision making skills Problem solving and conflict resolution
Project management skills Source: BPO/KPO Skills Gap Assessment Report, May 2010
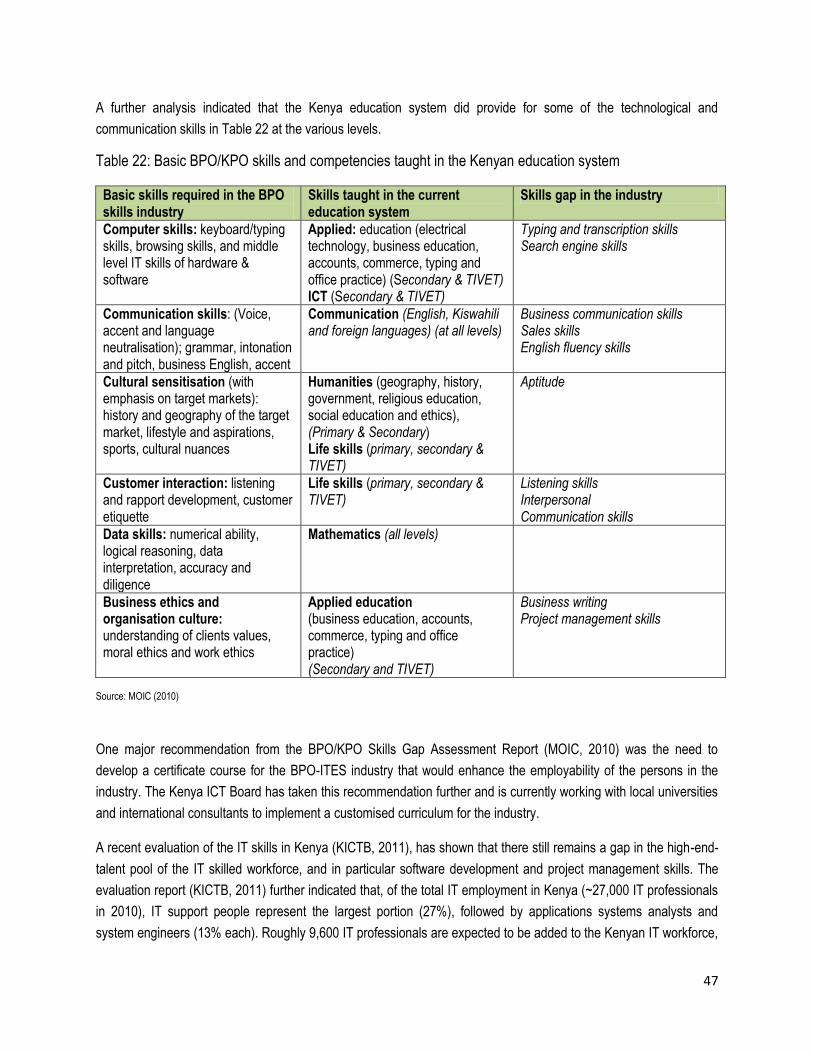
47
A further analysis indicated that the Kenya education system did provide for some of the technological and
communication skills in Table 22 at the various levels.
Table 22: Basic BPO/KPO skills and competencies taught in the Kenyan education system
Basic skills required in the BPO skills industry
Skills taught in the current education system
Skills gap in the industry
Computer skills: keyboard/typing skills, browsing skills, and middle level IT skills of hardware & software
Applied: education (electrical technology, business education, accounts, commerce, typing and office practice) (Secondary & TIVET) ICT (Secondary & TIVET)
Typing and transcription skills Search engine skills
Communication skills: (Voice, accent and language neutralisation); grammar, intonation and pitch, business English, accent
Communication (English, Kiswahili and foreign languages) (at all levels)
Business communication skills Sales skills English fluency skills
Cultural sensitisation (with emphasis on target markets): history and geography of the target market, lifestyle and aspirations, sports, cultural nuances
Humanities (geography, history, government, religious education, social education and ethics), (Primary & Secondary) Life skills (primary, secondary & TIVET)
Aptitude
Customer interaction: listening and rapport development, customer etiquette
Life skills (primary, secondary & TIVET)
Listening skills Interpersonal Communication skills
Data skills: numerical ability, logical reasoning, data interpretation, accuracy and diligence
Mathematics (all levels)
Business ethics and organisation culture: understanding of clients values, moral ethics and work ethics
Applied education (business education, accounts, commerce, typing and office practice) (Secondary and TIVET)
Business writing Project management skills
Source: MOIC (2010)
One major recommendation from the BPO/KPO Skills Gap Assessment Report (MOIC, 2010) was the need to
develop a certificate course for the BPO-ITES industry that would enhance the employability of the persons in the
industry. The Kenya ICT Board has taken this recommendation further and is currently working with local universities
and international consultants to implement a customised curriculum for the industry.
A recent evaluation of the IT skills in Kenya (KICTB, 2011), has shown that there still remains a gap in the high-end-
talent pool of the IT skilled workforce, and in particular software development and project management skills. The
evaluation report (KICTB, 2011) further indicated that, of the total IT employment in Kenya (~27,000 IT professionals
in 2010), IT support people represent the largest portion (27%), followed by applications systems analysts and
system engineers (13% each). Roughly 9,600 IT professionals are expected to be added to the Kenyan IT workforce,
48
and the report showed that the demand for individual IT professionals differed by profession with the software
developers (at 70% growth) and project managers (at 57% growth) expected to grow the fastest over the period
2011-2013. Given this is a highly skilled industry, post-secondary institutions in Kenya will need to work closely with
the BPO/ITES industry to ensure their training curriculum is aligned, adequate and relevant in order to be competitive
in this industrial sector.
Training provisions/programmes to improve skills of the sector
Training measures have been initiated to build Kenya‟s capacity in BPO by increasing the ICT talent pool in the
country. Measures initiated by the government include the following:
identification and development of BPO specific skills development training programmes;
the establishment of an industry specific university (Multimedia University College of Kenya) to address the
HR gap;
efforts to establish a Centre of Excellence for BPO/ITES training;
the development and rolling out of ICT curricula to primary and secondary schools to improve ICT skills;
various training collaborations with other stakeholders, e.g. KICTB collaborations with SAP which
announced a partnership that will see 100 bright but underprivileged students undergo training to become
certified SAP Software engineers; NetHope Academy – a six-month programme that provides computer
science students with both classroom and on-the-job IT skills training – translates vocational training into
private sector employment for young adults. The NetHope initiative graduated 37 IT students from its
inaugural Kenya NetHope Academy class in September; The Chipuka Project in which the Carnegie Mellon
University is working with KICTB to create Professional Certification for Software Developers (KICTB,
website).
Other than the government, BPO companies and call centres offer continuous in-house training and self-
improvement support to their employees. BPOs and call centres practice continuous recruitment and training of call
centre agents. While this ensures the specific BPO companies have the requisite manpower, it also adds value to the
sector as a whole by increasing the pool of trained, BPO-ready workers available in the country.
49
4.6 Policy initiatives aimed at creating a conducive environment for BPO growth
Policy, legal and regulation framework
Kenya has undertaken steps to create a conducive environment for the ICT sector growth needed for the BPO//ITES
industry. The Government has put in place the National ICT policy (2006) and various legal frameworks that support
the sector (Communication Amendment Act, 2009, Kenya Information and Communication Act cap 411 A, and its
regulations). In addition, the constitution and other legislations (ie. Consumer Protection Act, 2012, Regulations 2010,
Competition Act, 2010, draft laws on Data Protection and Access to Information, etc.) augment the existing ICT
specific policy.
Policy, legal and institutional reforms have also been undertaken in an effort to strengthen the local ICT sector.
Among them is the enactment of the Kenya Communications (Amendment) Act of 2009, to mainstream e-commerce
in the economy.
The Communication Commission of Kenya (CCK) is a converged regulatory authority for the information and
communications sector (including broadcasting, multimedia, telecommunications and postal services) and electronic
commerce in Kenya (CCK website, 2013). The CCK provides a regulatory framework that promotes equity,
encouraging operators to grow and cover both rural and urban areas of the country. The Kenya Communications
(Amendment) Act of 2009 addresses critical issues in the BPO and wider ICT sector, including legal recognition of
electronic records and signatures, creation of new offences with respect to electronic records and transactions
including cyber-crime, destruction of electronic records and reprogramming of mobile phones, definitions in relation to
certification and electronic transactions, functions and powers of e-transactions regulator, licensing of e-certification
services and formation and validity of e-contracts.
4.7 Connectivity and access to ICT (mobile, computer, internet) equipment
Current ICT sector statistics on data and internet service
In the fourth quarter, CCK reported that the ICT sector statistics for 2011/12 showed there were 7.7 million internet
subscriptions and that 98.9% of these subscriptions came from the mobile data/internet subscriptions category. The
growth in fixed-line subscriptions has been substantially lower reaching 49,371 subscriptions, while satellite
subscriptions declined from 787 to 509 subscriptions. The decline on the satellite subscriptions was attributed to the
effects of the roll out of the fibre infrastructure in the country. Since the end of December 2011, the total broadband
subscriptions (defined as speeds greater than or equal to 256Kbps in one or both directions) reached 726,802
subscriptions and has grown five-fold since 2010/2011 (CCK 2012).
Despite these demands for internet, there is a disparity in access to ICT between rural and urban Kenya (CCK,
2010), between counties and between some sub-location levels. According to the 2009 Census, access to voice
service (majority through mobile phones) was over 50% of the population. However, counties such as Nairobi,
50
Kiambu and Nyeri hosted usage levels close to 70% while rural areas such as Turkana and Wajir counties recorded
usage levels below 10%. This geographical disparity is also true for internet access.
The penetration of mobile was significantly higher than the computer and internet. According to CCK as at June
2011, mobile penetration averaged at 59.8%, computer access averaged at 9.1% and the internet access was lower
with only 7.2% of the population connected (CCK, 2011a).
The 2009 Census results also reported that the main places of accessing internet in Kenya were cybercafés, followed
by work places, own houses and mobile phones. However, mobile phones and telecommunication centres
(community centres & educational centres) are the main venues used by the population to access internet in areas
with low access to the internet (CCK, 2011a).
4.8 Computer literacy and use
CCK (2010) provides statistics captured by the National ICT survey of 2010 revealing that only 8.4% of Kenyans
used computers in the prior 12 months. The use of computers also increased amongst the younger age groups,
peaking for 20-24 years olds before gradually declining. Among the users, 20.6% reported to have used computers at
the office/work place, 15.0% used them at educational centres, 2.1% at community centres, and 1.7% at friends‟
houses. Slightly less than a third of users had accessed computers at cybercafés, while less than a quarter had
accessed computers at home. Among urban dwellers, 20% reported using a computer within the 12 months
preceding the survey, while only 5% of persons residing in rural areas reported using computers in the same period.
This finding points to the huge disparity in access to computers between urban and rural populations.
Regionally, Nairobi had the highest usage of computers with 31.2% of the population reporting to have used
computers in the 12 months preceding the survey. This was followed by central (10%) and Nyanza (7.4%). The
Western region had the lowest usage with 2.7%. Among the genders, 9.5% of men reported to have used computers
compared to 7.3% of women. When considering age, the 20-24 age bracket had the highest usage levels (18.2%)
followed by the 30-34 age bracket (16.5%) and then the 25-29 age bracket (13.7%). These are likely to be the age
brackets that will benefit most from digital employment initiatives. Most users resided in urban areas (20.1%) as
opposed to rural areas which accounted for 3.7% of the users. Consequently, urban dwellers are likely to benefit
more out of digital employment relative to their rural counterparts. In addition, 63% of those who used computers
have higher education qualifications. Digital employment is therefore likely to benefit those who have higher
education level certifications relative to secondary, primary and pre-primary certifications.
One must also make note that the relative high usage of computers in the urban areas like Nairobi and its high
literacy and education rate have provided the breeding ground of innovation in the country which will help to support
the BPO sector. The technological universities and innovative institutions such as iHub have a shown dramatic
increase in the number of software developers in mobile creating locally developed products that help the local
population. The contribution of these innovation centres will work hand-in-hand in providing the human capacity to be
employed in BPO/ITES work.

51
4.9 Kenya‟s BPO/ITES in relation to Impact Sourcing
In this section we provide samples of emerging services that demonstrate that ICTs are impacting the lives of
Kenyans and that as the projects are implemented, the country is enhancing the capacity of local citizens to be
equally involved in the development, implementation and use of ICT. Given Impact Sourcing‟s goal in seeing
outsourcing provide employment to poor and vulnerable persons who may not always have had opportunities in
digital work, the following projects show potential or current examples for work to reach those disadvantaged
populations. Several of the current initiatives have evolved from previous conceptual innovations such as micro work
through mobile crowd sourcing which was introduced when txteagle provided SMS-based work done on mobile
phones in Kenya (Eagle, 2009). While the projects below are not an exhaustive list of innovative mechanisms for
Impact Sourcing in Kenya, it provides a picture of some of the exciting prospects of decent work, especially for
unemployed youth.
Pasha Centres
The ICT sector is currently more active in urban areas, resulting in wide regional disparities in the distribution of ICT
facilities. In an effort to enhance digital inclusion, the KICTB has been implementing Pasha Centres (Digital Village).
Pasha means „inform‟. The Pasha Centres aim to generate growth and employment by leveraging ICT and Public
Private Partnerships to create Information Technology Enabled Services and contribute to improved efficiency and
transparency of selected government functions through e-government applications.
This initiative aims at providing internet access and various online services at grassroots level. Specifically the
centres are designed to be sustainable, with the enterprenuers having access to a revolving fund. The revolving fund
is disbursed as a loan by a local bank, repayable over a three-year period.
Importantly each Pasha Centre includes a blend of the following services:
internet access computer training, vocational training, ICT retailing;
access to government services;
entertainment and gaming;
typing and data entry;
printing services;
copying and scanning;
CD/DVD burning, faxing, IP telephony, cell phones and SIM card sales;
M-Pesa and/or other financial services.
By providing Kenyans in rural areas with access to information, the centres serve to:
enhance business skills and knowledge in rural areas as well as expose rural communities to world news
and trends that may positively enhance their lives;
provide employment for Kenyans both directly through economic activity that the centre will generate and
secondarily through the opportunities that the information will provide;
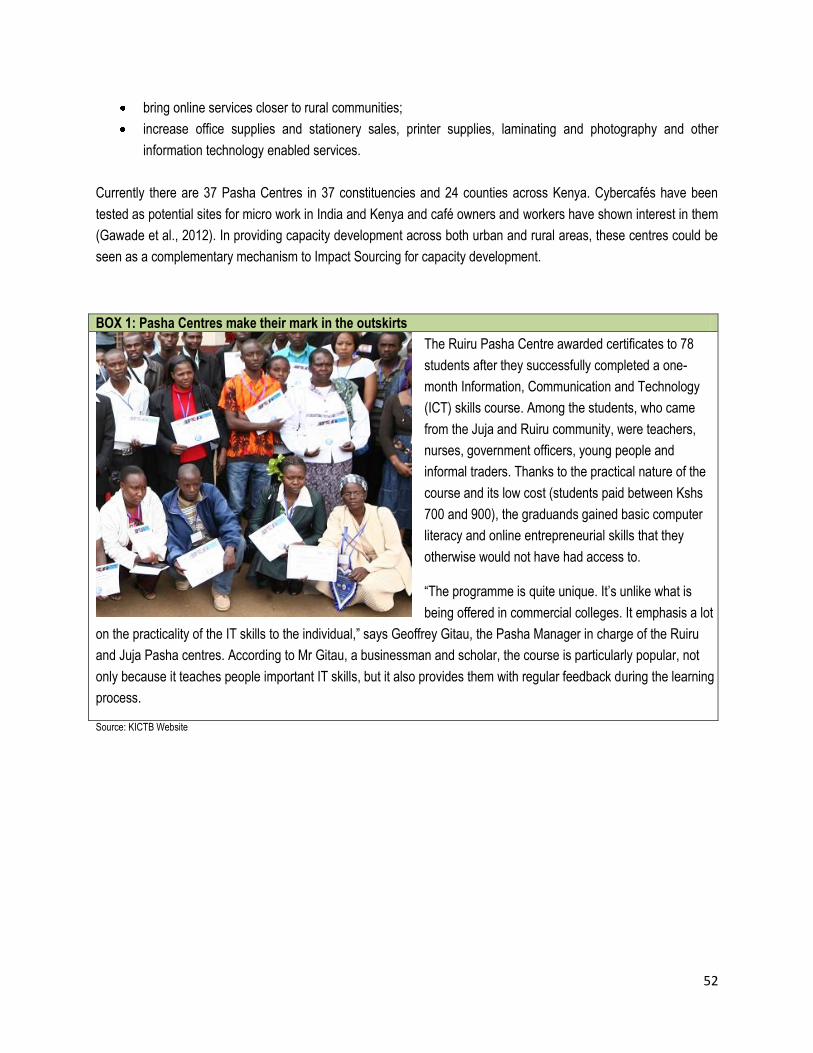
52
bring online services closer to rural communities;
increase office supplies and stationery sales, printer supplies, laminating and photography and other
information technology enabled services.
Currently there are 37 Pasha Centres in 37 constituencies and 24 counties across Kenya. Cybercafés have been
tested as potential sites for micro work in India and Kenya and café owners and workers have shown interest in them
(Gawade et al., 2012). In providing capacity development across both urban and rural areas, these centres could be
seen as a complementary mechanism to Impact Sourcing for capacity development.
BOX 1: Pasha Centres make their mark in the outskirts
The Ruiru Pasha Centre awarded certificates to 78
students after they successfully completed a one-
month Information, Communication and Technology
(ICT) skills course. Among the students, who came
from the Juja and Ruiru community, were teachers,
nurses, government officers, young people and
informal traders. Thanks to the practical nature of the
course and its low cost (students paid between Kshs
700 and 900), the graduands gained basic computer
literacy and online entrepreneurial skills that they
otherwise would not have had access to.
“The programme is quite unique. It‟s unlike what is
being offered in commercial colleges. It emphasis a lot
on the practicality of the IT skills to the individual,” says Geoffrey Gitau, the Pasha Manager in charge of the Ruiru
and Juja Pasha centres. According to Mr Gitau, a businessman and scholar, the course is particularly popular, not
only because it teaches people important IT skills, but it also provides them with regular feedback during the learning
process.
Source: KICTB Website
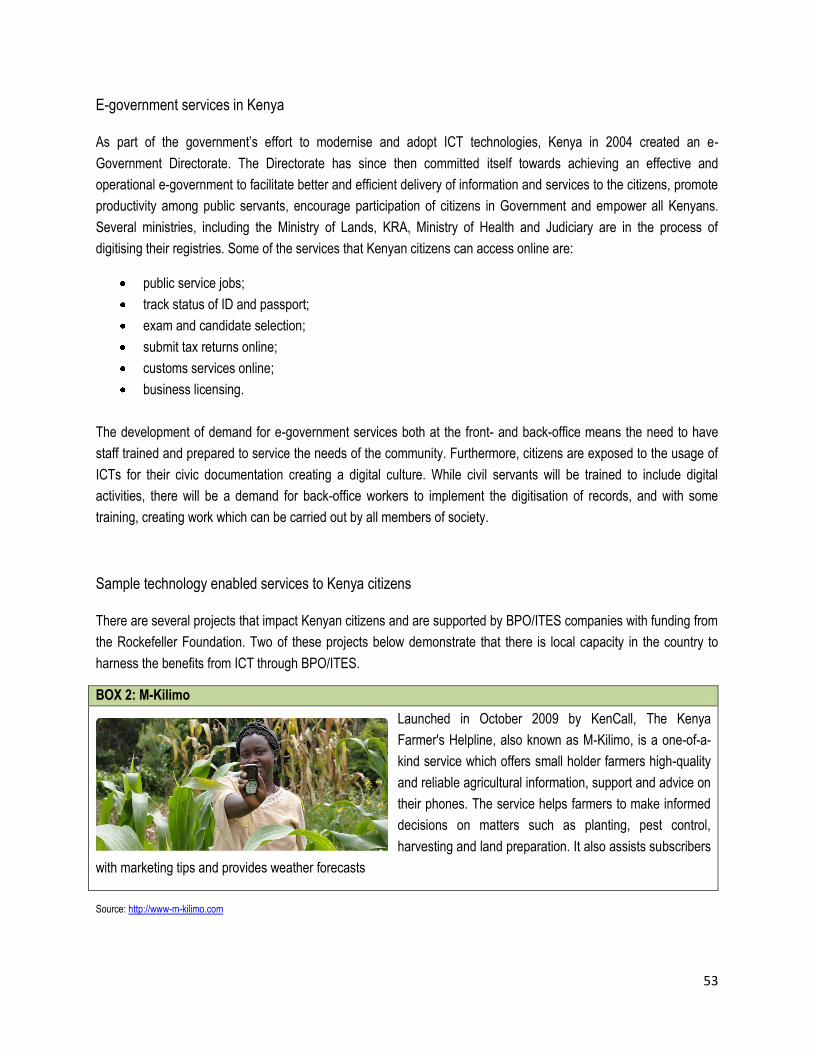
53
E-government services in Kenya
As part of the government‟s effort to modernise and adopt ICT technologies, Kenya in 2004 created an e-
Government Directorate. The Directorate has since then committed itself towards achieving an effective and
operational e-government to facilitate better and efficient delivery of information and services to the citizens, promote
productivity among public servants, encourage participation of citizens in Government and empower all Kenyans.
Several ministries, including the Ministry of Lands, KRA, Ministry of Health and Judiciary are in the process of
digitising their registries. Some of the services that Kenyan citizens can access online are:
public service jobs;
track status of ID and passport;
exam and candidate selection;
submit tax returns online;
customs services online;
business licensing.
The development of demand for e-government services both at the front- and back-office means the need to have
staff trained and prepared to service the needs of the community. Furthermore, citizens are exposed to the usage of
ICTs for their civic documentation creating a digital culture. While civil servants will be trained to include digital
activities, there will be a demand for back-office workers to implement the digitisation of records, and with some
training, creating work which can be carried out by all members of society.
Sample technology enabled services to Kenya citizens
There are several projects that impact Kenyan citizens and are supported by BPO/ITES companies with funding from
the Rockefeller Foundation. Two of these projects below demonstrate that there is local capacity in the country to
harness the benefits from ICT through BPO/ITES.
BOX 2: M-Kilimo
Launched in October 2009 by KenCall, The Kenya
Farmer's Helpline, also known as M-Kilimo, is a one-of-a-
kind service which offers small holder farmers high-quality
and reliable agricultural information, support and advice on
their phones. The service helps farmers to make informed
decisions on matters such as planting, pest control,
harvesting and land preparation. It also assists subscribers
with marketing tips and provides weather forecasts
Source: http://www-m-kilimo.com
54
BOX 3: Childline Kenya
A non-governmental organisation (NGO), Childline Kenya is dedicated to eradicating
child abuse in Kenya. The organisation runs the National Child Helpline 116, a toll-
free and web-based helpline which operates 24 hours a day. The performance of
the call centre was much improved thanks to an upgrade carried out by Techno
Brain BPO with the financial support of the Rockefeller Foundation. Thanks to the
upgrade, all calls are now being received and handled and the abandon rate of the
phone calls has dropped to below 1%. The call centre now also boasts high network connectivity, a CRM
database and up-to-date hardware. All agents in the call centre are counsellors who have been trained to use the
technology available to them effectively.
Source: http://www.childlinekenya.co.ke and http://www.technobraingroup.com
Furthermore in Kenya, Samasource was one of the first to introduce microwork within a BPO concept. Providing BPO
low-end services from data capture and archiving to customer support with local partner organisations, Samasource
has a delivery centre in Nairobi providing the internet-enabled smaller digital tasks of a bigger project to workers (with
a focus on females) with less skills and training. According to their model, they provide a fair wage, and two to four
weeks of computer-based training. Their initial review of impact shows that Samasource workers in future are
obtaining promotions at work, finding better formal work opportunities or taking on higher education pursuits. For
women workers, some of the improved income has resulted in improved functions from budgeting decisions to
respect (Selim, 2012).
Digital Divide Data (DDD) is another company in Kenya pursuing Impact Sourcing. Starting recruitment in high
school, DDD takes high-risk marginalised youth through a three to eight month computer and English skills
programme. Those who meet the required standards can then work at DDD while still going to school. The
challenges of DDD include having to use donor support to help pay for the costs of training and study scholarships
while at the same time, developing retention strategies to keep highly trained staff (Selim, 2012).

55
5. Discussion and implications for Impact Sourcing
An analysis of the trends in the Kenya labour market combined with a brief overview of the BPO sector and the wider
ICT sector have highlighted a number of issues which may impact on the potential of promoting Impact Sourcing
initiatives as a way to create employment for young people and to serve marginalised communities. The main
discussion points are organised into two sections and are identified as: Youth and the BPO sector; and the possibility
of expanding the BPO sector beyond the urban areas.
5.1 Youth and the BPO workforce
The Kenyan youth comprise a large percentage of the unemployed and especially for those in the 15-19 and 20-24
year old groups. This is very similar in some respects to the demographics of the young BPO work force in Kenya.
However, there is a general lack of awareness on BPO as a source of viable employment for the youth, and thus a
need to raise awareness among the youth of the opportunities for career growth within the BPO/ITES sector.
There is evidence that there are skills gaps within the Kenyan youth labour force for the high end BPO-ITES sector
given that some estimates see many in BPO work without university degrees. However for the low-end market such
as contact centres, there are ample skills available, and there are efforts to address the gaps, especially targeted
training for the high-end skills. Due to the high graduation and literacy rates from Kenyan schools, the youth form a
population that is technology savvy and can be up-skilled to participate in the ICT sector. Furthermore, the sample
projects that are outlined indicate that given the training opportunity, the skills gap can be mitigated, quality work
achieved, and jobs created for the local people. Entrepreneurial and innovative spirit is strong in Kenya as seen with
the majority who work in the informal sector throughout the working age population. When formal employment
becomes available in the BPO sector, it will be from this youth population with some work ethic from the informal
sector that will help bring Kenya‟s BPO sector to fruition in Africa.
Given the new prospects of the Konza City project, many youth could potentially be formally employed in the BPO
sector within the next 20 years. Further investigation of the labour implications of this Konza scenario especially
given that the size of the project and its rural location would be a worthwhile venture and measurement of skills,
would help to ensure there is enough skilled persons to absorb the work.
5.2 Implications for urban/rural absorption into the BPO sector
The urban unemployment rate is higher as compared to the rural, in particular for the 20-24 year old group. The rural
youth still continue to participate in the agricultural sector, and the rural-migration of youth seeking decent jobs
increases the urban unemployment rates.
The disparity in access to ICTs between rural and urban has implications for expanding the BPO sector to rural and
other underserved communities in the Kenya context. This along with the change of labour activities in rural areas
56
may be of great interest to the Konza City project again given its hope to create a brand new urban centre outside of
Nairobi in the middle of a rural area. Clearly the plans have thought about some accommodation for people who
would move to this new city, but further investigation on the training of local persons where agriculture has always
been the strength as yet would be needed.
ICT infrastructure connectivity across the country is primary to this study for the reason that the vision of the poverty
reduction through information and digital employment (PRIDE) initiative is to create employment for the bottom of the
pyramid or BoP workers in the BPO/ITES sector, and among the key prerequisites of online work is connectivity.
Consequently, among the primary indicators of Kenya‟s readiness for digital employment is the accessibility of
connectivity (internet bandwidth/broadband) among its population, who are the potential employees, in both the rural
and urban areas.
Enhancing access to ICT services in rural and underserved areas is key to accelerating development. This
observation is drawn from the aims of Pasha Centres which are to achieve digital inclusion by increasing internet
access in previously underserved regions of Kenya, primarily rural Kenya. It is worth noting that Pasha Centres are
considered centres of development and the vision is to extend information technology enabled services, entrepreneur
training and enablement services and technologies and management tools to empower entrepreneurs in the rural
areas. This is an enabler of development. Secondly, in most cases, there seems to be a correlation between access
and usage of ICT on one hand and age, gender and education on the other. Notably, a general observation is that
access to ICT facilities seems to increase with age and peaks at the ages of 20-39, and thereafter, begins to decline.
As far as the urban rural disparity is concerned, the data captured seems to indicate that indeed, a huge disparity in
terms of connectivity exists between urban and rural Kenya. In each of the eight provinces surveyed, more than half
of those with access reside in the urban areas as opposed to rural areas. The highest access in rural Kenya is in
Central, Coast and Rift Valley provinces, whose levels are slightly over 8%. Consequently, the most ready locations
for BPO/ITEs related work would be the urban areas of the provinces.
With regard to internet connection at the household level performance is dismal. Other than Nairobi (27.2%), home
connectivity in all other urban areas is low, not exceeding 5.3%. The urban area of North Eastern province has the
lowest household level connectivity at 1.1%. Consequently, any BPO related work cannot be undertaken from home
in most cases.
Regarding the place most Kenyans access the internet by county, the cybercafé is the most prevalent location in
most counties. This finding indicates that the cybercafé has great potential in being a centre for BPO/ITES related
work throughout the country.
The success of the Pasha Centres and cybercafés in the rural areas goes a long way to demonstrate that if rural
regions are provided with enabling infrastructure (data access) there is a chance for ICT to be appropriated for
economic upliftment of local communities.
In conclusion, Kenya provides Impact Sourcing with its innovative-thinking work force, strong educational
backgrounds and newly implemented infrastructure to support the future to come in digital work.
57
References
African Economic Outlook (2012). Kenya Country Note, Available at: http://www.africaneconomicoutlook.org.
Atieno, R. (2010). Explaining Female Labor Force Participation: The Case of Kenya‟s Informal Sector and the Effect
of the Economic Crisis, A Draft Paper Submitted to the 2010 Annual IAFFE Conference, Buenos Aires, Argentina,
22-24 July 2010.
Childline Kenya (2012). Childline Kenya website. Available at: http://www.childlinekenya.co.ke/.
Communication Commission of Kenya (CCK) (2010). Analysis of 2010 ICT Survey.
Communication Commission of Kenya (CCK) (2011a). ICT Access Gaps in Kenya.
Communication Commission of Kenya (CCK) (2011b). National ICT Survey Report.
Communication Commission of Kenya (CCK) (2011c). Quarterly Sector Statistics Report: 2nd Quarter 2011/2012
(October-December 2011).
Communication Commission of Kenya (CCK) (2012). Quarterly Sector Statistics Report: 4th Quarter 2011/2012 (April-
June 2012).
Eagle, N. (2009). Nathan Eagle – MIT Media Lab. Available at: http://web.media.mit.edu/~nathan/.
Enablis Entrepreneur Network (2012). Enablis website. Available at: www.enablis.org/Images/contentImages/file/Fact
sheets/Enablis FactSheet - English.pdf.
Gawade, M., Vaish, R., Waihumbu, M. N., & Davis, J. (2012, October). Exploring employment opportunities through
microtasks via cybercafes. In Global Humanitarian Technology Conference (GHTC), 2012 (pp. 77-82). IEEE.
Government of Kenya (GoK) (2003). The 1998/1999 Labour Force Survey Report, Central Bureau of Statistics,
Ministry of Planning and National Development. Nairobi: Kenya. March 2003.
Government of Kenya (GoK) (2008). 2005/06 Kenya Integrated Household Budget Survey, KNBS, Nairobi: Kenya.
Government of Kenya (GoK) (2010). First Medium Term Plan (MTP), (2008- 2012) of the Kenya Vision 2030.
Government of Kenya (GoK) (2012). Economic Survey, 2012.
Government of Kenya (GoK) (2012b). Report of the Taskforce on the re-alignment of the education sector to the
constitution of Kenya 2010.
IBM (2010). “Strategic Positioning of the Digital Villages as a Centre for Rural Empowerment and Development”,
Corporate Services Corps Kenya Team 1, October.
Impact Sourcing Africa brochure.
58
Institute of Economic Affairs (IEA) (2010). The Dynamics and Trends of Employment in Kenya, Institute of Economic
Affairs, Kenya.
International Labour Organization (ILO) (2012). Key Indicators of the Labour Market, KILM 2012,7th edition, Available
at: http://kilm.ilo.org/kilmnet (accessed 26/10/2012)
Isenberg, D. (2009). „KenCall – Can Nik Nesbitt‟s Venture Succeed in Kenya?‟ HBS No.809-114, Boston: Harvard
Business School Publishing. Available at:
http://www.kencall.com/kencall/documents/HBS_Kencall_source_June_2009.pdf (accessed 28/07/2012).
IST Africa (2012). „Current ICT Initiatives and Projects in Kenya,‟ Available at: http://www.ist-
africa.org/home/default.asp?page=welcome (accessed 08/08/2012).
Kariuki, E. M. (2010). „Kenya ICT Board: Progress Report on Implementation of the McKinsey BPO/ITES Study
Recommendations,‟ Available at: http://www.doitinkenya.co.ke/mylinks/BPO_and_Progress_report.pdf (accessed
01/08/2012)
Kariuki, E. M. (2011). „BPO/ITeS Investment Factsheet,‟ Available at:
http://www.doitinkenya.com/mylinks/investors/BPO%20and%20ITeS%20Investor%20%20FACT%20SHEET%20as%
20at%20Nov%202011.pdf (accessed 29/07/2012).
Kenya Information & Communication Technology Board (KICTB) (2010). Business Plan Kenya Centre of Excellence.
Kenya ICT Board (2012). Do IT in Kenya Portal , Available at: www.doitinkenhya.co.ke (accessed 13/08/2012).
Kenya Information & Communication Technology Board (2012). Kenya ICT Board website. Available at:
www.ict.go.ke.
Kenya Information & Communication Technology Board (KICTB) (undated). „The Kenya BPO Guide Book,‟ Available
at: http://www.ict.go.ke/images/guide_book.pdf (accessed 29/07/2012).
Kenya Information & Communication Technology Board (KICTB) (2012). The Pasha Portal:-Connecting
Communities, Available at: www.pasha.co.ke/node/3 (accessed 13/08/2012).
Kenya Information & Communication Technology Board (KICTB) (2011). Julisha Survey on Kenya ICT market
overview Available at: https://opendata.go.ke/Education/Julisha-Survey-on-Kenya-ICT-Market-Overview-2011/3j44-
wqzt
Kenya Farmers Helpline (2012). M-Kilimo Mtandao wa Wakulima website. Available at: http://www.m-kilimo.com/.
Ministry of Information and Communications (MOIC) (2010). „BPO/KPO Skills Gap Assessment Report‟.
Omolo, J. (2010). „Youth Unemployment in Kenya.‟ Unpublished.
59
Omolo, J. (2011). Youth Employment in Kenya: Analysis of Labour Market and Policy Interventions. http://www.fes-
kenya.org/media/publications/Youth%20Employment-
Analysis%20of%20Labour%20Market%20and%20Policy%20Interventions%20Sept%202011.pdf
Pollin, R. (2009). Labour market institutions and employment opportunities in Kenya. Paper prepared for Festschrisft
conference. March 2009.
Republic of Kenya – Ministry of Labour (2012). Labour Perspectives, 2012.
Republic of Kenya – Ministry of Education (2012). A policy framework for Education, Draft, April 2012.
Republic of Kenya (2011). Second Annual Progress Report on the Implementation of the Medium Term Plan (MTP)
(2008-2012) of the Kenya Vision 2030 – Released May, 2011. Ministry of State for Planning, National development
and Vision 2030; Monitoring and Evaluation Directorate.
Republic of Kenya (2012). Third Annual Progress Report 2010-2011 on the Implementation of the first Medium Term
Plan (MTP) (2008-2012) of the Kenya Vision 2030 – Released April, 2012. Ministry of State for Planning, National
development and Vision 2030; Monitoring and Evaluation Directorate.
Selim, N. (2012). „Innovation for Job Creation: Background note for the World Development Report. 2013‟. World
Bank.
Techno Brain (2012). Techno Brain website portal. Available at: www.technobraingroup.com
The Kenya Vision 2030 (2007). „A Globally Competitive and Prosperous Kenya,‟ First Medium Term Plan (2008-
2012). Ministry of State for Planning, National Development and Vision 2030.
The Rockefeller Foundation (2011). Report on Impact Sourcing Conference 2011: „Impact Sourcing: An Emerging
path to job creation?‟ Impact Sourcing Conference, Johannesburg, December.
The Rockefeller Foundation (2011). „Job creation through building the field of Impact Sourcing,‟ –Working paper,
June 2011. Monitor Company Group
United Nations Development Programme (UNDP) (2010). Kenya National Human Development Report: Youth and
Human Development: Tapping the Untapped Resource. June 2010. UNDP Kenya.
Waema, T. (2009). Development of a Business Process Outsourcing Industry in Kenya: Critical Success Factors,
IDRC research report. Unpublished.
Waema, T., Adeya, C. and Ndung‟u, N. M. (2010). “Kenya ICT sector performance review: towards evidence based
ICT policy and regulation,” Vol. 2, policy paper 10, Research ICT Africa.
Wanjiku, R. (2012). “Kenya changes BPO strategy, striving for efficiency,” 24 April 2012. PC Advisor online
magazine. Available at: http://www.pcadvisor.co.uk/news/small-business/3353512/kenya-changes-bpo-strategy-
striving-for-efficiency/ (Accessed 25/09/2012).

60
World Bank (2012). Kenya Economic Update, June, 2012. Available at:
http://siteresources.worldbank.org/INTAFRICA/Resources/257994-1335471959878/kenya-economic-update-june-
2012.pdf.
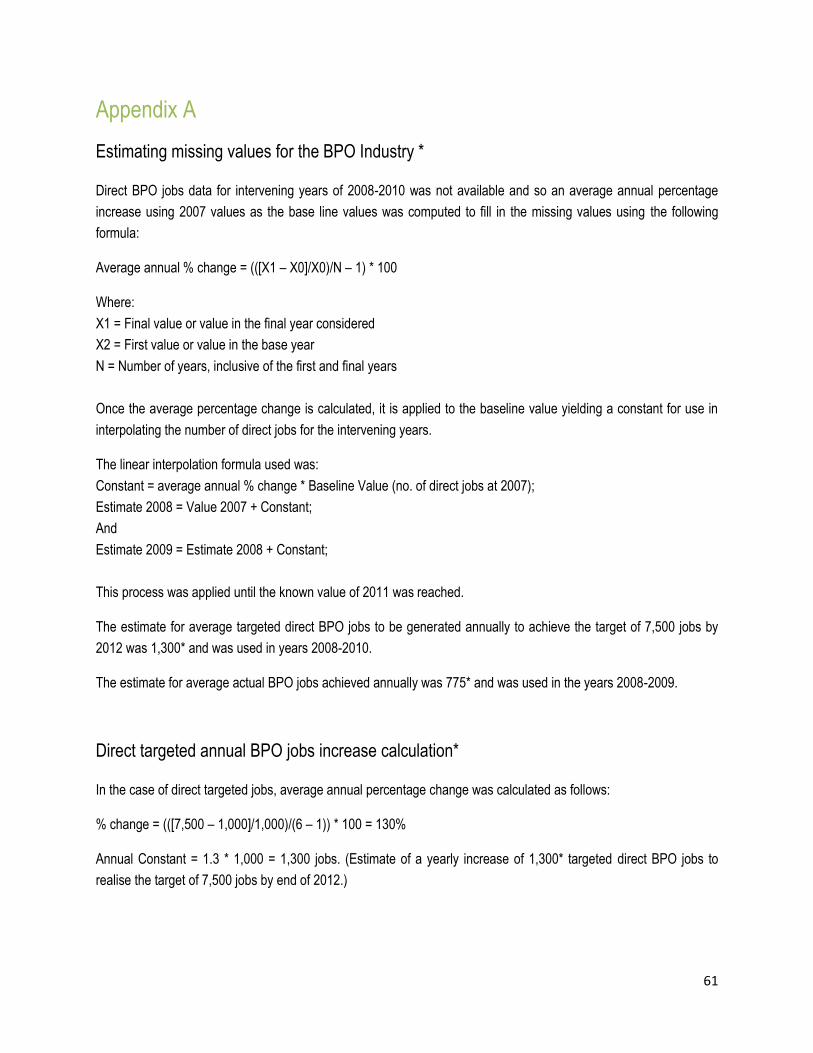
61
Appendix A
Estimating missing values for the BPO Industry *
Direct BPO jobs data for intervening years of 2008-2010 was not available and so an average annual percentage
increase using 2007 values as the base line values was computed to fill in the missing values using the following
formula:
Average annual % change = (([X1 – X0]/X0)/N – 1) * 100
Where:
X1 = Final value or value in the final year considered
X2 = First value or value in the base year
N = Number of years, inclusive of the first and final years
Once the average percentage change is calculated, it is applied to the baseline value yielding a constant for use in
interpolating the number of direct jobs for the intervening years.
The linear interpolation formula used was:
Constant = average annual % change * Baseline Value (no. of direct jobs at 2007);
Estimate 2008 = Value 2007 + Constant;
And
Estimate 2009 = Estimate 2008 + Constant;
This process was applied until the known value of 2011 was reached.
The estimate for average targeted direct BPO jobs to be generated annually to achieve the target of 7,500 jobs by
2012 was 1,300* and was used in years 2008-2010.
The estimate for average actual BPO jobs achieved annually was 775* and was used in the years 2008-2009.
Direct targeted annual BPO jobs increase calculation*
In the case of direct targeted jobs, average annual percentage change was calculated as follows:
% change = (([7,500 – 1,000]/1,000)/(6 – 1)) * 100 = 130%
Annual Constant = 1.3 * 1,000 = 1,300 jobs. (Estimate of a yearly increase of 1,300* targeted direct BPO jobs to
realise the target of 7,500 jobs by end of 2012.)

62
Direct actual achieved BPO jobs increase calculation*
For the direct actual achieved jobs, average annual percentage change was calculated as follows:
% change = (([4,100 – 1,000]/1,000)/(5 – 1)) * 100 = 77.5%
Annual constant = 0.775 * 1,000 = 775 jobs. (Estimate of a yearly increase of 775* actual achieved BPO jobs.)

This research report is part of a published series which were completed in a collaborative partnership between the
University of KwaZulu-Natal, University of Nairobi and University of Ghana‟s Institute of Statistical Social and
Economic Research. This research report series are supported by the Rockefeller Foundation.
First published by Development Studies, School of Built Environment and Development Studies, College of
Humanities, University of KwaZulu-Natal, in August 2013.
Citation: Wausi, A., Mgendi, R., Ngwenyi, R. (2013). Labour Market Analysis and Business Process Outsourcing in
Kenya: Poverty Reduction through Information and Digital Employment Initiative (PRIDE Africa). Research Report
2013 No 3, August 2013. Durban: University of KwaZulu-Natal.
University of KwaZulu-Natal
School of Built Environment and Development Studies
College of Humanities
King George V Avenue,
Howard College Campus,
Durban, 4041 SOUTH AFRICA
Telephone: +27(0)31 2602287
Fax: +27(0)31 260 2359
Email address:
Website: www.ukzn.ac.za