Journal of Financial Economics - University of California,...
39
Are institutions informed about news? $ Terrence Hendershott a,n , Dmitry Livdan a,1 , Norman Schürhoff b,2 a Haas School of Business, University of California, Berkeley, CA 94720, United States b Faculty of Business and Economics at University of Lausanne, Swiss Finance Institute, and CEPR, Extranef 239, CH-1015 Lausanne, Switzerland article info Article history: Received 16 April 2012 Received in revised form 26 August 2014 Accepted 17 November 2014 Available online 1 April 2015 Keywords: Institutions Trading Stock returns News sentiment JEL: G11 G12 G14 G24 abstract This paper combines daily buy and sell institutional trading volume with all news announcements from Reuters. Using institutional order flow (buy volume minus sell volume) we find a variety of evidence that institutions are informed. Institutional trading volume predicts the occurrence of news announcements. Institutional order flow predicts (i) the sentiment of the news; (ii) the stock market reaction on news announcement days; (iii) the stock market reaction on crisis news days; and (iv) earnings announcement surprises. These results suggest that significant price discovery related to news stories occurs through institutional trading prior to the news announcement date. & 2015 Elsevier B.V. All rights reserved. 1. Introduction Institutional trading is important because it constitutes the majority of daily trading volume and institutional investors are the largest owners of publicly traded stocks in the U.S. 3 Potentially important drivers of institutional trading are superior information gathering and processing skills. Superior information by institutions could arise from access to more information and greater resources to process information. Unlike retail investors, institutions often directly communicate with publicly traded firms as well as brokerage firms through their investment banking, lending, and asset management divisions. Most mutual funds and hedge funds employ buy-side analysts and enjoy better relationships with sell-side analysts. Their economies of scale allow institutions to monitor many sources of Contents lists available at ScienceDirect journal homepage: www.elsevier.com/locate/jfec Journal of Financial Economics http://dx.doi.org/10.1016/j.jfineco.2015.03.007 0304-405X/& 2015 Elsevier B.V. All rights reserved. ☆ We thank Jonathan Berk, Eric Kelley, Olga Kolokolova (discussant), Matt Ringgenberg, Rick Sias, Paul Tetlock, Akiko Watanabe (discussant), conference participants at the EFA 2013, One day conference on Corpo- rate Finance 2013, and seminar participants at the University of Arizona, University of Illinois, Luxembourg School of Finance, Northwestern University, Stanford University, and Washington University in Saint Louis for helpful comments. We thank Rich Brown for providing the news data and the New York Stock Exchange for providing the institutional trading data. Norman Schürhoff gratefully acknowledges research support from the Swiss Finance Institute and the Swiss National Science Foundation Grant No. PDFMP1_141724. We thank Cornelius Schmidt for excellent research assistance. n Corresponding author. Tel.: þ1 510 643 0619; fax: þ1 510 643 1412. E-mail addresses: [email protected] (T. Hendershott), [email protected] (D. Livdan), [email protected] (N. Schürhoff). 1 Tel.: þ1 510 642 4733; fax: þ1 510 643 1412. 2 Schürhoff is also a Senior Chair of the Swiss Finance Institute and a Research Affiliate of the CEPR. Tel.: þ41 21 692 3447; fax: þ41 21 692 3435. 3 See, for example, Boehmer and Kelley (2009) and Securities Industry Association Fact Book (2007). Journal of Financial Economics 117 (2015) 249–287
Transcript of Journal of Financial Economics - University of California,...

Contents lists available at ScienceDirect
Journal of Financial Economics
Journal of Financial Economics 117 (2015) 249–287
http://d0304-40
☆ WeMatt Riconfererate FinUniversUniversfor helpand thedata. Nothe SwiGrant Nresearch
n CorrE-m
livdan@norman
1 Te2 Sc
Research
journal homepage: www.elsevier.com/locate/jfec
Are institutions informed about news?$
Terrence Hendershott a,n, Dmitry Livdan a,1, Norman Schürhoff b,2
a Haas School of Business, University of California, Berkeley, CA 94720, United Statesb Faculty of Business and Economics at University of Lausanne, Swiss Finance Institute, and CEPR, Extranef 239, CH-1015 Lausanne,Switzerland
a r t i c l e i n f o
Article history:Received 16 April 2012Received in revised form26 August 2014Accepted 17 November 2014Available online 1 April 2015
Keywords:InstitutionsTradingStock returnsNews sentiment
JEL:G11G12G14G24
x.doi.org/10.1016/j.jfineco.2015.03.0075X/& 2015 Elsevier B.V. All rights reserved.
thank Jonathan Berk, Eric Kelley, Olga Kolonggenberg, Rick Sias, Paul Tetlock, Akiko Wance participants at the EFA 2013, One day cance 2013, and seminar participants at the Uity of Illinois, Luxembourg School of Finity, Stanford University, and Washington Uniful comments. We thank Rich Brown for proNew York Stock Exchange for providing therman Schürhoff gratefully acknowledges ress Finance Institute and the Swiss Nationalo. PDFMP1_141724. We thank Cornelius Sassistance.
esponding author. Tel.: þ1 510 643 0619; faail addresses: [email protected] (T.haas.berkeley.edu (D. Livdan),[email protected] (N. Schürhoff).l.: þ1 510 642 4733; fax: þ1 510 643 1412.hürhoff is also a Senior Chair of the Swiss FiAffiliate of the CEPR. Tel.: þ41 21 692 3447; f
a b s t r a c t
This paper combines daily buy and sell institutional trading volume with all newsannouncements from Reuters. Using institutional order flow (buy volume minus sellvolume) we find a variety of evidence that institutions are informed. Institutional tradingvolume predicts the occurrence of news announcements. Institutional order flow predicts(i) the sentiment of the news; (ii) the stock market reaction on news announcement days;(iii) the stock market reaction on crisis news days; and (iv) earnings announcementsurprises. These results suggest that significant price discovery related to news storiesoccurs through institutional trading prior to the news announcement date.
& 2015 Elsevier B.V. All rights reserved.
kolova (discussant),tanabe (discussant),onference on Corpo-niversity of Arizona,ance, Northwesternversity in Saint Louisviding the news datainstitutional tradingsearch support fromScience Foundation
chmidt for excellent
x: þ1 510 643 1412.Hendershott),
nance Institute and aax: þ41 21 692 3435.
1. Introduction
Institutional trading is important because it constitutesthe majority of daily trading volume and institutionalinvestors are the largest owners of publicly traded stocksin the U.S.3 Potentially important drivers of institutionaltrading are superior information gathering and processingskills. Superior information by institutions could arise fromaccess to more information and greater resources to processinformation. Unlike retail investors, institutions oftendirectly communicate with publicly traded firms as wellas brokerage firms through their investment banking,lending, and asset management divisions. Most mutualfunds and hedge funds employ buy-side analysts and enjoybetter relationships with sell-side analysts. Their economiesof scale allow institutions to monitor many sources of
3 See, for example, Boehmer and Kelley (2009) and SecuritiesIndustry Association Fact Book (2007).
M. S
tew
art t
rial b
egin
s
Frau
d ch
arge
dis
mis
sed
Cou
rt ve
rdic
t
-30
-20
-10
0
10
Ret
urn
(%)
01feb2004 01mar2004 01apr2004Date
-20
-15
-10
-5
0
IOF
(%)
01feb2004 01mar2004 01apr2004Date
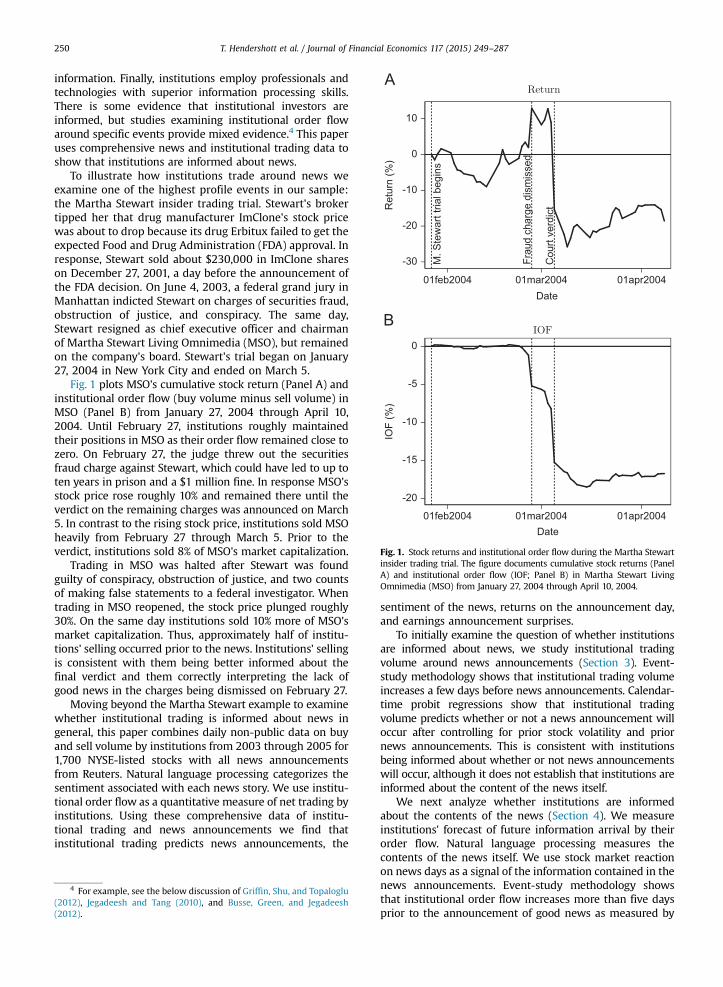
Fig. 1. Stock returns and institutional order flow during the Martha Stewartinsider trading trial. The figure documents cumulative stock returns (PanelA) and institutional order flow (IOF; Panel B) in Martha Stewart LivingOmnimedia (MSO) from January 27, 2004 through April 10, 2004.
T. Hendershott et al. / Journal of Financial Economics 117 (2015) 249–287250
information. Finally, institutions employ professionals andtechnologies with superior information processing skills.There is some evidence that institutional investors areinformed, but studies examining institutional order flowaround specific events provide mixed evidence.4 This paperuses comprehensive news and institutional trading data toshow that institutions are informed about news.
To illustrate how institutions trade around news weexamine one of the highest profile events in our sample:the Martha Stewart insider trading trial. Stewart's brokertipped her that drug manufacturer ImClone's stock pricewas about to drop because its drug Erbitux failed to get theexpected Food and Drug Administration (FDA) approval. Inresponse, Stewart sold about $230,000 in ImClone shareson December 27, 2001, a day before the announcement ofthe FDA decision. On June 4, 2003, a federal grand jury inManhattan indicted Stewart on charges of securities fraud,obstruction of justice, and conspiracy. The same day,Stewart resigned as chief executive officer and chairmanof Martha Stewart Living Omnimedia (MSO), but remainedon the company's board. Stewart's trial began on January27, 2004 in New York City and ended on March 5.
Fig. 1 plots MSO's cumulative stock return (Panel A) andinstitutional order flow (buy volume minus sell volume) inMSO (Panel B) from January 27, 2004 through April 10,2004. Until February 27, institutions roughly maintainedtheir positions in MSO as their order flow remained close tozero. On February 27, the judge threw out the securitiesfraud charge against Stewart, which could have led to up toten years in prison and a $1 million fine. In response MSO'sstock price rose roughly 10% and remained there until theverdict on the remaining charges was announced on March5. In contrast to the rising stock price, institutions sold MSOheavily from February 27 through March 5. Prior to theverdict, institutions sold 8% of MSO's market capitalization.
Trading in MSO was halted after Stewart was foundguilty of conspiracy, obstruction of justice, and two countsof making false statements to a federal investigator. Whentrading in MSO reopened, the stock price plunged roughly30%. On the same day institutions sold 10% more of MSO'smarket capitalization. Thus, approximately half of institu-tions' selling occurred prior to the news. Institutions' sellingis consistent with them being better informed about thefinal verdict and them correctly interpreting the lack ofgood news in the charges being dismissed on February 27.
Moving beyond the Martha Stewart example to examinewhether institutional trading is informed about news ingeneral, this paper combines daily non-public data on buyand sell volume by institutions from 2003 through 2005 for1,700 NYSE-listed stocks with all news announcementsfrom Reuters. Natural language processing categorizes thesentiment associated with each news story. We use institu-tional order flow as a quantitative measure of net trading byinstitutions. Using these comprehensive data of institu-tional trading and news announcements we find thatinstitutional trading predicts news announcements, the
4 For example, see the below discussion of Griffin, Shu, and Topaloglu(2012), Jegadeesh and Tang (2010), and Busse, Green, and Jegadeesh(2012).
sentiment of the news, returns on the announcement day,and earnings announcement surprises.
To initially examine the question of whether institutionsare informed about news, we study institutional tradingvolume around news announcements (Section 3). Event-study methodology shows that institutional trading volumeincreases a few days before news announcements. Calendar-time probit regressions show that institutional tradingvolume predicts whether or not a news announcement willoccur after controlling for prior stock volatility and priornews announcements. This is consistent with institutionsbeing informed about whether or not news announcementswill occur, although it does not establish that institutions areinformed about the content of the news itself.
We next analyze whether institutions are informedabout the contents of the news (Section 4). We measureinstitutions' forecast of future information arrival by theirorder flow. Natural language processing measures thecontents of the news itself. We use stock market reactionon news days as a signal of the information contained in thenews announcements. Event-study methodology showsthat institutional order flow increases more than five daysprior to the announcement of good news as measured by

T. Hendershott et al. / Journal of Financial Economics 117 (2015) 249–287 251
the natural language sentiment of the news; institutionalorder flow decreases more than five days prior to bad newsannouncements. Multivariate regressions show that institu-tional order flow predicts the sentiment of news announce-ments and the stock return on announcement days aftercontrolling for prior stock returns, news sentiment, andtrading volume. Vector autoregressions that control forlonger and more complex joint dynamics of returns, insti-tutional order flow, and news sentiment confirm theseresults. The economic magnitude of the predictability ismeaningful. Applying the Campbell and Thompson (2008)framework implies that observing institutional order flowwould enable investors in individual stocks to proportion-ally increase their expected returns by more than 40%.
Exploiting the Reuters assignment of news stories tovarious news categories, we investigate the types of newsabout which institutions are informed (Section 5). First, bec-ause asset prices behave very differently on days when imp-ortant macroeconomic news is scheduled for announcementrelative to other trading days (Savor and Wilson, 2014), weinvestigate institutional trading around macroeconomic news.We find that while institutional trading predicts returns onmacroeconomic news days, institutions trade in the directionof macroeconomic news for only one category of macroeco-nomic news: news on economic indicators.
The 2003–2005 sample is a calm period and institutions'role in firm governance is particularly important during timesof stress (Holmstrom and Tirole, 1993). Therefore, we studyunexpected value-destroying events. We classify events suchas bankruptcy and court decisions as crises. News about theseevents is associated with negative sentiment and negativestock returns. Institutional order flow predicts returns andsentiment for these categories of bad news.
A potential concern with the prior analysis is that com-munication between institutions and reporters could affectthe sentiment of news. Earnings announcements allow us tostudy whether institutions are informed about longer termfundamental information, which is very difficult for institu-tions to affect. We find that institutional order flow predictsthe surprise component of earnings announcements.
Finally, we study whether institutions trade in advance ofnews unrelated to longer term fundamentals, which we referto as hype. We use two alternative proxies for hype: pressreleases and news with large subsequent sentiment reversal(i.e., news which is “wrong” ex post). For press releases welink institutional trading with comprehensive news data fromPR Newswire and Business Wire. The sentiment of these pressreleases has a weak correlation of 0.03 with stock returns ascompared to a correlation between sentiment and returns of0.12 for other news stories. We use the Reuters written newsdata to construct the second hype proxy. Using both proxieswe find both qualitatively and quantitatively that institutionalorder flow shows no abnormal activity around these events.Thus, we find no evidence that institutions trade on newscontaining little information on fundamentals.
Several studies provide support to the notion thatinstitutions are informed. Badrinath, Kale, and Noe(1995) show that returns of stocks with high institu-tional ownership lead returns of stocks with lowinstitutional ownership. Sias and Starks (1997) andBoehmer and Kelley (2009) show that higher
institutional holdings are associated with more effi-cient pricing. Boehmer and Wu (2008) and Boulatov,Hendershott, and Livdan (2013) find that institutionaltrading predicts returns at the firm, industry, andmarket levels. Irvine, Lipson, and Puckett (2007) finda significant increase in institutional trading andprofitable buying beginning five days prior to thepublic release of analysts' initial reports containingpositive recommendations.
Campbell, Ramadorai, and Schwartz (2009) infer institu-tional trading by linking quarterly changes in institutionalholding from 13-F filings with daily trades by size categoryand a buy–sell classification algorithm. Their measure ofinstitutional trading predicts firms' earnings surprises as doesour institutional order flow measure. Campbell, Ramadorai,and Schwartz's (CRS) institutional order flow measure differsin some ways from ours on non-announcement days. Thelow-frequency component (half-life of 25 days) positivelypredicts returns whereas the high-frequency component(half-life of one day) negatively predicts returns. These areconsistent with institutional trading having a permanent anda temporary price impact. Our measure of institutional tradinghas only a permanent price impact. This difference is possiblydue to CRS needing to infer institutional trading. Overall, weextend CRS’ more fundamental point of institutions beinginformed about earnings news to other types of news.
In contrast, other studies of institutional trading aroundspecific public news events such as takeovers, earningsannouncements, and research recommendations find littleor no evidence that institutions are informed. Griffin, Shu,and Topaloglu (2012) use Nasdaq broker identifiers on tradesand clearing records to categorize trades likely made byinstitutions from 1997 to 2002. They examine daily tradingby eight types of individual and institutional investors aheadof the most common stock market events associated withinformation asymmetry: takeover and earnings announce-ments. They find that in the two, five, and ten days prior totakeover announcements, general institutional investors arenot net buyers in target firms and their buying is not related tofuture earnings announcement returns. They do report thathedge funds and investors trading through the largest invest-ment banks that service hedge funds are consistently sellingstocks prior to negative earnings announcements. Finally, theyfind little evidence that brokerage houses' proprietary tradingdesks or their clients buy prior to takeovers or trade in theright direction prior to earnings announcements.
Jegadeesh and Tang (2010) analyze trading patternsand profitability of institutional trades around takeoverannouncements using Ancerno's institutional clienttrade data from 1998 to 2008. They report that institu-tions on average are marginally net sellers of the targetsin the month prior to takeover announcements and thattheir trading strategy around the announcement doesnot yield significant abnormal returns. However, they dofind that institutions whose main brokers are also thebrokerage arms of investment banks advising the targetsare significant net buyers of target shares prior toannouncements. Using the same data, Busse, Green,and Jegadeesh (2012) examine the performance of buy-side institutional investor trades around sell-side analyststock recommendations. They find that institutions are

6 The TORQ data set provides a sample of the CAUD data.
T. Hendershott et al. / Journal of Financial Economics 117 (2015) 249–287252
not able to differentiate between good recommendationsand bad recommendations.5
Our findings along with Campbell, Ramadorai, andSchwartz (2009) suggest that using the broadest possible setof institutional trading data is important to uncover the linkbetween institutional trading and news. As Griffin, Shu, andTopaloglu (2012) discuss, the Ancerno data are less than tenpercent of the market. Historically, institutions trade five timesmore in NYSE than in Nasdaq stocks (Chan and Lakonishok,1997). This higher institutional activity could explain whyCampbell, Ramadorai, and Schwartz (2009) and we find evid-ence of institutions being informed while other studies do not.
Finally, our paper relates to a growing literature on howdifferent market participants respond to public news. Tetlock(2010) tests a theoretical model with asymmetric informationand public news. He finds evidence that news resolvesasymmetric information: news has a positive impact onvolume-induced return momentum and a temporary increasein the correlation between absolute returns and volume,particularly for earnings news and in small and illiquid stocks.
A separate strand of literature studies whether specifictypes of institutions such as mutual funds have stock-pickingskills prior to public news events. Mutual fund data have theadvantage of identifying individual funds and managers, butonly do so at monthly intervals. The institutional tradingliterature combines trading across many institutions at higherfrequencies. Baker, Litov, Wachter, and Wurgler (2010) exam-ine the earnings announcement returns of stocks that mutualfunds hold and trade. They find that the future earningsannouncement returns on stocks that funds buy are, onaverage, higher than the future returns on stocks that theysell. The stocks that funds buy perform significantly better atfuture earnings announcements than stocks with similarcharacteristics, while the stocks that funds sell performsignificantly worse than matching stocks. Fang, Peress, andZheng (2014) examine the propensity of mutual funds to tradehighmedia-coverage stocks. They find that funds with a lowerpropensity to trade high media-coverage stocks performsignificantly better. This finding is robust to different riskadjustment models and holds after controlling for other fundcharacteristics. Their result is consistent with the hypothesis(see Kacperczyk and Seru, 2007) that funds with informa-tional advantage trade less in stocks with media coverage.
Several papers examine the relationship between indivi-dual trading and news announcements. Kaniel, Liu, Saar, andTitman (2012) provide evidence in support of informed tradingby showing that intense aggregate individual investor buying(selling) predicts large positive (negative) abnormal returns onand after earnings announcement dates. Kelley and Tetlock(2013) use retail brokers' trading data from 2003 to 2007 toprovide support for the conclusions of Kaniel, Liu, Saar, andTitman (2012) that retail investors have some information for abroader set of news announcements. Kelley and Tetlock (2013)can separately identify market and limit orders and find thatmarket order imbalances predict both returns and news,whereas limit order imbalances predict returns but not news.
5 Choi and Sias (2012) find that accounting measures of firms'financial strength forecast future returns and future Ancerno institutionaltrading, which is consistent with institutions trading on accountinginformation associated with return predictability.
Short selling is another type of trading thought to beinformed (Senchack and Starks, 1993; Asquith, Pathak, andRitter, 2005; Boehmer, Jones, and Zhang, 2008; and others).Engelberg, Reed, and Ringgenberg (2012) combine data onshort selling with news releases to show that short sellers'trading advantage comes largely from their ability to analyzepublicly available information and not from being able toanticipate information before it becomes public. In contrast,we find that institutions overall are able to anticipate informa-tion before it becomes public news.
The remainder of the paper is organized as follows.Section 2 discusses the data sources and provides summarystatistics. Section 3 examines institutional trading volumearound news announcements. Section 4 analyzes whetherinstitutions are informed about the contents of the news.Section 5 investigates which specific type(s) of news institu-tions are informed about. Section 6 concludes.
2. Data
The data on trading by institutions are constructedfrom the NYSE's Consolidated Equity Audit Trail Data(CAUD) files, which contain detailed information on allorders that execute on the exchange. One of the fieldsassociated with the buyer and seller of each order, AccountType, specifies whether the order comes from an institu-tional investor. We exclude program trading and indexarbitrage trading because these order types are for tradingmultiple securities simultaneously and thus are less likelyrelated to news about individual stocks.6 We supplementthe CAUD data with daily data on returns (close-to-closereturns based on closing bid and ask quotes in Trade andQuote (TAQ)), trading volume from the Center for Researchin Security Prices (CRSP), and market capitalization (num-ber of shares outstanding times price from CRSP).
Our news data come from the Thomson Reuters NewsAnalytics (TRNA), which is a database of news releases onthe Reuters Data Feed (RDF). TRNA uses a neural network toconstruct measures of news sentiment each news storyreports. The analysis primarily is conducted at the sentencelevel. During the initial pre-processing stage firms men-tioned in each sentence are identified and then what is saidabout these firms is analyzed. Each word in a sentence isparsed into a sentence tree according to the correspondingpart of speech. The parts of speech are then fed into aneural network classifier. The neural network was trainedon several thousand randomly selected news stories whichwere tagged by three former traders. The neural networktries to incorporate the order of words, adjectives, andcommon phrases in finance. Sinha (2012) and Infonic(2008) provide further discussion of TRNA's text processing.
TRNA has several important differences from the populardictionary-based method for analyzing text.7 TRNA's text-
7 Tetlock, Saar-Tsechansky, and Macskassy (2008) use dictionary-based methods to count words based on a general Harvard psychosocialdictionary and Loughran and McDonald (2011) use a specialized financialdictionary. Heston and Sinha (2013) compare how well the TRNAsentiment and sentiment calculated from these dictionary approachesforecasts future returns.

T. Hendershott et al. / Journal of Financial Economics 117 (2015) 249–287 253
processing engine analyzes at the sentence level rather thanthe word level. Analyzing a document at the sentence level isbeneficial along a number of dimensions. The sentence-levelanalysis ensures that the word is analyzed in its context.Modifiers, e.g., negative construction, adjectives, or adverbs,alter the meaning of words. In addition, firms choose nameswhich dictionaries classify as positive. Every time the storyrefers to the firm's name, a pure dictionary approach countsa positive word. Finally, the sentence approach identifies thesentence's subject.
When a story mentions multiple firms, each sentence iscorrectly attributed to the corresponding firm. This is usedto determine different sentiment for different firms in thesame story. The relevance of the story for each firm isbased on comparing the number of mentions of a firm tothe total number of mentions of all firms in the story.
Each news story on the RDF typically consists of severalnews items. Each day we average the sentiment for eachstory and then construct a daily weighted average senti-ment across stories using the relevance measure as weights.News items are either a new alert or new story take, inwhich an alert is a single line of text and a story take has aheadline and body. A story take is one in a series of updatesto a particular story. Alternative schemes to aggregate newsitems to stories and, respectively, the stories on a news daydo not materially affect the results. To align the story dateswith prices, returns, and institutional trading, the dateassociated with each story is set using a cutoff of the NYSEclosing time of 4 pm Eastern time. Stories appearing after 4pm are given the following date.
Table 1 provides an overview of the different newstopics covered by the RDF in descending order based onthe total number of news days reported in the fourthcolumn. Statistics for the relevance-weighted news senti-ment are in columns five through nine. Reuters assignsstories to news categories describing the topic of the newscontent. The most frequent topics are directly related tocompanies and concern corporate results forecasts (RESF)with a total of 33,409 news days, corporate results (RES,32,054), corporate crises (CRISIS, 31,675), debt markets(DBT, 28,214), stock markets (STX, 27,543), major breakingnews (NEWS, 26,639), corporate bonds (USC, 25,091),mergers and acquisitions (MRG, 23,791), macro news(MACRO, 17,614), business activities (BACT, 16,786), corpo-rate analysis (CORA, 16,168), hot stocks (HOT, 14,541),regulation (REGS, 14,294), government policies (WASH,13,097), legislation (LAW, 11,217), fund industry news(FUND, 11,176), broker research and recommendations(RCH, 10,209), ratings (AAA, 9,549), new issues (ISU,9,406), job losses and unemployment (JOB, 8,776), andmanagement issues and policy (MNGISS, 7,346). Theremaining news releases comprise specific macroeconomicannouncements, government policies and politics, society,environment, and other financial market news.
We construct our sample by merging the CRSP, TRNA,and NYSE data from 2003 through 2005 and dropping asmall number of observations (0.51%) for which some dataare missing from one of the sources. There are a total of755 trading days in 1,667 stocks, yielding more than onemillion daily observations with complete data on stockreturn, trading volume, news, institutional trading, and all
control variables. Table 2, Panel A provides summarystatistics for the number of news releases and the dis-tribution of news stories across time and stocks. There area total of 126,148 days with news releases out of 1,096,514daily observations during our sample period. This impliesthat 11.5% of stocks have news releases on any given day,with 5.9% (17.6%) of stocks in the news at the lower(upper) 5% tail of days. Consistent with prior papers usingnews data, there is substantial cross-sectional variation innews coverage. The average firm has a 10.6% chance ofbeing covered in a news report. While the median firm hasa propensity of news coverage of once per month (4.6%),news coverage ranges from zero for the bottom 5% of firmsto 47.5% for the top 5% of firms.
Individual news stories can be relevant for one ormultiple firms. In order to distinguish firm-specific fromsectoral news, news items read from the RDF are scoredwith respect to companies that are mentioned in the articleto yield company-specific measures of relevance. The thirdrow in Table 2, Panel A shows that the average (median)number of firms mentioned in a news release is 7.2 (4).
The news sentiment measure used in this study isbased on the analysis of the NewsScope news text releasedon the RDF. The Reuters algorithm determines how posi-tive, neutral, or negative is the tone of the words used inthe article for each firm. Individual sentiment scores yieldthe positive, neutral, or negative sentiment score for thenews item, ranging between �1 and 1.
We compute the net sentiment of a news story as therelevance-weighted difference between the positive andnegative score for each news item. We then aggregate allnews stories on a given day by relevance weighting the story-specific sentiment to obtain the daily sentiment in each stock.The net sentiment is set to zero on days without news stories.The last row in Table 2, Panel A provides summary statisticsfor daily sentiment. Sentiment ranges between �0.726 and0.738 at 5% and 95%, respectively, with mean and medianclose to zero and a standard deviation of 0.421.
Institutional purchases, IBuysi;t , and sales, ISalesi;t ,aggregate all institutional buy and, correspondingly, selltransactions for a firm i on day t. These quantities are thennormalized by the firm's market capitalization, MC, laggedby one year, yielding
IBuysi;t ¼P Number of Buysi;t
n ¼ 1 Buysni;tMCi;t�250
;
ISalesi;t ¼P Number of Salesi;t
n ¼ 1 Salesni;tMCi;t�250
: ð1Þ
Institutional order flow, IOF, is the difference betweeninstitutional purchases, IBuys, and institutional sales,ISales. Institutional volume, IVol, is the sum of institutionalpurchases and sales.
Table 2, Panel B provides summary statistics for theinstitutional trading volume and order flow imbalancesacross stocks in our sample. Institutional order flowimbalances are positive on average, consistent with thesteady decline in direct individual stock ownership overtime. Institutional order flow imbalances are distributedsymmetrically around this mean, with significant negativeand positive days. This shows that despite the positive

Table 1Description of news categories.
The table provides a brief description of the major news categories related to individual stocks in the TRNA database. The sample contains all 1,667 NYSEstocks on news days from 2003 through 2005.
Topiccode
Newsdays
Sentiment
Topic Description Mean SD 5% 50% 95%
Corporate ResultsForecasts
RESF All forecasting of corporate financial results 33,409 �0.035 0.463 �0.754 �0.011 0.726
Corporate Results RES All corporate financial results; dividends, accounts, and annualreports
32,054 �0.012 0.433 �0.744 0.036 0.679
Corporate Crisis CRISIS All corporate crisis (composite of BKRT, MNGISS, JOB, CRIM,JUDIC, REGS, CDV, WEA)
31,675 �0.221 0.436 �0.762 �0.335 0.615
Debt Markets DBT All debt market news, including primary issuance, trading,market forecasts, and analysis
28,214 �0.025 0.463 �0.754 0.018 0.752
Stock Markets STX All news about equity markets operations, regulations andstructure, etc.
27,543 �0.002 0.331 �0.705 0.040 0.620
Major BreakingNews
NEWS Top stories of major international impact (likely to lead TV/radio/newspaper bulletins)
26,639 �0.134 0.475 �0.759 �0.222 0.711
US Corporate Bonds USC All news about US corporate bonds, including issues, forecasts,and analysis
25,091 �0.033 0.477 �0.756 0.004 0.756
Mergers andAcquisitions
MRG All corporate stories about change of ownership; stakes,mergers, acquisitions, buy-outs
23,791 0.197 0.474 �0.674 0.271 0.808
Macro News MACRO All macro news (composite of ECI, FED, GVD, MCE, WASH) 17,614 �0.189 0.441 �0.761 �0.271 0.653Business Activities BACT News relating to business activities 16,786 0.038 0.101 0.032 0.040 0.044Corporate Analysis CORA Analysis about a company or group of companies 16,168 0.039 0.059 0.032 0.040 0.043Hot Stocks HOT News about stocks “on the move” 14,541 �0.102 0.528 �0.762 �0.201 0.779Regulatory Issues REGS News about regulation 14,294 �0.261 0.431 �0.762 �0.400 0.596Washington/US
Govt. NewsWASH All US Federal government politics, policies, and economics 13,097 �0.232 0.432 �0.762 �0.352 0.595
Legislation LAW Legislation affecting budgets, securities laws, capital budgets,lawsuits, court rulings
11,217 �0.399 0.373 �0.763 �0.504 0.399
Fund Industry News FUND All news about investment trusts and funds industry; funds'views and forecasts
11,176 �0.029 0.491 �0.760 0.007 0.776
Broker Researchand Recom.
RCH All news about broker research and recommendations 10,209 0.008 0.579 �0.763 0.063 0.812
Ratings AAA All news about credit ratings 9,549 0.007 0.512 �0.758 0.059 0.792New Issues ISU All new government and corporate issues of debt and corporate
issues of equity9,406 0.113 0.381 �0.572 0.114 0.742
Labor; (Un)employment
JOB All news on labor issues; (un)employment, labor disputes,strikes, unions, etc.
8,776 �0.153 0.470 �0.761 �0.238 0.724
ManagementIssues/Policy
MNGISS Management issues including executive pay, bonuses,governance, accounting irregularity
7,346 �0.161 0.440 �0.762 �0.173 0.595
Domestic Politics POL All stories about national politics 6,481 �0.231 0.443 �0.762 �0.376 0.644Mortgage Backed
DebtMTG Asset-backed securities, mortgage-backed debt, and changes in
mortgage rates6,468 0.007 0.456 �0.753 0.041 0.772
Internet/WorldWide Web
WWW All news stories relating to the Internet or the World Wide Web 6,284 �0.035 0.489 �0.757 �0.004 0.762
Reuters ExclusiveNews
WIN Major news, exclusive to Reuters 5,463 0.029 0.477 �0.742 0.059 0.772
Derivatives DRV All news and market reports on derivatives, including futures,options, and swaps
5,452 �0.090 0.450 �0.756 �0.086 0.730
Press Digests PRESS Summaries of newspaper articles 4,882 �0.214 0.484 �0.763 �0.407 0.763Multi-Industry MUL All news on diversified companies, including holding
companies4,581 �0.018 0.498 �0.761 0.033 0.777
Loans LOA All types of loans to corporate entities and sovereign countries 4,418 �0.013 0.424 �0.751 0.061 0.702Crime, Law
EnforcementCRIM Civil and criminal law, corporate crime, fraud, murder,
criminals, mafia, etc.3,928 �0.460 0.347 �0.763 �0.531 0.342
Terms of BondIssues
TNC News about bond terms and conditions 3,844 0.084 0.285 �0.460 0.087 0.515
Interest Rates INT All news on interest rates and interest rate changes andforecasts; analysis of rate moves
3,814 �0.045 0.446 �0.741 �0.032 0.767
Government/Sovereign Debt
GVD All government debt market news, government borrowing, anddebt
3,689 �0.103 0.420 �0.754 �0.093 0.692
Dividends DIV Dividend forecasts, declarations, and payments 3,631 0.293 0.472 �0.718 0.449 0.811Judicial Processes/
Court CasesJUDIC All stories about judicial processes/court cases/court decisions 3,408 �0.459 0.335 �0.763 �0.512 0.282
Initial PublicOfferings
IPO First public listing of a company's stock 3,329 0.150 0.432 �0.638 0.189 0.793
Eurobonds EUB New eurobond issues, including issues by foreign borrowers indomestic markets
2,771 0.013 0.401 �0.730 0.070 0.707
CDV All news relating to credit default swaps 2,467 �0.195 0.496 �0.762 �0.324 0.745
T. Hendershott et al. / Journal of Financial Economics 117 (2015) 249–287254

Table 1 (continued )
Topiccode
Newsdays
Sentiment
Topic Description Mean SD 5% 50% 95%
Credit DefaultSwaps
Wholesale WHO Wholesaling and distribution, including wholesale priceindices
2,390 �0.017 0.472 �0.759 0.045 0.775
International Trade TRD All stories associated with international trade; protectionism,tariffs, sanctions, dumping
2,343 �0.165 0.482 �0.761 �0.284 0.726
Weather WEA All weather issues and reports; forecasts, statistics, warnings,etc.
2,236 �0.262 0.407 �0.760 �0.383 0.531
Bankruptcies BKRT Corporate insolvencies and bankruptcies, creditor protectionactions, court rulings, etc.
2,070 �0.353 0.416 �0.763 �0.497 0.538
Macro-Economics MCE All news and analysis on macroeconomics 1,918 �0.110 0.503 �0.761 �0.192 0.791Economic Indicators ECI News, forecasts, or analysis of economic indicators 1,814 �0.127 0.493 �0.762 �0.223 0.774US Agencies AGN All news about debt-issuing agencies such as Fannie Mae,
Freddie Mac, etc.1,810 �0.114 0.300 �0.634 �0.093 0.372
Forex Markets FRX All market stories about foreign exchange, forex interventionby central banks, etc.
1,738 �0.054 0.501 �0.760 �0.050 0.776
Investment GradeDebt
IGD News on debt classed as investment grade 1,642 �0.089 0.500 �0.761 �0.084 0.779
Diplomacy, Int.Relations
DIP Political relations between multiple countries; foreign policy bygovernments
1,618 �0.210 0.462 �0.762 �0.362 0.712
Money Markets MMT All money market news; reports about money markets 1,569 �0.089 0.319 �0.630 �0.054 0.414Disasters and
AccidentsDIS Natural and man-made disasters; major industrial accidents,
pollution disasters, etc.1,512 �0.300 0.393 �0.762 �0.443 0.425
Exchange Activities EXCA Stories about exchanges where securities or futures tradingtakes place
1,312 �0.061 0.467 �0.760 �0.009 0.733
Lifestyle LIF All news about lifestyles; lifestyles of people in the public eye 1,302 �0.079 0.439 �0.745 �0.048 0.680Civil Unrest VIO Stories about riots, demonstrations, and other internal
disturbances1,148 �0.354 0.410 �0.763 �0.498 0.528
High-Yield Debt HYD All news about bonds rated below BBB- or ratings actions onissuers below BBB-
1,059 �0.173 0.528 �0.763 �0.322 0.774
Federal ReserveBoard
FED FED activities and news 990 �0.197 0.453 �0.762 �0.269 0.677
(Inter)nationalSecurity
SECUR All stories about national and international security 902 �0.216 0.470 �0.762 �0.404 0.727
Short-Term InterestRates
STIR Short-term interest rates, typically for maturities up to twoyears
812 �0.187 0.412 �0.706 �0.294 0.765
Equity-LinkedBonds
EQB Equity-linked bonds, warrant bonds, or convertible bonds 745 0.104 0.387 �0.683 0.088 0.744
Asset-Backed Debt ABS All news about asset-backed debt, including credit cardreceivables and auto loans
698 0.159 0.460 �0.743 0.281 0.788
Reuters Summits RSUM News from Reuters industry summits 656 0.076 0.467 �0.703 0.086 0.798Human Interest ODD Unusual, offbeat, and curious stories 548 �0.151 0.442 �0.757 �0.237 0.651Muni and Agency
DebtREVS News about debt sold by state and local authorities and
agencies489 �0.082 0.508 �0.763 �0.022 0.787
Hedge Funds HEDGE News about private investment funds 313 0.059 0.533 �0.763 0.132 0.806Elections VOTE National, regional, local elections; manifestos, polling (relates
only to government)254 �0.266 0.445 �0.763 �0.455 0.670
Tax TAX All news about taxation rules and regulation, especially relatingto individuals
212 �0.145 0.492 �0.760 �0.291 0.767
Religion REL All matters relating to religion and religious institutions 180 �0.246 0.433 �0.757 �0.439 0.566Bombings BOMB All stories about bombings 67 �0.490 0.327 �0.763 �0.530 0.275Fiscal and Monetary
PolicyPLCY Statements by or stories about fiscal and monetary policy
makers67 �0.290 0.358 �0.763 �0.319 0.301
Editorial Specials FES Editorial special, analysis, and future stories 40 �0.039 0.504 �0.714 �0.122 0.793Errors ERR Errors 30 0.132 0.366 �0.479 0.133 0.675Investing INV All news about the process of investing on the part of
individuals24 0.191 0.494 �0.514 0.261 0.807
Retirement RTM All news about retirement, including financial regulation andindustry trends
13 �0.295 0.422 �0.761 �0.493 0.538
Technical Analysis INSI Stories about technical analysis of markets 8 0.066 0.477 �0.689 0.153 0.533Corporate Finance CFIN All news relating to corporate finance 5 �0.142 0.472 �0.660 �0.016 0.368Emerging Markets EM All news relating to emerging markets 4 0.085 0.602 �0.764 0.261 0.584Purchasing
ManagersIndices
PMI News coverage of any Purchasing Managers' Index ofmanufacturing and/or services
1 �0.478 0.000 �0.478 �0.478 �0.478
T. Hendershott et al. / Journal of Financial Economics 117 (2015) 249–287 255
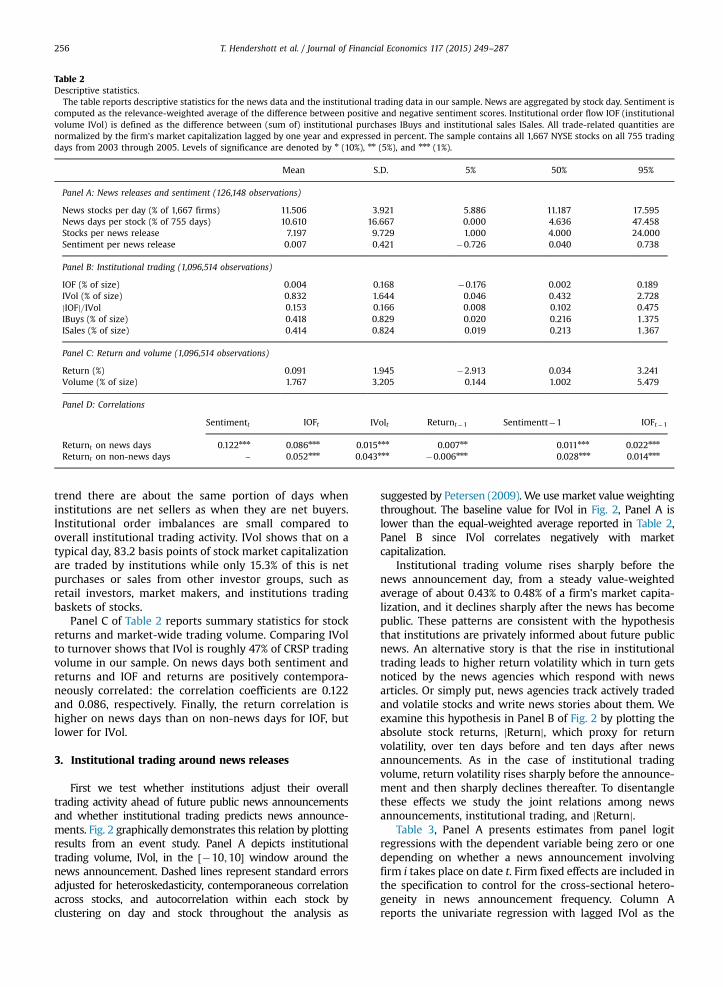
Table 2Descriptive statistics.
The table reports descriptive statistics for the news data and the institutional trading data in our sample. News are aggregated by stock day. Sentiment iscomputed as the relevance-weighted average of the difference between positive and negative sentiment scores. Institutional order flow IOF (institutionalvolume IVol) is defined as the difference between (sum of) institutional purchases IBuys and institutional sales ISales. All trade-related quantities arenormalized by the firm's market capitalization lagged by one year and expressed in percent. The sample contains all 1,667 NYSE stocks on all 755 tradingdays from 2003 through 2005. Levels of significance are denoted by n (10%), nn (5%), and nnn (1%).
Mean S.D. 5% 50% 95%
Panel A: News releases and sentiment (126,148 observations)
News stocks per day (% of 1,667 firms) 11.506 3.921 5.886 11.187 17.595News days per stock (% of 755 days) 10.610 16.667 0.000 4.636 47.458Stocks per news release 7.197 9.729 1.000 4.000 24.000Sentiment per news release 0.007 0.421 �0.726 0.040 0.738
Panel B: Institutional trading (1,096,514 observations)
IOF (% of size) 0.004 0.168 �0.176 0.002 0.189IVol (% of size) 0.832 1.644 0.046 0.432 2.728jIOFj=IVol 0.153 0.166 0.008 0.102 0.475IBuys (% of size) 0.418 0.829 0.020 0.216 1.375ISales (% of size) 0.414 0.824 0.019 0.213 1.367
Panel C: Return and volume (1,096,514 observations)
Return (%) 0.091 1.945 �2.913 0.034 3.241Volume (% of size) 1.767 3.205 0.144 1.002 5.479
Panel D: Correlations
Sentimentt IOFt IVolt Returnt�1 Sentimentt�1 IOFt�1
Returnt on news days 0.122nnn 0.086nnn 0.015nnn 0.007nn 0.011nnn 0.022nnn
Returnt on non-news days – 0.052nnn 0.043nnn �0.006nnn 0.028nnn 0.014nnn
T. Hendershott et al. / Journal of Financial Economics 117 (2015) 249–287256
trend there are about the same portion of days wheninstitutions are net sellers as when they are net buyers.Institutional order imbalances are small compared tooverall institutional trading activity. IVol shows that on atypical day, 83.2 basis points of stock market capitalizationare traded by institutions while only 15.3% of this is netpurchases or sales from other investor groups, such asretail investors, market makers, and institutions tradingbaskets of stocks.
Panel C of Table 2 reports summary statistics for stockreturns and market-wide trading volume. Comparing IVolto turnover shows that IVol is roughly 47% of CRSP tradingvolume in our sample. On news days both sentiment andreturns and IOF and returns are positively contempora-neously correlated: the correlation coefficients are 0.122and 0.086, respectively. Finally, the return correlation ishigher on news days than on non-news days for IOF, butlower for IVol.
3. Institutional trading around news releases
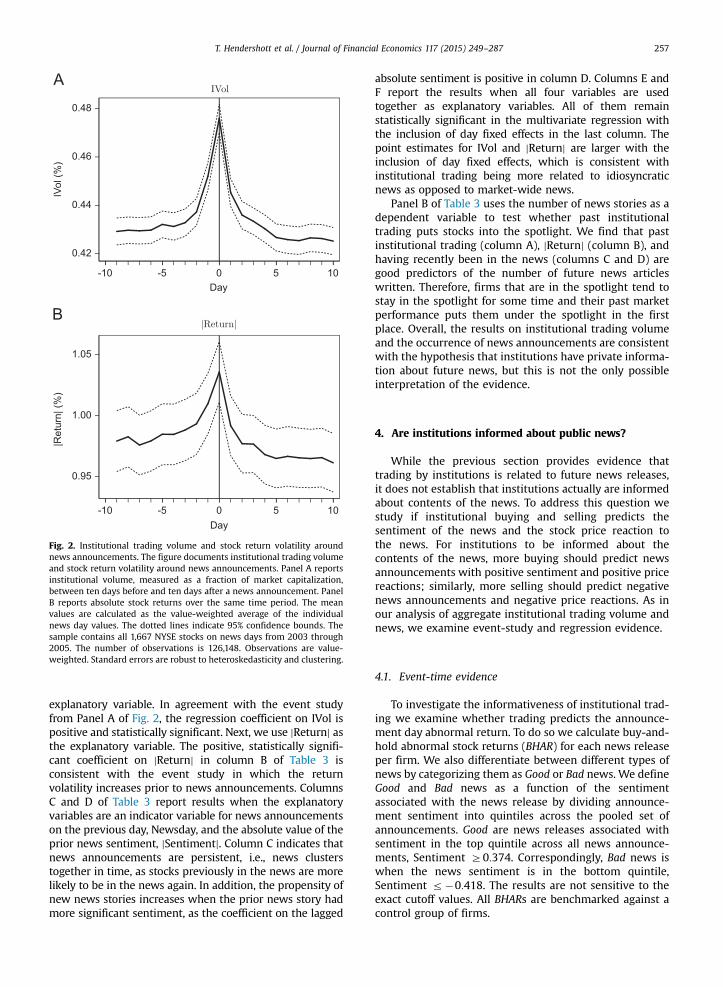
First we test whether institutions adjust their overalltrading activity ahead of future public news announcementsand whether institutional trading predicts news announce-ments. Fig. 2 graphically demonstrates this relation by plottingresults from an event study. Panel A depicts institutionaltrading volume, IVol, in the ½�10;10� window around thenews announcement. Dashed lines represent standard errorsadjusted for heteroskedasticity, contemporaneous correlationacross stocks, and autocorrelation within each stock byclustering on day and stock throughout the analysis as
suggested by Petersen (2009). We use market value weightingthroughout. The baseline value for IVol in Fig. 2, Panel A islower than the equal-weighted average reported in Table 2,Panel B since IVol correlates negatively with marketcapitalization.
Institutional trading volume rises sharply before thenews announcement day, from a steady value-weightedaverage of about 0.43% to 0.48% of a firm's market capita-lization, and it declines sharply after the news has becomepublic. These patterns are consistent with the hypothesisthat institutions are privately informed about future publicnews. An alternative story is that the rise in institutionaltrading leads to higher return volatility which in turn getsnoticed by the news agencies which respond with newsarticles. Or simply put, news agencies track actively tradedand volatile stocks and write news stories about them. Weexamine this hypothesis in Panel B of Fig. 2 by plotting theabsolute stock returns, jReturnj, which proxy for returnvolatility, over ten days before and ten days after newsannouncements. As in the case of institutional tradingvolume, return volatility rises sharply before the announce-ment and then sharply declines thereafter. To disentanglethese effects we study the joint relations among newsannouncements, institutional trading, and jReturnj.
Table 3, Panel A presents estimates from panel logitregressions with the dependent variable being zero or onedepending on whether a news announcement involvingfirm i takes place on date t. Firm fixed effects are included inthe specification to control for the cross-sectional hetero-geneity in news announcement frequency. Column Areports the univariate regression with lagged IVol as the
0.42
0.44
0.46
0.48
IVol
(%)
-10 -5 0 5 10Day
0.95
1.00
1.05
|Ret
urn|
(%)
-10 -5 0 5 10Day
Fig. 2. Institutional trading volume and stock return volatility aroundnews announcements. The figure documents institutional trading volumeand stock return volatility around news announcements. Panel A reportsinstitutional volume, measured as a fraction of market capitalization,between ten days before and ten days after a news announcement. PanelB reports absolute stock returns over the same time period. The meanvalues are calculated as the value-weighted average of the individualnews day values. The dotted lines indicate 95% confidence bounds. Thesample contains all 1,667 NYSE stocks on news days from 2003 through2005. The number of observations is 126,148. Observations are value-weighted. Standard errors are robust to heteroskedasticity and clustering.
T. Hendershott et al. / Journal of Financial Economics 117 (2015) 249–287 257
explanatory variable. In agreement with the event studyfrom Panel A of Fig. 2, the regression coefficient on IVol ispositive and statistically significant. Next, we use jReturnj asthe explanatory variable. The positive, statistically signifi-cant coefficient on jReturnj in column B of Table 3 isconsistent with the event study in which the returnvolatility increases prior to news announcements. ColumnsC and D of Table 3 report results when the explanatoryvariables are an indicator variable for news announcementson the previous day, Newsday, and the absolute value of theprior news sentiment, jSentimentj. Column C indicates thatnews announcements are persistent, i.e., news clusterstogether in time, as stocks previously in the news are morelikely to be in the news again. In addition, the propensity ofnew news stories increases when the prior news story hadmore significant sentiment, as the coefficient on the lagged
absolute sentiment is positive in column D. Columns E andF report the results when all four variables are usedtogether as explanatory variables. All of them remainstatistically significant in the multivariate regression withthe inclusion of day fixed effects in the last column. Thepoint estimates for IVol and jReturnj are larger with theinclusion of day fixed effects, which is consistent withinstitutional trading being more related to idiosyncraticnews as opposed to market-wide news.
Panel B of Table 3 uses the number of news stories as adependent variable to test whether past institutionaltrading puts stocks into the spotlight. We find that pastinstitutional trading (column A), jReturnj (column B), andhaving recently been in the news (columns C and D) aregood predictors of the number of future news articleswritten. Therefore, firms that are in the spotlight tend tostay in the spotlight for some time and their past marketperformance puts them under the spotlight in the firstplace. Overall, the results on institutional trading volumeand the occurrence of news announcements are consistentwith the hypothesis that institutions have private informa-tion about future news, but this is not the only possibleinterpretation of the evidence.
4. Are institutions informed about public news?
While the previous section provides evidence thattrading by institutions is related to future news releases,it does not establish that institutions actually are informedabout contents of the news. To address this question westudy if institutional buying and selling predicts thesentiment of the news and the stock price reaction tothe news. For institutions to be informed about thecontents of the news, more buying should predict newsannouncements with positive sentiment and positive pricereactions; similarly, more selling should predict negativenews announcements and negative price reactions. As inour analysis of aggregate institutional trading volume andnews, we examine event-study and regression evidence.
4.1. Event-time evidence
To investigate the informativeness of institutional trad-ing we examine whether trading predicts the announce-ment day abnormal return. To do so we calculate buy-and-hold abnormal stock returns (BHAR) for each news releaseper firm. We also differentiate between different types ofnews by categorizing them as Good or Bad news. We defineGood and Bad news as a function of the sentimentassociated with the news release by dividing announce-ment sentiment into quintiles across the pooled set ofannouncements. Good are news releases associated withsentiment in the top quintile across all news announce-ments, Sentiment Z0:374. Correspondingly, Bad news iswhen the news sentiment is in the bottom quintile,Sentiment r�0:418. The results are not sensitive to theexact cutoff values. All BHARs are benchmarked against acontrol group of firms.
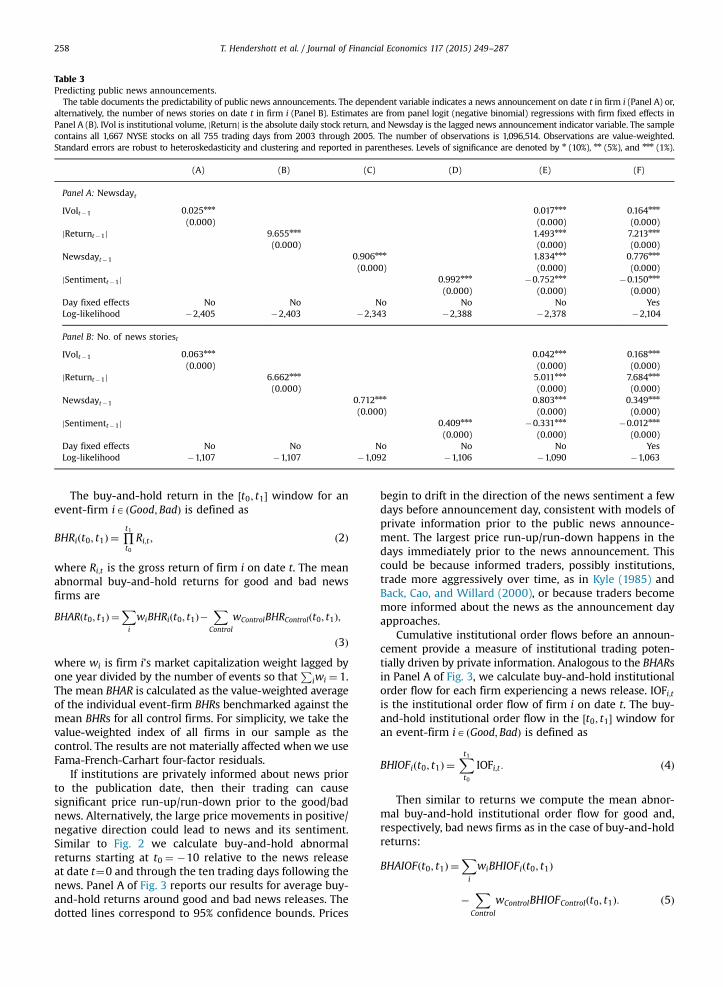
Table 3Predicting public news announcements.
The table documents the predictability of public news announcements. The dependent variable indicates a news announcement on date t in firm i (Panel A) or,alternatively, the number of news stories on date t in firm i (Panel B). Estimates are from panel logit (negative binomial) regressions with firm fixed effects inPanel A (B). IVol is institutional volume, jReturnj is the absolute daily stock return, and Newsday is the lagged news announcement indicator variable. The samplecontains all 1,667 NYSE stocks on all 755 trading days from 2003 through 2005. The number of observations is 1,096,514. Observations are value-weighted.Standard errors are robust to heteroskedasticity and clustering and reported in parentheses. Levels of significance are denoted by n (10%), nn (5%), and nnn (1%).
(A) (B) (C) (D) (E) (F)
Panel A: Newsdayt
IVolt�1 0.025nnn 0.017nnn 0.164nnn
(0.000) (0.000) (0.000)jReturnt�1j 9.655nnn 1.493nnn 7.213nnn
(0.000) (0.000) (0.000)Newsdayt�1 0.906nnn 1.834nnn 0.776nnn
(0.000) (0.000) (0.000)jSentimentt�1j 0.992nnn �0.752nnn �0.150nnn
(0.000) (0.000) (0.000)Day fixed effects No No No No No YesLog-likelihood �2,405 �2,403 �2,343 �2,388 �2,378 �2,104
Panel B: No: of news storiest
IVolt�1 0.063nnn 0.042nnn 0.168nnn
(0.000) (0.000) (0.000)jReturnt�1j 6.662nnn 5.011nnn 7.684nnn
(0.000) (0.000) (0.000)Newsdayt�1 0.712nnn 0.803nnn 0.349nnn
(0.000) (0.000) (0.000)jSentimentt�1j 0.409nnn �0.331nnn �0.012nnn
(0.000) (0.000) (0.000)Day fixed effects No No No No No YesLog-likelihood �1,107 �1,107 �1,092 �1,106 �1,090 �1,063
T. Hendershott et al. / Journal of Financial Economics 117 (2015) 249–287258
The buy-and-hold return in the ½t0; t1� window for anevent-firm iA ðGood;BadÞ is defined as
BHRiðt0; t1Þ ¼ ∏t1
t0Ri;t ; ð2Þ
where Ri;t is the gross return of firm i on date t. The meanabnormal buy-and-hold returns for good and bad newsfirms are
BHARðt0; t1Þ ¼Xi
wiBHRiðt0; t1Þ�X
Control
wControlBHRControlðt0; t1Þ;
ð3Þwhere wi is firm i's market capitalization weight lagged byone year divided by the number of events so that
Piwi ¼ 1.
The mean BHAR is calculated as the value-weighted averageof the individual event-firm BHRs benchmarked against themean BHRs for all control firms. For simplicity, we take thevalue-weighted index of all firms in our sample as thecontrol. The results are not materially affected whenwe useFama-French-Carhart four-factor residuals.
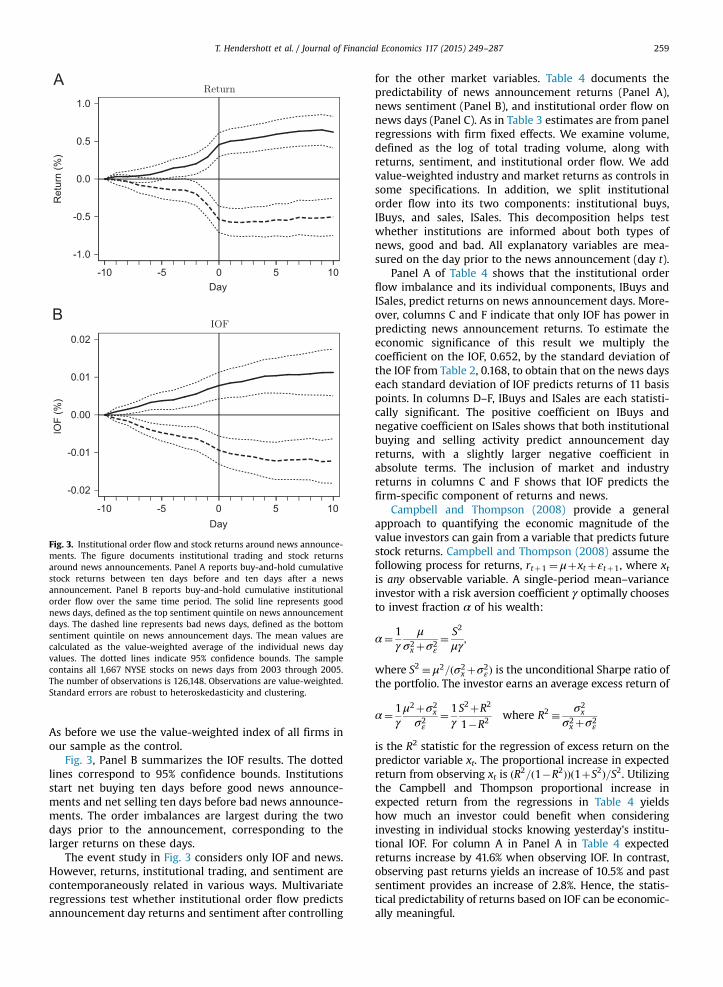
If institutions are privately informed about news priorto the publication date, then their trading can causesignificant price run-up/run-down prior to the good/badnews. Alternatively, the large price movements in positive/negative direction could lead to news and its sentiment.Similar to Fig. 2 we calculate buy-and-hold abnormalreturns starting at t0 ¼ �10 relative to the news releaseat date t¼0 and through the ten trading days following thenews. Panel A of Fig. 3 reports our results for average buy-and-hold returns around good and bad news releases. Thedotted lines correspond to 95% confidence bounds. Prices
begin to drift in the direction of the news sentiment a fewdays before announcement day, consistent with models ofprivate information prior to the public news announce-ment. The largest price run-up/run-down happens in thedays immediately prior to the news announcement. Thiscould be because informed traders, possibly institutions,trade more aggressively over time, as in Kyle (1985) andBack, Cao, and Willard (2000), or because traders becomemore informed about the news as the announcement dayapproaches.
Cumulative institutional order flows before an announ-cement provide a measure of institutional trading poten-tially driven by private information. Analogous to the BHARsin Panel A of Fig. 3, we calculate buy-and-hold institutionalorder flow for each firm experiencing a news release. IOFi;tis the institutional order flow of firm i on date t. The buy-and-hold institutional order flow in the ½t0; t1� window foran event-firm iAðGood;BadÞ is defined as
BHIOFiðt0; t1Þ ¼Xt1t0
IOFi;t : ð4Þ
Then similar to returns we compute the mean abnor-mal buy-and-hold institutional order flow for good and,respectively, bad news firms as in the case of buy-and-holdreturns:
BHAIOFðt0; t1Þ ¼Xi
wiBHIOFiðt0; t1Þ
�X
Control
wControlBHIOFControlðt0; t1Þ: ð5Þ
-1.0
-0.5
0.0
0.5
1.0
Ret
urn
(%)
-10 -5 0 5 10Day
-0.02
-0.01
0.00
0.01
0.02
IOF
(%)
-10 -5 0 5 10Day
Fig. 3. Institutional order flow and stock returns around news announce-ments. The figure documents institutional trading and stock returnsaround news announcements. Panel A reports buy-and-hold cumulativestock returns between ten days before and ten days after a newsannouncement. Panel B reports buy-and-hold cumulative institutionalorder flow over the same time period. The solid line represents goodnews days, defined as the top sentiment quintile on news announcementdays. The dashed line represents bad news days, defined as the bottomsentiment quintile on news announcement days. The mean values arecalculated as the value-weighted average of the individual news dayvalues. The dotted lines indicate 95% confidence bounds. The samplecontains all 1,667 NYSE stocks on news days from 2003 through 2005.The number of observations is 126,148. Observations are value-weighted.Standard errors are robust to heteroskedasticity and clustering.
T. Hendershott et al. / Journal of Financial Economics 117 (2015) 249–287 259
As before we use the value-weighted index of all firms inour sample as the control.
Fig. 3, Panel B summarizes the IOF results. The dottedlines correspond to 95% confidence bounds. Institutionsstart net buying ten days before good news announce-ments and net selling ten days before bad news announce-ments. The order imbalances are largest during the twodays prior to the announcement, corresponding to thelarger returns on these days.
The event study in Fig. 3 considers only IOF and news.However, returns, institutional trading, and sentiment arecontemporaneously related in various ways. Multivariateregressions test whether institutional order flow predictsannouncement day returns and sentiment after controlling
for the other market variables. Table 4 documents thepredictability of news announcement returns (Panel A),news sentiment (Panel B), and institutional order flow onnews days (Panel C). As in Table 3 estimates are from panelregressions with firm fixed effects. We examine volume,defined as the log of total trading volume, along withreturns, sentiment, and institutional order flow. We addvalue-weighted industry and market returns as controls insome specifications. In addition, we split institutionalorder flow into its two components: institutional buys,IBuys, and sales, ISales. This decomposition helps testwhether institutions are informed about both types ofnews, good and bad. All explanatory variables are mea-sured on the day prior to the news announcement (day t).
Panel A of Table 4 shows that the institutional orderflow imbalance and its individual components, IBuys andISales, predict returns on news announcement days. More-over, columns C and F indicate that only IOF has power inpredicting news announcement returns. To estimate theeconomic significance of this result we multiply thecoefficient on the IOF, 0.652, by the standard deviation ofthe IOF from Table 2, 0.168, to obtain that on the news dayseach standard deviation of IOF predicts returns of 11 basispoints. In columns D–F, IBuys and ISales are each statisti-cally significant. The positive coefficient on IBuys andnegative coefficient on ISales shows that both institutionalbuying and selling activity predict announcement dayreturns, with a slightly larger negative coefficient inabsolute terms. The inclusion of market and industryreturns in columns C and F shows that IOF predicts thefirm-specific component of returns and news.
Campbell and Thompson (2008) provide a generalapproach to quantifying the economic magnitude of thevalue investors can gain from a variable that predicts futurestock returns. Campbell and Thompson (2008) assume thefollowing process for returns, rtþ1 ¼ μþxtþεtþ1, where xtis any observable variable. A single-period mean–varianceinvestor with a risk aversion coefficient γ optimally choosesto invest fraction α of his wealth:
α¼ 1γ
μσ2x þσ2
ε¼ S2
μγ;
where S2 � μ2=ðσ2x þσ2
εÞ is the unconditional Sharpe ratio ofthe portfolio. The investor earns an average excess return of
α¼ 1γμ2þσ2
x
σ2ε
¼ 1γS2þR2
1�R2 where R2 � σ2x
σ2x þσ2
ε
is the R2 statistic for the regression of excess return on thepredictor variable xt. The proportional increase in expectedreturn from observing xt is ðR2=ð1�R2ÞÞð1þS2Þ=S2. Utilizingthe Campbell and Thompson proportional increase inexpected return from the regressions in Table 4 yieldshow much an investor could benefit when consideringinvesting in individual stocks knowing yesterday's institu-tional IOF. For column A in Panel A in Table 4 expectedreturns increase by 41.6% when observing IOF. In contrast,observing past returns yields an increase of 10.5% and pastsentiment provides an increase of 2.8%. Hence, the statis-tical predictability of returns based on IOF can be economic-ally meaningful.

Table 4Returns, news sentiment, and institutional trading on announcement days.
The table documents the predictability of news announcement returns (Panel A), news sentiment (Panel B), and institutional order flow (Panel C) onnews announcement days. Estimates are from panel regressions with firm fixed effects. IOF denotes institutional order flow, IBuys (ISales) are institutionalpurchases (sales), Return is the daily stock return, Sentiment is the news sentiment, Volume is the log of total trading volume, Industry return is the value-weighted industry return (using Fama-French industry classifications) excluding the company's stock, and Market return is the value-weighted marketreturn excluding the company's stock. All explanatory variables are measured on the day prior to the news announcement, except for industry return andmarket return. The sample contains all 1,667 NYSE stocks on news days from 2003 through 2005. The number of observations is 126,148. Observations arevalue-weighted. Standard errors are robust to heteroskedasticity and clustering and reported in parentheses. Levels of significance are denoted by n (10%),nn (5%), and nnn (1%).
(A) (B) (C) (D) (E) (F)
Panel A: Returnt
IOFt�1 0.652nnn 0.693nnn 0.541nnn
(0.170) (0.184) (0.114)IBuyst�1 0.632nnn 0.668nnn 0.518nnn
(0.170) (0.184) (0.112)ISalest�1 �0.693nnn �0.731nnn �0.575nnn
(0.173) (0.186) (0.117)Returnt�1 �0.015 0.002 �0.015 0.002
(0.014) (0.007) (0.014) (0.007)Sentimentt�1 0.034 0.037n 0.034 0.037n
(0.023) (0.022) (0.023) (0.022)Volumet�1 �0.024 �0.004 0.001 0.018
(0.030) (0.010) (0.036) (0.013)Industry returnt 0.715nnn 0.715nnn
(0.075) (0.075)Market returnt 0.266nnn 0.266nnn
(0.073) (0.073)F-statistic 54.801 16.548 2,599.178 30.684 15.003 2,231.099
Panel B: Sentimentt
IOFt�1 0.079nnn 0.052nn 0.052nn
(0.022) (0.022) (0.022)IBuyst�1 0.071nnn 0.046nn 0.046nn
(0.022) (0.022) (0.022)ISalest�1 �0.095nnn �0.061nnn �0.061nnn
(0.023) (0.023) (0.023)Returnt�1 0.009nnn 0.009nnn 0.009nnn 0.008nnn
(0.001) (0.001) (0.001) (0.001)Sentimentt�1 0.167nnn 0.167nnn 0.167nnn 0.167nnn
(0.011) (0.011) (0.011) (0.011)Volumet�1 �0.013n �0.012n �0.007 �0.007
(0.007) (0.007) (0.009) (0.009)Industry returnt 0.016nnn 0.016nnn
(0.003) (0.003)Market returnt �0.011nnn �0.011nnn
(0.004) (0.004)F-statistic 18.630 186.550 128.282 40.457 162.233 119.292
Panel C: IOFt
IOFt�1 0.257nnn 0.247nnn 0.249nnn
(0.011) (0.011) (0.010)IBuyst�1 0.259nnn 0.250nnn 0.252nnn
(0.011) (0.011) (0.010)ISalest�1 �0.254nnn �0.244nnn �0.246nnn
(0.011) (0.011) (0.011)Returnt�1 0.004nnn 0.004nnn 0.004nnn 0.004nnn
(0.000) (0.000) (0.000) (0.000)Sentimentt�1 �0.001nn �0.001nn �0.001nn �0.001nn
(0.000) (0.000) (0.000) (0.000)Volumet�1 0.002nn 0.002nn �0.001 �0.001
(0.001) (0.001) (0.001) (0.001)Industry returnt 0.001nnn 0.001nnn
(0.000) (0.000)Market returnt �0.011nnn �0.011nnn
(0.001) (0.001)F-statistic 1,056.978 521.733 742.059 546.570 424.529 642.768
T. Hendershott et al. / Journal of Financial Economics 117 (2015) 249–287260

T. Hendershott et al. / Journal of Financial Economics 117 (2015) 249–287 261
Table A1 in the Appendix provides the specificationsused in columns B and E in Table 4 for industries and themarket. We use value-weighted aggregates for the 12Fama-French industries and, respectively, the market. Theresults show support for institutions being informed, ontop of firm-specific news, about industry returns andindustry-wide news sentiment. However, Table A1 findslittle support for institutions being informed aboutmarket-wide news. Market-wide news is further studiedbelow in the context of macroeconomic news stories.
Panel B of Table 4 shows that IOF, IBuys, and ISalespredict news sentiment. A possible alternative explanationfor why IOF predicts the announcement day sentiment isthat news agencies communicate with institutions, learnabout institutions' trading, and interpret the direction ofinstitutions' trading as information. Related issues couldlead to sentiment being persistent as well as sentimentresponding positively to past returns; i.e., higher returns inthe past predict higher future sentiment. To find evidenceconsistent with institutions being privately informed,Section 5.3 examines earnings announcements using onlythe announced earnings and not sentiment.
Panel C of Table 4 shows persistence in IOF as well as itsindividual components. This is consistent with institutionsspreading their trades over time, as predicted by Kyle(1985). It also indicates that institutions follow momen-tum strategies around news announcements as institu-tions increase purchases of past winners and sell more ofpast losers.
As a robustness check, in the Appendix we use the Table 4specification on portfolios sorted based on several character-istics: (i) size, reported in Table A2; (ii) number of analystsfollowing the firm, reported in Table A3; (iii) number of firmsaffected by news, reported in Table A4; (iv) Gompers, Ishii,and Metrick (GIM) governance index, reported in Table A5;and (v) Fama-French 12 industry portfolios, reported in TableA6. We find similar results in all these cases, though we lackstatistical power in some of the specifications. The positivecoefficients on IOF predicting returns and sentiment, respec-tively, are largest for firms with large market capitalization,many analysts, weak governance (high GIM index), and whenmany firms are mentioned in the news story. This evidencesuggests that institutions are informed about news in stockswith a wide variety of characteristics and informationenvironments.
Overall, we find that institutions trade in the rightdirection before a news announcement. IOF and IBuyspredict positive announcement returns, positive senti-ment, and more institutional buying on news days. ISalespredicts negative announcement returns, negative senti-ment, and more selling on news days.
4.2. Calendar-time evidence
Using the same institutional data, Boehmer and Wu(2008) and Boulatov, Hendershott, and Livdan (2013) findthat institutional trading predicts returns. It is possiblethat institutions are informed about future price move-ments that are unrelated to news. To test whether IOFpredicts returns more on news days we extend the returnpanel regressions with firm fixed effects in Panel A of
Table 4 in two ways. First, we include all days in oursample period rather than just news days. Second, weinteract the lagged (day t�1) explanatory variables withthe dummy variable for news on day t. These enable theseparate measurement of forecasting day t returns onnews and non-news days and facilitate comparisonacross days.
Column A in Table 5 shows that lagged IOF predictsreturns on average days. The coefficient on IOF in Table 5 issubstantially smaller than the comparable coefficient inTable 4, which would arise if IOF offers additional predict-ability of returns on days with news. The news day variableinteracted with IOF, IOFnNewsday, examines this directly.The coefficients on both IOF and IOFnNewsday are statisti-cally significantly different from zero. Furthermore, thecoefficient on IOFnNewsday tends to be larger than thecoefficient on IOF, implying that the same amount of IOFpredicts returns at least twice as large on news days ascompared to non-news days. As with Table 4, to explore theeconomic significance of this difference we multiply thecoefficient on the IOF, 0.259, by the standard deviation ofIOF from Table 2, 0.168, to obtain that on non-news days astandard deviation of IOF predicts returns of 4.4 basis points.The coefficient on the interaction term IOFnNewsday, 0.381,multiplied by the standard deviation of the IOF is equal to 6.4basis points. Adding the additional 6.4 news-day effect to theoverall 4.4 effect shows that IOF predicts returns more thandouble on news days relative to days without news.
Similar to the extended specifications in Table 4, col-umns B–F in Table 5 incorporate additional variables intothe return predictability regression, utilize Fama-French-Carhart four-factor model-adjusted returns, and separateIOF into IBuys and ISales. All columns in Table 5 show thatthe institutional order flow imbalance and its individualcomponents, IBuys and ISales, predict returns on bothnon-news and news days and that the predictabilityappears greater on news days.
Consistent with prior work, e.g., Tetlock (2007), col-umns B–F in Table 5 also show that sentiment positivelypredicts returns on average days. In contrast, the coeffi-cient on sentiment in Table 4 is positive, but not statisti-cally significant. The coefficient on sentimentnNewsday isnegative, but not statistically significant. The sum of thecoefficients on sentiment and sentimentnNewsday is posi-tive, but not statistically significant, consistent withTable 4. Thus, we find evidence that sentiment predictsreturns on non-news days, but not on news days.
Up to this point all regression analysis examines therelation of news and institutional trading across consecu-tive days. Dynamics at longer lags or the lagged andcontemporaneous relations between news sentiment andinstitutional trading could lead to our findings thus farwithout institutions being informed about the news. Forexample, if sentiment predicts IOF the next day and thenreturns the day after that, our specifications using only onelag would find an association between returns and laggedIOF, which may not be associated with institutions beinginformed. Similarly, sentiment earlier in the trading daycould lead to IOF later that same day through institutionsinterpreting news and trading on their posterior estimateof value. Another possibility is that institutional trading is

Table 5Returns, news sentiment, and institutional trading.
The table documents the predictability of stock returns. Estimates are from panel regressions with firm fixed effects. IOF denotes institutional order flow,IBuys (ISales) are institutional purchases (sales), Return is the daily stock return, ReturnFF4 is the Fama-French-Carhart four-factor model-adjusted return,Sentiment is the news sentiment, and Volume is the log of total trading volume. Newsday is the contemporaneous news announcement indicator variable.All explanatory variables are lagged by one day, except for Newsday. The sample contains all 1,667 NYSE stocks on all 755 trading days from 2003 through2005. The number of observations is 1,096,514. Observations are value-weighted. Standard errors are robust to heteroskedasticity and clustering andreported in parentheses. Levels of significance are denoted by n (10%), nn (5%), and nnn (1%).
Returnt Returnt ReturnFF4t
Returnt Returnt ReturnFF4t
(A) (B) (C) (D) (E) (F)
IOFt�1 0.259nnn 0.288nnn 0.222nnn
(0.050) (0.061) (0.025)IOFt�1nNewsdayt 0.381nnn 0.398nnn 0.209nn
(0.144) (0.153) (0.090)IBuyst�1 0.254nnn 0.288nnn 0.218nnn
(0.051) (0.062) (0.025)IBuyst�1nNewsdayt 0.376nnn 0.375nn 0.195nn
(0.144) (0.152) (0.090)ISalest�1 �0.268nnn �0.288nnn �0.228nnn
(0.050) (0.061) (0.026)ISalest�1nNewsdayt �0.393nnn �0.431nnn �0.228nn
(0.146) (0.154) (0.093)Returnt�1 �0.019 �0.011nnn �0.019 �0.011nnn
(0.013) (0.003) (0.013) (0.003)Returnt�1nNewsdayt 0.005 0.020nnn 0.005 0.020nnn
(0.008) (0.007) (0.008) (0.007)Sentimentt�1 0.079nnn 0.061nnn 0.080nnn 0.061nnn
(0.022) (0.016) (0.022) (0.016)Sentimentt�1nNewsdayt �0.046 �0.022 �0.046 �0.022
(0.032) (0.026) (0.032) (0.026)Volumet�1 �0.012 0.018nn �0.012 0.022nn
(0.026) (0.008) (0.031) (0.011)Volumet�1nNewsdayt 0.008 �0.007 0.032 0.007
(0.015) (0.011) (0.021) (0.015)Newsdayt 0.015 0.015 0.021nn 0.021 0.035 0.033nnn
(0.021) (0.020) (0.009) (0.022) (0.022) (0.011)F-statistic 58.989 28.845 24.010 36.246 24.158 19.917
T. Hendershott et al. / Journal of Financial Economics 117 (2015) 249–287262
positively autocorrelated, has a positive price impact, andcauses subsequent news. In this case institutional tradingmay not predict returns beyond predicting future institu-tional trading's impact on price.
To test the robustness of our interpretation of theregression results in Tables 4 and 5, we next explicitlyaccount for the contemporaneous and lagged relationsamong returns, news sentiment, and institutional tradingusing panel vector autoregressions (VARs). By using addi-tional lags the VAR can control for more complex dynamicrelations among the variables. Examining the impulseresponse functions associated with the VAR enables us totest for the responses of the variables to innovations in theother variables. The impulse responses can also be calcu-lated while eliminating/orthogonalizing contemporaneousinnovations in the variables. These allow testing of theimpact of an innovation in IOF under the most conserva-tive assumptions.
For each firm i and time t we combine three variablesinto a 3�1 vector yit , yit ¼ ðIOFit ;Returnit ; SentimentitÞ0.Following Holtz-Eakin, Newey, and Rosen (1988), we allowthe individual components of yit to be autocorrelated andjointly endogenously determined by specifying
yit ¼αiþXLl ¼ 1
λlyit� lþεit ; ð6Þ
where αi is a 3�1 vector of firm-specific intercepts,λl; l¼ 1;…; L, are 3�3 coefficient matrices, and εit is a3�1 vector of innovations.
The main advantage of the specification (6) is that itallows us to relax the “pooling” constraint that the timeseries relationship of IOFit, Returnit, and Sentimentit is thesame for each firm. One way to relax this constraint is toallow for an intercept αi in Eq. (6) that varies across firms.Changes in the intercept of a stationary VAR correspond tochanges in the means of IOFit, Returnit, and Sentimentit. Wedo not use a time-varying intercept, as making the intercepttime dependent is most useful when the time series isshort. We have 756 observations per firm. Furthermore, wekeep the stationarity constraint in Eq. (6) because all threecomponents of the vector y are stationary. In addition, weallow for individual heterogeneity by making the varianceof the innovations in Eq. (6) heteroskedastic across firms.Changes in the innovation variance of a VAR translate intochanges in the variance of the variables, so that allowing forcross-sectional heteroskedasticity in the innovation var-iance allows for individual heterogeneity in the variabilityof IOFit, Returnit, and Sentimentit.
The firm fixed effects αi in Eq. (6) are correlated with theregressors due to lags of the dependent variables, leading tobiased ordinary least squares (OLS) estimates. However, thespecification of Eq. (6) as a projection equation implies thatthe error term εit satisfies the orthogonality conditions

Table 6Vector autoregressions of returns, news sentiment, and institutionaltrading.
The table reports estimates from panel vector autoregressions (6) withfirm fixed effects. The estimates are obtained using system GMMestimation as described in Section 4.2. The dependent variables areinstitutional order flow (IOF), stock returns, and news sentiment. Weset the lag length L¼3 that minimizes the Bayesian information criterion(BIC) and Akaike information criterion (AIC). The VAR diagnostics in PanelB report the BIC, AIC, mean-squared error (MSE), and residual auto- andcross-correlations. The sample contains all 1,667 NYSE stocks on all 755trading days from 2003 through 2005. The number of observations is1,096,514. Standard errors are reported in parentheses. Levels of sig-nificance are denoted by n (10%), nn (5%), and nnn (1%).
IOFt Returnt Sentimentt
Panel A: Estimates
IOFt�1 0.236nnn 0.171nnn 0.002nn
(0.008) (0.017) (0.001)IOFt�2 0.065nnn 0.041nn �0.001
(0.006) (0.016) (0.001)IOFt�3 0.055nnn �0.022 0.002nn
(0.005) (0.015) (0.001)Returnt�1 0.003nnn �0.005nnn 0.001nnn
(0.000) (0.001) (0.000)Returnt�2 0.000nnn �0.002 0.000
(0.000) (0.001) (0.000)Returnt�3 �0.001nnn �0.004nnn 0.000
(0.000) (0.001) (0.000)Sentimentt�1 0.001 0.093nnn 0.100nnn
(0.001) (0.014) (0.002)Sentimentt�2 �0.001 0.020 0.028nnn
(0.001) (0.013) (0.002)Sentimentt�3 �0.001 0.005 0.033nnn
(0.001) (0.013) (0.002)
Panel B: Diagnostics
AIC/BIC �6.264/�6.264MSE 0.161 1.943 0.140Residual auto-correlation 0.001 �0.001 0.007nnn
Residual cross-correlation:IOFt 0.056nnn 0.001Returnt 0.050nnn
T. Hendershott et al. / Journal of Financial Economics 117 (2015) 249–287 263
E½yisεit � ¼ E½αiεit � ¼ 0 for sot. These orthogonality condi-tions imply that lagged values of y qualify as instrumentalvariables for Eq. (6). In order to use the orthogonalityconditions to identify the parameters of Eq. (6), we mustdeal with the presence of the unobserved individual effect, αi.It is well known that in models with lagged dependentvariables it is inappropriate to treat individual fixed effectsas constants to be estimated. Therefore, we apply the forwardorthogonal deviations transformation, or Helmert transform,as in Arellano and Bover (1995), in Eq. (6) to eliminateindividual fixed effects. This transformation preserves theorthogonality between transformed error terms and laggedregressors, so we can continue to use lagged regressors asinstruments.
Letyn
it ¼ ððT�tÞ=ðT�tþ1ÞÞ1=2ðyit�ð1=ðT�tÞÞPTs ¼ tþ1 yisÞ be
the forward orthogonal deviation of yit . Then (6) reducesto
yn
it ¼XLl ¼ 1
λlyn
it� lþεnit ; ð7Þ
where εnit ¼ ððT�tÞ=ðT�tþ1ÞÞ1=2ðεt�ð1=ðT�tÞÞPTs ¼ tþ1 εsÞ
is the transformed error term. It immediately follows thatmoment conditions E½yisεit � ¼ 0 imply E½yisεnit � ¼ 0 for sot.
We estimate the coefficients in (7) by the system general-ized method of moments (GMM) with the lagged untrans-formed variables yis for sot available as instruments (Holtz-Eakin, Newey, and Rosen, 1988). As in Hasbrouck (1991), wedo not set the lag length optimally using the Akaike orSchwarz information criteria. Instead we choose L¼3 lags forall stocks because this lag structure is sufficient to eliminateall the serial correlation in the data (see Panel B). Table A7 inthe Appendix shows that the results that follow do not relyon this particular lag structure. For the just-identified system,the vector of instrumental variables (IV) to identify theparameters λl of Eq. (7) is Zit ¼ ½1;yit�1;…; yit�L�. With thisset of instruments, the system GMM estimator is equivalentto equation-by-equation IV estimation on the forwarddemeaned yn
it with instruments Zit .Table 6 reports estimates of specification (7). The
results generally are consistent with the evidence fromTables 4 and 5. Consistent with the event-study graphs inFig. 3 institutional order flow predicts returns at more thanone lag. Lag one returns negatively predict returns whilelag one sentiment positively predicts returns. Regressioncoefficients on one-day lagged returns and sentiment havethe same signs as in column B, Panel A of Table 4 but inTable 6 they are both statistically significant. These differ-ences could arise from the VARs using both news and non-news days. The lag one return coefficient in Table 6 of�0.005 is smaller than the corresponding �0.015 coeffi-cient in Table 4, but the VAR coefficient may be moreprecisely estimated due to the almost ten times largersample size when non-news days are included. In Table 5returns have a negative coefficient, but are not statisticallysignificant. The VAR may improve the efficiency of theestimation by better modeling dynamics between thevariables. Both returns and sentiment lose their predictivepower of future returns at a two-day horizon.
As in Table 4 institutional order flow is persistent.Positive returns today and yesterday both predict higherinstitutional order imbalances the following day. Senti-ment today negatively predicts higher institutional orderflow, as can be seen in Panel C of Table 4. This effect is notpresent in Table 6. As before both lagged returns andlagged sentiment predict sentiment.
We apply a Cholesky decomposition to the residualvariance-covariance matrix in order to obtain orthogonalizedimpulse responses. We vary the ordering of the variables,assigning contemporaneous correlation between the resi-duals to the variables that come earlier in the ordering. Wethen calculate standard errors for the impulse-responsefunctions by Monte Carlo simulations, accounting for estima-tion error in the coefficients (Hamilton, 1994, Chapter 11.7).Specifically, we randomly draw a set of coefficients from anormal distribution centered around the point estimates forλ and with the same error variance–covariance matrix. Foreach draw we recalculate the impulse responses. We repeatthis procedure 1,000 times to obtain 5% confidence boundson the impulse responses.
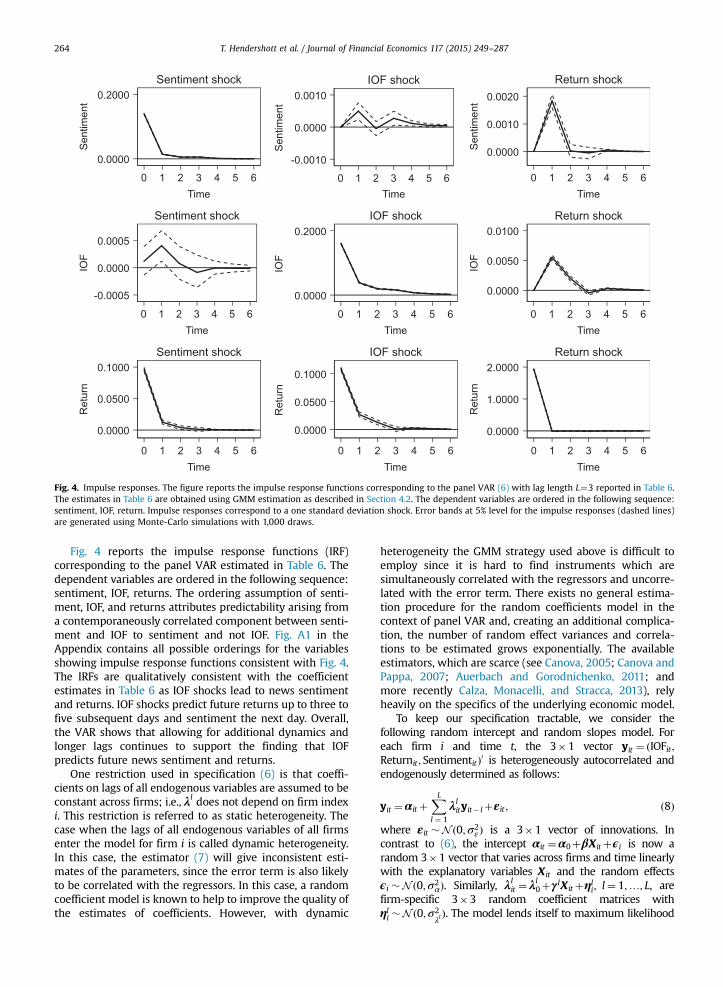
0.0000
0.2000S
entim
ent
0 1 2 3 4 5 6Time
Sentiment shock
-0.0010
0.0000
0.0010
Sen
timen
t
0 1 2 3 4 5 6Time
IOF shock
0.0000
0.0010
0.0020
Sen
timen
t
0 1 2 3 4 5 6Time
Return shock
-0.0005
0.0000
0.0005
IOF
0 1 2 3 4 5 6Time
Sentiment shock
0.0000
0.2000
IOF
0 1 2 3 4 5 6Time
IOF shock
0.0000
0.0050
0.0100
IOF
0 1 2 3 4 5 6Time
Return shock
0.0000
0.0500
0.1000
Ret
urn
0 1 2 3 4 5 6Time
Sentiment shock
0.0000
0.0500
0.1000
Ret
urn
0 1 2 3 4 5 6Time
IOF shock
0.0000
1.0000
2.0000
Ret
urn
0 1 2 3 4 5 6Time
Return shock
Fig. 4. Impulse responses. The figure reports the impulse response functions corresponding to the panel VAR (6) with lag length L¼3 reported in Table 6.The estimates in Table 6 are obtained using GMM estimation as described in Section 4.2. The dependent variables are ordered in the following sequence:sentiment, IOF, return. Impulse responses correspond to a one standard deviation shock. Error bands at 5% level for the impulse responses (dashed lines)are generated using Monte-Carlo simulations with 1,000 draws.
T. Hendershott et al. / Journal of Financial Economics 117 (2015) 249–287264
Fig. 4 reports the impulse response functions (IRF)corresponding to the panel VAR estimated in Table 6. Thedependent variables are ordered in the following sequence:sentiment, IOF, returns. The ordering assumption of senti-ment, IOF, and returns attributes predictability arising froma contemporaneously correlated component between senti-ment and IOF to sentiment and not IOF. Fig. A1 in theAppendix contains all possible orderings for the variablesshowing impulse response functions consistent with Fig. 4.The IRFs are qualitatively consistent with the coefficientestimates in Table 6 as IOF shocks lead to news sentimentand returns. IOF shocks predict future returns up to three tofive subsequent days and sentiment the next day. Overall,the VAR shows that allowing for additional dynamics andlonger lags continues to support the finding that IOFpredicts future news sentiment and returns.
One restriction used in specification (6) is that coeffi-cients on lags of all endogenous variables are assumed to beconstant across firms; i.e., λl does not depend on firm indexi. This restriction is referred to as static heterogeneity. Thecase when the lags of all endogenous variables of all firmsenter the model for firm i is called dynamic heterogeneity.In this case, the estimator (7) will give inconsistent esti-mates of the parameters, since the error term is also likelyto be correlated with the regressors. In this case, a randomcoefficient model is known to help to improve the quality ofthe estimates of coefficients. However, with dynamic
heterogeneity the GMM strategy used above is difficult toemploy since it is hard to find instruments which aresimultaneously correlated with the regressors and uncorre-lated with the error term. There exists no general estima-tion procedure for the random coefficients model in thecontext of panel VAR and, creating an additional complica-tion, the number of random effect variances and correla-tions to be estimated grows exponentially. The availableestimators, which are scarce (see Canova, 2005; Canova andPappa, 2007; Auerbach and Gorodnichenko, 2011; andmore recently Calza, Monacelli, and Stracca, 2013), relyheavily on the specifics of the underlying economic model.
To keep our specification tractable, we consider thefollowing random intercept and random slopes model. Foreach firm i and time t, the 3�1 vector yit ¼ ðIOFit ;Returnit ; SentimentitÞ0 is heterogeneously autocorrelated andendogenously determined as follows:
yit ¼αitþXLl ¼ 1
λlityit� lþεit ; ð8Þ
where εit �N ð0;σ2εÞ is a 3�1 vector of innovations. In
contrast to (6), the intercept αit ¼α0þβX itþϵi is now arandom 3�1 vector that varies across firms and time linearlywith the explanatory variables X it and the random effectsϵi �N ð0;σ2
αÞ. Similarly, λlit ¼ λl0þγlX itþηli; l¼ 1;…; L, arefirm-specific 3�3 random coefficient matrices withηli �N ð0;σ2
λlÞ. The model lends itself to maximum likelihood

T. Hendershott et al. / Journal of Financial Economics 117 (2015) 249–287 265
estimation with the expectation–maximization (EM) algo-rithm (see Dempster, Laird, and Rubin, 1977). We set the laglength L¼1 in the reported specifications, as longer lags donot change the results.
As a robustness check, we estimate our panel VARmodel (6) on subsamples, i.e., we sort firms into tercilesbased on such firm-specific characteristics as size, govern-ance, and number of following analysts and then compareGMM-estimated panel VAR coefficients across the terciles.As a final robustness check, we do pooling across the 12Fama-French industries.
All our results are reported in the Appendix and weprovide only a brief summary of them here. The parameterestimates for model (8) in Table A8 show there is indeedsizeable (observable and unobserved) heterogeneity acrossfirms in the dynamic relation between IOF, stock returns,and news sentiment. All σλl estimates for the randomeffects are significantly positive. IOF consistently predictsreturns and sentiment (see λl0 in specification A), and thecoefficients are larger for larger firms that tend to havemore institutional ownership (see γl in specification B).The coefficients on IOF are also larger in more weaklygoverned firms (a high GIM index represents weak share-holder power). This suggests that institutions have stron-ger monitoring incentives in firms with more managerialentrenchment. Alternatively, the leakage of privilegedinformation to institutional investors is more pronouncedin these types of firms. Further, IOF and returns tend topredict future returns more for higher market-to-bookfirms, in which opaque intangibles are more important.Finally, the return predictability from news sentiment ismuch smaller when the number of analysts following thecompany is larger.
For industry-sorted portfolios, as well as portfoliossorted on the number of analysts, we cannot reject thenull in Tables A9 and A10 that all statistically significantregression coefficients on the lags are the same acrossdifferent group categories. In the case of size-sortedportfolios, we cannot reject the null for all statisticallysignificant regression coefficients on the lags except forthe coefficient on the first lag of IOF in the returnsregression. Consistent with the corresponding γl estimate,this coefficient is monotonically increasing across sizeportfolios. Overall, our results are robust to the abovetypes of dynamic heterogeneity across firms and time.
5. What types of news are institutions informed on?
Up to this point to examine whether institutions areinformed about news in the broadest context, the analysishas grouped all news announcements together. The resultsshowing institutional order flow predicting sentiment andreturns in Fig. 3 and Tables 4–6 are consistent withinstitutions having private information about the news.In this section we look at specific news categories. Insteadof looking at the individual news categories as classified byReuters we group news into broader news groups basedon their content. First, motivated by the fact that assetprices behave very differently on days when importantmacroeconomic news is scheduled for announcementrelative to other trading days (Savor and Wilson, 2014),
we investigate institutional trading around macroeco-nomic news. It is possible that some news announcementscontain information impacting prices that is unrelated tofundamentals. Therefore, we next turn our attention totwo types of news directly related to fundamentals: crisisand earnings announcements. Focusing on these newstypes allows us to study whether institutions are informedabout the timing of news (crises have strong negativesentiment but uncertain timing), news content (earningsannouncements are scheduled in advance but have uncer-tain content), or both. Finally, we explore the question ofwhether institutions trade around news stories with lessrelation to longer term information, which we refer to asinstitutions believing the “hype.”
5.1. Macroeconomic news
Days when macroeconomic news is announced are specialfor asset pricing. Savor and Wilson (2014) demonstrate thaton days when news about inflation, unemployment, orFederal Open Markets Committee interest-rate decisions isscheduled to be announced, stock market beta is stronglyrelated to returns and a robustly positive risk-return trade-offexists. In this section we investigate how institutions tradearound macroeconomic news announcements.
We define MACRO news days as days with news on oneof the following five topics: Economic Indicators (ECI,mean sentiment �0.127), Federal Reserve Board (FED,mean sentiment �0.197), Government/Sovereign Debt(GVD, mean sentiment �0.103), Macroeconomics (MCE,average sentiment �0.110), and Washington/U.S. Govern-ment News (WASH, mean sentiment �0.232). MACROnews have mean sentiment of �0.189, median sentimentof �0.271, and the standard deviation of their sentiment isequal to 0.441.
If institutions are informed about macroeconomic news,institutional trading and specifically institutional sellingshould have predictive power for returns and sentimentaround MACRO news days. We analyze the relations amongIOF, news sentiment, and returns on news days for theMACRO news category as well as its five constituent newscategories using specification E in Table 4.
Table 7 reports results for the MACRO news category aswell as for each individual news category included inMACRO news. The reported estimates are from panelregressions with firm fixed effects and volume, definedas the log of total trading volume, as control in addition toreturns, sentiment, and IBuys and ISales. All explanatoryvariables are measured on the day prior to the newsannouncement. The estimates show that institutionaltrading predicts returns (Panel A) on MACRO news days.For the individual news categories the return predictabilityis statistically significant only for the WASH category,which is by far the largest news category included inMACRO news (13,075 observations; the next largest cate-gory, GVD, has only 3,682 observations). Institutional orderflow does not predict sentiment (Panel B) for the MACROnews category as a whole. While the regression coeffi-cients on IBuys and ISales have the correct signs, they arenot statistically significant. The regression coefficients onIBuys and ISales for the individual news categories are all
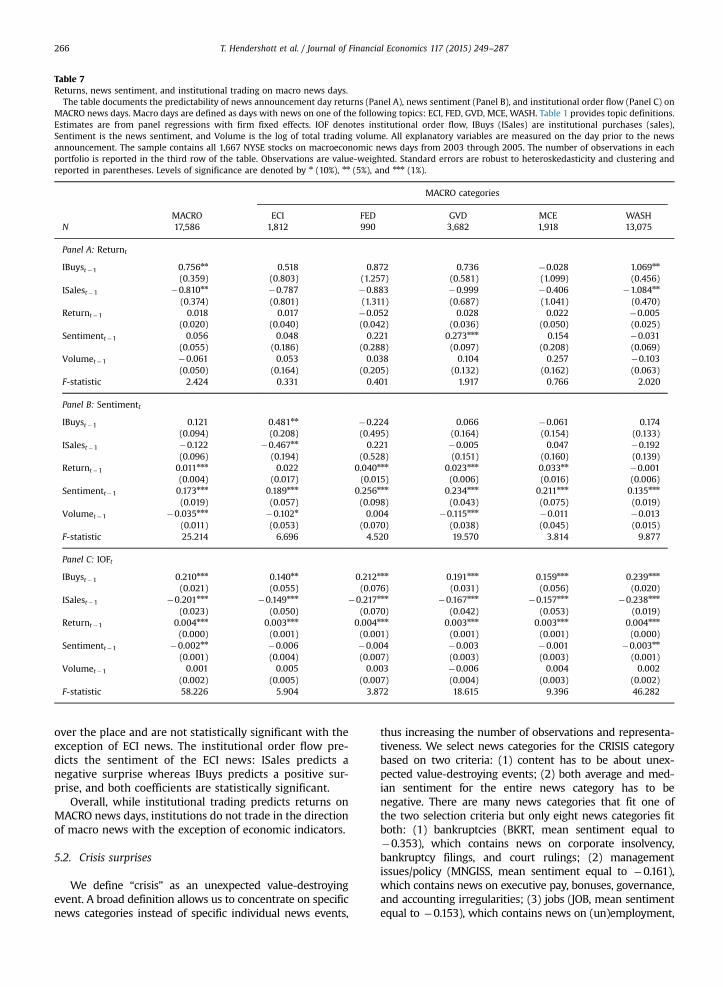
Table 7Returns, news sentiment, and institutional trading on macro news days.
The table documents the predictability of news announcement day returns (Panel A), news sentiment (Panel B), and institutional order flow (Panel C) onMACRO news days. Macro days are defined as days with news on one of the following topics: ECI, FED, GVD, MCE, WASH. Table 1 provides topic definitions.Estimates are from panel regressions with firm fixed effects. IOF denotes institutional order flow, IBuys (ISales) are institutional purchases (sales),Sentiment is the news sentiment, and Volume is the log of total trading volume. All explanatory variables are measured on the day prior to the newsannouncement. The sample contains all 1,667 NYSE stocks on macroeconomic news days from 2003 through 2005. The number of observations in eachportfolio is reported in the third row of the table. Observations are value-weighted. Standard errors are robust to heteroskedasticity and clustering andreported in parentheses. Levels of significance are denoted by n (10%), nn (5%), and nnn (1%).
MACRO categories
MACRO ECI FED GVD MCE WASHN 17,586 1,812 990 3,682 1,918 13,075
Panel A: Returnt
IBuyst�1 0.756nn 0.518 0.872 0.736 �0.028 1.069nn
(0.359) (0.803) (1.257) (0.581) (1.099) (0.456)ISalest�1 �0.810nn �0.787 �0.883 �0.999 �0.406 �1.084nn
(0.374) (0.801) (1.311) (0.687) (1.041) (0.470)Returnt�1 0.018 0.017 �0.052 0.028 0.022 �0.005
(0.020) (0.040) (0.042) (0.036) (0.050) (0.025)Sentimentt�1 0.056 0.048 0.221 0.273nnn 0.154 �0.031
(0.055) (0.186) (0.288) (0.097) (0.208) (0.069)Volumet�1 �0.061 0.053 0.038 0.104 0.257 �0.103
(0.050) (0.164) (0.205) (0.132) (0.162) (0.063)F-statistic 2.424 0.331 0.401 1.917 0.766 2.020
Panel B: Sentimentt
IBuyst�1 0.121 0.481nn �0.224 0.066 �0.061 0.174(0.094) (0.208) (0.495) (0.164) (0.154) (0.133)
ISalest�1 �0.122 �0.467nn 0.221 �0.005 0.047 �0.192(0.096) (0.194) (0.528) (0.151) (0.160) (0.139)
Returnt�1 0.011nnn 0.022 0.040nnn 0.023nnn 0.033nn �0.001(0.004) (0.017) (0.015) (0.006) (0.016) (0.006)
Sentimentt�1 0.173nnn 0.189nnn 0.256nnn 0.234nnn 0.211nnn 0.135nnn
(0.019) (0.057) (0.098) (0.043) (0.075) (0.019)Volumet�1 �0.035nnn �0.102n 0.004 �0.115nnn �0.011 �0.013
(0.011) (0.053) (0.070) (0.038) (0.045) (0.015)F-statistic 25.214 6.696 4.520 19.570 3.814 9.877
Panel C: IOFt
IBuyst�1 0.210nnn 0.140nn 0.212nnn 0.191nnn 0.159nnn 0.239nnn
(0.021) (0.055) (0.076) (0.031) (0.056) (0.020)ISalest�1 �0.201nnn �0.149nnn �0.217nnn �0.167nnn �0.157nnn �0.238nnn
(0.023) (0.050) (0.070) (0.042) (0.053) (0.019)Returnt�1 0.004nnn 0.003nnn 0.004nnn 0.003nnn 0.003nnn 0.004nnn
(0.000) (0.001) (0.001) (0.001) (0.001) (0.000)Sentimentt�1 �0.002nn �0.006 �0.004 �0.003 �0.001 �0.003nn
(0.001) (0.004) (0.007) (0.003) (0.003) (0.001)Volumet�1 0.001 0.005 0.003 �0.006 0.004 0.002
(0.002) (0.005) (0.007) (0.004) (0.003) (0.002)F-statistic 58.226 5.904 3.872 18.615 9.396 46.282
T. Hendershott et al. / Journal of Financial Economics 117 (2015) 249–287266
over the place and are not statistically significant with theexception of ECI news. The institutional order flow pre-dicts the sentiment of the ECI news: ISales predicts anegative surprise whereas IBuys predicts a positive sur-prise, and both coefficients are statistically significant.
Overall, while institutional trading predicts returns onMACRO news days, institutions do not trade in the directionof macro news with the exception of economic indicators.
5.2. Crisis surprises
We define “crisis” as an unexpected value-destroyingevent. A broad definition allows us to concentrate on specificnews categories instead of specific individual news events,
thus increasing the number of observations and representa-tiveness. We select news categories for the CRISIS categorybased on two criteria: (1) content has to be about unex-pected value-destroying events; (2) both average and med-ian sentiment for the entire news category has to benegative. There are many news categories that fit one ofthe two selection criteria but only eight news categories fitboth: (1) bankruptcies (BKRT, mean sentiment equal to�0.353), which contains news on corporate insolvency,bankruptcy filings, and court rulings; (2) managementissues/policy (MNGISS, mean sentiment equal to �0.161),which contains news on executive pay, bonuses, governance,and accounting irregularities; (3) jobs (JOB, mean sentimentequal to �0.153), which contains news on (un)employment,
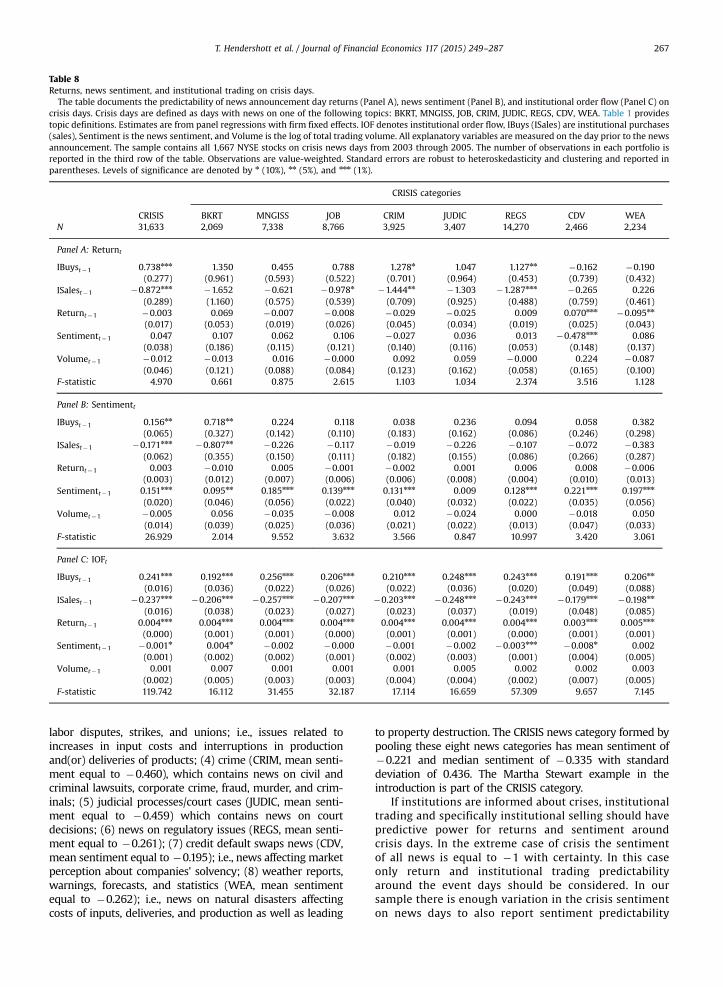
Table 8Returns, news sentiment, and institutional trading on crisis days.
The table documents the predictability of news announcement day returns (Panel A), news sentiment (Panel B), and institutional order flow (Panel C) oncrisis days. Crisis days are defined as days with news on one of the following topics: BKRT, MNGISS, JOB, CRIM, JUDIC, REGS, CDV, WEA. Table 1 providestopic definitions. Estimates are from panel regressions with firm fixed effects. IOF denotes institutional order flow, IBuys (ISales) are institutional purchases(sales), Sentiment is the news sentiment, and Volume is the log of total trading volume. All explanatory variables are measured on the day prior to the newsannouncement. The sample contains all 1,667 NYSE stocks on crisis news days from 2003 through 2005. The number of observations in each portfolio isreported in the third row of the table. Observations are value-weighted. Standard errors are robust to heteroskedasticity and clustering and reported inparentheses. Levels of significance are denoted by n (10%), nn (5%), and nnn (1%).
CRISIS categories
CRISIS BKRT MNGISS JOB CRIM JUDIC REGS CDV WEAN 31,633 2,069 7,338 8,766 3,925 3,407 14,270 2,466 2,234
Panel A: Returnt
IBuyst�1 0.738nnn 1.350 0.455 0.788 1.278n 1.047 1.127nn �0.162 �0.190(0.277) (0.961) (0.593) (0.522) (0.701) (0.964) (0.453) (0.739) (0.432)
ISalest�1 �0.872nnn �1.652 �0.621 �0.978n �1.444nn �1.303 �1.287nnn �0.265 0.226(0.289) (1.160) (0.575) (0.539) (0.709) (0.925) (0.488) (0.759) (0.461)
Returnt�1 �0.003 0.069 �0.007 �0.008 �0.029 �0.025 0.009 0.070nnn �0.095nn
(0.017) (0.053) (0.019) (0.026) (0.045) (0.034) (0.019) (0.025) (0.043)Sentimentt�1 0.047 0.107 0.062 0.106 �0.027 0.036 0.013 �0.478nnn 0.086
(0.038) (0.186) (0.115) (0.121) (0.140) (0.116) (0.053) (0.148) (0.137)Volumet�1 �0.012 �0.013 0.016 �0.000 0.092 0.059 �0.000 0.224 �0.087
(0.046) (0.121) (0.088) (0.084) (0.123) (0.162) (0.058) (0.165) (0.100)F-statistic 4.970 0.661 0.875 2.615 1.103 1.034 2.374 3.516 1.128
Panel B: Sentimentt
IBuyst�1 0.156nn 0.718nn 0.224 0.118 0.038 0.236 0.094 0.058 0.382(0.065) (0.327) (0.142) (0.110) (0.183) (0.162) (0.086) (0.246) (0.298)
ISalest�1 �0.171nnn �0.807nn �0.226 �0.117 �0.019 �0.226 �0.107 �0.072 �0.383(0.062) (0.355) (0.150) (0.111) (0.182) (0.155) (0.086) (0.266) (0.287)
Returnt�1 0.003 �0.010 0.005 �0.001 �0.002 0.001 0.006 0.008 �0.006(0.003) (0.012) (0.007) (0.006) (0.006) (0.008) (0.004) (0.010) (0.013)
Sentimentt�1 0.151nnn 0.095nn 0.185nnn 0.139nnn 0.131nnn 0.009 0.128nnn 0.221nnn 0.197nnn
(0.020) (0.046) (0.056) (0.022) (0.040) (0.032) (0.022) (0.035) (0.056)Volumet�1 �0.005 0.056 �0.035 �0.008 0.012 �0.024 0.000 �0.018 0.050
(0.014) (0.039) (0.025) (0.036) (0.021) (0.022) (0.013) (0.047) (0.033)F-statistic 26.929 2.014 9.552 3.632 3.566 0.847 10.997 3.420 3.061
Panel C: IOFt
IBuyst�1 0.241nnn 0.192nnn 0.256nnn 0.206nnn 0.210nnn 0.248nnn 0.243nnn 0.191nnn 0.206nn
(0.016) (0.036) (0.022) (0.026) (0.022) (0.036) (0.020) (0.049) (0.088)ISalest�1 �0.237nnn �0.206nnn �0.257nnn �0.207nnn �0.203nnn �0.248nnn �0.243nnn �0.179nnn �0.198nn
(0.016) (0.038) (0.023) (0.027) (0.023) (0.037) (0.019) (0.048) (0.085)Returnt�1 0.004nnn 0.004nnn 0.004nnn 0.004nnn 0.004nnn 0.004nnn 0.004nnn 0.003nnn 0.005nnn
(0.000) (0.001) (0.001) (0.000) (0.001) (0.001) (0.000) (0.001) (0.001)Sentimentt�1 �0.001n 0.004n �0.002 �0.000 �0.001 �0.002 �0.003nnn �0.008n 0.002
(0.001) (0.002) (0.002) (0.001) (0.002) (0.003) (0.001) (0.004) (0.005)Volumet�1 0.001 0.007 0.001 0.001 0.001 0.005 0.002 0.002 0.003
(0.002) (0.005) (0.003) (0.003) (0.004) (0.004) (0.002) (0.007) (0.005)F-statistic 119.742 16.112 31.455 32.187 17.114 16.659 57.309 9.657 7.145
T. Hendershott et al. / Journal of Financial Economics 117 (2015) 249–287 267
labor disputes, strikes, and unions; i.e., issues related toincreases in input costs and interruptions in productionand(or) deliveries of products; (4) crime (CRIM, mean senti-ment equal to �0.460), which contains news on civil andcriminal lawsuits, corporate crime, fraud, murder, and crim-inals; (5) judicial processes/court cases (JUDIC, mean senti-ment equal to �0.459) which contains news on courtdecisions; (6) news on regulatory issues (REGS, mean senti-ment equal to �0.261); (7) credit default swaps news (CDV,mean sentiment equal to �0.195); i.e., news affecting marketperception about companies' solvency; (8) weather reports,warnings, forecasts, and statistics (WEA, mean sentimentequal to �0.262); i.e., news on natural disasters affectingcosts of inputs, deliveries, and production as well as leading
to property destruction. The CRISIS news category formed bypooling these eight news categories has mean sentiment of�0.221 and median sentiment of �0.335 with standarddeviation of 0.436. The Martha Stewart example in theintroduction is part of the CRISIS category.
If institutions are informed about crises, institutionaltrading and specifically institutional selling should havepredictive power for returns and sentiment aroundcrisis days. In the extreme case of crisis the sentimentof all news is equal to �1 with certainty. In this caseonly return and institutional trading predictabilityaround the event days should be considered. In oursample there is enough variation in the crisis sentimenton news days to also report sentiment predictability

T. Hendershott et al. / Journal of Financial Economics 117 (2015) 249–287268
results. We follow the previous section and use specifi-cation E in Table 4 as a blueprint for our analysis.
Table 8 reports estimates from panel regressions with firmfixed effects and volume, defined as the log of total tradingvolume, returns, sentiment, and IBuys and ISales. All expla-natory variables are measured on the day prior to the newsannouncement. The estimates show that institutional tradingpredicts returns (Panel A) and sentiment (Panel B) for theCRISIS news category. Institutions trade in the right directionbefore a crisis announcement. ISales predicts a negativesurprise whereas IBuys predicts a positive surprise. For theindividual news categories the return predictability is statis-tically significant for the CRIM and REGS category andmargin-ally significant for the JOB category. Institutional order flowpredicts sentiment only for the BKRT news category (coeffi-cients on IBuys and ISales are statistically significant and havecorrect signs). However, the regression coefficients on IBuysand ISales for the individual news categories all have correctsigns; i.e., positive sign for IBuys and negative sign for ISales.Another interesting result is that unlike Tetlock (2007) andTetlock, Saar-Tsechansky, and Macskassy (2008), news senti-ment does not predict individual returns on crisis days, atleast not statistically significantly so.
Overall, our results support the hypothesis that institu-tions are informed about crisis. Because our sample periodis calm for the market as a whole, the crisis events provideevidence on institutions' role in firm governance duringtimes of stress.
Table 9Returns, institutional trading, and earnings surprises.
The table documents the predictability of earnings surprises by institutionalEarnings surprises are measured by the standardized unanticipated earnings, SU
SUEi ¼ERi�E½cERi�
σðcERiÞ;
where the surprise mean, E½cERi�, is the arithmetic average of analysts' estimates odeviation of individual analyst estimates about the average estimate. IOF denoteSentiment is the news sentiment, and Volume is the log of total trading volumannouncement. The sample contains all 1,667 NYSE stocks on earnings announceObservations are value-weighted. Standard errors are robust to heteroskedasticdenoted by n (10%), nn (5%), and nnn (1%).
Panel A: Correlations
Returnt Sentimentt IOF
SUEt 0.3390nnn 0.2172nnn �0.0380nnn
Panel B: SUEt
(A) (B)
IOFt�1 1.036nn
(0.514)IBuyst�1 1.075nn
(0.521)ISalest�1 �1.024nn
(0.511)Returnt�1
Sentimentt�1
Volumet�1
F-statistic 5.024 2.626
5.3. Earnings announcement surprises
This section provides further evidence that institutionshave private value-relevant information by studying firms'earnings announcements in more detail. If institutions areinformed about corporate performance, institutional trad-ing should have predictive power for analyst forecasterrors around earnings days. The standardized unantici-pated earnings, SUE, score is a commonly used measure toquantify the surprise in the marketplace. The SUE scoremeasures the deviation of the announced earnings fromthe mean analyst estimate. We compute the SUE score byaggregating the published earnings forecasts from theThomson Reuters Institutional Brokers' Estimate System(I/B/E/S).
The SUE score measures the number of standarddeviations the actual reported earnings differ from the I/B/E/S mean estimates for a company for the current fiscalperiod. The SUE score for stock i on the announcement dayis calculated as
SUEi ¼ERi�E½cERi�σðcERiÞ
; ð9Þ
where the surprise mean, E½cERi�, is the arithmetic averageof analysts' estimates on the release date of the quarterlyearnings, ERi. The surprise standard deviation, σðcERiÞ,measures the dispersion in analysts' estimates at the timeof the earnings announcement by the standard deviation
order flow. Estimates are from panel regressions with firm fixed effects.E, score. The SUE score is calculated as follows:
n the release date of the quarterly earnings, ERi, and σðcERiÞ is the standards institutional order flow, IBuys (ISales) are institutional purchases (sales),e. All explanatory variables are measured on the day prior to the newsment days from 2003 through 2005. The number of observations is 9,144.ity and clustering and reported in parentheses. Levels of significance are
t IBuyst ISalest Volumet
0.0330nnn 0.0377nnn 0.0431nnn
(C) (D) (E)
0.875n
(0.517)0.863n
(0.524)�0.880n
(0.521)0.062nn 0.058nn 0.058nn
(0.025) (0.026) (0.026)0.192 0.194 0.194
(0.189) (0.190) (0.190)0.053 0.057 0.065
(0.165) (0.166) (0.220)1.723 2.445 1.955

(footnote continued)They also find that return volatility frequently increases in the post-announcement period.
9 Here is an example of a typical self-promoting press release by a U.S. corporation courtesy of Neuhierl, Scherbina, and Schlusche (2013). OnJanuary 9, 2007 Apple Inc. issued a press release, headlined “AppleReinvents the Phone with iPhone,” which stated: “iPhone … ushers in anera of software power and sophistication never before seen in a mobiledevice, which completely redefines what users can do on their mobile
T. Hendershott et al. / Journal of Financial Economics 117 (2015) 249–287 269
of individual analyst estimates about the average estimateE½cERi�. The narrower the range of estimates the moresevere one expects a stock's reaction to an earningssurprise will be.
The SUE scores associated with each announcementcome from the I/B/E/S Summary History file. We winsorizethe raw SUE scores at the top and bottom 1% to diminishthe impact of extreme values. In addition, we require thatthe earnings release is covered in the Reuters news data.The number of observations is 9,144.
Table 9 reports the determinants of SUE scores on theday of the earnings release. Panel A shows that SUE iscorrelated positively with returns and news sentiment andnegatively with IOF. As in other tables, estimates are frompanel regressions with firm fixed effects and volume,defined as the log of total trading volume, returns, senti-ment, and IOF or, alternatively, IBuys and ISales. All expla-natory variables are measured on the day prior to theearnings announcement. The estimates show that institu-tional trading predicts the SUE score. Institutions trade inthe right direction before an earnings announcement. IBuyspredicts a positive earnings surprise whereas ISales predictsa negative surprise.
The earnings announcement results utilize fundamen-tal information that is not directly controlled by the media.This rules out communication between institutions andreporters being purely responsible for our findings.
5.4. Do institutions believe hype?
A large fraction of the public news is generated by thecorporations themselves disclosing information that mayimpact their market values and reporting changes in theirfinancial conditions or operations via press releases. Firmsusually sign up for an account with one of the newswireservices such as PR Newswire (PRN), Business Wire (BSW),GlobeNewswire, and Marketwire. Newswire services thenpost press releases on their own websites and also dis-tribute them, typically free of charge, to local and globalmedia outlets, trade magazines, and financial Internetsites. These press releases are delivered to investorsdirectly without processing by information intermediaries.Unlike stories written by Reuters reporters, the pressreleases do not contain reporters' opinions on the newsbeing disclosed. This feature makes press releases anattractive approach to studying the relationship betweeninstitutional trading and hype generated by firms.
Following the adoption of Regulation Fair Disclosure(Reg FD) in October 2000 and of the Sarbanes-Oxley Act inJuly 2002, corporate press releases became a prevalentmethod of communicating new developments to inves-tors. The goal of Reg FD is to achieve timeliness and non-exclusivity of corporate information. Communicatinginformation via press releases is a preferred method ofaccomplishing this.8 However, under the umbrella of Reg
8 Neuhierl, Scherbina, and Schlusche (2013) study the market reac-tion to press releases. Unlike our study, they do not discriminate betweeninstitutional investors and other investors. They document significantreactions to news about corporate strategy, customers and partners,products and services, management changes, and legal developments.
FD, firms may use press releases to hype themselves byreleasing positive but potentially controversial or unsub-stantiated information to investors in the hope that theywill revise their expectations about the firm's value upwardand bid up its stock price, at least temporarily.9 Examples ofsuch news include, but are not limited to, awards for acompany's achievements, awards for a product's achievements,securing business from a new or an existing customer, signingnew strategic agreements with another firm, reaching mile-stones or an anniversary, pre-announcement of strong financialresults, settlement of litigation against the firm, securedapproval to acquire another firm, recruitment or election oftop management or board members, promotion, retirement,resignation/departure of top management or board members,sponsorship of an industry event, announcement of an FDAproduct approval, launch of a new service or introduction of anew product, and improvement or update of a product/service.Indications of opportunistic behavior by firms are returns havinglittle correlationwith the sentiment of the press releases and/orsentiment reversing after the original news release. We usepress releases as a proxy for “hyping” behavior by corporationsto test whether institutions believe the hype.
Reuters provides a comprehensive data set of 76,213 pressreleases from PRN and 51,073 press releases from BSW match-ing the time span of our NYSE institutional buy and sell data.Table 10 reports sample statistics for the PRN and BSW releases.For both news sources sentiment has a fat right tail with a fairlylarge number of extreme positive realizations: both PRN senti-ment and BSW sentiment have high average (median) senti-ments of 0.290 (0.337) and 0.317 (0.378), respectively, while theaverage sentiment for Reuters written news is zero. Sentimentdistributions also reveal that press releases from both newssources contain a substantial amount of negative news. This isconsistent with findings of Neuhierl, Scherbina, and Schlusche(2013), who report significant negative market reaction inresponse to pre-announcements of disappointing financialresults, announcements of FDA rejections, customer losses,product defects, and earnings restatements. In addition, PRNsentiment is weakly positively correlated with returns, 0.0286,and negatively correlated with IOF, �0.0094. BSW sentimentreveals similar correlation coefficients. The sentiment of Reuterswritten stories is more positively correlatedwith these variables.
Fig. 5 shows buy-and-hold cumulative stock returnsand institutional order flow on press release days for PRN(Panel A) and BSW (Panel B). A ten-day window aroundthe press release day is used in both cases. Buy-and-hold
phones.” It contained a pronouncement from CEO Steve Jobs, that “…iPhone is a revolutionary and magical product that is literally five yearsahead of any other mobile phone,” and described the new product'sfeatures. On the day of the announcement Apple's stock price also rose,and in the period from the day before to five days after the announce-ment the stock earned a cumulative return of 9.31% in excess of themarket.
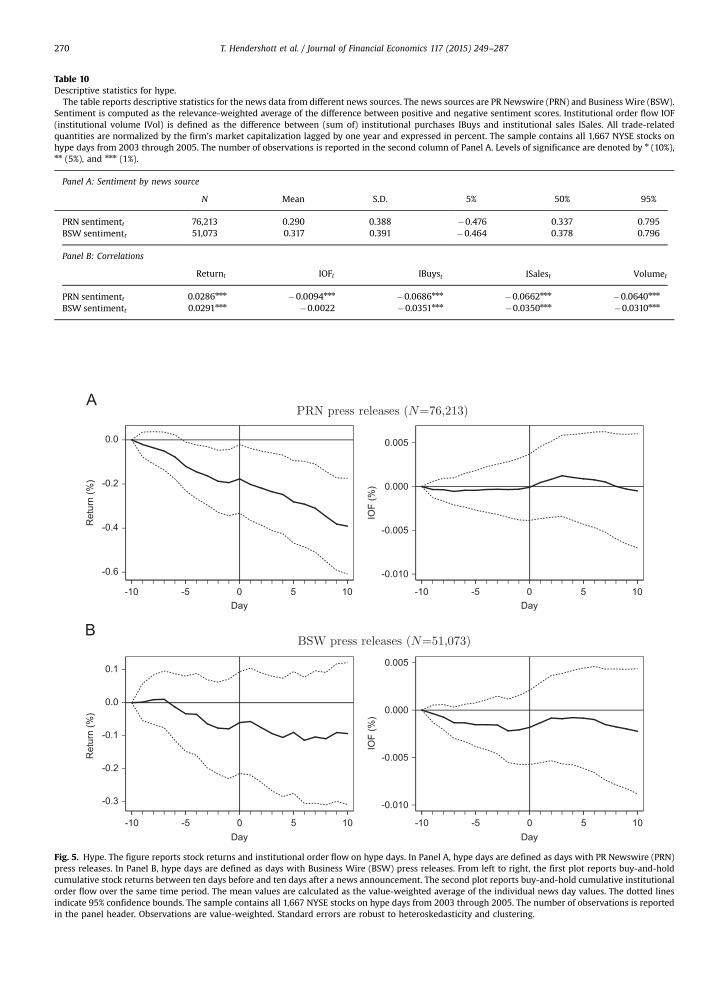
Table 10Descriptive statistics for hype.
The table reports descriptive statistics for the news data from different news sources. The news sources are PR Newswire (PRN) and Business Wire (BSW).Sentiment is computed as the relevance-weighted average of the difference between positive and negative sentiment scores. Institutional order flow IOF(institutional volume IVol) is defined as the difference between (sum of) institutional purchases IBuys and institutional sales ISales. All trade-relatedquantities are normalized by the firm's market capitalization lagged by one year and expressed in percent. The sample contains all 1,667 NYSE stocks onhype days from 2003 through 2005. The number of observations is reported in the second column of Panel A. Levels of significance are denoted by n (10%),nn (5%), and nnn (1%).
Panel A: Sentiment by news source
N Mean S.D. 5% 50% 95%
PRN sentimentt 76,213 0.290 0.388 �0.476 0.337 0.795BSW sentimentt 51,073 0.317 0.391 �0.464 0.378 0.796
Panel B: Correlations
Returnt IOFt IBuyst ISalest Volumet
PRN sentimentt 0.0286nnn �0.0094nnn �0.0686nnn �0.0662nnn �0.0640nnn
BSW sentimentt 0.0291nnn �0.0022 �0.0351nnn �0.0350nnn �0.0310nnn
-0.6
-0.4
-0.2
0.0
Ret
urn
(%)
-10 -5 0 5 10Day
-0.010
-0.005
0.000
0.005
IOF
(%)
-10 -5 0 5 10Day
-0.3
-0.2
-0.1
0.0
0.1
Ret
urn
(%)
-10 -5 0 5 10Day
-0.010
-0.005
0.000
0.005
IOF
(%)
-10 -5 0 5 10Day
Fig. 5. Hype. The figure reports stock returns and institutional order flow on hype days. In Panel A, hype days are defined as days with PR Newswire (PRN)press releases. In Panel B, hype days are defined as days with Business Wire (BSW) press releases. From left to right, the first plot reports buy-and-holdcumulative stock returns between ten days before and ten days after a news announcement. The second plot reports buy-and-hold cumulative institutionalorder flow over the same time period. The mean values are calculated as the value-weighted average of the individual news day values. The dotted linesindicate 95% confidence bounds. The sample contains all 1,667 NYSE stocks on hype days from 2003 through 2005. The number of observations is reportedin the panel header. Observations are value-weighted. Standard errors are robust to heteroskedasticity and clustering.
T. Hendershott et al. / Journal of Financial Economics 117 (2015) 249–287270

T. Hendershott et al. / Journal of Financial Economics 117 (2015) 249–287 271
cumulative returns provide support for firms strategicallyusing press releases for “hype”: returns decline before theannouncement day, then show a small jump on theannouncement day, and then continue declining. Overall,the pattern is consistent with the hypothesis that firmsusing press releases are experiencing negative perfor-mance and try to temporarily “hype” their stock price byfacilitating positive news announcements. Institutionalorder flow is flat for both news agencies before and rightafter the announcement day, while rising a little afterwardwhen price declines. Institutional order flow showing noabnormal activity prior to and on the announcement day isconsistent with institutions not believing the hype.
Table 11 performs a more thorough investigation of theconjecture that institutions do not believe the hype by usingspecifications B and E in Table 4. As in other tables, estimatesare from panel regressions with firm fixed effects and volume,defined as the log of total trading volume, returns, sentiment,and IBuys and ISales. All explanatory variables are measuredon the day prior to the news announcement. The estimatesshow that institutional trading predicts returns (columns Aand B) for both PRN and BSW. However, consistent with theevidence from Fig. 5 institutional trading does not predict
Table 11Returns, news sentiment, and institutional trading on hype days.
The table documents the predictability of news announcement day returns (co(columns E–F) on hype days. In Panel A, hype days are defined as days with PRwith Business Wire (BSW) press releases. Estimates are from panel regressionsare institutional purchases (sales), Sentiment is the news sentiment, and Volumeon the day prior to the news announcement. The sample contains all 1,667 NYSEis reported in the panel header. Observations are value-weighted. Standardparentheses. Levels of significance are denoted by n (10%), nn (5%), and nnn (1%).
Returnt
(A) (B) (C)
Panel A: PRN press releases (N¼76,213)
IOFt�1 0.461nnn 0.0(0.164) (0.0
IBuyst�1 0.441nnn
(0.165)ISalest�1 �0.486nnn
(0.165)Returnt�1 �0.028n �0.028n 0.0
(0.016) (0.016) (0.0Sentimentt�1 0.044 0.044 0.03
(0.043) (0.043) (0.0Volumet�1 �0.018 0.000 �0.027
(0.036) (0.046) (0.0F-statistic 5.540 4.868 7.2
Panel B: BSW press releases (N¼51,073)
IOFt�1 0.996nnn 0.0(0.335) (0.0
IBuyst�1 0.950nnn
(0.340)ISalest�1 �1.054nnn
(0.337)Returnt�1 �0.027 �0.028 �0.0
(0.022) (0.021) (0.0Sentimentt�1 0.044 0.044 0.03
(0.039) (0.039) (0.0Volumet�1 �0.004 0.033 �0.0
(0.043) (0.055) (0.0F-statistic 7.800 6.833 1.4
sentiment (columns C and D) for both PRN and BSW. In fact,regression coefficients for IBuys and ISales for the PRN categoryare both negative, albeit not statistically significant. For BSWthese coefficients are not statistically significant. These resultsprovide further support for the conjecture that institutions donot believe the hype.
We next make use of the Reuters news data to provideadditional evidence on whether institutions believe thehype. In the Reuters news data we select news events withsubsequent sentiment reversal over five and ten days. Outof these news events we look at days with the 10% largestsentiment reversals. These news events can be interpretedeither as hype or as transitory or erroneous news.
Fig. 6 shows the buy-and-hold cumulative returns andinstitutional order flows for news days with five-day sentimentreversal (Panel A) and ten-day sentiment reversal (Panel B). Inboth cases the market responds in the direction of the news:investors earn positive (negative) abnormal returns on theannouncement day which declines (increases) on subsequentdays. Therefore, sentiment reversals are associated with transi-tory stock returns. The institutions on average sell before positivenews releases and start buying after prices come down after thenews releases in the case of five-day sentiment reversals. Before
lumns A–B), news sentiment (columns C–D), and institutional order flowNewswire (PRN) press releases. In Panel B, hype days are defined as dayswith firm fixed effects. IOF denotes institutional order flow, IBuys (ISales)is the log of total trading volume. All explanatory variables are measured
stocks on hype days from 2003 through 2005. The number of observationserrors are robust to heteroskedasticity and clustering and reported in
Sentimentt IOFt
(D) (E) (F)
08 0.234nnn
28) (0.013)�0.002 0.237nnn
(0.029) (0.013)�0.021 �0.231nnn
(0.027) (0.013)03 0.003 0.004nnn 0.004nnn
03) (0.003) (0.000) (0.000)9nn 0.039nn �0.002nn �0.002nnn
15) (0.015) (0.001) (0.001)nnn �0.018n 0.002nn �0.00008) (0.010) (0.001) (0.002)19 18.113 234.389 193.023
34 0.246nnn
42) (0.011)0.032 0.244nnn
(0.042) (0.011)�0.037 �0.248nnn
(0.043) (0.010)01 �0.001 0.004nnn 0.004nnn
02) (0.002) (0.000) (0.000)7nn 0.037nn �0.001 �0.00115) (0.015) (0.001) (0.001)05 �0.003 0.001 0.00210) (0.013) (0.001) (0.002)39 1.323 205.310 192.123
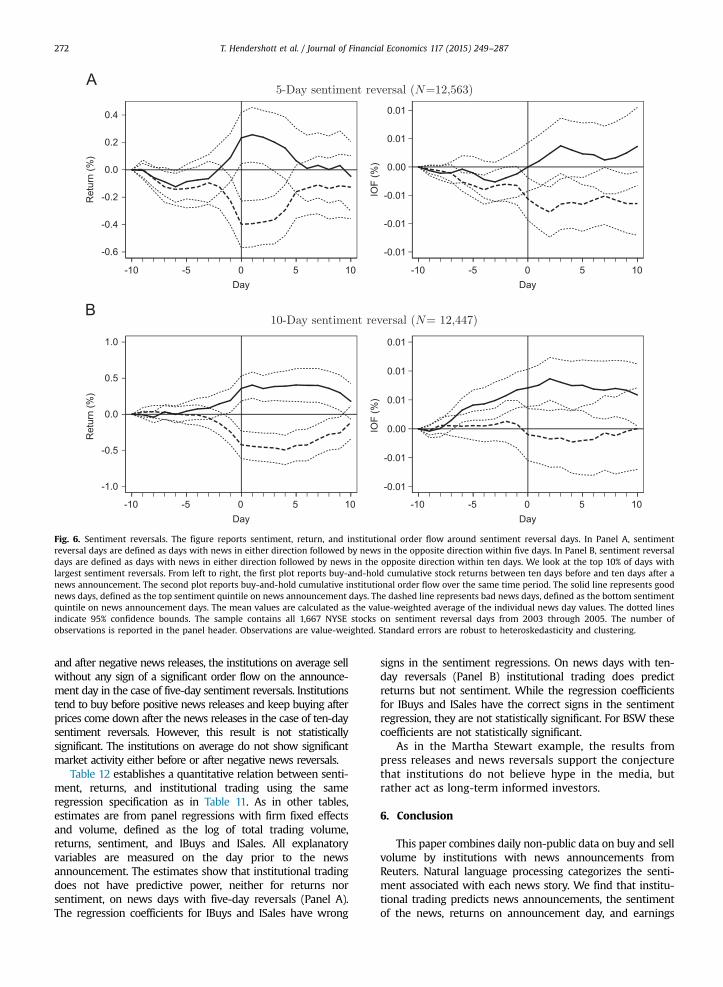
-0.6
-0.4
-0.2
0.0
0.2
0.4
Ret
urn
(%)
-10 -5 0 5 10Day
-0.01
-0.01
-0.01
0.00
0.01
0.01
IOF
(%)
-10 -5 0 5 10Day
-1.0
-0.5
0.0
0.5
1.0
Ret
urn
(%)
-10 -5 0 5 10Day
-0.01
-0.01
0.00
0.01
0.01
0.01
IOF
(%)
-10 -5 0 5 10Day
Fig. 6. Sentiment reversals. The figure reports sentiment, return, and institutional order flow around sentiment reversal days. In Panel A, sentimentreversal days are defined as days with news in either direction followed by news in the opposite direction within five days. In Panel B, sentiment reversaldays are defined as days with news in either direction followed by news in the opposite direction within ten days. We look at the top 10% of days withlargest sentiment reversals. From left to right, the first plot reports buy-and-hold cumulative stock returns between ten days before and ten days after anews announcement. The second plot reports buy-and-hold cumulative institutional order flow over the same time period. The solid line represents goodnews days, defined as the top sentiment quintile on news announcement days. The dashed line represents bad news days, defined as the bottom sentimentquintile on news announcement days. The mean values are calculated as the value-weighted average of the individual news day values. The dotted linesindicate 95% confidence bounds. The sample contains all 1,667 NYSE stocks on sentiment reversal days from 2003 through 2005. The number ofobservations is reported in the panel header. Observations are value-weighted. Standard errors are robust to heteroskedasticity and clustering.
T. Hendershott et al. / Journal of Financial Economics 117 (2015) 249–287272
and after negative news releases, the institutions on average sellwithout any sign of a significant order flow on the announce-ment day in the case of five-day sentiment reversals. Institutionstend to buy before positive news releases and keep buying afterprices come down after the news releases in the case of ten-daysentiment reversals. However, this result is not statisticallysignificant. The institutions on average do not show significantmarket activity either before or after negative news reversals.
Table 12 establishes a quantitative relation between senti-ment, returns, and institutional trading using the sameregression specification as in Table 11. As in other tables,estimates are from panel regressions with firm fixed effectsand volume, defined as the log of total trading volume,returns, sentiment, and IBuys and ISales. All explanatoryvariables are measured on the day prior to the newsannouncement. The estimates show that institutional tradingdoes not have predictive power, neither for returns norsentiment, on news days with five-day reversals (Panel A).The regression coefficients for IBuys and ISales have wrong
signs in the sentiment regressions. On news days with ten-day reversals (Panel B) institutional trading does predictreturns but not sentiment. While the regression coefficientsfor IBuys and ISales have the correct signs in the sentimentregression, they are not statistically significant. For BSW thesecoefficients are not statistically significant.
As in the Martha Stewart example, the results frompress releases and news reversals support the conjecturethat institutions do not believe hype in the media, butrather act as long-term informed investors.
6. Conclusion
This paper combines daily non-public data on buy and sellvolume by institutions with news announcements fromReuters. Natural language processing categorizes the senti-ment associated with each news story. We find that institu-tional trading predicts news announcements, the sentimentof the news, returns on announcement day, and earnings
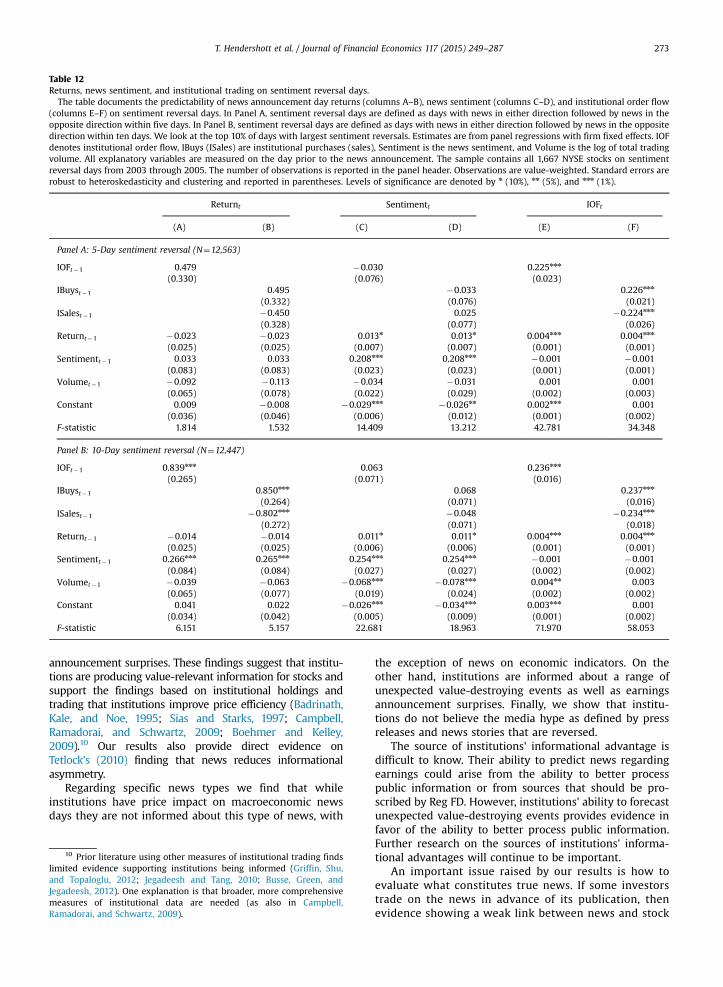
Table 12Returns, news sentiment, and institutional trading on sentiment reversal days.
The table documents the predictability of news announcement day returns (columns A–B), news sentiment (columns C–D), and institutional order flow(columns E–F) on sentiment reversal days. In Panel A, sentiment reversal days are defined as days with news in either direction followed by news in theopposite direction within five days. In Panel B, sentiment reversal days are defined as days with news in either direction followed by news in the oppositedirection within ten days. We look at the top 10% of days with largest sentiment reversals. Estimates are from panel regressions with firm fixed effects. IOFdenotes institutional order flow, IBuys (ISales) are institutional purchases (sales), Sentiment is the news sentiment, and Volume is the log of total tradingvolume. All explanatory variables are measured on the day prior to the news announcement. The sample contains all 1,667 NYSE stocks on sentimentreversal days from 2003 through 2005. The number of observations is reported in the panel header. Observations are value-weighted. Standard errors arerobust to heteroskedasticity and clustering and reported in parentheses. Levels of significance are denoted by n (10%), nn (5%), and nnn (1%).
Returnt Sentimentt IOFt
(A) (B) (C) (D) (E) (F)
Panel A: 5-Day sentiment reversal (N¼12,563)
IOFt�1 0.479 �0.030 0.225nnn
(0.330) (0.076) (0.023)IBuyst�1 0.495 �0.033 0.226nnn
(0.332) (0.076) (0.021)ISalest�1 �0.450 0.025 �0.224nnn
(0.328) (0.077) (0.026)Returnt�1 �0.023 �0.023 0.013n 0.013n 0.004nnn 0.004nnn
(0.025) (0.025) (0.007) (0.007) (0.001) (0.001)Sentimentt�1 0.033 0.033 0.208nnn 0.208nnn �0.001 �0.001
(0.083) (0.083) (0.023) (0.023) (0.001) (0.001)Volumet�1 �0.092 �0.113 �0.034 �0.031 0.001 0.001
(0.065) (0.078) (0.022) (0.029) (0.002) (0.003)Constant 0.009 �0.008 �0.029nnn �0.026nn 0.002nnn 0.001
(0.036) (0.046) (0.006) (0.012) (0.001) (0.002)F-statistic 1.814 1.532 14.409 13.212 42.781 34.348
Panel B: 10-Day sentiment reversal (N¼12,447)
IOFt�1 0.839nnn 0.063 0.236nnn
(0.265) (0.071) (0.016)IBuyst�1 0.850nnn 0.068 0.237nnn
(0.264) (0.071) (0.016)ISalest�1 �0.802nnn �0.048 �0.234nnn
(0.272) (0.071) (0.018)Returnt�1 �0.014 �0.014 0.011n 0.011n 0.004nnn 0.004nnn
(0.025) (0.025) (0.006) (0.006) (0.001) (0.001)Sentimentt�1 0.266nnn 0.265nnn 0.254nnn 0.254nnn �0.001 �0.001
(0.084) (0.084) (0.027) (0.027) (0.002) (0.002)Volumet�1 �0.039 �0.063 �0.068nnn �0.078nnn 0.004nn 0.003
(0.065) (0.077) (0.019) (0.024) (0.002) (0.002)Constant 0.041 0.022 �0.026nnn �0.034nnn 0.003nnn 0.001
(0.034) (0.042) (0.005) (0.009) (0.001) (0.002)F-statistic 6.151 5.157 22.681 18.963 71.970 58.053
T. Hendershott et al. / Journal of Financial Economics 117 (2015) 249–287 273
announcement surprises. These findings suggest that institu-tions are producing value-relevant information for stocks andsupport the findings based on institutional holdings andtrading that institutions improve price efficiency (Badrinath,Kale, and Noe, 1995; Sias and Starks, 1997; Campbell,Ramadorai, and Schwartz, 2009; Boehmer and Kelley,2009).10 Our results also provide direct evidence onTetlock's (2010) finding that news reduces informationalasymmetry.
Regarding specific news types we find that whileinstitutions have price impact on macroeconomic newsdays they are not informed about this type of news, with
10 Prior literature using other measures of institutional trading findslimited evidence supporting institutions being informed (Griffin, Shu,and Topaloglu, 2012; Jegadeesh and Tang, 2010; Busse, Green, andJegadeesh, 2012). One explanation is that broader, more comprehensivemeasures of institutional data are needed (as also in Campbell,Ramadorai, and Schwartz, 2009).
the exception of news on economic indicators. On theother hand, institutions are informed about a range ofunexpected value-destroying events as well as earningsannouncement surprises. Finally, we show that institu-tions do not believe the media hype as defined by pressreleases and news stories that are reversed.
The source of institutions' informational advantage isdifficult to know. Their ability to predict news regardingearnings could arise from the ability to better processpublic information or from sources that should be pro-scribed by Reg FD. However, institutions' ability to forecastunexpected value-destroying events provides evidence infavor of the ability to better process public information.Further research on the sources of institutions' informa-tional advantages will continue to be important.
An important issue raised by our results is how toevaluate what constitutes true news. If some investorstrade on the news in advance of its publication, thenevidence showing a weak link between news and stock
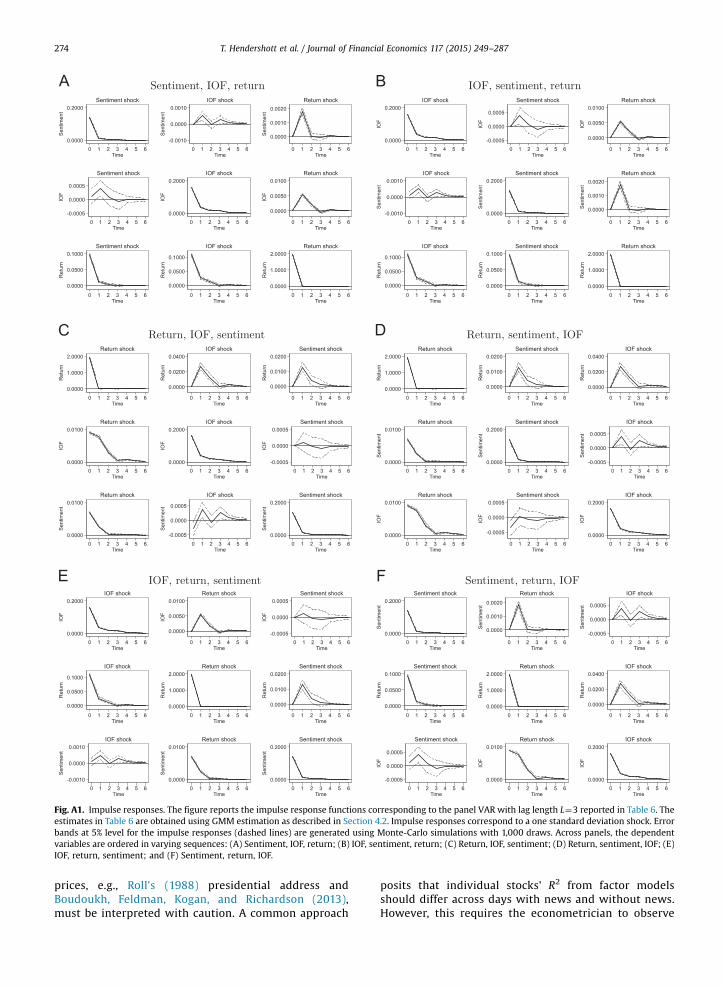
Fig. A1. Impulse responses. The figure reports the impulse response functions corresponding to the panel VAR with lag length L¼3 reported in Table 6. Theestimates in Table 6 are obtained using GMM estimation as described in Section 4.2. Impulse responses correspond to a one standard deviation shock. Errorbands at 5% level for the impulse responses (dashed lines) are generated using Monte-Carlo simulations with 1,000 draws. Across panels, the dependentvariables are ordered in varying sequences: (A) Sentiment, IOF, return; (B) IOF, sentiment, return; (C) Return, IOF, sentiment; (D) Return, sentiment, IOF; (E)IOF, return, sentiment; and (F) Sentiment, return, IOF.
T. Hendershott et al. / Journal of Financial Economics 117 (2015) 249–287274
prices, e.g., Roll's (1988) presidential address andBoudoukh, Feldman, Kogan, and Richardson (2013),must be interpreted with caution. A common approach
posits that individual stocks' R2 from factor modelsshould differ across days with news and without news.However, this requires the econometrician to observe
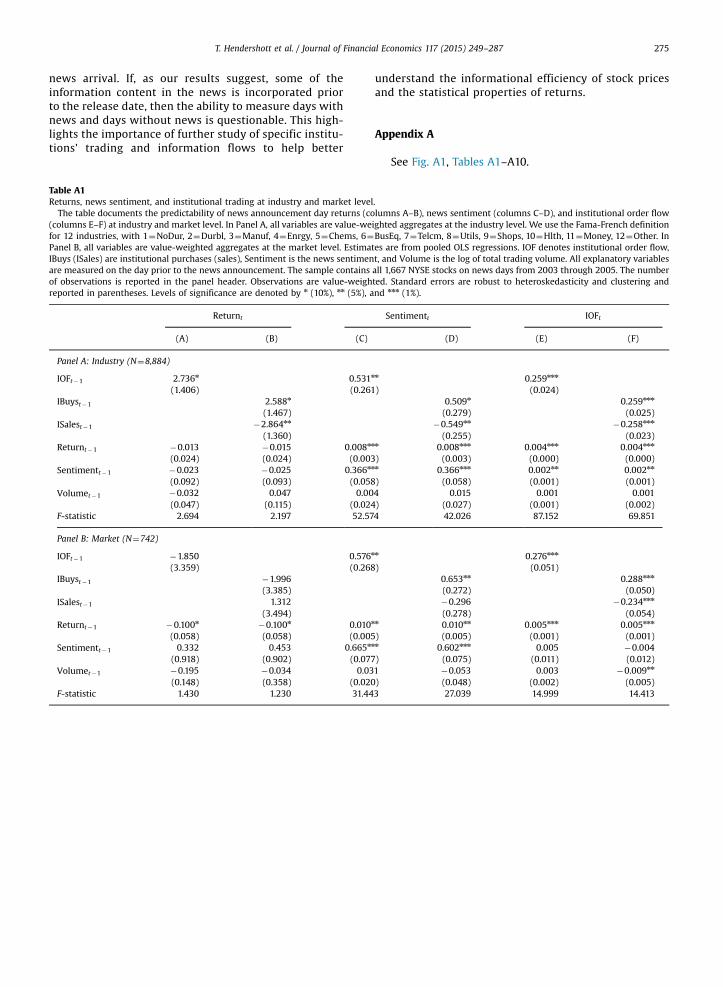
T. Hendershott et al. / Journal of Financial Economics 117 (2015) 249–287 275
news arrival. If, as our results suggest, some of theinformation content in the news is incorporated priorto the release date, then the ability to measure days withnews and days without news is questionable. This high-lights the importance of further study of specific institu-tions' trading and information flows to help better
Table A1Returns, news sentiment, and institutional trading at industry and market level
The table documents the predictability of news announcement day returns (co(columns E–F) at industry and market level. In Panel A, all variables are value-wefor 12 industries, with 1¼NoDur, 2¼Durbl, 3¼Manuf, 4¼Enrgy, 5¼Chems, 6¼Panel B, all variables are value-weighted aggregates at the market level. EstimaIBuys (ISales) are institutional purchases (sales), Sentiment is the news sentimenare measured on the day prior to the news announcement. The sample containsof observations is reported in the panel header. Observations are value-weighreported in parentheses. Levels of significance are denoted by n (10%), nn (5%), a
Returnt
(A) (B) (C)
Panel A: Industry (N¼8,884)
IOFt�1 2.736n 0.531n
(1.406) (0.261IBuyst�1 2.588n
(1.467)ISalest�1 �2.864nn
(1.360)Returnt�1 �0.013 �0.015 0.008nn
(0.024) (0.024) (0.003Sentimentt�1 �0.023 �0.025 0.366nn
(0.092) (0.093) (0.058Volumet�1 �0.032 0.047 0.00
(0.047) (0.115) (0.024F-statistic 2.694 2.197 52.57
Panel B: Market (N¼742)
IOFt�1 �1.850 0.576n
(3.359) (0.268IBuyst�1 �1.996
(3.385)ISalest�1 1.312
(3.494)Returnt�1 �0.100n �0.100n 0.010n
(0.058) (0.058) (0.005Sentimentt�1 0.332 0.453 0.665nn
(0.918) (0.902) (0.077Volumet�1 �0.195 �0.034 0.03
(0.148) (0.358) (0.020F-statistic 1.430 1.230 31.44
understand the informational efficiency of stock pricesand the statistical properties of returns.
Appendix A
See Fig. A1, Tables A1–A10.
.lumns A–B), news sentiment (columns C–D), and institutional order flowighted aggregates at the industry level. We use the Fama-French definitionBusEq, 7¼Telcm, 8¼Utils, 9¼Shops, 10¼Hlth, 11¼Money, 12¼Other. Intes are from pooled OLS regressions. IOF denotes institutional order flow,t, and Volume is the log of total trading volume. All explanatory variablesall 1,667 NYSE stocks on news days from 2003 through 2005. The numberted. Standard errors are robust to heteroskedasticity and clustering andnd nnn (1%).
Sentimentt IOFt
(D) (E) (F)
n 0.259nnn
) (0.024)0.509n 0.259nnn
(0.279) (0.025)�0.549nn �0.258nnn
(0.255) (0.023)n 0.008nnn 0.004nnn 0.004nnn
) (0.003) (0.000) (0.000)n 0.366nnn 0.002nn 0.002nn
) (0.058) (0.001) (0.001)4 0.015 0.001 0.001) (0.027) (0.001) (0.002)4 42.026 87.152 69.851
n 0.276nnn
) (0.051)0.653nn 0.288nnn
(0.272) (0.050)�0.296 �0.234nnn
(0.278) (0.054)n 0.010nn 0.005nnn 0.005nnn
) (0.005) (0.001) (0.001)n 0.602nnn 0.005 �0.004) (0.075) (0.011) (0.012)1 �0.053 0.003 �0.009nn
) (0.048) (0.002) (0.005)3 27.039 14.999 14.413
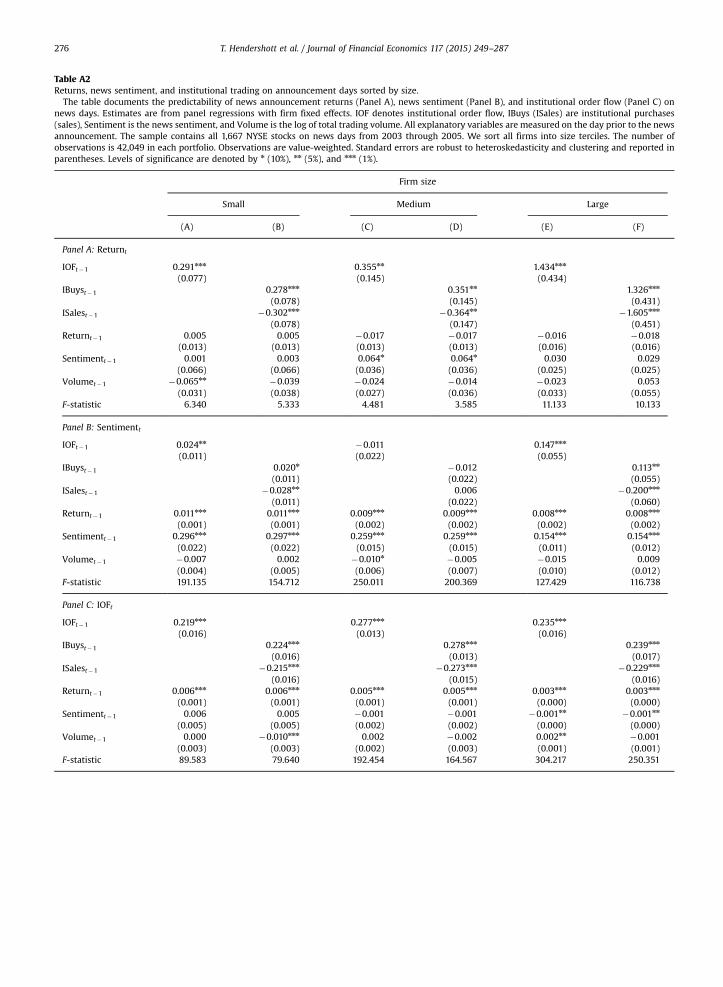
Table A2Returns, news sentiment, and institutional trading on announcement days sorted by size.
The table documents the predictability of news announcement returns (Panel A), news sentiment (Panel B), and institutional order flow (Panel C) onnews days. Estimates are from panel regressions with firm fixed effects. IOF denotes institutional order flow, IBuys (ISales) are institutional purchases(sales), Sentiment is the news sentiment, and Volume is the log of total trading volume. All explanatory variables are measured on the day prior to the newsannouncement. The sample contains all 1,667 NYSE stocks on news days from 2003 through 2005. We sort all firms into size terciles. The number ofobservations is 42,049 in each portfolio. Observations are value-weighted. Standard errors are robust to heteroskedasticity and clustering and reported inparentheses. Levels of significance are denoted by n (10%), nn (5%), and nnn (1%).
Firm size
Small Medium Large
(A) (B) (C) (D) (E) (F)
Panel A: Returnt
IOFt�1 0.291nnn 0.355nn 1.434nnn
(0.077) (0.145) (0.434)IBuyst�1 0.278nnn 0.351nn 1.326nnn
(0.078) (0.145) (0.431)ISalest�1 �0.302nnn �0.364nn �1.605nnn
(0.078) (0.147) (0.451)Returnt�1 0.005 0.005 �0.017 �0.017 �0.016 �0.018
(0.013) (0.013) (0.013) (0.013) (0.016) (0.016)Sentimentt�1 0.001 0.003 0.064n 0.064n 0.030 0.029
(0.066) (0.066) (0.036) (0.036) (0.025) (0.025)Volumet�1 �0.065nn �0.039 �0.024 �0.014 �0.023 0.053
(0.031) (0.038) (0.027) (0.036) (0.033) (0.055)F-statistic 6.340 5.333 4.481 3.585 11.133 10.133
Panel B: Sentimentt
IOFt�1 0.024nn �0.011 0.147nnn
(0.011) (0.022) (0.055)IBuyst�1 0.020n �0.012 0.113nn
(0.011) (0.022) (0.055)ISalest�1 �0.028nn 0.006 �0.200nnn
(0.011) (0.022) (0.060)Returnt�1 0.011nnn 0.011nnn 0.009nnn 0.009nnn 0.008nnn 0.008nnn
(0.001) (0.001) (0.002) (0.002) (0.002) (0.002)Sentimentt�1 0.296nnn 0.297nnn 0.259nnn 0.259nnn 0.154nnn 0.154nnn
(0.022) (0.022) (0.015) (0.015) (0.011) (0.012)Volumet�1 �0.007 0.002 �0.010n �0.005 �0.015 0.009
(0.004) (0.005) (0.006) (0.007) (0.010) (0.012)F-statistic 191.135 154.712 250.011 200.369 127.429 116.738
Panel C: IOFt
IOFt�1 0.219nnn 0.277nnn 0.235nnn
(0.016) (0.013) (0.016)IBuyst�1 0.224nnn 0.278nnn 0.239nnn
(0.016) (0.013) (0.017)ISalest�1 �0.215nnn �0.273nnn �0.229nnn
(0.016) (0.015) (0.016)Returnt�1 0.006nnn 0.006nnn 0.005nnn 0.005nnn 0.003nnn 0.003nnn
(0.001) (0.001) (0.001) (0.001) (0.000) (0.000)Sentimentt�1 0.006 0.005 �0.001 �0.001 �0.001nn �0.001nn
(0.005) (0.005) (0.002) (0.002) (0.000) (0.000)Volumet�1 0.000 �0.010nnn 0.002 �0.002 0.002nn �0.001
(0.003) (0.003) (0.002) (0.003) (0.001) (0.001)F-statistic 89.583 79.640 192.454 164.567 304.217 250.351
T. Hendershott et al. / Journal of Financial Economics 117 (2015) 249–287276
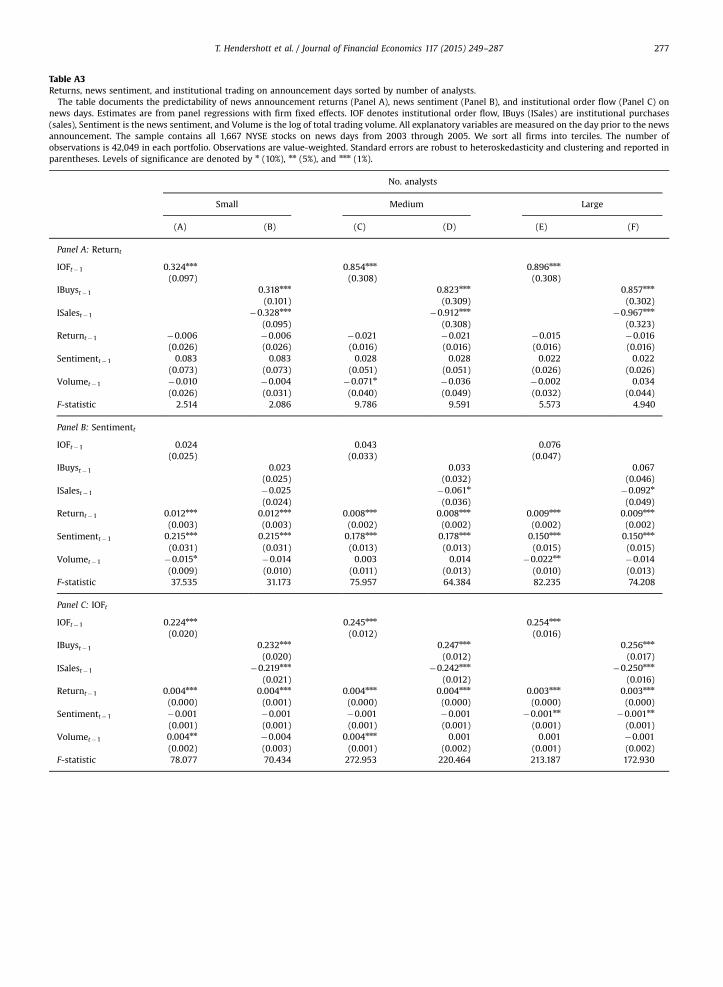
Table A3Returns, news sentiment, and institutional trading on announcement days sorted by number of analysts.
The table documents the predictability of news announcement returns (Panel A), news sentiment (Panel B), and institutional order flow (Panel C) onnews days. Estimates are from panel regressions with firm fixed effects. IOF denotes institutional order flow, IBuys (ISales) are institutional purchases(sales), Sentiment is the news sentiment, and Volume is the log of total trading volume. All explanatory variables are measured on the day prior to the newsannouncement. The sample contains all 1,667 NYSE stocks on news days from 2003 through 2005. We sort all firms into terciles. The number ofobservations is 42,049 in each portfolio. Observations are value-weighted. Standard errors are robust to heteroskedasticity and clustering and reported inparentheses. Levels of significance are denoted by n (10%), nn (5%), and nnn (1%).
No. analysts
Small Medium Large
(A) (B) (C) (D) (E) (F)
Panel A: Returnt
IOFt�1 0.324nnn 0.854nnn 0.896nnn
(0.097) (0.308) (0.308)IBuyst�1 0.318nnn 0.823nnn 0.857nnn
(0.101) (0.309) (0.302)ISalest�1 �0.328nnn �0.912nnn �0.967nnn
(0.095) (0.308) (0.323)Returnt�1 �0.006 �0.006 �0.021 �0.021 �0.015 �0.016
(0.026) (0.026) (0.016) (0.016) (0.016) (0.016)Sentimentt�1 0.083 0.083 0.028 0.028 0.022 0.022
(0.073) (0.073) (0.051) (0.051) (0.026) (0.026)Volumet�1 �0.010 �0.004 �0.071n �0.036 �0.002 0.034
(0.026) (0.031) (0.040) (0.049) (0.032) (0.044)F-statistic 2.514 2.086 9.786 9.591 5.573 4.940
Panel B: Sentimentt
IOFt�1 0.024 0.043 0.076(0.025) (0.033) (0.047)
IBuyst�1 0.023 0.033 0.067(0.025) (0.032) (0.046)
ISalest�1 �0.025 �0.061n �0.092n
(0.024) (0.036) (0.049)Returnt�1 0.012nnn 0.012nnn 0.008nnn 0.008nnn 0.009nnn 0.009nnn
(0.003) (0.003) (0.002) (0.002) (0.002) (0.002)Sentimentt�1 0.215nnn 0.215nnn 0.178nnn 0.178nnn 0.150nnn 0.150nnn
(0.031) (0.031) (0.013) (0.013) (0.015) (0.015)Volumet�1 �0.015n �0.014 0.003 0.014 �0.022nn �0.014
(0.009) (0.010) (0.011) (0.013) (0.010) (0.013)F-statistic 37.535 31.173 75.957 64.384 82.235 74.208
Panel C: IOFt
IOFt�1 0.224nnn 0.245nnn 0.254nnn
(0.020) (0.012) (0.016)IBuyst�1 0.232nnn 0.247nnn 0.256nnn
(0.020) (0.012) (0.017)ISalest�1 �0.219nnn �0.242nnn �0.250nnn
(0.021) (0.012) (0.016)Returnt�1 0.004nnn 0.004nnn 0.004nnn 0.004nnn 0.003nnn 0.003nnn
(0.000) (0.001) (0.000) (0.000) (0.000) (0.000)Sentimentt�1 �0.001 �0.001 �0.001 �0.001 �0.001nn �0.001nn
(0.001) (0.001) (0.001) (0.001) (0.001) (0.001)Volumet�1 0.004nn �0.004 0.004nnn 0.001 0.001 �0.001
(0.002) (0.003) (0.001) (0.002) (0.001) (0.002)F-statistic 78.077 70.434 272.953 220.464 213.187 172.930
T. Hendershott et al. / Journal of Financial Economics 117 (2015) 249–287 277
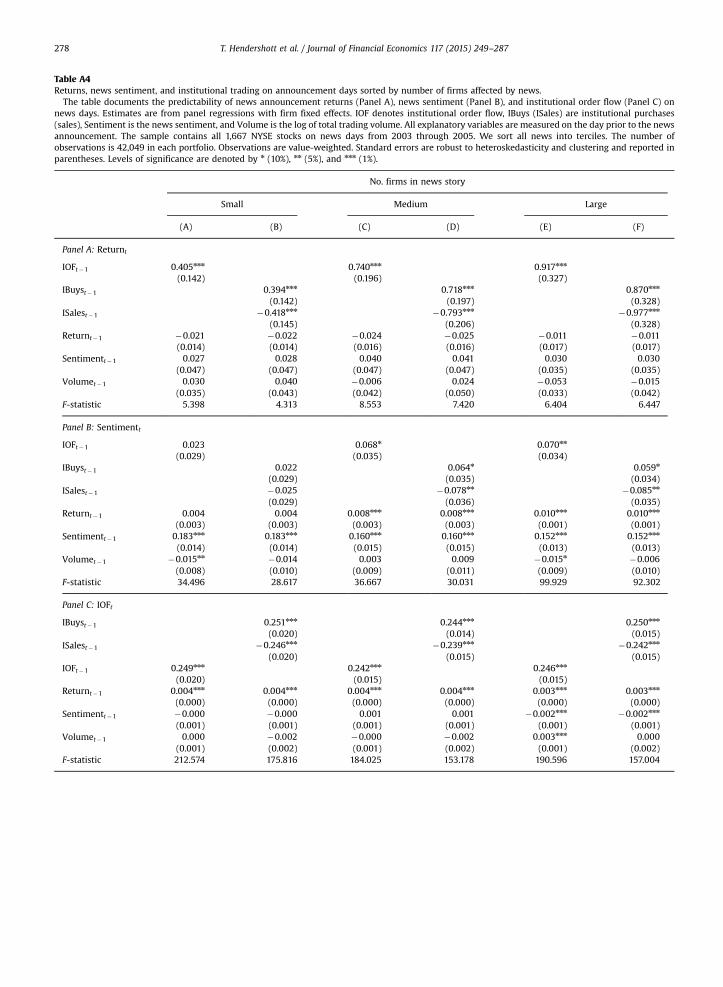
Table A4Returns, news sentiment, and institutional trading on announcement days sorted by number of firms affected by news.
The table documents the predictability of news announcement returns (Panel A), news sentiment (Panel B), and institutional order flow (Panel C) onnews days. Estimates are from panel regressions with firm fixed effects. IOF denotes institutional order flow, IBuys (ISales) are institutional purchases(sales), Sentiment is the news sentiment, and Volume is the log of total trading volume. All explanatory variables are measured on the day prior to the newsannouncement. The sample contains all 1,667 NYSE stocks on news days from 2003 through 2005. We sort all news into terciles. The number ofobservations is 42,049 in each portfolio. Observations are value-weighted. Standard errors are robust to heteroskedasticity and clustering and reported inparentheses. Levels of significance are denoted by n (10%), nn (5%), and nnn (1%).
No. firms in news story
Small Medium Large
(A) (B) (C) (D) (E) (F)
Panel A: Returnt
IOFt�1 0.405nnn 0.740nnn 0.917nnn
(0.142) (0.196) (0.327)IBuyst�1 0.394nnn 0.718nnn 0.870nnn
(0.142) (0.197) (0.328)ISalest�1 �0.418nnn �0.793nnn �0.977nnn
(0.145) (0.206) (0.328)Returnt�1 �0.021 �0.022 �0.024 �0.025 �0.011 �0.011
(0.014) (0.014) (0.016) (0.016) (0.017) (0.017)Sentimentt�1 0.027 0.028 0.040 0.041 0.030 0.030
(0.047) (0.047) (0.047) (0.047) (0.035) (0.035)Volumet�1 0.030 0.040 �0.006 0.024 �0.053 �0.015
(0.035) (0.043) (0.042) (0.050) (0.033) (0.042)F-statistic 5.398 4.313 8.553 7.420 6.404 6.447
Panel B: Sentimentt
IOFt�1 0.023 0.068n 0.070nn
(0.029) (0.035) (0.034)IBuyst�1 0.022 0.064n 0.059n
(0.029) (0.035) (0.034)ISalest�1 �0.025 �0.078nn �0.085nn
(0.029) (0.036) (0.035)Returnt�1 0.004 0.004 0.008nnn 0.008nnn 0.010nnn 0.010nnn
(0.003) (0.003) (0.003) (0.003) (0.001) (0.001)Sentimentt�1 0.183nnn 0.183nnn 0.160nnn 0.160nnn 0.152nnn 0.152nnn
(0.014) (0.014) (0.015) (0.015) (0.013) (0.013)Volumet�1 �0.015nn �0.014 0.003 0.009 �0.015n �0.006
(0.008) (0.010) (0.009) (0.011) (0.009) (0.010)F-statistic 34.496 28.617 36.667 30.031 99.929 92.302
Panel C: IOFt
IBuyst�1 0.251nnn 0.244nnn 0.250nnn
(0.020) (0.014) (0.015)ISalest�1 �0.246nnn �0.239nnn �0.242nnn
(0.020) (0.015) (0.015)IOFt�1 0.249nnn 0.242nnn 0.246nnn
(0.020) (0.015) (0.015)Returnt�1 0.004nnn 0.004nnn 0.004nnn 0.004nnn 0.003nnn 0.003nnn
(0.000) (0.000) (0.000) (0.000) (0.000) (0.000)Sentimentt�1 �0.000 �0.000 0.001 0.001 �0.002nnn �0.002nnn
(0.001) (0.001) (0.001) (0.001) (0.001) (0.001)Volumet�1 0.000 �0.002 �0.000 �0.002 0.003nnn 0.000
(0.001) (0.002) (0.001) (0.002) (0.001) (0.002)F-statistic 212.574 175.816 184.025 153.178 190.596 157.004
T. Hendershott et al. / Journal of Financial Economics 117 (2015) 249–287278
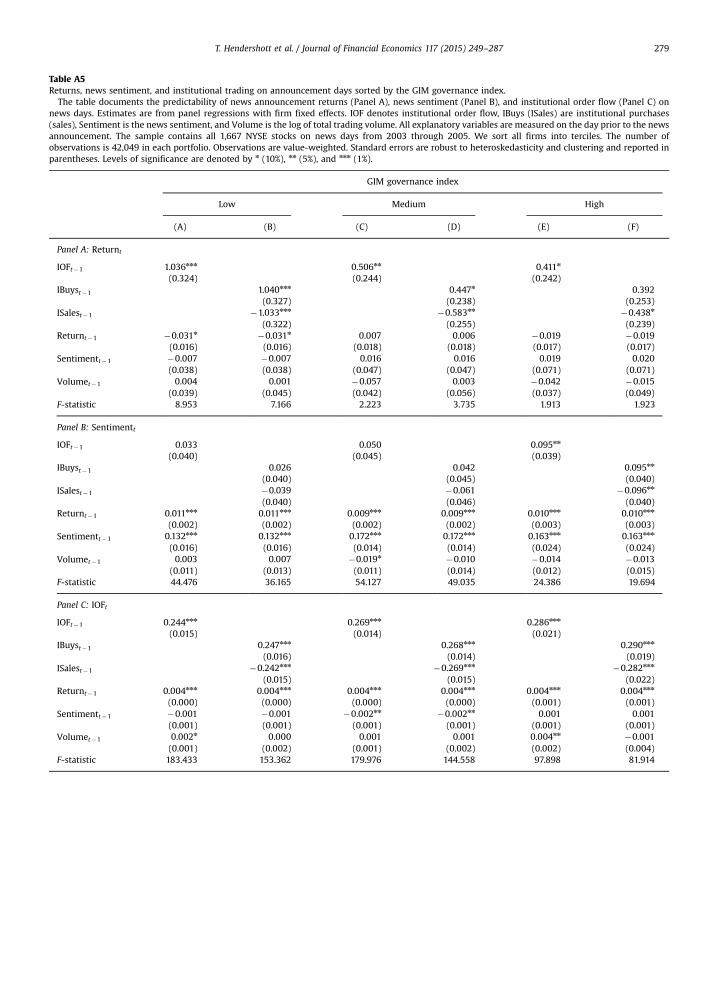
Table A5Returns, news sentiment, and institutional trading on announcement days sorted by the GIM governance index.
The table documents the predictability of news announcement returns (Panel A), news sentiment (Panel B), and institutional order flow (Panel C) onnews days. Estimates are from panel regressions with firm fixed effects. IOF denotes institutional order flow, IBuys (ISales) are institutional purchases(sales), Sentiment is the news sentiment, and Volume is the log of total trading volume. All explanatory variables are measured on the day prior to the newsannouncement. The sample contains all 1,667 NYSE stocks on news days from 2003 through 2005. We sort all firms into terciles. The number ofobservations is 42,049 in each portfolio. Observations are value-weighted. Standard errors are robust to heteroskedasticity and clustering and reported inparentheses. Levels of significance are denoted by n (10%), nn (5%), and nnn (1%).
GIM governance index
Low Medium High
(A) (B) (C) (D) (E) (F)
Panel A: Returnt
IOFt�1 1.036nnn 0.506nn 0.411n
(0.324) (0.244) (0.242)IBuyst�1 1.040nnn 0.447n 0.392
(0.327) (0.238) (0.253)ISalest�1 �1.033nnn �0.583nn �0.438n
(0.322) (0.255) (0.239)Returnt�1 �0.031n �0.031n 0.007 0.006 �0.019 �0.019
(0.016) (0.016) (0.018) (0.018) (0.017) (0.017)Sentimentt�1 �0.007 �0.007 0.016 0.016 0.019 0.020
(0.038) (0.038) (0.047) (0.047) (0.071) (0.071)Volumet�1 0.004 0.001 �0.057 0.003 �0.042 �0.015
(0.039) (0.045) (0.042) (0.056) (0.037) (0.049)F-statistic 8.953 7.166 2.223 3.735 1.913 1.923
Panel B: Sentimentt
IOFt�1 0.033 0.050 0.095nn
(0.040) (0.045) (0.039)IBuyst�1 0.026 0.042 0.095nn
(0.040) (0.045) (0.040)ISalest�1 �0.039 �0.061 �0.096nn
(0.040) (0.046) (0.040)Returnt�1 0.011nnn 0.011nnn 0.009nnn 0.009nnn 0.010nnn 0.010nnn
(0.002) (0.002) (0.002) (0.002) (0.003) (0.003)Sentimentt�1 0.132nnn 0.132nnn 0.172nnn 0.172nnn 0.163nnn 0.163nnn
(0.016) (0.016) (0.014) (0.014) (0.024) (0.024)Volumet�1 0.003 0.007 �0.019n �0.010 �0.014 �0.013
(0.011) (0.013) (0.011) (0.014) (0.012) (0.015)F-statistic 44.476 36.165 54.127 49.035 24.386 19.694
Panel C: IOFt
IOFt�1 0.244nnn 0.269nnn 0.286nnn
(0.015) (0.014) (0.021)IBuyst�1 0.247nnn 0.268nnn 0.290nnn
(0.016) (0.014) (0.019)ISalest�1 �0.242nnn �0.269nnn �0.282nnn
(0.015) (0.015) (0.022)Returnt�1 0.004nnn 0.004nnn 0.004nnn 0.004nnn 0.004nnn 0.004nnn
(0.000) (0.000) (0.000) (0.000) (0.001) (0.001)Sentimentt�1 �0.001 �0.001 �0.002nn �0.002nn 0.001 0.001
(0.001) (0.001) (0.001) (0.001) (0.001) (0.001)Volumet�1 0.002n 0.000 0.001 0.001 0.004nn �0.001
(0.001) (0.002) (0.001) (0.002) (0.002) (0.004)F-statistic 183.433 153.362 179.976 144.558 97.898 81.914
T. Hendershott et al. / Journal of Financial Economics 117 (2015) 249–287 279
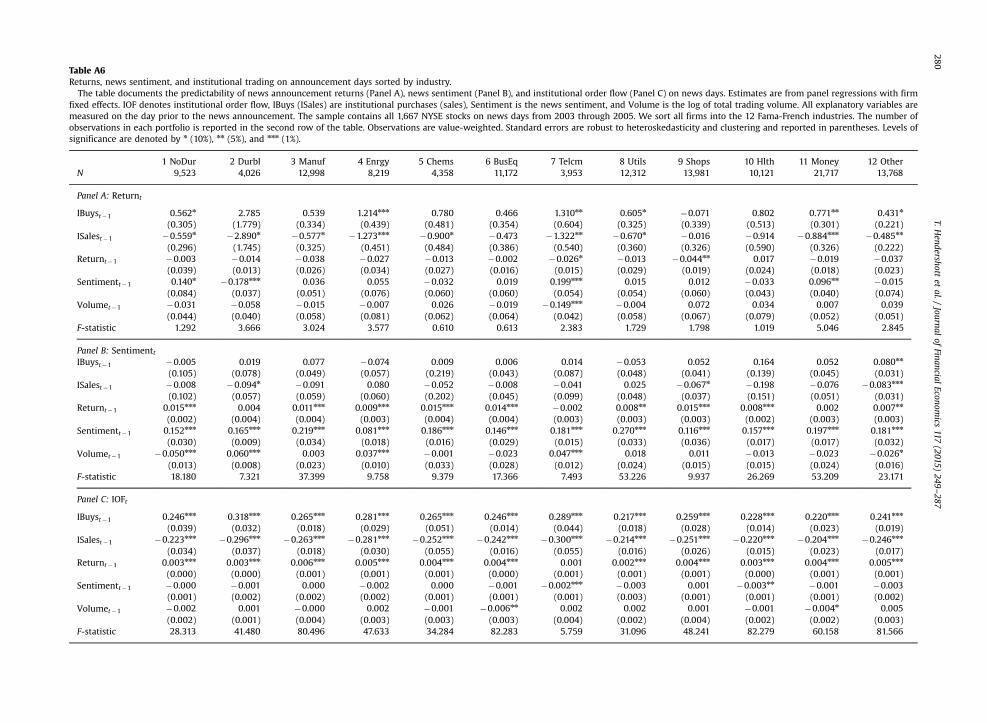
Table A6Returns, news sentiment, and institutional trading on announcement days sorted by industry.
The table documents the predictability of news announcement returns (Panel A), news sentiment (Panel B), and institutional order flow (Panel C) on news days. Estimates are from panel regressions with firmfixed effects. IOF denotes institutional order flow, IBuys (ISales) are institutional purchases (sales), Sentiment is the news sentiment, and Volume is the log of total trading volume. All explanatory variables aremeasured on the day prior to the news announcement. The sample contains all 1,667 NYSE stocks on news days from 2003 through 2005. We sort all firms into the 12 Fama-French industries. The number ofobservations in each portfolio is reported in the second row of the table. Observations are value-weighted. Standard errors are robust to heteroskedasticity and clustering and reported in parentheses. Levels ofsignificance are denoted by n (10%), nn (5%), and nnn (1%).
1 NoDur 2 Durbl 3 Manuf 4 Enrgy 5 Chems 6 BusEq 7 Telcm 8 Utils 9 Shops 10 Hlth 11 Money 12 OtherN 9,523 4,026 12,998 8,219 4,358 11,172 3,953 12,312 13,981 10,121 21,717 13,768
Panel A: Returnt
IBuyst�1 0.562n 2.785 0.539 1.214nnn 0.780 0.466 1.310nn 0.605n �0.071 0.802 0.771nn 0.431n
(0.305) (1.779) (0.334) (0.439) (0.481) (0.354) (0.604) (0.325) (0.339) (0.513) (0.301) (0.221)ISalest�1 �0.559n �2.890n �0.577n �1.273nnn �0.900n �0.473 �1.322nn �0.670n �0.016 �0.914 �0.884nnn �0.485nn
(0.296) (1.745) (0.325) (0.451) (0.484) (0.386) (0.540) (0.360) (0.326) (0.590) (0.326) (0.222)Returnt�1 �0.003 �0.014 �0.038 �0.027 �0.013 �0.002 �0.026n �0.013 �0.044nn 0.017 �0.019 �0.037
(0.039) (0.013) (0.026) (0.034) (0.027) (0.016) (0.015) (0.029) (0.019) (0.024) (0.018) (0.023)Sentimentt�1 0.140n �0.178nnn 0.036 0.055 �0.032 0.019 0.199nnn 0.015 0.012 �0.033 0.096nn �0.015
(0.084) (0.037) (0.051) (0.076) (0.060) (0.060) (0.054) (0.054) (0.060) (0.043) (0.040) (0.074)Volumet�1 �0.031 �0.058 �0.015 �0.007 0.026 �0.019 �0.149nnn �0.004 0.072 0.034 0.007 0.039
(0.044) (0.040) (0.058) (0.081) (0.062) (0.064) (0.042) (0.058) (0.067) (0.079) (0.052) (0.051)F-statistic 1.292 3.666 3.024 3.577 0.610 0.613 2.383 1.729 1.798 1.019 5.046 2.845
Panel B: SentimenttIBuyst�1 �0.005 0.019 0.077 �0.074 0.009 0.006 0.014 �0.053 0.052 0.164 0.052 0.080nn
(0.105) (0.078) (0.049) (0.057) (0.219) (0.043) (0.087) (0.048) (0.041) (0.139) (0.045) (0.031)ISalest�1 �0.008 �0.094n �0.091 0.080 �0.052 �0.008 �0.041 0.025 �0.067n �0.198 �0.076 �0.083nnn
(0.102) (0.057) (0.059) (0.060) (0.202) (0.045) (0.099) (0.048) (0.037) (0.151) (0.051) (0.031)Returnt�1 0.015nnn 0.004 0.011nnn 0.009nnn 0.015nnn 0.014nnn �0.002 0.008nn 0.015nnn 0.008nnn 0.002 0.007nn
(0.002) (0.004) (0.004) (0.003) (0.004) (0.004) (0.003) (0.003) (0.003) (0.002) (0.003) (0.003)Sentimentt�1 0.152nnn 0.165nnn 0.219nnn 0.081nnn 0.186nnn 0.146nnn 0.181nnn 0.270nnn 0.116nnn 0.157nnn 0.197nnn 0.181nnn
(0.030) (0.009) (0.034) (0.018) (0.016) (0.029) (0.015) (0.033) (0.036) (0.017) (0.017) (0.032)Volumet�1 �0.050nnn 0.060nnn 0.003 0.037nnn �0.001 �0.023 0.047nnn 0.018 0.011 �0.013 �0.023 �0.026n
(0.013) (0.008) (0.023) (0.010) (0.033) (0.028) (0.012) (0.024) (0.015) (0.015) (0.024) (0.016)F-statistic 18.180 7.321 37.399 9.758 9.379 17.366 7.493 53.226 9.937 26.269 53.209 23.171
Panel C: IOFt
IBuyst�1 0.246nnn 0.318nnn 0.265nnn 0.281nnn 0.265nnn 0.246nnn 0.289nnn 0.217nnn 0.259nnn 0.228nnn 0.220nnn 0.241nnn
(0.039) (0.032) (0.018) (0.029) (0.051) (0.014) (0.044) (0.018) (0.028) (0.014) (0.023) (0.019)ISalest�1 �0.223nnn �0.296nnn �0.263nnn �0.281nnn �0.252nnn �0.242nnn �0.300nnn �0.214nnn �0.251nnn �0.220nnn �0.204nnn �0.246nnn
(0.034) (0.037) (0.018) (0.030) (0.055) (0.016) (0.055) (0.016) (0.026) (0.015) (0.023) (0.017)Returnt�1 0.003nnn 0.003nnn 0.006nnn 0.005nnn 0.004nnn 0.004nnn 0.001 0.002nnn 0.004nnn 0.003nnn 0.004nnn 0.005nnn
(0.000) (0.000) (0.001) (0.001) (0.001) (0.000) (0.001) (0.001) (0.001) (0.000) (0.001) (0.001)Sentimentt�1 �0.000 �0.001 0.000 �0.002 0.000 �0.001 �0.002nnn �0.003 0.001 �0.003nn �0.001 �0.003
(0.001) (0.002) (0.002) (0.002) (0.001) (0.001) (0.001) (0.003) (0.001) (0.001) (0.001) (0.002)Volumet�1 �0.002 0.001 �0.000 0.002 �0.001 �0.006nn 0.002 0.002 0.001 �0.001 �0.004n 0.005
(0.002) (0.001) (0.004) (0.003) (0.003) (0.003) (0.004) (0.002) (0.004) (0.002) (0.002) (0.003)F-statistic 28.313 41.480 80.496 47.633 34.284 82.283 5.759 31.096 48.241 82.279 60.158 81.566
T.Hendershott
etal./
Journalof
FinancialEconom
ics117
(2015)249
–287280
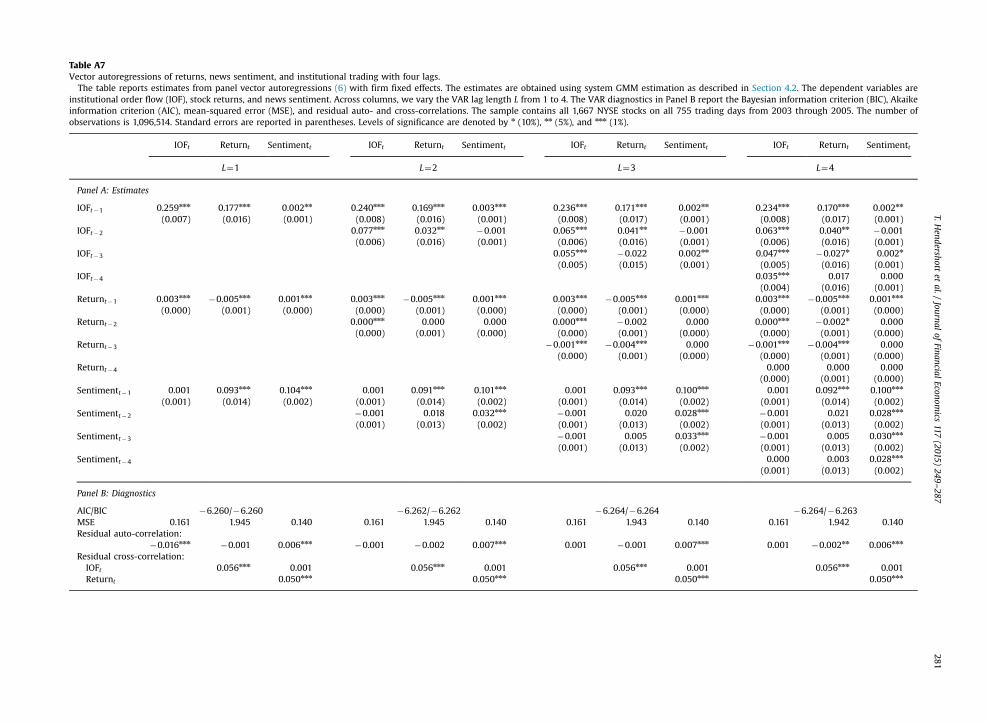
Table A7Vector autoregressions of returns, news sentiment, and institutional trading with four lags.
The table reports estimates from panel vector autoregressions (6) with firm fixed effects. The estimates are obtained using system GMM estimation as described in Section 4.2. The dependent variables areinstitutional order flow (IOF), stock returns, and news sentiment. Across columns, we vary the VAR lag length L from 1 to 4. The VAR diagnostics in Panel B report the Bayesian information criterion (BIC), Akaikeinformation criterion (AIC), mean-squared error (MSE), and residual auto- and cross-correlations. The sample contains all 1,667 NYSE stocks on all 755 trading days from 2003 through 2005. The number ofobservations is 1,096,514. Standard errors are reported in parentheses. Levels of significance are denoted by n (10%), nn (5%), and nnn (1%).
IOFt Returnt Sentimentt IOFt Returnt Sentimentt IOFt Returnt Sentimentt IOFt Returnt Sentimentt
L¼1 L¼2 L¼3 L¼4
Panel A: Estimates
IOFt�1 0.259nnn 0.177nnn 0.002nn 0.240nnn 0.169nnn 0.003nnn 0.236nnn 0.171nnn 0.002nn 0.234nnn 0.170nnn 0.002nn
(0.007) (0.016) (0.001) (0.008) (0.016) (0.001) (0.008) (0.017) (0.001) (0.008) (0.017) (0.001)IOFt�2 0.077nnn 0.032nn �0.001 0.065nnn 0.041nn �0.001 0.063nnn 0.040nn �0.001
(0.006) (0.016) (0.001) (0.006) (0.016) (0.001) (0.006) (0.016) (0.001)IOFt�3 0.055nnn �0.022 0.002nn 0.047nnn �0.027n 0.002n
(0.005) (0.015) (0.001) (0.005) (0.016) (0.001)IOFt�4 0.035nnn 0.017 0.000
(0.004) (0.016) (0.001)Returnt�1 0.003nnn �0.005nnn 0.001nnn 0.003nnn �0.005nnn 0.001nnn 0.003nnn �0.005nnn 0.001nnn 0.003nnn �0.005nnn 0.001nnn
(0.000) (0.001) (0.000) (0.000) (0.001) (0.000) (0.000) (0.001) (0.000) (0.000) (0.001) (0.000)Returnt�2 0.000nnn 0.000 0.000 0.000nnn �0.002 0.000 0.000nnn �0.002n 0.000
(0.000) (0.001) (0.000) (0.000) (0.001) (0.000) (0.000) (0.001) (0.000)Returnt�3 �0.001nnn �0.004nnn 0.000 �0.001nnn �0.004nnn 0.000
(0.000) (0.001) (0.000) (0.000) (0.001) (0.000)Returnt�4 0.000 0.000 0.000
(0.000) (0.001) (0.000)Sentimentt�1 0.001 0.093nnn 0.104nnn 0.001 0.091nnn 0.101nnn 0.001 0.093nnn 0.100nnn 0.001 0.092nnn 0.100nnn
(0.001) (0.014) (0.002) (0.001) (0.014) (0.002) (0.001) (0.014) (0.002) (0.001) (0.014) (0.002)Sentimentt�2 �0.001 0.018 0.032nnn �0.001 0.020 0.028nnn �0.001 0.021 0.028nnn
(0.001) (0.013) (0.002) (0.001) (0.013) (0.002) (0.001) (0.013) (0.002)Sentimentt�3 �0.001 0.005 0.033nnn �0.001 0.005 0.030nnn
(0.001) (0.013) (0.002) (0.001) (0.013) (0.002)Sentimentt�4 0.000 0.003 0.028nnn
(0.001) (0.013) (0.002)
Panel B: Diagnostics
AIC/BIC �6.260/�6.260 �6.262/�6.262 �6.264/�6.264 �6.264/�6.263MSE 0.161 1.945 0.140 0.161 1.945 0.140 0.161 1.943 0.140 0.161 1.942 0.140Residual auto-correlation:
�0.016nnn �0.001 0.006nnn �0.001 �0.002 0.007nnn 0.001 �0.001 0.007nnn 0.001 �0.002nn 0.006nnn
Residual cross-correlation:IOFt 0.056nnn 0.001 0.056nnn 0.001 0.056nnn 0.001 0.056nnn 0.001Returnt 0.050nnn 0.050nnn 0.050nnn 0.050nnn
T.Hendershott
etal./
Journalof
FinancialEconom
ics117
(2015)249
–287281
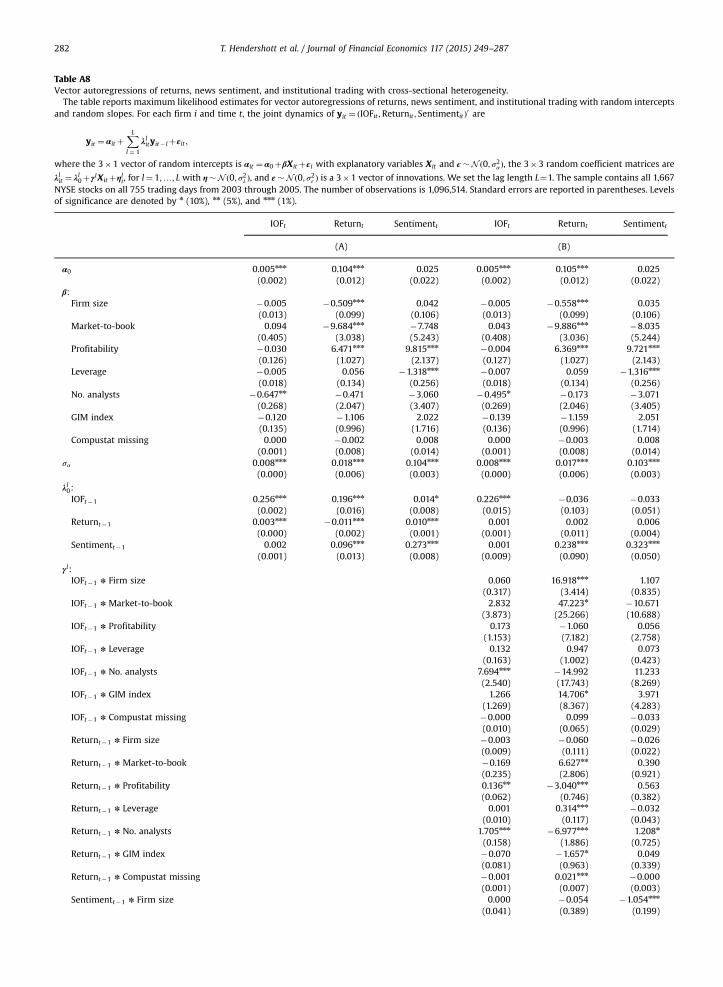
Table A8Vector autoregressions of returns, news sentiment, and institutional trading with cross-sectional heterogeneity.
The table reports maximum likelihood estimates for vector autoregressions of returns, news sentiment, and institutional trading with random interceptsand random slopes. For each firm i and time t, the joint dynamics of yit ¼ ðIOFit ;Returnit ; Sentimentit Þ0 are
yit ¼ αitþXLl ¼ 1
λlityit� lþεit ;
where the 3�1 vector of random intercepts is αit ¼ α0þβX itþϵi with explanatory variables Xit and ϵ�N ð0; σ2α Þ, the 3�3 random coefficient matrices are
λlit ¼ λl0þγlX itþηli, for l¼ 1;…; L with η�N ð0; σ2λ Þ, and ε�N ð0; σ2ε Þ is a 3�1 vector of innovations. We set the lag length L¼1. The sample contains all 1,667NYSE stocks on all 755 trading days from 2003 through 2005. The number of observations is 1,096,514. Standard errors are reported in parentheses. Levelsof significance are denoted by n (10%), nn (5%), and nnn (1%).
IOFt Returnt Sentimentt IOFt Returnt Sentimentt
(A) (B)
α0 0.005nnn 0.104nnn 0.025 0.005nnn 0.105nnn 0.025(0.002) (0.012) (0.022) (0.002) (0.012) (0.022)
β:Firm size �0.005 �0.509nnn 0.042 �0.005 �0.558nnn 0.035
(0.013) (0.099) (0.106) (0.013) (0.099) (0.106)Market-to-book 0.094 �9.684nnn �7.748 0.043 �9.886nnn �8.035
(0.405) (3.038) (5.243) (0.408) (3.036) (5.244)Profitability �0.030 6.471nnn 9.815nnn �0.004 6.369nnn 9.721nnn
(0.126) (1.027) (2.137) (0.127) (1.027) (2.143)Leverage �0.005 0.056 �1.318nnn �0.007 0.059 �1.316nnn
(0.018) (0.134) (0.256) (0.018) (0.134) (0.256)No. analysts �0.647nn �0.471 �3.060 �0.495n �0.173 �3.071
(0.268) (2.047) (3.407) (0.269) (2.046) (3.405)GIM index �0.120 �1.106 2.022 �0.139 �1.159 2.051
(0.135) (0.996) (1.716) (0.136) (0.996) (1.714)Compustat missing 0.000 �0.002 0.008 0.000 �0.003 0.008
(0.001) (0.008) (0.014) (0.001) (0.008) (0.014)σα 0.008nnn 0.018nnn 0.104nnn 0.008nnn 0.017nnn 0.103nnn
(0.000) (0.006) (0.003) (0.000) (0.006) (0.003)
λl0:IOFt�1 0.256nnn 0.196nnn 0.014n 0.226nnn �0.036 �0.033
(0.002) (0.016) (0.008) (0.015) (0.103) (0.051)Returnt�1 0.003nnn �0.011nnn 0.010nnn 0.001 0.002 0.006
(0.000) (0.002) (0.001) (0.001) (0.011) (0.004)Sentimentt�1 0.002 0.096nnn 0.273nnn 0.001 0.238nnn 0.323nnn
(0.001) (0.013) (0.008) (0.009) (0.090) (0.050)γl:
IOFt�1 n Firm size 0.060 16.918nnn 1.107(0.317) (3.414) (0.835)
IOFt�1 n Market-to-book 2.832 47.223n �10.671(3.873) (25.266) (10.688)
IOFt�1 n Profitability 0.173 �1.060 0.056(1.153) (7.182) (2.758)
IOFt�1 n Leverage 0.132 0.947 0.073(0.163) (1.002) (0.423)
IOFt�1 n No. analysts 7.694nnn �14.992 11.233(2.540) (17.743) (8.269)
IOFt�1 n GIM index 1.266 14.706n 3.971(1.269) (8.367) (4.283)
IOFt�1 n Compustat missing �0.000 0.099 �0.033(0.010) (0.065) (0.029)
Returnt�1 n Firm size �0.003 �0.060 �0.026(0.009) (0.111) (0.022)
Returnt�1 n Market-to-book �0.169 6.627nn 0.390(0.235) (2.806) (0.921)
Returnt�1 n Profitability 0.136nn �3.040nnn 0.563(0.062) (0.746) (0.382)
Returnt�1 n Leverage 0.001 0.314nnn �0.032(0.010) (0.117) (0.043)
Returnt�1 n No. analysts 1.705nnn �6.977nnn 1.208n
(0.158) (1.886) (0.725)Returnt�1 n GIM index �0.070 �1.657n 0.049
(0.081) (0.963) (0.339)Returnt�1 n Compustat missing �0.001 0.021nnn �0.000
(0.001) (0.007) (0.003)Sentimentt�1 n Firm size 0.000 �0.054 �1.054nnn
(0.041) (0.389) (0.199)
T. Hendershott et al. / Journal of Financial Economics 117 (2015) 249–287282
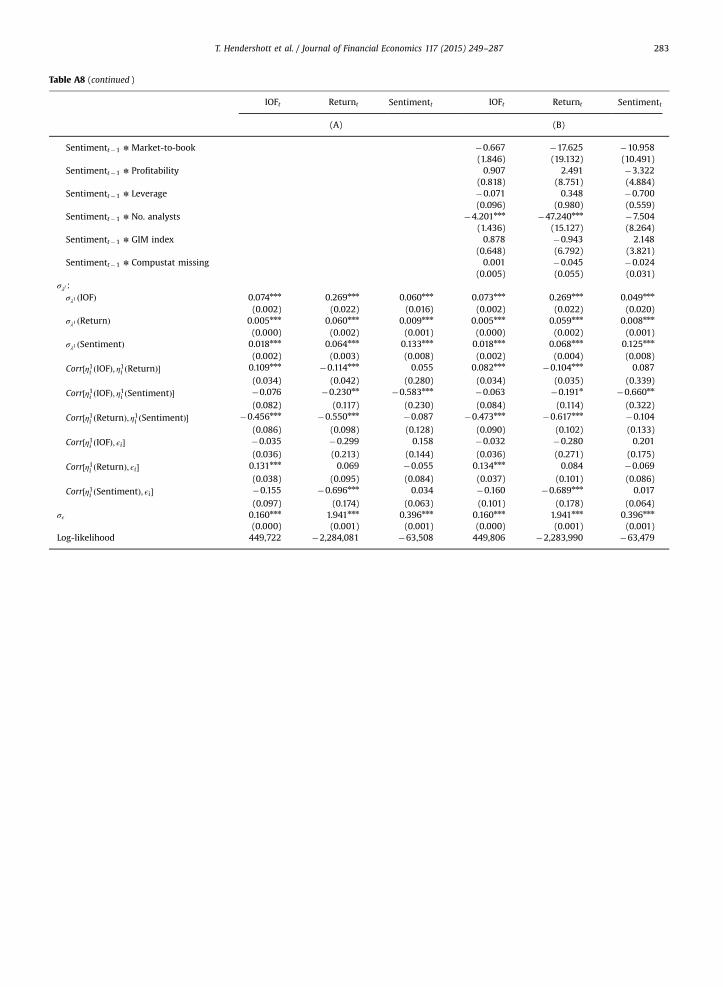
Table A8 (continued )
IOFt Returnt Sentimentt IOFt Returnt Sentimentt
(A) (B)
Sentimentt�1 n Market-to-book �0.667 �17.625 �10.958(1.846) (19.132) (10.491)
Sentimentt�1 n Profitability 0.907 2.491 �3.322(0.818) (8.751) (4.884)
Sentimentt�1 n Leverage �0.071 0.348 �0.700(0.096) (0.980) (0.559)
Sentimentt�1 n No. analysts �4.201nnn �47.240nnn �7.504(1.436) (15.127) (8.264)
Sentimentt�1 n GIM index 0.878 �0.943 2.148(0.648) (6.792) (3.821)
Sentimentt�1 n Compustat missing 0.001 �0.045 �0.024(0.005) (0.055) (0.031)
σλl :σλ1 ðIOFÞ 0.074nnn 0.269nnn 0.060nnn 0.073nnn 0.269nnn 0.049nnn
(0.002) (0.022) (0.016) (0.002) (0.022) (0.020)σλ1 ðReturnÞ 0.005nnn 0.060nnn 0.009nnn 0.005nnn 0.059nnn 0.008nnn
(0.000) (0.002) (0.001) (0.000) (0.002) (0.001)σλ1 ðSentimentÞ 0.018nnn 0.064nnn 0.133nnn 0.018nnn 0.068nnn 0.125nnn
(0.002) (0.003) (0.008) (0.002) (0.004) (0.008)Corr½η1i ðIOFÞ; η1i ðReturnÞ� 0.109nnn �0.114nnn 0.055 0.082nnn �0.104nnn 0.087
(0.034) (0.042) (0.280) (0.034) (0.035) (0.339)Corr½η1i ðIOFÞ; η1i ðSentimentÞ� �0.076 �0.230nn �0.583nnn �0.063 �0.191n �0.660nn
(0.082) (0.117) (0.230) (0.084) (0.114) (0.322)Corr½η1i ðReturnÞ; η1i ðSentimentÞ� �0.456nnn �0.550nnn �0.087 �0.473nnn �0.617nnn �0.104
(0.086) (0.098) (0.128) (0.090) (0.102) (0.133)Corr½η1i ðIOFÞ; ϵi� �0.035 �0.299 0.158 �0.032 �0.280 0.201
(0.036) (0.213) (0.144) (0.036) (0.271) (0.175)Corr½η1i ðReturnÞ; ϵi� 0.131nnn 0.069 �0.055 0.134nnn 0.084 �0.069
(0.038) (0.095) (0.084) (0.037) (0.101) (0.086)Corr½η1i ðSentimentÞ; ϵi� �0.155 �0.696nnn 0.034 �0.160 �0.689nnn 0.017
(0.097) (0.174) (0.063) (0.101) (0.178) (0.064)σε 0.160nnn 1.941nnn 0.396nnn 0.160nnn 1.941nnn 0.396nnn
(0.000) (0.001) (0.001) (0.000) (0.001) (0.001)Log-likelihood 449,722 �2,284,081 �63,508 449,806 �2,283,990 �63,479
T. Hendershott et al. / Journal of Financial Economics 117 (2015) 249–287 283

Table A9Vector autoregressions of returns, news sentiment, and institutional trading sorted by size, number of analysts, and GIM governance index.
The table reports estimates from panel vector autoregressions (6) with firm fixed effects. The estimates are obtained using system GMM estimation asdescribed in Section 4.2. The dependent variables are institutional order flow (IOF), stock returns, and news sentiment. We set the lag length L¼3. Thesample contains all 1,667 NYSE stocks on all 755 trading days from 2003 through 2005. We sort all firms into terciles. The number of observations is365,505 in each portfolio. Standard errors are reported in parentheses. Levels of significance are denoted by n (10%), nn (5%), and nnn (1%).
Firm size No. analysts GIM governance index
Small Medium Large Small Medium Large Small Medium Large
Panel A: Returnt
IOFt�1 0.150nnn 0.173nnn 0.321nnn 0.190nnn 0.133nnn 0.228nnn 0.156nnn 0.205nnn 0.200nnn
(0.023) (0.027) (0.038) (0.028) (0.029) (0.039) (0.035) (0.037) (0.046)IOFt�2 0.039n 0.040 0.058 0.078nnn 0.030 0.094nn 0.080nn 0.016 0.026
(0.022) (0.027) (0.038) (0.028) (0.027) (0.037) (0.033) (0.037) (0.046)IOFt�3 �0.051nn 0.048n �0.010 �0.063nn �0.016 0.034 0.002 �0.038 0.027
(0.021) (0.025) (0.036) (0.025) (0.026) (0.036) (0.032) (0.036) (0.042)Returnt�1 0.003 �0.013nnn �0.012nnn �0.007nnn �0.011nnn �0.005nn �0.009nnn �0.015nnn �0.022nnn
(0.002) (0.002) (0.002) (0.002) (0.003) (0.003) (0.003) (0.003) (0.004)Returnt�2 0.002 0.000 �0.015nnn 0.001 0.004n �0.020nnn �0.003 �0.003 �0.005
(0.002) (0.002) (0.002) (0.002) (0.002) (0.002) (0.003) (0.003) (0.004)Returnt�3 �0.004n �0.002 �0.009nnn �0.004n �0.005nn �0.006nn 0.000 �0.006nn �0.001
(0.002) (0.002) (0.002) (0.002) (0.002) (0.002) (0.003) (0.003) (0.003)Sentimentt�1 0.247nnn 0.152nnn 0.061nnn 0.180nnn 0.106nnn 0.060nnn 0.101nnn 0.077nnn 0.118nnn
(0.067) (0.036) (0.014) (0.047) (0.029) (0.017) (0.030) (0.026) (0.033)Sentimentt�2 0.092 0.012 0.019 0.076n 0.024 0.030n �0.015 0.006 0.038
(0.064) (0.034) (0.014) (0.046) (0.028) (0.016) (0.030) (0.026) (0.032)Sentimentt�3 �0.013 �0.050 0.025n 0.033 �0.008 0.012 0.002 0.012 0.008
(0.063) (0.034) (0.014) (0.045) (0.027) (0.016) (0.029) (0.025) (0.031)
Panel B: Sentimentt
IOFt�1 0.001 0.005nn 0.002 0.001 0.005nnn 0.000 0.007nnn 0.001 0.007nn
(0.001) (0.002) (0.004) (0.001) (0.002) (0.003) (0.002) (0.002) (0.003)IOFt�2 �0.001 �0.002 0.001 �0.001 �0.001 �0.002 �0.004nn 0.002 �0.002
(0.001) (0.002) (0.004) (0.001) (0.002) (0.003) (0.002) (0.002) (0.003)IOFt�3 0.002n 0.003n �0.002 0.000 0.003n 0.002 0.004n �0.002 0.002
(0.001) (0.002) (0.004) (0.001) (0.002) (0.003) (0.002) (0.002) (0.003)Returnt�1 0.000nnn 0.001nnn 0.003nnn 0.000 0.001nnn 0.003nnn 0.001nnn 0.001nnn 0.001nnn
(0.000) (0.000) (0.000) (0.000) (0.000) (0.000) (0.000) (0.000) (0.000)Returnt�2 0.000n 0.000 0.000 0.000 0.000 0.000 0.000nn 0.000 0.000
(0.000) (0.000) (0.000) (0.000) (0.000) (0.000) (0.000) (0.000) (0.000)Returnt�3 0.000 0.000 0.000 0.000 0.000nn 0.000 0.000 0.000 0.000
(0.000) (0.000) (0.000) (0.000) (0.000) (0.000) (0.000) (0.000) (0.000)Sentimentt�1 0.078nnn 0.073nnn 0.111nnn 0.068nnn 0.100nnn 0.109nnn 0.106nnn 0.101nnn 0.095nnn
(0.005) (0.004) (0.003) (0.004) (0.004) (0.003) (0.004) (0.004) (0.005)Sentimentt�2 0.023nnn 0.018nnn 0.032nnn 0.015nnn 0.023nnn 0.032nnn 0.036nnn 0.032nnn 0.029nnn
(0.004) (0.003) (0.002) (0.004) (0.003) (0.003) (0.004) (0.004) (0.004)Sentimentt�3 0.024nnn 0.013nnn 0.040nnn 0.016nnn 0.027nnn 0.038nnn 0.042nnn 0.036nnn 0.027nnn
(0.004) (0.003) (0.002) (0.003) (0.003) (0.003) (0.004) (0.003) (0.004)
Panel C: IOFt
IOFt�1 0.237nnn 0.234nnn 0.230nnn 0.248nnn 0.241nnn 0.224nnn 0.231nnn 0.268nnn 0.246nnn
(0.012) (0.004) (0.006) (0.015) (0.014) (0.007) (0.012) (0.010) (0.009)IOFt�2 0.066nnn 0.060nnn 0.071nnn 0.057nnn 0.068nnn 0.072nnn 0.057nnn 0.060nnn 0.064nnn
(0.009) (0.004) (0.004) (0.009) (0.012) (0.006) (0.011) (0.009) (0.006)IOFt�3 0.054nnn 0.061nnn 0.046nnn 0.042nnn 0.063nnn 0.050nnn 0.048nnn 0.054nnn 0.063nnn
(0.007) (0.003) (0.004) (0.007) (0.009) (0.005) (0.009) (0.008) (0.006)Returnt�1 0.001nn 0.005nnn 0.005nnn 0.001nnn 0.004nnn 0.006nnn 0.004nnn 0.004nnn 0.004nnn
(0.000) (0.000) (0.000) (0.000) (0.000) (0.000) (0.000) (0.000) (0.000)Returnt�2 0.000 0.001nnn 0.000 0.000 0.001nnn 0.000 0.001nn 0.000nn 0.001nnn
(0.000) (0.000) (0.000) (0.000) (0.000) (0.000) (0.000) (0.000) (0.000)Returnt�3 0.000nn �0.001nnn �0.001nnn 0.000 �0.001nnn �0.001nnn �0.001nnn �0.001nnn �0.001nnn
(0.000) (0.000) (0.000) (0.000) (0.000) (0.000) (0.000) (0.000) (0.000)Sentimentt�1 �0.001 0.005n �0.001nn 0.004 0.003 �0.003nnn �0.004 0.002 0.001
(0.011) (0.003) (0.001) (0.004) (0.004) (0.001) (0.003) (0.002) (0.002)Sentimentt�2 0.004 �0.005n 0.000 �0.003 �0.003 0.001 �0.001 �0.001 �0.001
(0.010) (0.003) (0.001) (0.004) (0.004) (0.001) (0.003) (0.002) (0.003)Sentimentt�3 �0.010 �0.003 0.001 �0.003 0.003 �0.001 0.002 �0.001 0.001
(0.010) (0.003) (0.001) (0.004) (0.003) (0.001) (0.003) (0.002) (0.002)
T. Hendershott et al. / Journal of Financial Economics 117 (2015) 249–287284
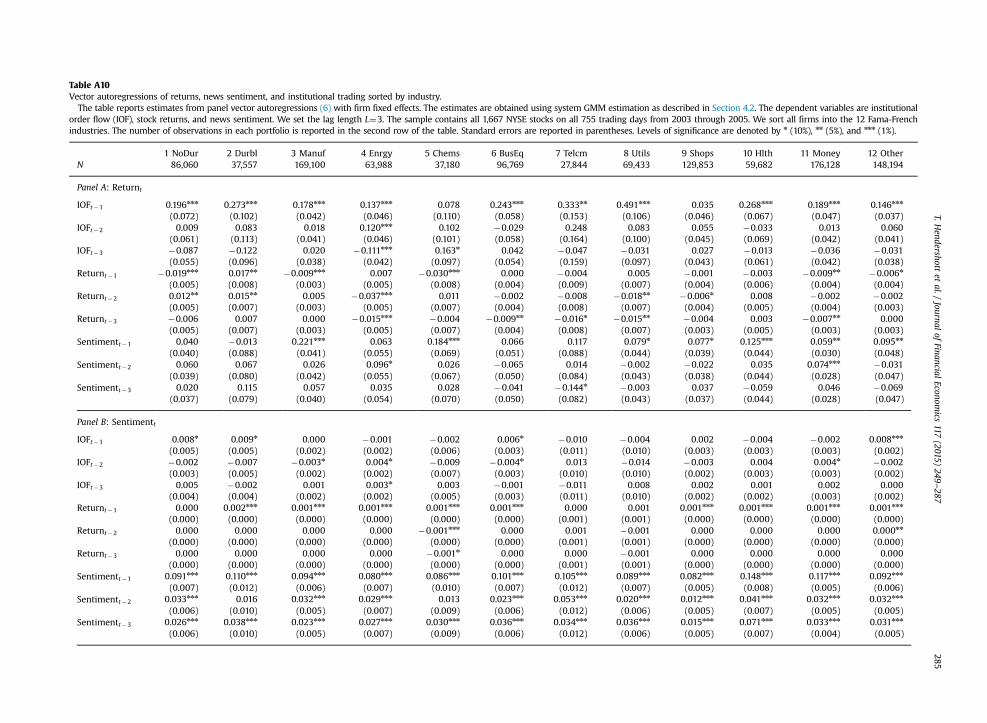
Table A10Vector autoregressions of returns, news sentiment, and institutional trading sorted by industry.
The table reports estimates from panel vector autoregressions (6) with firm fixed effects. The estimates are obtained using system GMM estimation as described in Section 4.2. The dependent variables are institutionalorder flow (IOF), stock returns, and news sentiment. We set the lag length L¼3. The sample contains all 1,667 NYSE stocks on all 755 trading days from 2003 through 2005. We sort all firms into the 12 Fama-Frenchindustries. The number of observations in each portfolio is reported in the second row of the table. Standard errors are reported in parentheses. Levels of significance are denoted by n (10%), nn (5%), and nnn (1%).
1 NoDur 2 Durbl 3 Manuf 4 Enrgy 5 Chems 6 BusEq 7 Telcm 8 Utils 9 Shops 10 Hlth 11 Money 12 OtherN 86,060 37,557 169,100 63,988 37,180 96,769 27,844 69,433 129,853 59,682 176,128 148,194
Panel A: Returnt
IOFt�1 0.196nnn 0.273nnn 0.178nnn 0.137nnn 0.078 0.243nnn 0.333nn 0.491nnn 0.035 0.268nnn 0.189nnn 0.146nnn
(0.072) (0.102) (0.042) (0.046) (0.110) (0.058) (0.153) (0.106) (0.046) (0.067) (0.047) (0.037)IOFt�2 0.009 0.083 0.018 0.120nnn 0.102 �0.029 0.248 0.083 0.055 �0.033 0.013 0.060
(0.061) (0.113) (0.041) (0.046) (0.101) (0.058) (0.164) (0.100) (0.045) (0.069) (0.042) (0.041)IOFt�3 �0.087 �0.122 0.020 �0.111nnn 0.163n 0.042 �0.047 �0.031 0.027 �0.013 �0.036 �0.031
(0.055) (0.096) (0.038) (0.042) (0.097) (0.054) (0.159) (0.097) (0.043) (0.061) (0.042) (0.038)Returnt�1 �0.019nnn 0.017nn �0.009nnn 0.007 �0.030nnn 0.000 �0.004 0.005 �0.001 �0.003 �0.009nn �0.006n
(0.005) (0.008) (0.003) (0.005) (0.008) (0.004) (0.009) (0.007) (0.004) (0.006) (0.004) (0.004)Returnt�2 0.012nn 0.015nn 0.005 �0.037nnn 0.011 �0.002 �0.008 �0.018nn �0.006n 0.008 �0.002 �0.002
(0.005) (0.007) (0.003) (0.005) (0.007) (0.004) (0.008) (0.007) (0.004) (0.005) (0.004) (0.003)Returnt�3 �0.006 0.007 0.000 �0.015nnn �0.004 �0.009nn �0.016n �0.015nn �0.004 0.003 �0.007nn 0.000
(0.005) (0.007) (0.003) (0.005) (0.007) (0.004) (0.008) (0.007) (0.003) (0.005) (0.003) (0.003)Sentimentt�1 0.040 �0.013 0.221nnn 0.063 0.184nnn 0.066 0.117 0.079n 0.077n 0.125nnn 0.059nn 0.095nn
(0.040) (0.088) (0.041) (0.055) (0.069) (0.051) (0.088) (0.044) (0.039) (0.044) (0.030) (0.048)Sentimentt�2 0.060 0.067 0.026 0.096n 0.026 �0.065 0.014 �0.002 �0.022 0.035 0.074nnn �0.031
(0.039) (0.080) (0.042) (0.055) (0.067) (0.050) (0.084) (0.043) (0.038) (0.044) (0.028) (0.047)Sentimentt�3 0.020 0.115 0.057 0.035 0.028 �0.041 �0.144n �0.003 0.037 �0.059 0.046 �0.069
(0.037) (0.079) (0.040) (0.054) (0.070) (0.050) (0.082) (0.043) (0.037) (0.044) (0.028) (0.047)
Panel B: Sentimentt
IOFt�1 0.008n 0.009n 0.000 �0.001 �0.002 0.006n �0.010 �0.004 0.002 �0.004 �0.002 0.008nnn
(0.005) (0.005) (0.002) (0.002) (0.006) (0.003) (0.011) (0.010) (0.003) (0.003) (0.003) (0.002)IOFt�2 �0.002 �0.007 �0.003n 0.004n �0.009 �0.004n 0.013 �0.014 �0.003 0.004 0.004n �0.002
(0.003) (0.005) (0.002) (0.002) (0.007) (0.003) (0.010) (0.010) (0.002) (0.003) (0.003) (0.002)IOFt�3 0.005 �0.002 0.001 0.003n 0.003 �0.001 �0.011 0.008 0.002 0.001 0.002 0.000
(0.004) (0.004) (0.002) (0.002) (0.005) (0.003) (0.011) (0.010) (0.002) (0.002) (0.003) (0.002)Returnt�1 0.000 0.002nnn 0.001nnn 0.001nnn 0.001nnn 0.001nnn 0.000 0.001 0.001nnn 0.001nnn 0.001nnn 0.001nnn
(0.000) (0.000) (0.000) (0.000) (0.000) (0.000) (0.001) (0.001) (0.000) (0.000) (0.000) (0.000)Returnt�2 0.000 0.000 0.000 0.000 �0.001nnn 0.000 0.001 �0.001 0.000 0.000 0.000 0.000nn
(0.000) (0.000) (0.000) (0.000) (0.000) (0.000) (0.001) (0.001) (0.000) (0.000) (0.000) (0.000)Returnt�3 0.000 0.000 0.000 0.000 �0.001n 0.000 0.000 �0.001 0.000 0.000 0.000 0.000
(0.000) (0.000) (0.000) (0.000) (0.000) (0.000) (0.001) (0.001) (0.000) (0.000) (0.000) (0.000)Sentimentt�1 0.091nnn 0.110nnn 0.094nnn 0.080nnn 0.086nnn 0.101nnn 0.105nnn 0.089nnn 0.082nnn 0.148nnn 0.117nnn 0.092nnn
(0.007) (0.012) (0.006) (0.007) (0.010) (0.007) (0.012) (0.007) (0.005) (0.008) (0.005) (0.006)Sentimentt�2 0.033nnn 0.016 0.032nnn 0.029nnn 0.013 0.023nnn 0.053nnn 0.020nnn 0.012nnn 0.041nnn 0.032nnn 0.032nnn
(0.006) (0.010) (0.005) (0.007) (0.009) (0.006) (0.012) (0.006) (0.005) (0.007) (0.005) (0.005)Sentimentt�3 0.026nnn 0.038nnn 0.023nnn 0.027nnn 0.030nnn 0.036nnn 0.034nnn 0.036nnn 0.015nnn 0.071nnn 0.033nnn 0.031nnn
(0.006) (0.010) (0.005) (0.007) (0.009) (0.006) (0.012) (0.006) (0.005) (0.007) (0.004) (0.005)
T.Hendershott
etal./
Journalof
FinancialEconom
ics117
(2015)249
–287285
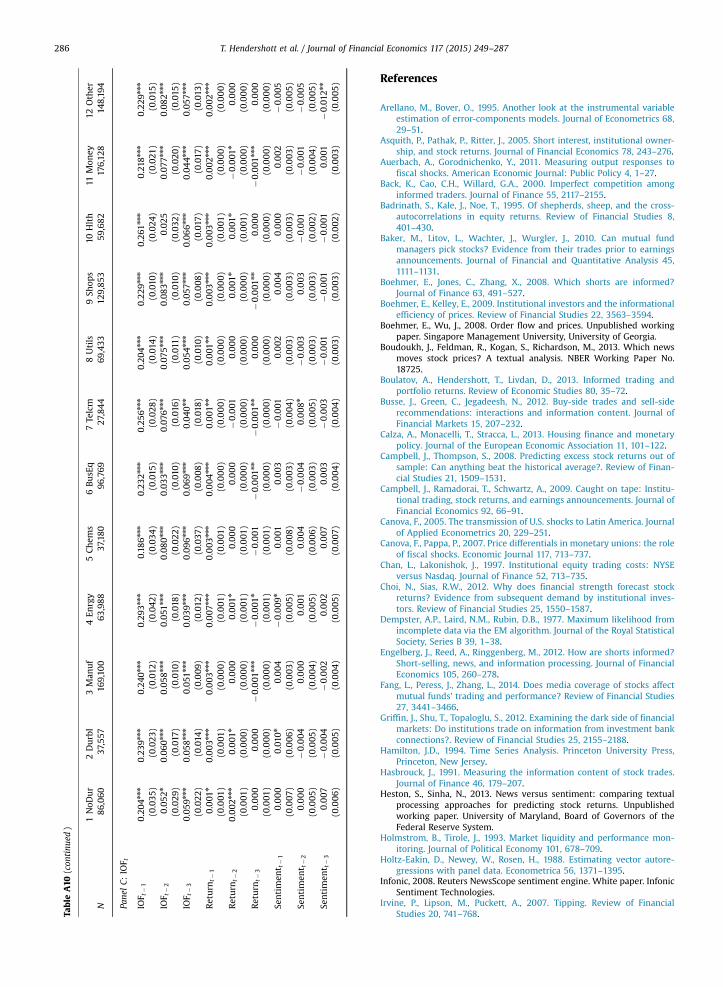
Table
A10
(con
tinu
ed)
1NoD
ur
2Durbl
3Man
uf
4En
rgy
5Chem
s6BusEq
7Te
lcm
8Utils
9Sh
ops
10Hlth
11Mon
ey12
Other
N86
,060
37,557
169,10
063
,988
37,180
96,769
27,844
69,433
129,85
359
,682
176,12
814
8,19
4
Pane
lC:
IOF t
IOF t
�1
0.20
4nnn
0.23
9nnn
0.24
0nnn
0.29
3nnn
0.18
6nnn
0.23
2nnn
0.25
6nnn
0.20
4nnn
0.22
9nnn
0.26
1nnn
0.21
8nnn
0.22
9nnn
(0.035
)(0.023
)(0.012
)(0.042
)(0.034
)(0.015
)(0.028
)(0.014
)(0.010
)(0.024
)(0.021
)(0.015
)IO
F t�2
0.05
2n0.06
0nnn
0.05
8nnn
0.05
1nnn
0.08
0nnn
0.03
3nnn
0.07
6nnn
0.07
5nnn
0.08
3nnn
0.02
50.07
7nnn
0.08
2nnn
(0.029
)(0.017
)(0.010
)(0.018
)(0.022
)(0.010
)(0.016
)(0.011
)(0.010
)(0.032
)(0.020
)(0.015
)IO
F t�3
0.05
9nnn
0.05
8nnn
0.05
1nnn
0.03
9nnn
0.09
6nnn
0.06
9nnn
0.04
0nn
0.05
4nnn
0.05
7nnn
0.06
6nnn
0.04
4nnn
0.05
7nnn
(0.022
)(0.014
)(0.009
)(0.012
)(0.037
)(0.008
)(0.018
)(0.010
)(0.008
)(0.017
)(0.017
)(0.013
)Return
t�1
0.001
n0.003
nnn
0.003
nnn
0.007
nnn
0.003
nnn
0.004
nnn
0.001
nn
0.001
nn
0.003
nnn
0.003
nnn
0.002
nnn
0.002
nnn
(0.001
)(0.001
)(0.000)
(0.001
)(0.001
)(0.000)
(0.000)
(0.000)
(0.000)
(0.001
)(0.000)
(0.000)
Return
t�2
0.002
nnn
0.001
n0.000
0.001
n0.000
0.000
�0.001
0.000
0.001
n0.001
n�0.001
n0.000
(0.001
)(0.000)
(0.000)
(0.001
)(0.001
)(0.000)
(0.000)
(0.000)
(0.000)
(0.001
)(0.000)
(0.000)
Return
t�3
0.000
0.000
�0.001
nnn
�0.001
n�0.001
�0.001
nn
�0.001
nn
0.000
�0.001
nn
0.000
�0.001
nnn
0.000
(0.001
)(0.000)
(0.000)
(0.001
)(0.001
)(0.000)
(0.000)
(0.000)
(0.000)
(0.000)
(0.000)
(0.000)
Sentimen
t t�1
0.000
0.01
0n0.004
�0.009
n0.001
0.003
�0.001
0.002
0.004
0.000
0.002
�0.005
(0.007
)(0.006
)(0.003
)(0.005
)(0.008
)(0.003
)(0.004
)(0.003
)(0.003
)(0.003
)(0.003
)(0.005
)Se
ntimen
t t�2
0.000
�0.004
0.000
0.001
0.004
�0.004
0.008
n�0.003
0.003
�0.001
�0.001
�0.005
(0.005
)(0.005
)(0.004
)(0.005
)(0.006
)(0.003
)(0.005
)(0.003
)(0.003
)(0.002
)(0.004
)(0.005
)Se
ntimen
t t�3
0.007
�0.004
�0.002
0.002
0.007
0.003
�0.003
�0.001
�0.001
�0.001
0.001
�0.01
2nn
(0.006
)(0.005
)(0.004
)(0.005
)(0.007
)(0.004
)(0.004
)(0.003
)(0.003
)(0.002
)(0.003
)(0.005
)
T. Hendershott et al. / Journal of Financial Economics 117 (2015) 249–287286
References
Arellano, M., Bover, O., 1995. Another look at the instrumental variableestimation of error-components models. Journal of Econometrics 68,29–51.
Asquith, P., Pathak, P., Ritter, J., 2005. Short interest, institutional owner-ship, and stock returns. Journal of Financial Economics 78, 243–276.
Auerbach, A., Gorodnichenko, Y., 2011. Measuring output responses tofiscal shocks. American Economic Journal: Public Policy 4, 1–27.
Back, K., Cao, C.H., Willard, G.A., 2000. Imperfect competition amonginformed traders. Journal of Finance 55, 2117–2155.
Badrinath, S., Kale, J., Noe, T., 1995. Of shepherds, sheep, and the cross-autocorrelations in equity returns. Review of Financial Studies 8,401–430.
Baker, M., Litov, L., Wachter, J., Wurgler, J., 2010. Can mutual fundmanagers pick stocks? Evidence from their trades prior to earningsannouncements. Journal of Financial and Quantitative Analysis 45,1111–1131.
Boehmer, E., Jones, C., Zhang, X., 2008. Which shorts are informed?Journal of Finance 63, 491–527.
Boehmer, E., Kelley, E., 2009. Institutional investors and the informationalefficiency of prices. Review of Financial Studies 22, 3563–3594.
Boehmer, E., Wu, J., 2008. Order flow and prices. Unpublished workingpaper. Singapore Management University, University of Georgia.
Boudoukh, J., Feldman, R., Kogan, S., Richardson, M., 2013. Which newsmoves stock prices? A textual analysis. NBER Working Paper No.18725.
Boulatov, A., Hendershott, T., Livdan, D., 2013. Informed trading andportfolio returns. Review of Economic Studies 80, 35–72.
Busse, J., Green, C., Jegadeesh, N., 2012. Buy-side trades and sell-siderecommendations: interactions and information content. Journal ofFinancial Markets 15, 207–232.
Calza, A., Monacelli, T., Stracca, L., 2013. Housing finance and monetarypolicy. Journal of the European Economic Association 11, 101–122.
Campbell, J., Thompson, S., 2008. Predicting excess stock returns out ofsample: Can anything beat the historical average?. Review of Finan-cial Studies 21, 1509–1531.
Campbell, J., Ramadorai, T., Schwartz, A., 2009. Caught on tape: Institu-tional trading, stock returns, and earnings announcements. Journal ofFinancial Economics 92, 66–91.
Canova, F., 2005. The transmission of U.S. shocks to Latin America. Journalof Applied Econometrics 20, 229–251.
Canova, F., Pappa, P., 2007. Price differentials in monetary unions: the roleof fiscal shocks. Economic Journal 117, 713–737.
Chan, L., Lakonishok, J., 1997. Institutional equity trading costs: NYSEversus Nasdaq. Journal of Finance 52, 713–735.
Choi, N., Sias, R.W., 2012. Why does financial strength forecast stockreturns? Evidence from subsequent demand by institutional inves-tors. Review of Financial Studies 25, 1550–1587.
Dempster, A.P., Laird, N.M., Rubin, D.B., 1977. Maximum likelihood fromincomplete data via the EM algorithm. Journal of the Royal StatisticalSociety, Series B 39, 1–38.
Engelberg, J., Reed, A., Ringgenberg, M., 2012. How are shorts informed?Short-selling, news, and information processing. Journal of FinancialEconomics 105, 260–278.
Fang, L., Peress, J., Zhang, L., 2014. Does media coverage of stocks affectmutual funds' trading and performance? Review of Financial Studies27, 3441–3466.
Griffin, J., Shu, T., Topaloglu, S., 2012. Examining the dark side of financialmarkets: Do institutions trade on information from investment bankconnections?. Review of Financial Studies 25, 2155–2188.
Hamilton, J.D., 1994. Time Series Analysis. Princeton University Press,Princeton, New Jersey.
Hasbrouck, J., 1991. Measuring the information content of stock trades.Journal of Finance 46, 179–207.
Heston, S., Sinha, N., 2013. News versus sentiment: comparing textualprocessing approaches for predicting stock returns. Unpublishedworking paper. University of Maryland, Board of Governors of theFederal Reserve System.
Holmstrom, B., Tirole, J., 1993. Market liquidity and performance mon-itoring. Journal of Political Economy 101, 678–709.
Holtz-Eakin, D., Newey, W., Rosen, H., 1988. Estimating vector autore-gressions with panel data. Econometrica 56, 1371–1395.
Infonic, 2008. Reuters NewsScope sentiment engine. White paper. InfonicSentiment Technologies.
Irvine, P., Lipson, M., Puckett, A., 2007. Tipping. Review of FinancialStudies 20, 741–768.

T. Hendershott et al. / Journal of Financial Economics 117 (2015) 249–287 287
Jegadeesh, N., Tang, Y., 2010. Institutional trades around takeoverannouncements: evidence of skill and information leakage. Unpub-lished working paper. Emory University.
Kacperczyk, M., Seru, A., 2007. Fund manager use of public information:new evidence on managerial skills. Journal of Finance 62, 485–528.
Kaniel, R., Liu, S., Saar, G., Titman, S., 2012. Individual investor trading andreturn patterns around earnings announcements. Journal of Finance67, 639–680.
Kelley, E., Tetlock, P., 2013. How wise are crowds? Insights from retailorders and stock returns. Journal of Finance 68, 1229–1265.
Kyle, A.S., 1985. Continuous auctions and insider trading. Econometrica53, 1315–1335.
Loughran, T., McDonald, B., 2011. When is a liability not a liability?Textual analysis, dictionaries, and 10-Ks. Journal of Finance 66, 35–65.
Neuhierl, A., Scherbina, A., Schlusche, B., 2013. Market reaction tocorporate press releases. Journal of Financial and Quantitative Ana-lysis 48, 1207–1240.
Petersen, M., 2009. Estimating standard errors in finance panel data sets:comparing approaches. Review of Financial Studies 22, 435–480.
Roll, R., 1988. R2. Journal of Finance 43, 541–566.
Savor, P., Wilson, M., 2014. Asset pricing: a tale of two days. Journal ofFinancial Economics 113, 171–201.
Securities Industry Association, 2007. Securities Industry Fact Book. NewYork 2007.
Senchack, A., Starks, L., 1993. Short-sale restrictions and market reactionto short-interest announcement. Journal of Financial and QuantitativeAnalysis 28, 177–194.
Sias, R.W., Starks, L., 1997. Return autocorrelation and institutionalinvestors. Journal of Financial Economics 46, 103–131.
Sinha, N., 2012. Underreaction to news in the US stock market. Unpub-lished working paper. Board of Governors of the Federal ReserveSystem.
Tetlock, P., 2007. Giving content to investor sentiment: the role of mediain the stock market. Journal of Finance 62, 1139–1168.
Tetlock, P., Saar-Tsechansky, M., Macskassy, S., 2008. More than words:quantifying language to measure firms' fundamentals. Journal ofFinance 63, 1437–1467.
Tetlock, P., 2010. Does public financial news resolve asymmetric informa-tion? Review of Financial Studies 23, 3520–3557.