IMPACT OF THE ECOLOGICAL FOOTPRINT IN THE LOSS OF ICE …
16
IMPACT OF THE ECOLOGICAL FOOTPRINT IN THE LOSS OF ICE AND GLACIERS Students: Edgardo Omar Silva, Rosario del Carmen Cheuquepan, Jorge Nicolás Bustamante, Adriana Millanao. CEI “San Ignacio”, Junín de los Andes, Argentina Teacher: Valeria Vera Bertoldi. April 2019
Transcript of IMPACT OF THE ECOLOGICAL FOOTPRINT IN THE LOSS OF ICE …

IMPACT OF THE ECOLOGICAL FOOTPRINT
IN THE LOSS OF ICE AND GLACIERS
Students: Edgardo Omar Silva, Rosario del Carmen Cheuquepan, Jorge Nicolás Bustamante, Adriana Millanao.
CEI “San Ignacio”, Junín de los Andes, Argentina
Teacher: Valeria Vera Bertoldi.
April 2019

2
TABLE OF CONTENTS
Abstract …………………………………………………………………..…………...….. 3
1. Introduction …………………………………………………………………………….. 3
2. Research Questions ………………………………………………………………….. 6
3. Hypothesis ………………………………………………………………………………7
4. Materials and Method …………………………………………………………………. 7
5. Results and Analysis ………………………………………………………………….11
6. Conclusions ……………………………………………………………………………14
7. Discussion ……………………………………………………………………………..15
8. Acknowledgments …………………………………………………………………….15
9.References / Bibliography ....... ....................................................................... ... 15

3
Abstract:
The loss of snow due to snowmelt is a serious problem worldwide that progresses
year after year and is attributed to the global warming generated by the pollution
caused by climate change. In our area, it directly affects the availability of water in
ecosystems and productive systems, increasing the risk of fires.
The warming causes the melting affect the poles and in the mountains causes the loss
of the thickness and extension of glaciers. Excess water generates floods due to sea
level rise; shortage of fresh water and droughts and fires in areas dependent on
melting in summer.
To analyze the loss of glaciers in the Patagonia region, Argentina, two sites were
compared using Landsat 5 and 8 images corresponding to the years 2005 and 2017.
The Landsat 8 images were validated with samplings in the terrain using the GLOBE
Protocols. The NDVI, NDWI and NDSI indices were calculated using the QGIS
software.
Ice loss was detected in both sites, which can produce an increase in drought, due to
lower availability of water, particularly in the summer (which is the dry season and the
melting of the available water resource)
The loss of snow due to snowmelt is a serious problem worldwide that progresses
year after year and is attributed to the global warming generated by the pollution
caused by climate change. To analyze the loss of glaciers in the Patagonia region,
Argentina
1. Introduction
The loss of snow and melting worldwide is a problem that progresses year by year and
is attributed to global warming, climate change and pollution.

4
This loss of snow and ice in our area is very important because it directly affects the
ecosystem and production systems, and it is also important to contextualize these
changes on a global scale, comparing what happens in this region with other regions
of the world.
This loss of snow and ice has as consequences, the melting of the glaciers at the
poles and in the mountains; the loss of the thickness and extent of the glaciers; floods
due to sea level rise; shortage of fresh water and droughts and fires in areas
dependent on melting in summer.
5
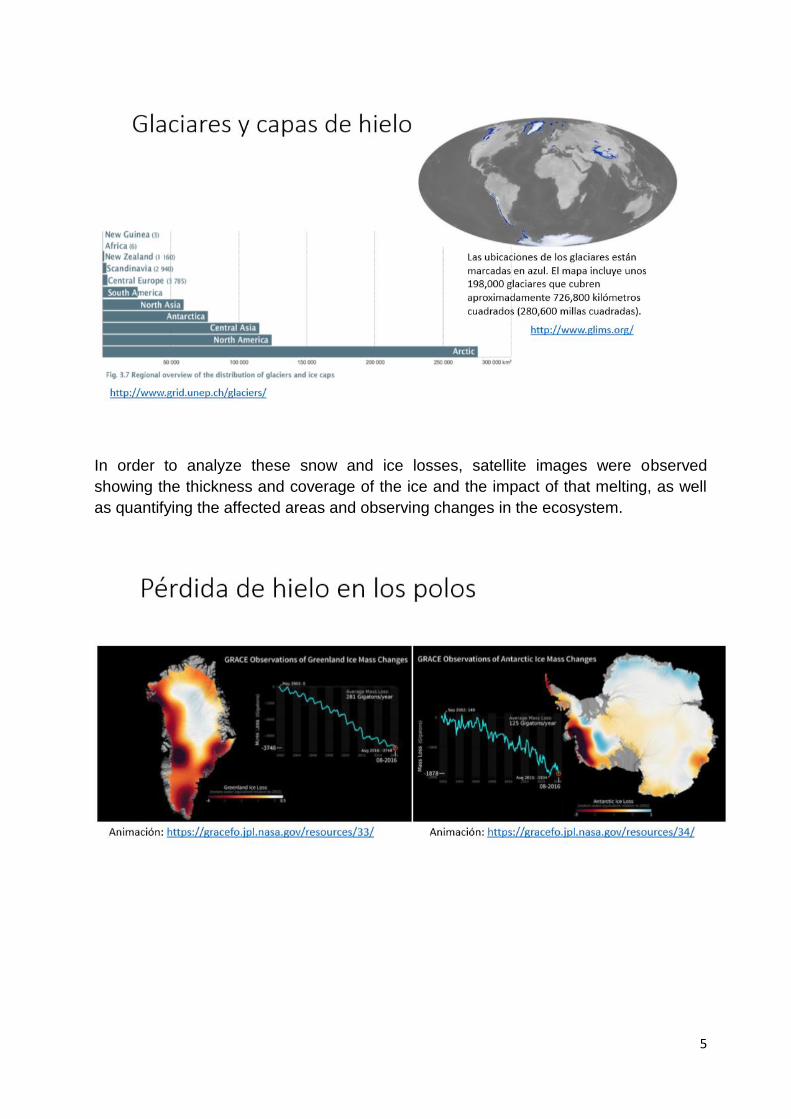
In order to analyze these snow and ice losses, satellite images were observed
showing the thickness and coverage of the ice and the impact of that melting, as well
as quantifying the affected areas and observing changes in the ecosystem.

6
To develop the research project, Landsat 5 and 8 images were used to compare
changes in a period of time and the Landsat 8 images were validated with samplings
in the terrain using the GLOBE Protocols, also calculating the green index, the water
index and the snow index.
For this work two sites were taken, the Upsala Glacier in the Province of Santa Cruz,
Argentina and the Lanín Volcano in the Province of Neuquén, Argentina. To make this
choice, we considered the availability of images and the good visibility of them
The project has as an initiative to answer some questions such as: What is the impact
of the ecological footprint on the loss of ice and glaciers and how is this impact in our
region compared to other places in the world?
We also ask ourselves if satellite images can be used as tools to observe this impact.
2. Research Questions
The loss of snow and melting worldwide is a problem that progresses year by year and
is attributed to global warming, climate change (it rains instead of snowing) and
pollution (dark ice melts faster).
This loss of snow and ice in our area is very important because it directly affects the
ecosystem and production systems, it is also very important to contextualize these
changes on a global scale, comparing what happens in this region with other regions
of the world.
This loss of snow and ice has as consequences, the melting of the glaciers at the
poles and in the mountains; the loss of the thickness and extent of the glaciers; floods

7
due to sea level rise; shortage of fresh water and droughts and fires in areas
dependent on melting in summer.
In order to analyze these snow and ice losses, satellite images were observed
showing the thickness and coverage of the ice and the impact of that melting, as well
as quantifying the affected areas and observing changes in the ecosystem.
The main questions that this investigation tries to answer are:
What is the impact of the ecological footprint on the loss of ice and glaciers?
How is this impact in our region compared to other places in the world?
Can satellite images be used to observe this impact?
3. Hypothesis
There is a tendency to decrease ice and snow precipitation over time and this trend
can be monitored through satellite images.
4. Materials and Method:
Landsat 5 and 8 images were used to compare changes over a period of time.
The Landsat 8 images were validated with samplings in the terrain, using GLOBE
Protocols.
The green index, the water index and the snow index were calculated.
The following software was used:
QGIS and Multispec (to analyze Landsat images)
Google Earth to locate environmental problems
CmapTools to map concepts
Office to process information and present the investigation
Two sites were taken to compare:
Upsala Glacier (Province of Santa Cruz, Argentina), with a Landsat 5 satellite image of
the year 2005 compared to a Landsat 8 image of the year 2017.
Lanín Volcano (Province of Neuquén, Argentina) with a Landsat 5 satellite image of
the year 2010 compared to a Landsat 8 image of the year 2017.

8
To make this selection, the availability of images (of the same month) and good
visibility (no clouds, dust or other phenomena of atmospheric disturbance) were
considered.
To carry out the validation of the Landsat 8 images, samples were taken in the field,
using GLOBE Protocols in three different sites within the San Ignacio CEI, which is
located in the San Cabao Valley at 800 meters above sea level, in Junín de los Andes,
where Sites had three different types of vegetation coverage (Bosque, Estepa and
Mallín).
The description of the vegetation coverage of each site was applied, applying the
GLOBE protocols of site selection, GPS, manual mapping, computerized mapping and
Biometrics (GLOBE, 2005), which allowed assigning MUC codes to each study site.

9
10
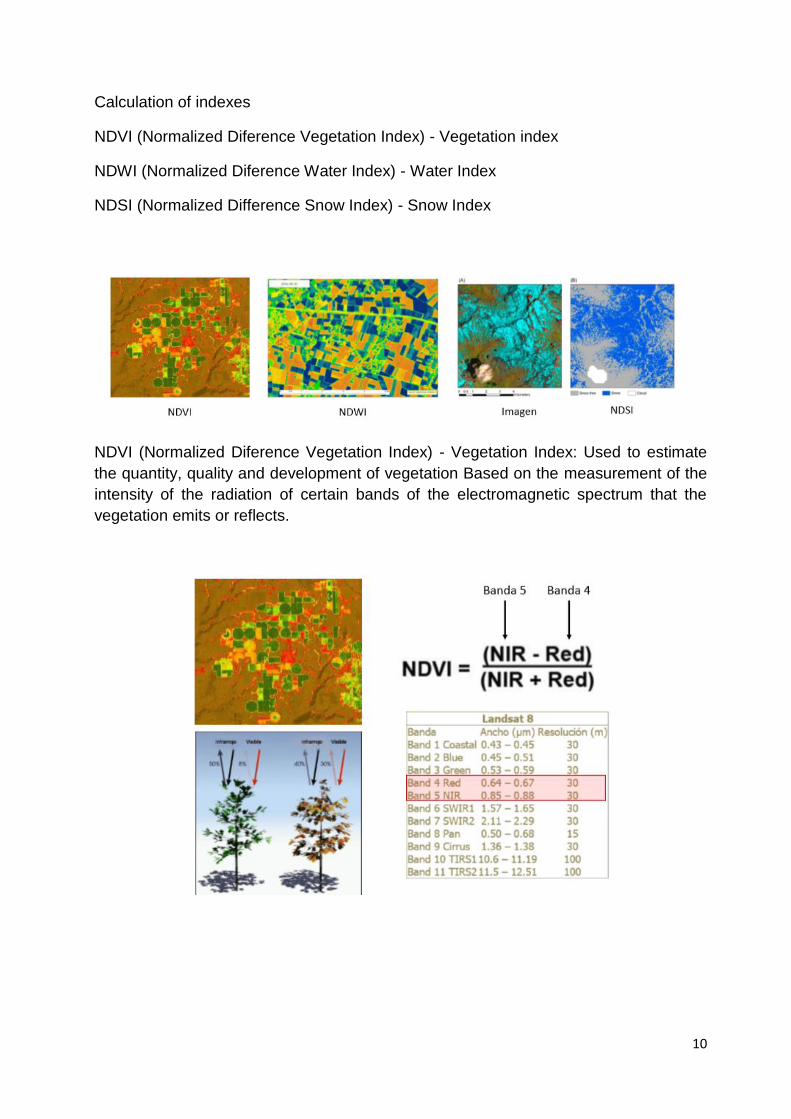
Calculation of indexes
NDVI (Normalized Diference Vegetation Index) - Vegetation index
NDWI (Normalized Diference Water Index) - Water Index
NDSI (Normalized Difference Snow Index) - Snow Index
NDVI (Normalized Diference Vegetation Index) - Vegetation Index: Used to estimate
the quantity, quality and development of vegetation Based on the measurement of the
intensity of the radiation of certain bands of the electromagnetic spectrum that the
vegetation emits or reflects.

11
NDWI: (Normalized Diference Water Index) - Water Index
It is used as a measure of the amount of water the vegetation has or the level of
moisture saturation that the soil possesses.
It is calculated from satellite images that provide reflectance information of a certain
area in different frequency bands of the electromagnetic spectrum.
5. Results and analysis:

12
13
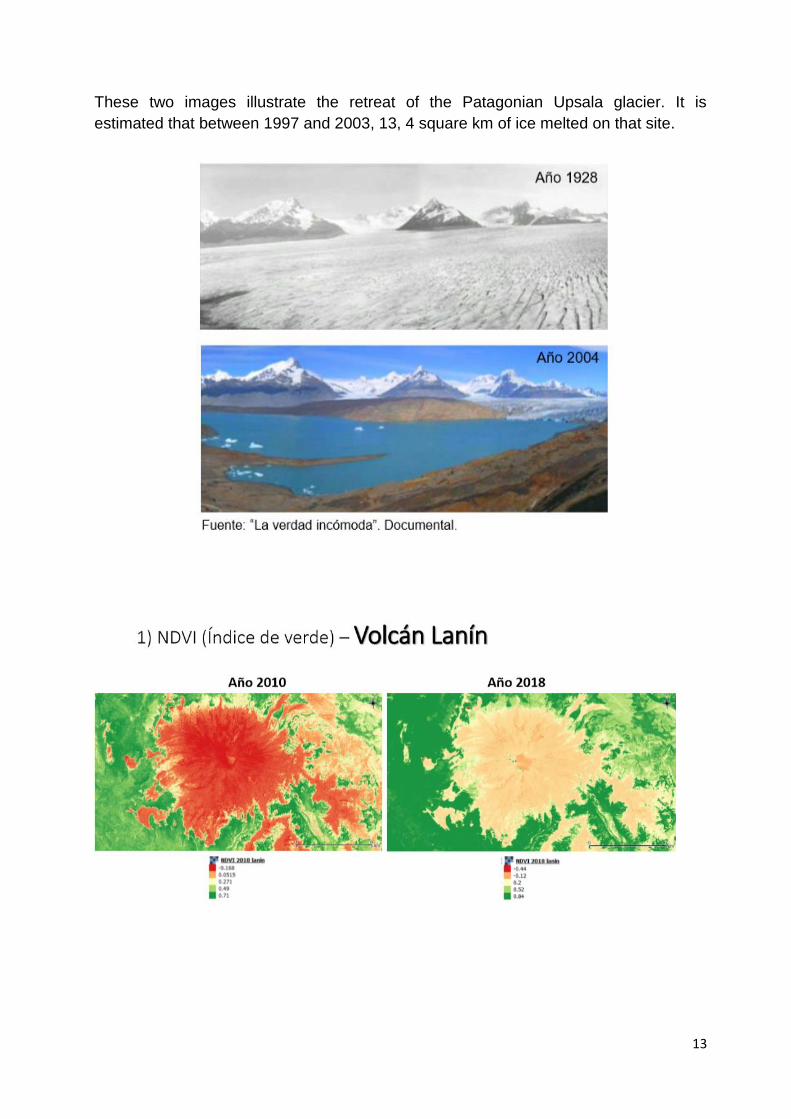
These two images illustrate the retreat of the Patagonian Upsala glacier. It is
estimated that between 1997 and 2003, 13, 4 square km of ice melted on that site.

14
According to the analysis of these satellite images, the Lanín Volcano has also
suffered a significant setback in its surface covered with ice and snow, which is clearly
detected in the calculations of the water and snow indexes.
6. Conclusions
In both sites an important loss of ice is detected, which can have as consequence an
increase of the drought, a smaller availability of water, in particular in the summer
(because it does not rain and both regions depend on the thaw as a source of water

15
resource), Negative impacts on ecosystems and loss of moisture can affect vegetation
and increase the risk of fires.
7. Discussion
The satellite images show the decrease of ice over time. This analysis by satellite
images could be used to monitor some periods of the year since the satellite passes
every 14 days through the site. Although it is not possible to see the origin of the loss
of ice in the satellite images, the tendency of the loss of ice can be monitored.
Some recommendations to try to keep the ice and avoid the recoil of the surface
covered with snow and ice are: Do not deforest, since the forests capture CO2 and
help to reduce the greenhouse effect. Recycle as much material as possible to reduce
pollution and the use of natural resources. Reduce the use of fossil fuels (reduce CO2
emissions). Decrease the emission of dust particles that are deposited in the ice and
accelerates the thaw.
8. Acknowledgments:
We especially thank the students of CEI San Ignacio for dedicating many hours to the
realization of the research plan and results analysis for this Project.
We would like to especially thank our mentor Professor Ana Prieto for helping us
during the data analysis stage and in the preparation of the research report.
9. References / Bibliography:
• Chen, J. L., Wilson, C. R., Tapley, B. D., Blankenship, D. D., & Ivins, E. R. (2007).
Patagonia icefield melting observed by gravity recovery and climate experiment
(GRACE). Geophysical Research Letters, 34 (22).
• Glasser, N. F., Harrison, S., Jansson, K. N., Anderson, K., & Cowley, A. (2011).
Global sea-level contribution from the Patagonian Icefields since the Little Ice Age
maximum. Nature Geoscience, 4 (5), 303.

16
• Rivera, J.A., Araneo, D.C., Penalba, O. C., & Villalba, R. (2018). Regional aspects of
streamflow droughts in the Andean rivers of Patagonia, Argentina. Links with large-
scale climatic oscillations. Hydrology Research, 49 (1), 134-149.
• Schaner, N., Voisin, N., Nijssen, B., & Lettenmaier, D. P. (2012). The contribution of
glacier melt to streamflow. Environmental Research Letters, 7 (3), 034029.
• Serious, L. A. (2006). The global climate change. Magazine Faculty of Agronomy
UBA, 26 (3), 275-289.
• Villalba, R., Masiokas, M. H., Kitzberger, T., & Boninsegna, J. A. (2005).
Biogeographical consequences of recent climate changes in the southern Andes of
Argentina. In Global Change and Mountain Regions (pp. 157-166). Springer,
Dordrecht.