
Greenhouse Gas Inventory Management Plan and …€¦ · Entergy Corporation Greenhouse Gas...
94
Greenhouse Gas Inventory Management Plan and Reporting Document (IMPRD) Entergy Corporation New Orleans, LA Prepared by: Rick N. Johnson ([email protected]) Manager, Corporate Environmental Operations Environmental Strategy and Policy Group Original Draft: July 2005 Finalized: December 2005 Latest Update: March 2013 Entergy’s GHG Commitment Snapshot Base Year – 2000 Original Commitment Years – 2001 to 2005 Original Commitment – Stabilize at 2000 levels direct CO 2 emissions from power plants Original Commitment Funding – $25 million ($5 million per year) Second Commitment Years – 2006 to 2010 Second Commitment – 20% below 2000 levels direct CO 2 emissions & cont. purchased power Second Commitment Funding – $3.25 million ($650K per year) Third Commitment Years – 2011 to 2020 Third Commitment – 20% below 2000 levels direct CO 2 emissions & cont. purchased power Third Commitment Funding – $10 million ($1 million per year)
Transcript of Greenhouse Gas Inventory Management Plan and …€¦ · Entergy Corporation Greenhouse Gas...
Greenhouse Gas InventoryManagement Plan and ReportingDocument (IMPRD)
Entergy CorporationNew Orleans, LA
Prepared by: Rick N. Johnson ([email protected])Manager, Corporate Environmental OperationsEnvironmental Strategy and Policy Group
Original Draft: July 2005Finalized: December 2005Latest Update: March 2013
Entergy’s GHG Commitment SnapshotBase Year – 2000
Original Commitment Years – 2001 to 2005Original Commitment – Stabilize at 2000 levels direct CO2 emissions from power plantsOriginal Commitment Funding – $25 million ($5 million per year)
Second Commitment Years – 2006 to 2010Second Commitment – 20% below 2000 levels direct CO2 emissions & cont. purchased powerSecond Commitment Funding – $3.25 million ($650K per year)
Third Commitment Years – 2011 to 2020Third Commitment – 20% below 2000 levels direct CO2 emissions & cont. purchased powerThird Commitment Funding – $10 million ($1 million per year)
1
Entergy Corporation Greenhouse Gas Inventory Management Plan andReporting Document
Introduction and Background
In May 2001, Entergy publicly committed to stabilize CO2 emissions from its power
plants at year 2000 levels through 2005, and dedicated $25 million in supplemental
corporate funding to achieve this target over the five-year period. This commitment was
focused on CO2 emissions from fuel combustion at the company’s power plants and
requires that Entergy:
Stabilize CO2 emissions from its U.S. power plants at year 2000 levels through
2005.
Establish the $25 Million Environmental Initiatives Fund (EIF) in support of
achieving the 2001-2005 stabilization targets.
Document activities and annual report progress.
Employ an independent third party organization to verify measurement of
Entergy’s CO2 emissions from U.S. power plants.
Entergy joined EPA's Climate Leaders Program in 2004 (the program was discontinued
in 2010) and began the process of renewing its GHG commitment by developing a
detailed inventory of all GHGs resulting from its operations. The inventory development
and results were documented in this Inventory Management Plan and Reporting
Document (IMPRD). Entergy’s second commitment included:
Stabilize CO2 emissions from all Entergy power generation plants plus
controllable purchased power at 20% below 2000 levels through 2010.
Commit funding of $3.25 million in support of achieving the 2005-2010 target.
Document activities and annually report progress.
In 2011, Entergy once again renewed its commitment to stabilize GHGs with a third
commitment:
Stabilize CO2 emissions from all Entergy power generation plants plus
controllable purchased power at 20% below 2000 levels through 2020.
Commit funding of $10 million in support of achieving the 2011-2020 target.
2
Document activities and annually report progress.
Beginning in 2012, Entergy decided to conduct the third-party verification audit to the
International Standards Organization (ISO) standard for GHG development and
verification (ISO 14064-3:2006). As a part of this verification, this document was
revised and upgraded to include several aspects required by the standard.
This IMPRD has been created and subsequently revised according to the requirements in
the World Resources Institute and the World Business Council for Sustainable
Development Greenhouse Gas Protocol, 2004 revised edition, and formatted according
to the US EPA Climate Leaders 2004 draft checklist of IMPRD components.
Additionally, the document was upgraded in 2012 to the standards contained in ISO
14064-3:2006.
This IMPRD is used to create and document an inventory that was previously reported
to the Climate Leaders program and other external parties. However, EPA announced
in 2010 that the Climate Leaders program was being discontinued. This IMPRD will
continue to be updated and used to document Entergy’s GHG Inventory methodology
and results on an annual basis. Entergy has made an estimate of all emissions,
including small sources, for reporting externally. Entergy registers its emissions and
offset purchases to the American Carbon Registry (www.americancarbonregistry.org)
and posts the GHG Inventory, along with this document, on the company’s website
(www.entergy.com).
The current GHG Inventory (by calendar year) is attached to this document as
Attachment 1 and is referenced throughout.
3
Reporting Entity Information
Entergy Corporation (Entergy) is an integrated energy company engaged primarily in
electric power production and retail distribution operations. Entergy owns and operates
power plants with approximately 30,000 megawatts of electric generating capacity,
including more than 10,000 megawatts of nuclear power, making it one of the nation’s
leading nuclear generators.. Entergy delivers electricity to 2.8 million utility customers in
Arkansas, Louisiana, Mississippi, and Texas. Entergy has annual revenues of more than
$11 billion (2012) and approximately 15,000 employees. Additional company
information can be located at www.entergy.com.
Company address: 639 Loyola Avenue
New Orleans, Louisiana 70113
IMPRD/GHG Inventory Contact: Chuck Barlow – Vice President, Environmental
Strategy & Policy
Environmental Strategy & Policy (ESP) Group
(504) 576-4000
4
Boundary Conditions
Consolidated Approach for Emissions Reporting – Entergy has elected to include all
company-owned assets and those under a capital lease, consistent with “equity share”
reporting under EPA and WRI reporting protocols. Where partial ownership share of an
asset exists, only Entergy’s owned portion of the asset/emissions is included in the
inventory. Additionally, Entergy has opted to include those emissions associated with the
electricity purchased to support grid operations and meet customer demand, primarily due
to an increased reliance on purchased power since 2003. The GHG emissions resulting
from the full life cycle of the various fuel sources are not included in the inventory.
Other emission sources (including transportation assets, sulfur hexafluoride [SF6],
building air conditioning and refrigeration equipment, losses from natural gas distribution
system, etc.) that have emissions estimated to be less than 1% of the total inventory are
considered de minimus unless they are anticipated to change dramatically and grow above
this threshold. Emissions of each GHG from facilities/assets that are de minimus are
estimated and included in the inventory for each gas and/or source. The same data are
used for future years unless one of the categories of emissions changes significantly.
These estimates will be recalculated approximately every five years (or as updated data
becomes available), after major equipment changes, asset acquisition and/or asset
divestiture in order to reconfirm de minimus status.
Facilities List –The majority of Entergy’s emissions are from fossil-fueled electricity
generation facilities. However, other sources include small sources at other company
facilities, a full list of facilities included in the inventory is contained in Attachment 1.
This list identifies Entergy’s fossil-fueled electricity generation assets and ownership
share. All other GHG emission-producing assets are assumed to be 100% owned by
Entergy.
List of GHGs Included – Entergy includes the following from various sources in its
inventory and management program:
Carbon dioxide (CO2)
Methane (CH4)
5
Nitrous Oxide (N2O)
Sulfur Hexafluoride (SF6)
Hydrofluorocarbons (HFC)
Perfluorocarbons are not included in Entergy’s inventory given the nature of its businessand that this class of chemicals is not used in any of Entergy’s operations in any sizeableamount.
Entergy Corporation Emission Sources
Process for Identifying Emissions Sources – The Climate Leaders spreadsheet “General
Emission Source Checklist” (Attachment 2), was created by Platts/E source as contractors
to EPA’s Climate Leaders program, and was originally utilized as an overall roadmap to
help identify GHG emission sources at Entergy locations. Within each line item, a
determination was made as to the applicability to Entergy’s operations. The findings of
this analysis are presented in the section below. Additionally, publicly-available data,
previous equipment inventories, internal company data, and existing air permit
information were utilized to identify GHG sources at company locations. This includes
an extensive analysis and estimates of emissions from small combustion sources co-
located at electrical power generating facilities or at stand alone facilities. The specific
information gathered and its sources are shown in Attachment 1 and 2 and summarized in
the sections below. Additionally, this information was further refined and updated based
on data submitted to the EPA for the mandatory GHG reporting rule in 2011. Entergy is
confident that this methodology has captured emission estimate information for the
majority of small source equipment at its locations.
Direct Sources
Entergy’s direct emissions are included in the following categories:
Stationary combustion: Entergy’s direct sources of GHGs include emissions from
the direct combustion of fossil-fuels in electrical generation boilers and small
sources at company facilities.
Mobile Combustion: Fossil fuels combusted in company fleet vehicles.
6
Fugitive Emissions: Methane (CH4) from natural gas distribution systems, SF6
from power transmission and distribution equipment, and HFCs from building
HVAC systems and district cooling operations.
Company activity data sources including contacts and information for the various
emissions from and/or usage of these assets are included in Attachment 2.
Indirect SourcesEntergy’s indirect sources of emissions include those from purchased electricity and
electrical line transmission/conversion losses. Data sources for the various emissions
from and/or usage of these assets are included in Attachment 2. All electricity consumed
in the operation of generating plants and consumed in Entergy’s various administrative
and commercial buildings and operations are accounted for in Entergy’s direct emissions
for stationary combustion. Additionally, line losses for self-generated and purchased
electricity are accounted for by the additional generation necessary to make-up for these
losses. There are no other indirect sources included in Entergy’s inventory or program.
Optional Sources
Entergy is reporting emissions associated with power purchased to meet customer
demand and support grid operations. This emission source is not required under EPA and
WRI reporting protocols. Entergy has elected to report these emissions because it has
decreased its self generation while increasing the amount of power it purchases.
Subsequently, trends in the Direct emissions category will not accurately represent the
full corporate emissions footprint and trends toward a reduction goal. Including
purchased power presents the most accurate representation of the emission footprint
required to support grid operations and meet customer demand. Other optional sources
such as employee travel and commuting are not included at this time; however, these will
be evaluated for inclusion in the future.
GHG Emissions Quantification
Quantification Method and Emission Factors
7
The quantification methodologies used in the Entergy inventory are commonly accepted
methods for measuring GHG emissions. For inventory years 2000-2004, Entergy used
methodologies outlined in the EPA Climate Leaders Protocol, or methodologies proposed
by Platts/E source staff and approved by EPA Climate Leaders staff. In a number of
cases, Entergy has used conservative estimation methodologies for expected de minimus
emission sources (<1% of corporate total). In all cases, these estimation methodologies
were reviewed and approved by EPA Climate Leaders staff and subsequently verified by
a third-party. When emissions are based on these conservative estimates, they are
identified as such below.
Emission factors used for the initial inventory were derived from various sources
including USEPA Climate Leaders GHG Protocol (derived from AP-42), US DOE, and
EPA’s eGRID system; these factors are updated as needed. The quantification
methodologies, emission factors and their sources can be found in the GHG inventory
calculation spreadsheets, accessible through Entergy’s external website
(www.entergy.com – see Environment/Performance).. Entergy remained engaged with
the EPA Climate Leaders Program updates and staff until the program was eliminated by
the agency. Entergy will monitor WRI protocol and other leading sources for updates in
order to stay aware of any changes to quantification methodologies, emission factors, or
protocol changes.
These approaches for emission quantifications were chosen because they represent the
most accurate and, in most cases, the only data source for such an exercise. Other
methods were not chosen due to the fact that other methods simply do not exist.
Direct Emissions
Entergy’s direct emissions are either measured directly via a continuous emissions
monitoring (CEM) system, calculated using emission factors and fuel throughput or other
relevant data, or estimated using equipment capacity factors and maximum fuel
throughput data. Direct GHG emissions are quantified separately for each GHG, and
8
then aggregated across Entergy by GHG constituent. The quantification method and data
source for each major category of direct GHG sources is detailed below.
Fossil-Fuel Combustion Boilers and Gas Turbines – Entergy’s electrical
generation equipment is heavily regulated by state and federal agencies and is
required to report emissions on a periodic basis. A continuous emission
monitoring (CEM) system is used at most plants to directly monitor emissions.
CO2 is directly monitored in these systems and other GHGs, such as CH4 and
N2O, are calculated based on the data collected by these systems. However, in
some cases, CO2 is calculated based on fuel throughput and heat rate data.
However the CO2 number is derived, it is reported to the EPA as required under
various agency regulatory programs. In 2012, this category represented 68.7% of
the corporate total.
Source: This GHG emissions data is reported to the ESP Group by Entergy’s FossilEnvironmental Support Group annually (at a minimum).
Small Sources at Company Facilities – This category includes equipment such as
emergency generators, house service boilers, natural gas-fired comfort heaters,
and other small combustion/emission sources not monitored by CEM systems at
company facilities. Inventories for 2000 to 2010 used an available equipment
inventory and information contained in facility air permits and compiled by
facility personnel, small source emissions were calculated for each plant for
which this data was available. This data was compiled in 1994 in the Fossil
Operations Equipment Inventory.
In 2011, Entergy reported small sources to the EPA under the mandatory GHG
reporting rule. These numbers were used in the 2011 inventory in order to align
regulatory reporting with this voluntary inventory. Changes to the overall number
were not material. In 2012, this category represented 0.9% of the corporate total.
Transportation Fleet Vehicles – Entergy’s Transportation Group maintains a
detailed inventory of vehicles owned and/or leased throughout the company. This
9
group also tracks information regarding the fleet’s fuel usage and miles traveled.
Additionally, Entergy’s Aviation Group (part of Human Resources and
Administration) maintains fuel usage information for our fleet of corporate
aircraft. This information was updated with 2012 data and used to calculate GHG
emissions for this equipment category. In 2012, this category represented 0.1% of
the corporate total. Entergy decided not to include GHG emissions resulting from
employee business travel and employee commuting; however, it may be included
in the future. Fleet emissions were quantified using units of all mobile fossil fuels
and default emission factors.
Source: The source of this information is the Manager, Transportation and the Aviation Group.
Fugitive Emissions: Methane – This category of emissions includes losses of
methane from Entergy’s natural gas distribution system and Entergy’s natural gas
storage facility. Losses of methane from the distribution system were estimated
using the Gas Research Institute’s protocol which USEPA may adopt as its
standard methodology for quantifying these emissions. This protocol uses input
data such as miles of pipe and number of services (steel, coated, and plastic),
number of meters (commercial and residential) and gas vented to estimate
methane emissions from these types of distribution systems. The emissions from
the storage facility were estimated, using Tier 1 factors for natural gas storage for
both vented and fugitive natural gas. In 2012, this category represented 0.2% of
the corporate total.
Source: These input data were obtained from the Manager, Gas Distribution Operations and
Fossil Operations, Sabine Plant.
Fugitive Emissions: HFCs – This category of emissions includes losses of HFCs
from HVAC equipment at buildings which Entergy owns or for which it holds a
capital lease, from Entergy’s district cooling/thermal operations (chillers), and
from Entergy vehicular air conditioning. For the indoor air cooling equipment,
square footage of company building space was collected and an emission factor
10
developed by Platts/E source was applied to this number in order to estimate HFC
losses from this equipment. This emission factor is based on national averages of
tonnage of equipment per square foot of space and average leakage rates of
common air conditioning equipment. An investigation revealed that no HFC-
based air or water pre-cooling is performed at any Entergy electric power
generation facilities. Conservative estimates were completed for all sources of
HFC emissions; this category of emissions was determined to be de minimus. In
2012, this category represented less than 0.1% of the corporate total. For the
district cooling operations, information regarding chiller equipment located at
these facilities, along with estimates of equipment leakage rates were used to
derive the initial inventory estimates. The calculations behind all factors used in
estimating HFC emissions can be found in the inventory spreadsheet (Attachment
1).
Source: The source of this information was the Manager, Real Estate Operations and the Director,
Thermal Operations.
Fugitive Emissions: SF6 – This category of emissions includes operational and
unintentional releases of SF6 used in electricity transmission equipment.
Emissions of this gas are estimated using a protocol similar to the protocol
utilized for EPA’s SF6 Emission Reduction Partnership Program. The protocol
for derivation of this emission estimate is primarily a mass balance exercise. In
2012, this category represented 0.3% of the corporate total.
Source: The source of this information is the Manager, Environmental in Entergy’s Transmission
and Distribution Organization. SF6 emission estimates are reported to ESP at least once per year.
Estimates completed for each fugitive GHG emissions category above resulted in
finding that aggregated fugitive emissions from all sources across Entergy are
de minimus. Accordingly, a consistent quantity of emissions is included in the
inventory for each emissions source category and will be carried forward annually
unless a significant change in this category occurs.
11
Indirect Emissions
Transmission/Distribution System Line Losses – Line losses associated with
power purchased to support the utility operations are considered required indirect
emissions under EPA and Scope 2 Indirect under WRI reporting requirements.
Emissions from T&D losses of purchased power are calculated by applying
Entergy’s system loss factor to the total amount of power purchased. The custom
loss factor is developed using power data from the 5 utilities’ FERC Form 1s
(specific data noted in “purchased power” worksheet in inventory). This custom
factor was calculated for 2004 data using 2004 FERC forms and applied to
purchased power amounts of previous years of GHG inventories (2000-2003)
rather than recalculating this factor for each prior year. This emission estimate is
calculated and presented; however, it is not subtracted from the purchased power
emission number described below since the bulk of purchased power is generated
from within Entergy’s service area. T&D line losses are already accounted for in
the extra generation required to make up for these losses.
Optional Emissions
Purchased Power – This category of emissions includes those from power
purchased by Entergy to supplement its own supply in order to meet customer
demand and/or support utility operations. In some cases, the source of this power
is known (controllable or unit-contingent purchases). The remaining sources of
purchased power are either not known (non-controllable or grid purchases) or can
not be controlled for some other reason. Under the EPA and WRI protocols,
including emissions from power purchased by utilities is optional. Entergy has
opted to include all purchased power in its GHG inventory and subsequent
tracking since these purchases are required to meet customer demand and in order
to fully characterize the GHG footprint of its operations. In 2012, this category
represented 29.6% of the corporate total.
12
Both controllable and non-controllable purchase information (in terms of millions
of megawatt-hours) was collected. In the case of non-controllable purchases, the
SERC MS Valley emission factors from the eGRID system (2010 version using
2007 data) were used to calculate GHG emissions. In the case of controllable
purchases, supplier and unit-specific emission rate information from eGRID,
where available, was used to develop a supplier-specific custom GHG emissions
factor. If supplier-specific GHG emission factors were not available, the regional
grid factor from eGRID was used as a default.
To avoid double counting, intra-system billing (ISB) purchases were subtracted
from the non-controllable purchase total. These purchases are from the Entergy
unregulated generation business (Entergy Wholesale Commodities – EWC) and
are already accounted for in direct emissions. This results in obtaining the “non-
affiliated purchases” from the appropriate data manager.
Source: All data regarding power purchases were obtained and are available from Entergy’s
System Planning Group. Primary contact for the data was the Sr. Staff Engineer in the Energy
Analysis and Reporting Group. Generation Accounting supplies the TOTAL purchased power
number for the entire company.
13
Data Management
Activity Data
In all cases, the best available activity data was used to calculate or estimate emissions
from a specific source. All collected data for each source is maintained by the data
source identified in the previous section.
The primary source of data related to Entergy’s largest category of emissions
(representing 68.9% of total corporate emissions in 2012) is CEM system data. CEM
system data from monitored plants is managed by Entergy’s Fossil Environmental
Support Group. CEM system data is closely managed and maintains a high level of
quality control as required by EPA regulations (40 CFR Part 75). The Director, Fossil
Environmental Support is responsible for maintaining these data; the primary contact for
these data is the Supervisor, Emission Monitoring and Markets. CEMS data is sourced
from the data acquisition and handling system (DAHS), which is the software package
used to manage and query CEMS data. A report is generated for the annual CO2
emissions and provided to the Manager, Corporate Environmental Operations (see further
description below of how the inventory is generated).
Controllable Power purchase information is managed by the Manager, System Planning
using an internally developed software package called TRADES. This system is used by
the power buyers to track, validate and eventually invoice individual transactions
necessary to support grid operations. Total power purchase data is sourced from the
Manager, Generation and Fuels Accounting and is sourced from the General Ledger
(GL). ISB feeds data into the GL on a monthly basis; accordingly, the initial source of
these data is ISB through the GL. Other data categories are managed as described in the
section above.
Data Management
All data required for the inventory is either reported to or collected by the Manager,
Corporate Environmental Operations in the ESP Group in the January/February
14
timeframe. This information is maintained in electronic files and calculation
spreadsheets. The specific steps of the process are described further below:
DATA RECEIPT – the data described above are transmitted to ESP in the form of
spreadsheet files via email attachment. This transmittal method is secure and
reliable. Once received, the spreadsheet files are saved to a shared Directory
under the ‘GHG Inventory’ folder.
DATA REVIEW AND MANIPULATION – spreadsheets are accessed and
reviewed for the relevant information. In some cases, the data are sorted, totaled
and formatted to facilitate entry into the inventory spreadsheet. The data also is
reviewed during this step to evaluate the overall magnitude to identify any
obvious errors or omissions.
DATA ENTRY – data is entered into the draft working version of the GHG
inventory. During this step, an additional review for data reasonableness and
completeness is performed. Any obvious errors or omissions are addressed
directly with the data manager by phone or email, as needed. All of the data
sources are either entered directly into the inventory or are used for further
calculation of the necessary data points required to develop the overall inventory.
All supporting calculations and spreadsheets are housed on the shared directory
noted above.
QA/QC AND TECHNICAL REVIEW – where data entry is required, a double
check and a reverse double check is always performed. A double check review is
simply another review of the numbers entered into the working draft version of
the inventory, while a reverse double check is an evaluation of the data entered
against the working draft version of the inventory to ensure all data points are
included. Once this review is completed, the draft version is circulated to several
technical reviewers within the company; feedback is used to modify the inventory
as needed.
15
Annual inventories and IMPRD updates are published and posted on SENet, Entergy’s
intranet portal for all information related to Safety and Environmental issues.
Additionally, Entergy posts the total inventory number, along with the verification
statement and other information to its registry account with the American Carbon
Registry (www.americancarbonregistry.org) and on Entergy’s external website
(www.entergy.com – see Environmental/Performance). Entergy will continue to use and
update the inventory template in future years in order to remain as consistent as possible.
Key Performance Indicator Selection and Data Collection
Entergy’s goal is to stabilize GHG emissions at 20% below 2000 levels on an absolute
basis through 2020. The goal does not use emissions intensity; however, on an as needed
basis, Entergy does calculate and evaluate GHG emission intensities. The primary
intensity measure used is tons of emissions per megawatt hour.
Data Collection Process Quality Assurance
The owners of data identified in the previous section are responsible for maintaining
data quality assurance. Every effort should be made to ensure that the data reported are
accurate and complete. ESP will evaluate the data, once collected, to ensure that it is
reasonable and consistent with past years. ESP will also conduct and document QA
checks during the production of the inventory.
As part of the process each data manager uses for collecting GHG data, they must define
and document any areas of possible error and the QA/QC actions they use to maintain
accuracy. CEMS data quality is maintained in accordance with the compliance
requirements contained in EPA regulations (40 CFR Part 75). Any departures from these
data quality measures (i.e. non-compliance events) should be communicated to ESP.
Possible errors in emissions factors and calculations are also documented with the
emissions factors and calculations records. Any inconsistencies and large unexpected
changes from the previous year’s data should be sufficiently explained when the data is
transmitted. The Manager, Corporate Environmental Operations will compare the current
16
year’s data for each source category to the previous year’s data in order to identify any
large, unexpected variations. The data also is reviewed and all calculations validated to
ensure that the calculations are correct.
Data Collection System Security and Integrated Tools
Data is typically transferred through Entergy’s e-mail system. Security of this system is
the responsibility of the IT group. Security of the data once it is collected and
consolidated is the responsibility of ESP. Every effort will be made to ensure the security
of the inventory information, primarily by saving this information to the shared directory
in the ‘GHG Inventory’ folder. The shared directory is only accessible by employees in
the ESP group. Entergy’s external website (www.entergy.com) and the Entergy’s
registry account with the American Carbon Registry (www.americancarbonregistry.org)
will serve as the final publication repository for the GHG inventory.
Frequency
Data will be reported to/collected by ESP on an annual basis. This information will be
used to produce an updated GHG inventory each year. No later than the end of the 1st
quarter of each year, ESP will produce an updated inventory for the previous calendar
year. A verification audit will be conducted by an independent third-party. Beginning in
2012, this verification audit will be conducted in accordance with the international
standard – ISO 14064.3. This updated inventory will be used to track progress against
the reduction goal discussed above.
Base Year
Adjustment for Structural Changes – The base year (2000) will be adjusted for mergers,
acquisitions, and divestitures that occur during the reporting time frame for the goal.
Actual yearly emissions the acquisition of each emission-producing entity/asset that
existed during the base year will be added to the base year and each year that follows.
Emissions from divestitures of assets that existed during the base year will be removed
from the base year and every year that follows. Mergers and capital leases on emission-
producing assets will be planned in the same manner as the acquisitions to the degree that
17
it is practical. There are no planned adjustments for outsourcing. Mergers, acquisition,
divestitures, and capital leases will be identified by ESP and integrated into the GHG
inventory for the calendar year when the deal closes. Additionally, data managers should
keep ESP informed of any such changes. Finally, ESP will monitor such changes
through the investment approval process, which it participates in on as a subject matter
expert.
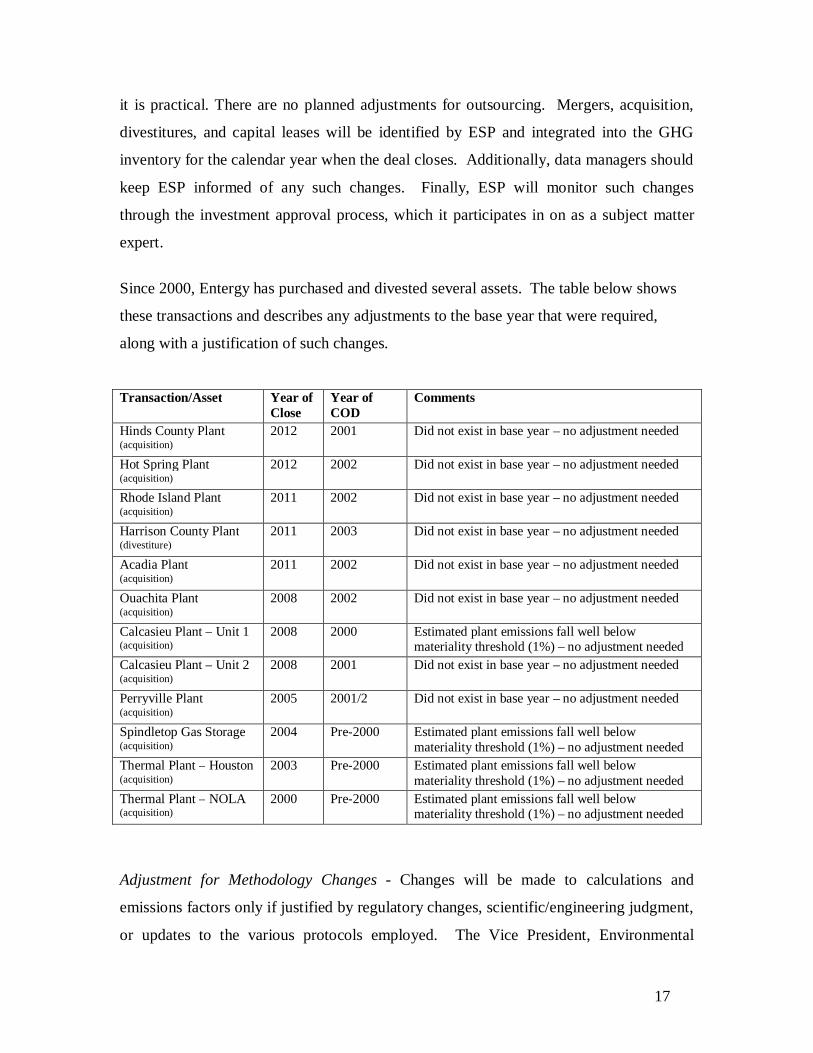
Since 2000, Entergy has purchased and divested several assets. The table below shows
these transactions and describes any adjustments to the base year that were required,
along with a justification of such changes.
Transaction/Asset Year ofClose
Year ofCOD
Comments
Hinds County Plant(acquisition)
2012 2001 Did not exist in base year – no adjustment needed
Hot Spring Plant(acquisition)
2012 2002 Did not exist in base year – no adjustment needed
Rhode Island Plant(acquisition)
2011 2002 Did not exist in base year – no adjustment needed
Harrison County Plant(divestiture)
2011 2003 Did not exist in base year – no adjustment needed
Acadia Plant(acquisition)
2011 2002 Did not exist in base year – no adjustment needed
Ouachita Plant(acquisition)
2008 2002 Did not exist in base year – no adjustment needed
Calcasieu Plant – Unit 1(acquisition)
2008 2000 Estimated plant emissions fall well belowmateriality threshold (1%) – no adjustment needed
Calcasieu Plant – Unit 2(acquisition)
2008 2001 Did not exist in base year – no adjustment needed
Perryville Plant(acquisition)
2005 2001/2 Did not exist in base year – no adjustment needed
Spindletop Gas Storage(acquisition)
2004 Pre-2000 Estimated plant emissions fall well belowmateriality threshold (1%) – no adjustment needed
Thermal Plant – Houston(acquisition)
2003 Pre-2000 Estimated plant emissions fall well belowmateriality threshold (1%) – no adjustment needed
Thermal Plant – NOLA(acquisition)
2000 Pre-2000 Estimated plant emissions fall well belowmateriality threshold (1%) – no adjustment needed
Adjustment for Methodology Changes - Changes will be made to calculations and
emissions factors only if justified by regulatory changes, scientific/engineering judgment,
or updates to the various protocols employed. The Vice President, Environmental
18
Strategy & Policy will make the final decision as to whether or not make such
adjustments. In cases where changes are made, the changes will be made to all years in
the inventory, including the base year, so that all emissions are reported using the same
basis for all years.
An IMPRD Revision Log is included in this document as Attachment 4 and should be
used to document any structural or methodological changes to corporate greenhouse gas
inventories or this IMPRD.
Management Tools
Roles and Responsibilities
The Vice President, Environmental Strategy & Policyis responsible for overall GHG
program management and external reporting. This individual is also responsible for
compiling the data required to update the GHG inventory on an annual basis before the
end of Q1 and for evaluating the reasonableness of the GHG data.
He/she also reviews changes to the programs that Entergy participates in and updates the
IMPRD as needed. These responsibilities are defined in more detail in specific sections of
this IMPRD. ESP then produces and distributes needed reports summarizing the
emissions inventory and progress toward the goal.
ESP also provides guidance and feedback to relevant company Managers and Directors
on what sources to include in the inventory, what data to use and collect, and what
emissions factors are most appropriate.
Various Managers and Directors around the company are responsible for maintaining the
data necessary to complete the inventory and subsequent updates. Entergy’s
Environmental Leadership Team (ELT) reviews and approves the summary of each
year’s data.
19
Communication
The IMPRD will be communicated upon initial finalization and subsequently on a
periodic basis, when major revisions occur or as needed. Opportunities for
communication with Data Managers include when training is delivered, when data
requests are made and when the IMPRD is revised.
Training
Entergy currently has no training materials available regarding GHG management or
inventory. Training will be delivered on an ad hoc basis to employees involved in the
process. The Manager, Corporate Environmental Operations will conduct this training as
needed.
Document Retention and Control Policy
Entergy’s GHG management program and all relevant records and documentation should
be managed in accordance with Entergy's Records Management & Retention Policy.
Entergy’s external website will serve as the final publication repository for the GHG
inventory. The external website is accessible via the internet. Additionally, the annual
inventory, verification statement and IMPRD will be submitted to the American Carbon
Registry for posting on Entergy’s registry account. This is accessible to anyone via the
ACR website (www.americancarbonregistry.com).
Data verification and documentation is essential for the authenticity of this program. To
maintain a high standard, all records verifying the GHG inventories and registry contents
will be maintained by ESP for a minimum of three years. Documentation of GHG
reduction project expenditures and project close-out reports shall also be maintained for a
minimum of three years.
20
Auditing and Verification
Internal Auditing
Internal auditing of the GHG program will be conducted by ESP staff or designee. Some
of the data used to develop emission estimates are also audited through Entergy’s Safety
and Environment Audit Program (i.e., CEMS data/processes) administered by ESP.
Findings related to the GHG Inventory will be provided to the VP, ESP who will
determine the responsible individual for each finding’s corrective action. The audit will
include a review of the IMPRD and the latest version of the inventory. A consistency
check is also performed against the prior year’s data, especially in the area of direct
emissions. Changes to the IMPRD driven by audit results will also be entered into the
IMPRD Revision Log (Attachment 4).
External Validation and/or Verification
Entergy is committed to an external third-party audit of the GHG baseline/inventory data,
calculations, and records. This third-party verification of the program will be conducted
at least every other year, including 2006 and the goal year. Since 2006, Entergy has
sought annual, third-party verification of the GHG Inventory. The verification statement
and report are made available via the ACR website and Entergy’s external website.
In 2012, Entergy decided to elevate this third-party verification audit to the ISO standard
for GHG Inventory preparation and verification (ISO 14064.3). This is an expanded
verification effort that requires a higher level of scrutiny and additional data
review/evaluation. The verification report will include a statement regarding the type of
verification, level of assurance and an uncertainty analysis. The uncertainty analysis
identifies, describes and quantifies the largest sources of uncertainty for the GHG
Inventory. See Attachment 3 for the full verification report.
Management Review
The GHG emissions summary data will be reviewed and approved annually by the ELT.
Goal setting, progress toward meeting goals, and any additional action or options
necessary to meet the goals will be covered in this management review. The VP, ESP
21
will verify that the information has been reviewed and found to be substantially
compliant with this IMPRD. Additionally, this information will be presented to the Audit
Committee of the Board of Directors during our annual reporting cycle.
Corrective Action
Any findings identified through QA/QC and internal and external reviews related to the
greenhouse gas inventory or IMPRD are assigned to the appropriate Manager or Director
for action by the VP, ESP. The VP, ESP will maintain a list of identified gaps related to
the program, the person that is responsible for closing the gap, and the required timing for
gap closure. Changes to the IMPRD driven by this process will also be entered into the
IMPRD Revision Log (Attachment 4).
Any findings identified through QA/QC and internal and external audits related to the
GHG emission inventory, calculations, or reporting are assigned to the VP, ESP or his
designee.
1
Voluntary Commitment and Reduction Efforts
Voluntary Commitments
In May 2001, Entergy publicly committed to stabilize CO2 emissions from its power
plants at year 2000 levels through 2005, and dedicated $25 million in supplemental
corporate funding to achieve this target over the five-year period. This commitment was
focused on CO2 emissions from fuel combustion at the company’s power plants and
required that Entergy:
Stabilize CO2 emissions from its U.S. power plants at year 2000 levels through
2005.
Establish the $25 Million Environmental Initiatives Fund (EIF) in support of
achieving the 2001-2005 stabilization targets.
Document activities and annual report progress.
Employ an independent third-party organization to verify measurement of
Entergy’s CO2 emissions from U.S. power plants.
Entergy completed this first commitment 23 percent below year 2000 levels.
Entergy’s second commitment, made in 2005, included:
Stabilize CO2 emissions from all Entergy operations at 20% below 2000 levels
through 2010.
Commit funding of $3.25 million in support of achieving the 2005-2010 target.
Document activities and annually report progress.
Entergy completed this second commitment more than three percent below the target. On
a cumulative basis, Entergy bettered the two commitments by over 14 percent.
In 2011, Entergy once again renewed its commitment to stabilize GHGs with a third
commitment:
Stabilize CO2 emissions from all Entergy operations at 20% below 2000 levels
through 2020.
2
Commit funding of $10 million in support of achieving the 2011-2020 target.
Document activities and annually report progress.
Additional information on these commitments can be viewed on Entergy's website.
Voluntary Reductions
Since 2001, Entergy has invested in various types of internal and external emission
reduction projects. These projects range from internal plant efficiency improvements, to
reforestation projects, to carbon offset purchases. These projects are described annually
in the Environmental Section of Entergy’s Sustainability Report.
In addition to the projects described above, Entergy owns several facilities that generate
electricity without emission of GHGs. Entergy’s nuclear fleet (10,101 MW), wind farms
(80 MW) and hydro plants (74 MW) generate virtually emission-free electricity and
constitute a major portion of Entergy’s overall generation mix (more than 35% at the end
of 2012).

Attachment 1
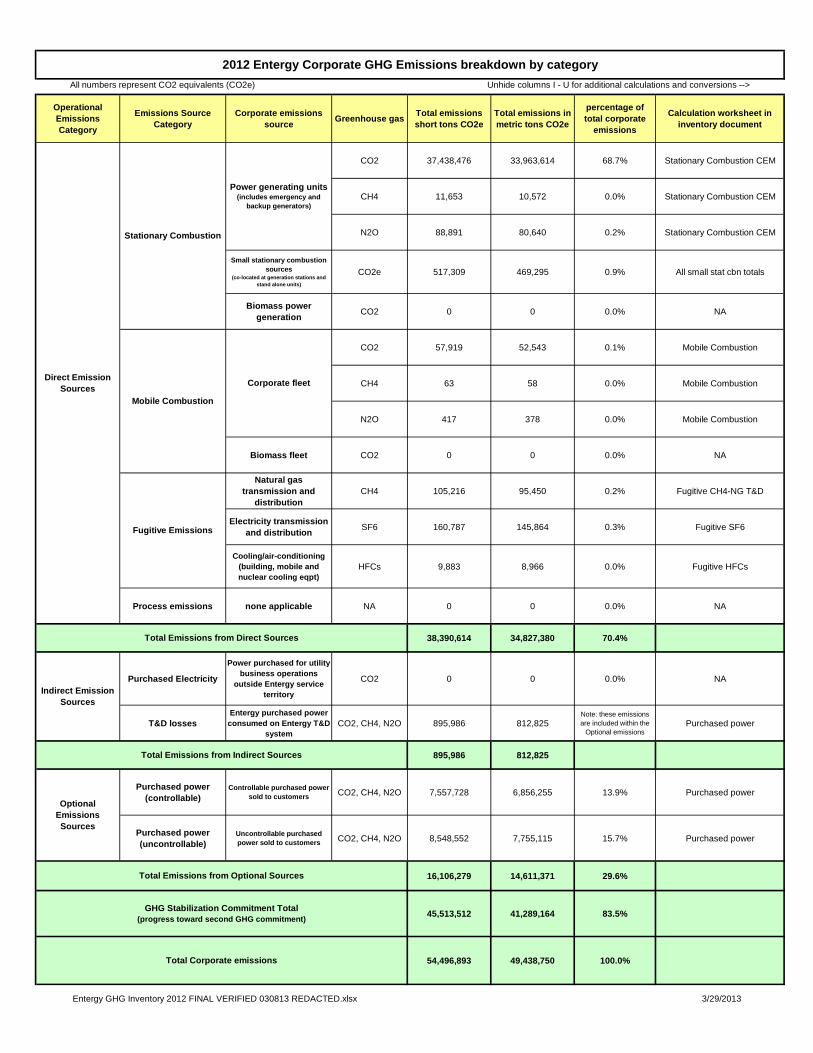
2012 GHG Inventory – FINAL and VERIFIED
OperationalEmissionsCategory
Emissions SourceCategory
Corporate emissionssource Greenhouse gas Total emissions
short tons CO2eTotal emissions inmetric tons CO2e
percentage oftotal corporate
emissions
Calculation worksheet ininventory document
CO2 37,438,476 33,963,614 68.7% Stationary Combustion CEM
CH4 11,653 10,572 0.0% Stationary Combustion CEM
N2O 88,891 80,640 0.2% Stationary Combustion CEM
Small stationary combustionsources
(co-located at generation stations andstand alone units)
CO2e 517,309 469,295 0.9% All small stat cbn totals
Biomass powergeneration CO2 0 0 0.0% NA
CO2 57,919 52,543 0.1% Mobile Combustion
CH4 63 58 0.0% Mobile Combustion
N2O 417 378 0.0% Mobile Combustion
Biomass fleet CO2 0 0 0.0% NA
Natural gastransmission and
distributionCH4 105,216 95,450 0.2% Fugitive CH4-NG T&D
Electricity transmissionand distribution SF6 160,787 145,864 0.3% Fugitive SF6
Cooling/air-conditioning(building, mobile andnuclear cooling eqpt)
HFCs 9,883 8,966 0.0% Fugitive HFCs
Process emissions none applicable NA 0 0 0.0% NA
38,390,614 34,827,380 70.4%
Purchased Electricity
Power purchased for utilitybusiness operations
outside Entergy serviceterritory
CO2 0 0 0.0% NA
T&D lossesEntergy purchased power
consumed on Entergy T&Dsystem
CO2, CH4, N2O 895,986 812,825Note: these emissionsare included within the
Optional emissionsPurchased power
895,986 812,825
Purchased power(controllable)
Controllable purchased powersold to customers CO2, CH4, N2O 7,557,728 6,856,255 13.9% Purchased power
Purchased power(uncontrollable)
Uncontrollable purchasedpower sold to customers CO2, CH4, N2O 8,548,552 7,755,115 15.7% Purchased power
16,106,279 14,611,371 29.6%
45,513,512 41,289,164 83.5%
54,496,893 49,438,750 100.0%
2012 Entergy Corporate GHG Emissions breakdown by categoryAll numbers represent CO2 equivalents (CO2e) Unhide columns I - U for additional calculations and conversions -->
Stationary Combustion
Direct EmissionSources
Mobile Combustion
Fugitive Emissions
Total Corporate emissions
Total Emissions from Indirect Sources
Indirect EmissionSources
OptionalEmissionsSources
GHG Stabilization Commitment Total(progress toward second GHG commitment)
Total Emissions from Optional Sources
Total Emissions from Direct Sources
Power generating units(includes emergency and
backup generators)
Corporate fleet
Entergy GHG Inventory 2012 FINAL VERIFIED 030813 REDACTED.xlsx 3/29/2013
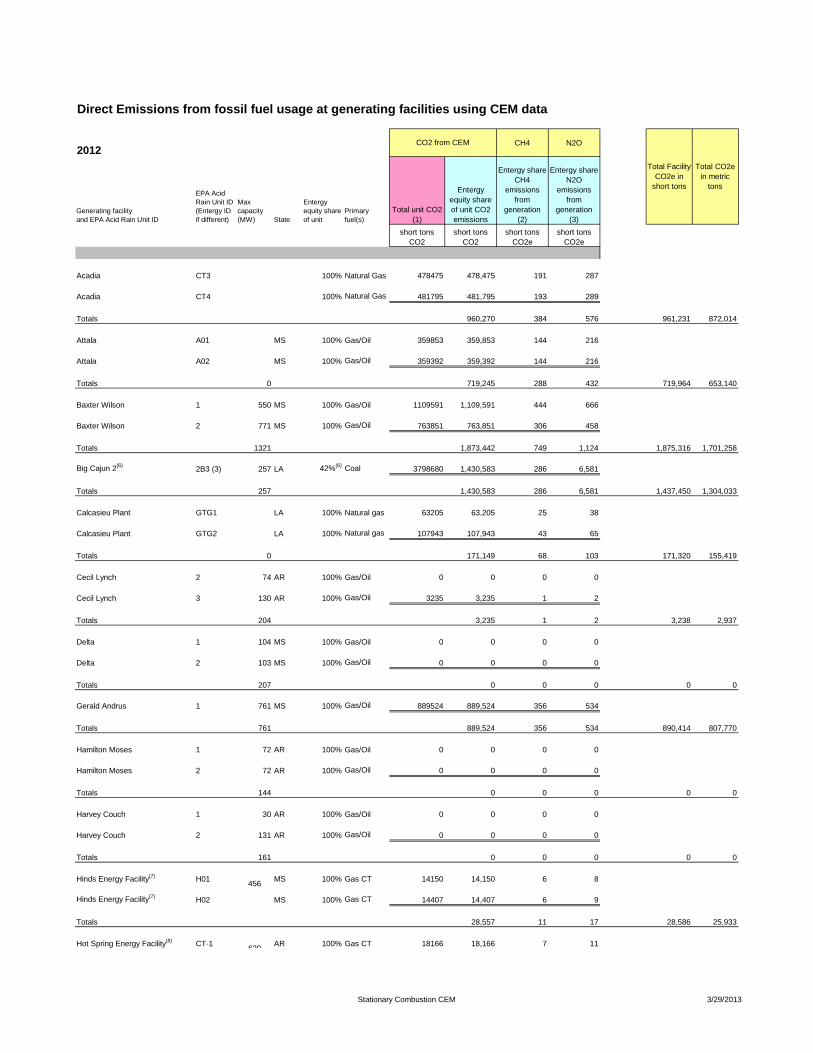
2012CH4 N2O
Generating facilityand EPA Acid Rain Unit ID
EPA AcidRain Unit ID(Entergy IDif different)
Maxcapacity(MW) State
Entergyequity shareof unit
Primaryfuel(s)
Total unit CO2(1)
Entergyequity shareof unit CO2emissions
Entergy shareCH4
emissionsfrom
generation(2)
Entergy shareN2O
emissionsfrom
generation(3)
short tonsCO2
short tonsCO2
short tonsCO2e
short tonsCO2e
Acadia CT3 100% Natural Gas 478475 478,475 191 287
Acadia CT4 100% Natural Gas 481795 481,795 193 289
Totals 960,270 384 576 961,231 872,014
Attala A01 MS 100% Gas/Oil 359853 359,853 144 216
Attala A02 MS 100% Gas/Oil 359392 359,392 144 216
Totals 0 719,245 288 432 719,964 653,140
Baxter Wilson 1 550 MS 100% Gas/Oil 1109591 1,109,591 444 666
Baxter Wilson 2 771 MS 100% Gas/Oil 763851 763,851 306 458
Totals 1321 1,873,442 749 1,124 1,875,316 1,701,258
Big Cajun 2(6) 2B3 (3) 257 LA 42%(6) Coal 3798680 1,430,583 286 6,581
Totals 257 1,430,583 286 6,581 1,437,450 1,304,033
Calcasieu Plant GTG1 LA 100% Natural gas 63205 63,205 25 38
Calcasieu Plant GTG2 LA 100% Natural gas 107943 107,943 43 65
Totals 0 171,149 68 103 171,320 155,419
Cecil Lynch 2 74 AR 100% Gas/Oil 0 0 0 0
Cecil Lynch 3 130 AR 100% Gas/Oil 3235 3,235 1 2
Totals 204 3,235 1 2 3,238 2,937
Delta 1 104 MS 100% Gas/Oil 0 0 0 0
Delta 2 103 MS 100% Gas/Oil 0 0 0 0
Totals 207 0 0 0 0 0
Gerald Andrus 1 761 MS 100% Gas/Oil 889524 889,524 356 534
Totals 761 889,524 356 534 890,414 807,770
Hamilton Moses 1 72 AR 100% Gas/Oil 0 0 0 0
Hamilton Moses 2 72 AR 100% Gas/Oil 0 0 0 0
Totals 144 0 0 0 0 0
Harvey Couch 1 30 AR 100% Gas/Oil 0 0 0 0
Harvey Couch 2 131 AR 100% Gas/Oil 0 0 0 0
Totals 161 0 0 0 0 0
Hinds Energy Facility(7) H01 MS 100% Gas CT 14150 14,150 6 8
Hinds Energy Facility(7) H02 MS 100% Gas CT 14407 14,407 6 9
Totals 28,557 11 17 28,586 25,933
Hot Spring Energy Facility(8) CT-1 AR 100% Gas CT 18166 18,166 7 11
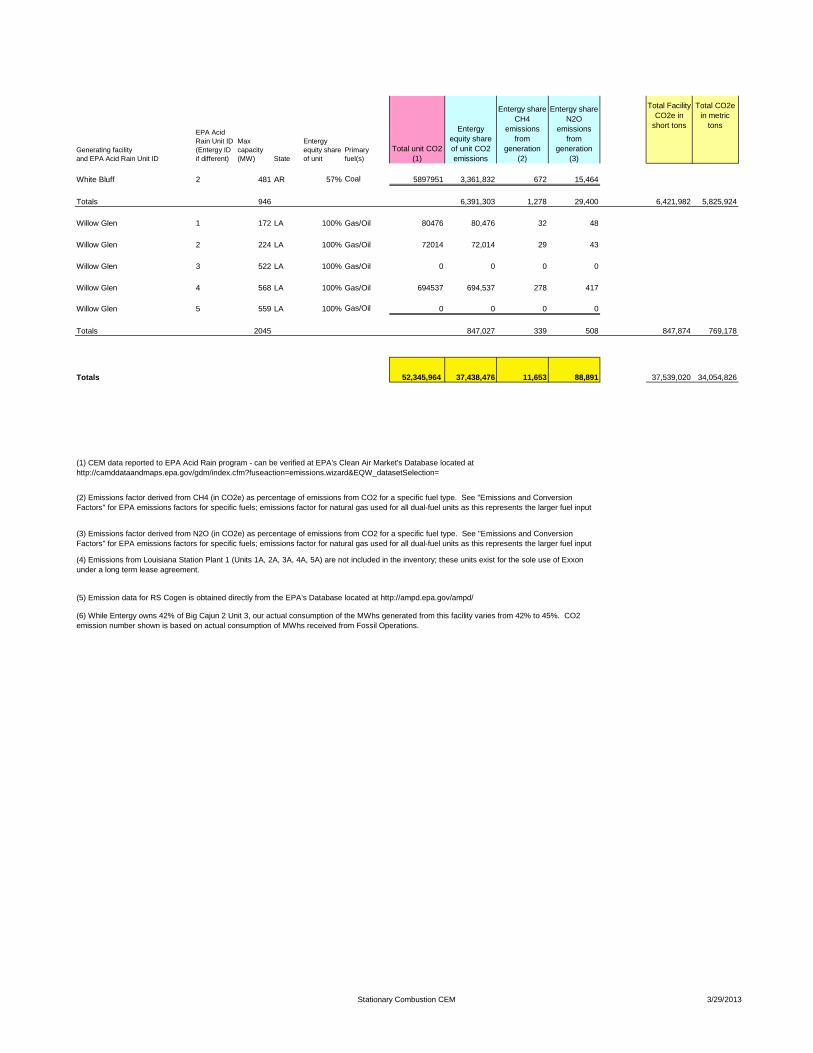
Direct Emissions from fossil fuel usage at generating facilities using CEM data
CO2 from CEM
Total FacilityCO2e in
short tons
Total CO2ein metric
tons
456
620
Stationary Combustion CEM 3/29/2013
Generating facilityand EPA Acid Rain Unit ID
EPA AcidRain Unit ID(Entergy IDif different)
Maxcapacity(MW) State
Entergyequity shareof unit
Primaryfuel(s)
Total unit CO2(1)
Entergyequity shareof unit CO2emissions
Entergy shareCH4
emissionsfrom
generation(2)
Entergy shareN2O
emissionsfrom
generation(3)
Total FacilityCO2e in
short tons
Total CO2ein metric
tons
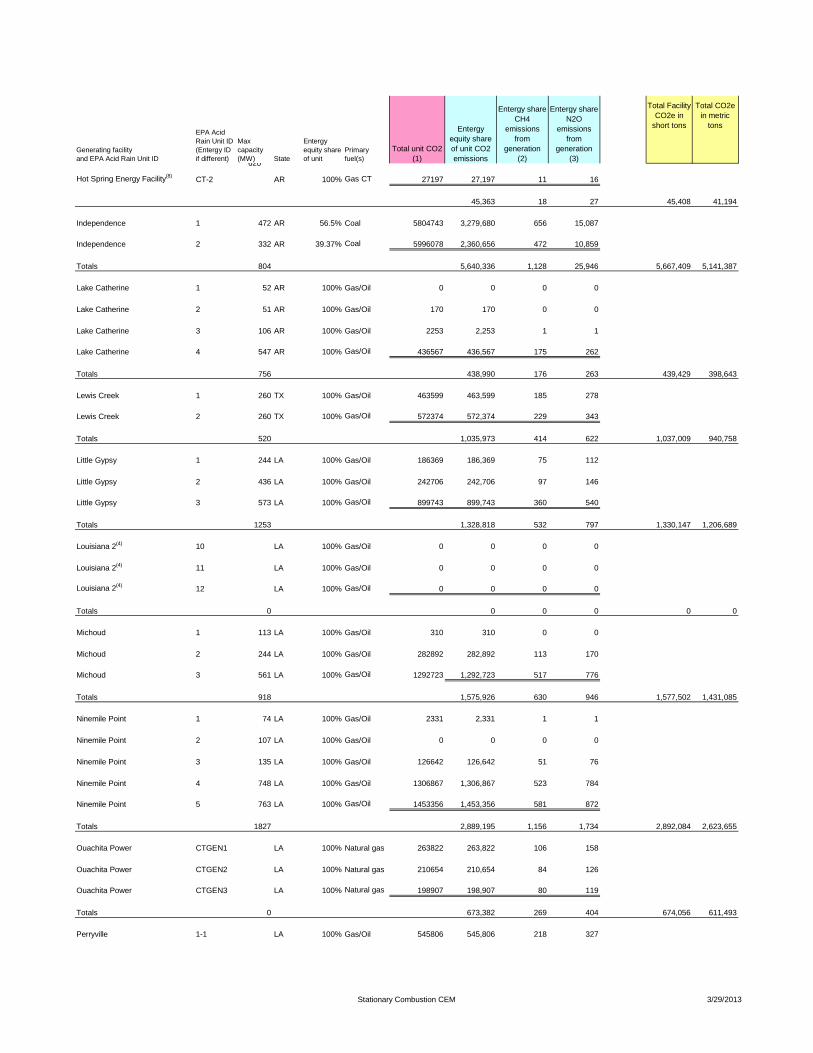
Hot Spring Energy Facility(8) CT-2 AR 100% Gas CT 27197 27,197 11 16
45,363 18 27 45,408 41,194
Independence 1 472 AR 56.5% Coal 5804743 3,279,680 656 15,087
Independence 2 332 AR 39.37% Coal 5996078 2,360,656 472 10,859
Totals 804 5,640,336 1,128 25,946 5,667,409 5,141,387
Lake Catherine 1 52 AR 100% Gas/Oil 0 0 0 0
Lake Catherine 2 51 AR 100% Gas/Oil 170 170 0 0
Lake Catherine 3 106 AR 100% Gas/Oil 2253 2,253 1 1
Lake Catherine 4 547 AR 100% Gas/Oil 436567 436,567 175 262
Totals 756 438,990 176 263 439,429 398,643
Lewis Creek 1 260 TX 100% Gas/Oil 463599 463,599 185 278
Lewis Creek 2 260 TX 100% Gas/Oil 572374 572,374 229 343
Totals 520 1,035,973 414 622 1,037,009 940,758
Little Gypsy 1 244 LA 100% Gas/Oil 186369 186,369 75 112
Little Gypsy 2 436 LA 100% Gas/Oil 242706 242,706 97 146
Little Gypsy 3 573 LA 100% Gas/Oil 899743 899,743 360 540
Totals 1253 1,328,818 532 797 1,330,147 1,206,689
Louisiana 2(4) 10 LA 100% Gas/Oil 0 0 0 0
Louisiana 2(4) 11 LA 100% Gas/Oil 0 0 0 0
Louisiana 2(4) 12 LA 100% Gas/Oil 0 0 0 0
Totals 0 0 0 0 0 0
Michoud 1 113 LA 100% Gas/Oil 310 310 0 0
Michoud 2 244 LA 100% Gas/Oil 282892 282,892 113 170
Michoud 3 561 LA 100% Gas/Oil 1292723 1,292,723 517 776
Totals 918 1,575,926 630 946 1,577,502 1,431,085
Ninemile Point 1 74 LA 100% Gas/Oil 2331 2,331 1 1
Ninemile Point 2 107 LA 100% Gas/Oil 0 0 0 0
Ninemile Point 3 135 LA 100% Gas/Oil 126642 126,642 51 76
Ninemile Point 4 748 LA 100% Gas/Oil 1306867 1,306,867 523 784
Ninemile Point 5 763 LA 100% Gas/Oil 1453356 1,453,356 581 872
Totals 1827 2,889,195 1,156 1,734 2,892,084 2,623,655
Ouachita Power CTGEN1 LA 100% Natural gas 263822 263,822 106 158
Ouachita Power CTGEN2 LA 100% Natural gas 210654 210,654 84 126
Ouachita Power CTGEN3 LA 100% Natural gas 198907 198,907 80 119
Totals 0 673,382 269 404 674,056 611,493
Perryville 1-1 LA 100% Gas/Oil 545806 545,806 218 327
620
Stationary Combustion CEM 3/29/2013
Generating facilityand EPA Acid Rain Unit ID
EPA AcidRain Unit ID(Entergy IDif different)
Maxcapacity(MW) State
Entergyequity shareof unit
Primaryfuel(s)
Total unit CO2(1)
Entergyequity shareof unit CO2emissions
Entergy shareCH4
emissionsfrom
generation(2)
Entergy shareN2O
emissionsfrom
generation(3)
Total FacilityCO2e in
short tons
Total CO2ein metric
tons
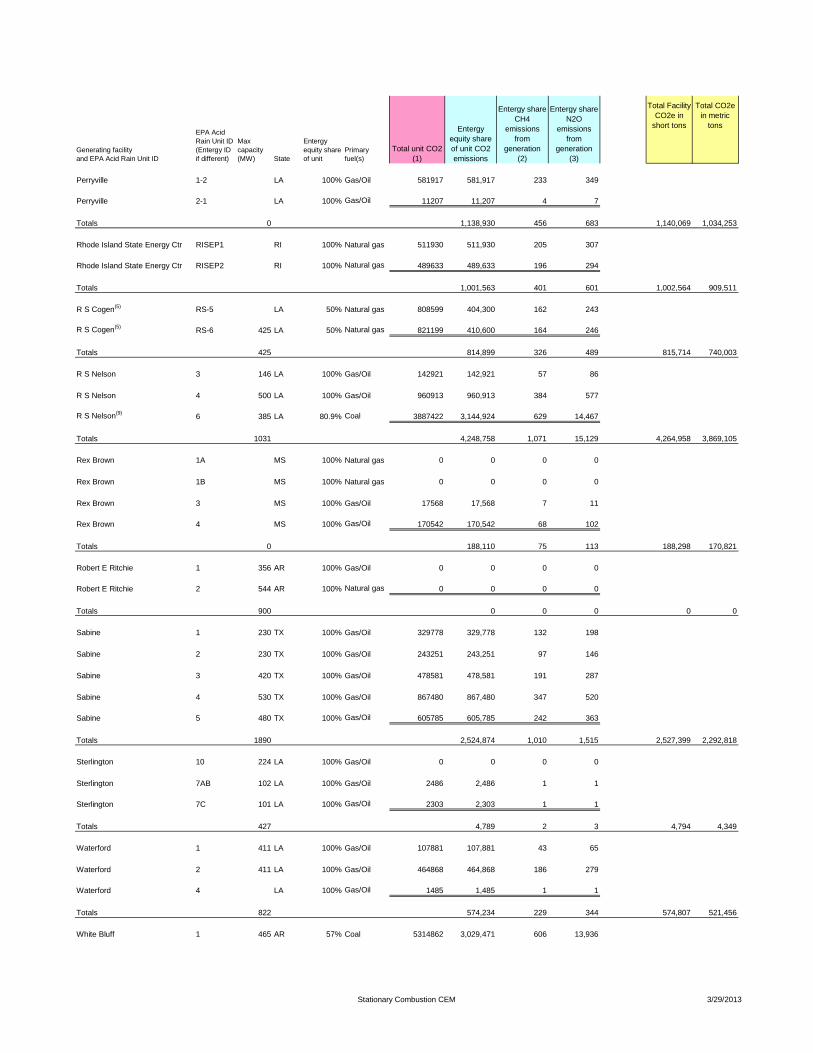
Perryville 1-2 LA 100% Gas/Oil 581917 581,917 233 349
Perryville 2-1 LA 100% Gas/Oil 11207 11,207 4 7
Totals 0 1,138,930 456 683 1,140,069 1,034,253
Rhode Island State Energy Ctr RISEP1 RI 100% Natural gas 511930 511,930 205 307
Rhode Island State Energy Ctr RISEP2 RI 100% Natural gas 489633 489,633 196 294
Totals 1,001,563 401 601 1,002,564 909,511
R S Cogen(5) RS-5 LA 50% Natural gas 808599 404,300 162 243
R S Cogen(5) RS-6 425 LA 50% Natural gas 821199 410,600 164 246
Totals 425 814,899 326 489 815,714 740,003
R S Nelson 3 146 LA 100% Gas/Oil 142921 142,921 57 86
R S Nelson 4 500 LA 100% Gas/Oil 960913 960,913 384 577
R S Nelson(9) 6 385 LA 80.9% Coal 3887422 3,144,924 629 14,467
Totals 1031 4,248,758 1,071 15,129 4,264,958 3,869,105
Rex Brown 1A MS 100% Natural gas 0 0 0 0
Rex Brown 1B MS 100% Natural gas 0 0 0 0
Rex Brown 3 MS 100% Gas/Oil 17568 17,568 7 11
Rex Brown 4 MS 100% Gas/Oil 170542 170,542 68 102
Totals 0 188,110 75 113 188,298 170,821
Robert E Ritchie 1 356 AR 100% Gas/Oil 0 0 0 0
Robert E Ritchie 2 544 AR 100% Natural gas 0 0 0 0
Totals 900 0 0 0 0 0
Sabine 1 230 TX 100% Gas/Oil 329778 329,778 132 198
Sabine 2 230 TX 100% Gas/Oil 243251 243,251 97 146
Sabine 3 420 TX 100% Gas/Oil 478581 478,581 191 287
Sabine 4 530 TX 100% Gas/Oil 867480 867,480 347 520
Sabine 5 480 TX 100% Gas/Oil 605785 605,785 242 363
Totals 1890 2,524,874 1,010 1,515 2,527,399 2,292,818
Sterlington 10 224 LA 100% Gas/Oil 0 0 0 0
Sterlington 7AB 102 LA 100% Gas/Oil 2486 2,486 1 1
Sterlington 7C 101 LA 100% Gas/Oil 2303 2,303 1 1
Totals 427 4,789 2 3 4,794 4,349
Waterford 1 411 LA 100% Gas/Oil 107881 107,881 43 65
Waterford 2 411 LA 100% Gas/Oil 464868 464,868 186 279
Waterford 4 LA 100% Gas/Oil 1485 1,485 1 1
Totals 822 574,234 229 344 574,807 521,456
White Bluff 1 465 AR 57% Coal 5314862 3,029,471 606 13,936
Stationary Combustion CEM 3/29/2013
Generating facilityand EPA Acid Rain Unit ID
EPA AcidRain Unit ID(Entergy IDif different)
Maxcapacity(MW) State
Entergyequity shareof unit
Primaryfuel(s)
Total unit CO2(1)
Entergyequity shareof unit CO2emissions
Entergy shareCH4
emissionsfrom
generation(2)
Entergy shareN2O
emissionsfrom
generation(3)
Total FacilityCO2e in
short tons
Total CO2ein metric
tons
White Bluff 2 481 AR 57% Coal 5897951 3,361,832 672 15,464
Totals 946 6,391,303 1,278 29,400 6,421,982 5,825,924
Willow Glen 1 172 LA 100% Gas/Oil 80476 80,476 32 48
Willow Glen 2 224 LA 100% Gas/Oil 72014 72,014 29 43
Willow Glen 3 522 LA 100% Gas/Oil 0 0 0 0
Willow Glen 4 568 LA 100% Gas/Oil 694537 694,537 278 417
Willow Glen 5 559 LA 100% Gas/Oil 0 0 0 0
Totals 2045 847,027 339 508 847,874 769,178
Totals 52,345,964 37,438,476 11,653 88,891 37,539,020 34,054,826
(6) While Entergy owns 42% of Big Cajun 2 Unit 3, our actual consumption of the MWhs generated from this facility varies from 42% to 45%. CO2emission number shown is based on actual consumption of MWhs received from Fossil Operations.
(5) Emission data for RS Cogen is obtained directly from the EPA's Database located at http://ampd.epa.gov/ampd/
(4) Emissions from Louisiana Station Plant 1 (Units 1A, 2A, 3A, 4A, 5A) are not included in the inventory; these units exist for the sole use of Exxonunder a long term lease agreement.
(2) Emissions factor derived from CH4 (in CO2e) as percentage of emissions from CO2 for a specific fuel type. See "Emissions and ConversionFactors" for EPA emissions factors for specific fuels; emissions factor for natural gas used for all dual-fuel units as this represents the larger fuel input
(3) Emissions factor derived from N2O (in CO2e) as percentage of emissions from CO2 for a specific fuel type. See "Emissions and ConversionFactors" for EPA emissions factors for specific fuels; emissions factor for natural gas used for all dual-fuel units as this represents the larger fuel input
(1) CEM data reported to EPA Acid Rain program - can be verified at EPA's Clean Air Market's Database located athttp://camddataandmaps.epa.gov/gdm/index.cfm?fuseaction=emissions.wizard&EQW_datasetSelection=
Stationary Combustion CEM 3/29/2013
Plant Capacity(total MW ofall units)
CO2e Emissions reported underMandatory Reporting Rule(short tons of all gases in 2011)[obtained from Fossil Operations unlessotherwise noted]
CO2e Emissions reported underMandatory Reporting Rule(metric tons of all gases in 2011)[obtained from Fossil Operations unlessotherwise noted]
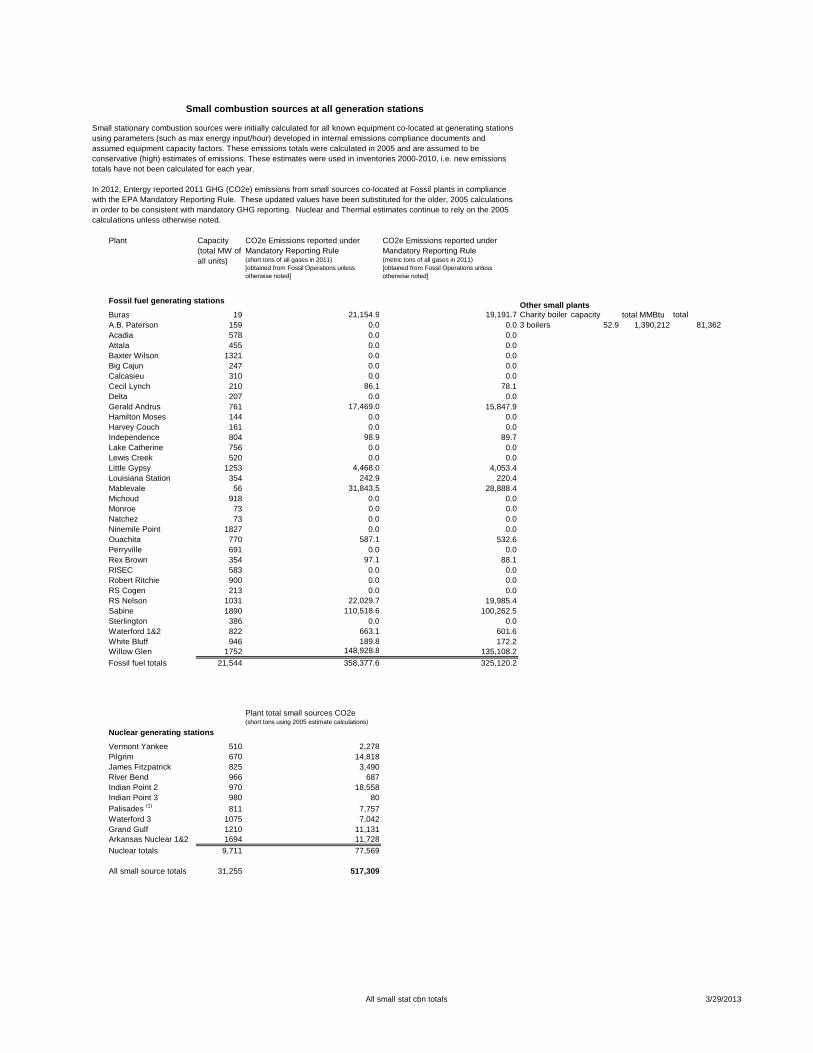
Fossil fuel generating stations Other small plantsBuras 19 21,154.9 19,191.7 Charity boiler capacity total MMBtu totalA.B. Paterson 159 0.0 0.0 3 boilers 52.9 1,390,212 81,362Acadia 578 0.0 0.0Attala 455 0.0 0.0Baxter Wilson 1321 0.0 0.0Big Cajun 247 0.0 0.0Calcasieu 310 0.0 0.0Cecil Lynch 210 86.1 78.1Delta 207 0.0 0.0Gerald Andrus 761 17,469.0 15,847.9Hamilton Moses 144 0.0 0.0Harvey Couch 161 0.0 0.0Independence 804 98.9 89.7Lake Catherine 756 0.0 0.0Lewis Creek 520 0.0 0.0Little Gypsy 1253 4,468.0 4,053.4Louisiana Station 354 242.9 220.4Mablevale 56 31,843.5 28,888.4Michoud 918 0.0 0.0Monroe 73 0.0 0.0Natchez 73 0.0 0.0Ninemile Point 1827 0.0 0.0Ouachita 770 587.1 532.6Perryville 691 0.0 0.0Rex Brown 354 97.1 88.1RISEC 583 0.0 0.0Robert Ritchie 900 0.0 0.0RS Cogen 213 0.0 0.0RS Nelson 1031 22,029.7 19,985.4Sabine 1890 110,518.6 100,262.5Sterlington 386 0.0 0.0Waterford 1&2 822 663.1 601.6White Bluff 946 189.8 172.2Willow Glen 1752 148,928.8 135,108.2Fossil fuel totals 21,544 358,377.6 325,120.2
Plant total small sources CO2e(short tons using 2005 estimate calculations)
Nuclear generating stations
Vermont Yankee 510 2,278Pilgrim 670 14,818James Fitzpatrick 825 3,490River Bend 966 687Indian Point 2 970 18,558Indian Point 3 980 80Palisades (1) 811 7,757Waterford 3 1075 7,042Grand Gulf 1210 11,131Arkansas Nuclear 1&2 1694 11,728Nuclear totals 9,711 77,569
All small source totals 31,255 517,309
Small stationary combustion sources were initially calculated for all known equipment co-located at generating stationsusing parameters (such as max energy input/hour) developed in internal emissions compliance documents andassumed equipment capacity factors. These emissions totals were calculated in 2005 and are assumed to beconservative (high) estimates of emissions. These estimates were used in inventories 2000-2010, i.e. new emissionstotals have not been calculated for each year.
In 2012, Entergy reported 2011 GHG (CO2e) emissions from small sources co-located at Fossil plants in compliancewith the EPA Mandatory Reporting Rule. These updated values have been substituted for the older, 2005 calculationsin order to be consistent with mandatory GHG reporting. Nuclear and Thermal estimates continue to rely on the 2005calculations unless otherwise noted.
Small combustion sources at all generation stations
All small stat cbn totals 3/29/2013
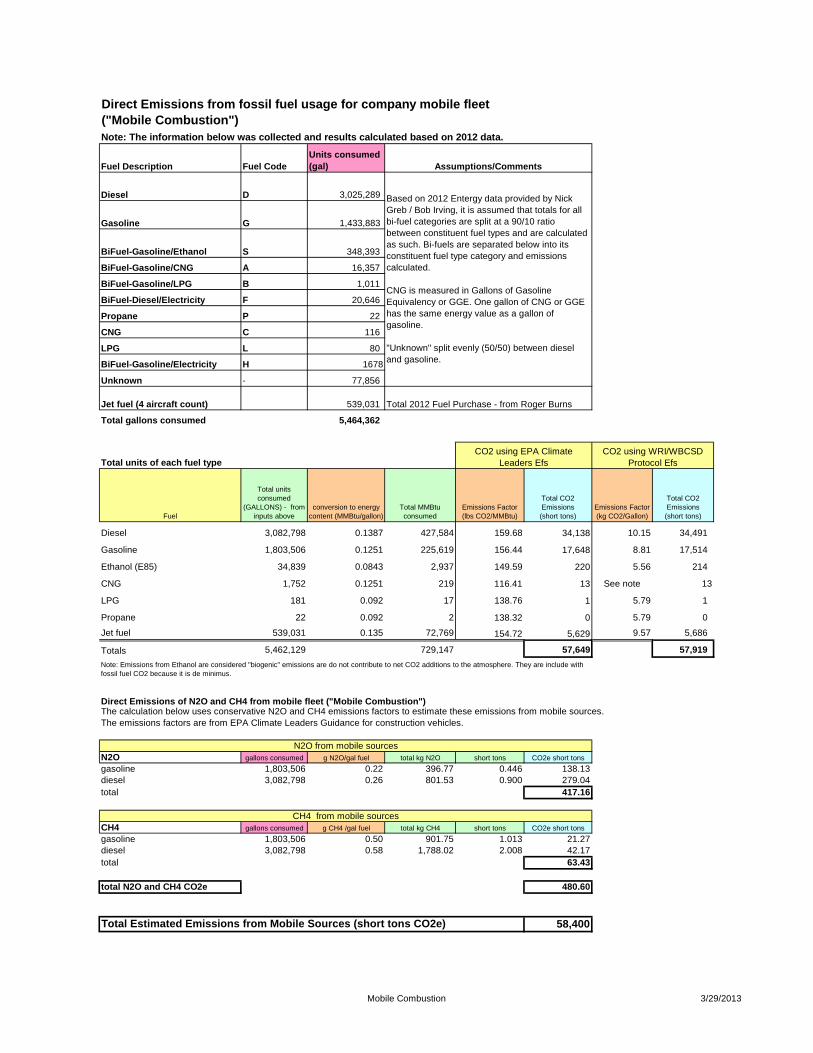
Fuel Description Fuel CodeUnits consumed(gal)
Diesel D 3,025,289
Gasoline G 1,433,883
BiFuel-Gasoline/Ethanol S 348,393
BiFuel-Gasoline/CNG A 16,357
BiFuel-Gasoline/LPG B 1,011
BiFuel-Diesel/Electricity F 20,646
Propane P 22
CNG C 116
LPG L 80
BiFuel-Gasoline/Electricity H 1678
Unknown - 77,856
Jet fuel (4 aircraft count) 539,031
Total gallons consumed 5,464,362
Total units of each fuel type
Fuel
Total unitsconsumed
(GALLONS) - frominputs above
conversion to energycontent (MMBtu/gallon)
Total MMBtuconsumed
Emissions Factor(lbs CO2/MMBtu)
Total CO2Emissions(short tons)
Emissions Factor(kg CO2/Gallon)
Total CO2Emissions(short tons)
Diesel 3,082,798 0.1387 427,584 159.68 34,138 10.15 34,491
Gasoline 1,803,506 0.1251 225,619 156.44 17,648 8.81 17,514
Ethanol (E85) 34,839 0.0843 2,937 149.59 220 5.56 214
CNG 1,752 0.1251 219 116.41 13 See note 13
LPG 181 0.092 17 138.76 1 5.79 1
Propane 22 0.092 2 138.32 0 5.79 0
Jet fuel 539,031 0.135 72,769 154.72 5,629 9.57 5,686
Totals 5,462,129 729,147 57,649 57,919
Direct Emissions of N2O and CH4 from mobile fleet ("Mobile Combustion")
N2O gallons consumed g N2O/gal fuel total kg N2O short tons CO2e short tonsgasoline 1,803,506 0.22 396.77 0.446 138.13diesel 3,082,798 0.26 801.53 0.900 279.04total 417.16
CH4 gallons consumed g CH4 /gal fuel total kg CH4 short tons CO2e short tonsgasoline 1,803,506 0.50 901.75 1.013 21.27diesel 3,082,798 0.58 1,788.02 2.008 42.17total 63.43
total N2O and CH4 CO2e 480.60
58,400
CH4 from mobile sources
Total Estimated Emissions from Mobile Sources (short tons CO2e)
Total 2012 Fuel Purchase - from Roger Burns
CO2 using EPA ClimateLeaders Efs
Note: Emissions from Ethanol are considered "biogenic" emissions are do not contribute to net CO2 additions to the atmosphere. They are include withfossil fuel CO2 because it is de minimus.
The calculation below uses conservative N2O and CH4 emissions factors to estimate these emissions from mobile sources.The emissions factors are from EPA Climate Leaders Guidance for construction vehicles.
CO2 using WRI/WBCSDProtocol Efs
Direct Emissions from fossil fuel usage for company mobile fleet("Mobile Combustion")Note: The information below was collected and results calculated based on 2012 data.
Assumptions/Comments
Based on 2012 Entergy data provided by NickGreb / Bob Irving, it is assumed that totals for allbi-fuel categories are split at a 90/10 ratiobetween constituent fuel types and are calculatedas such. Bi-fuels are separated below into itsconstituent fuel type category and emissionscalculated.
CNG is measured in Gallons of GasolineEquivalency or GGE. One gallon of CNG or GGEhas the same energy value as a gallon ofgasoline.
"Unknown" split evenly (50/50) between dieseland gasoline.
N2O from mobile sources
Mobile Combustion 3/29/2013
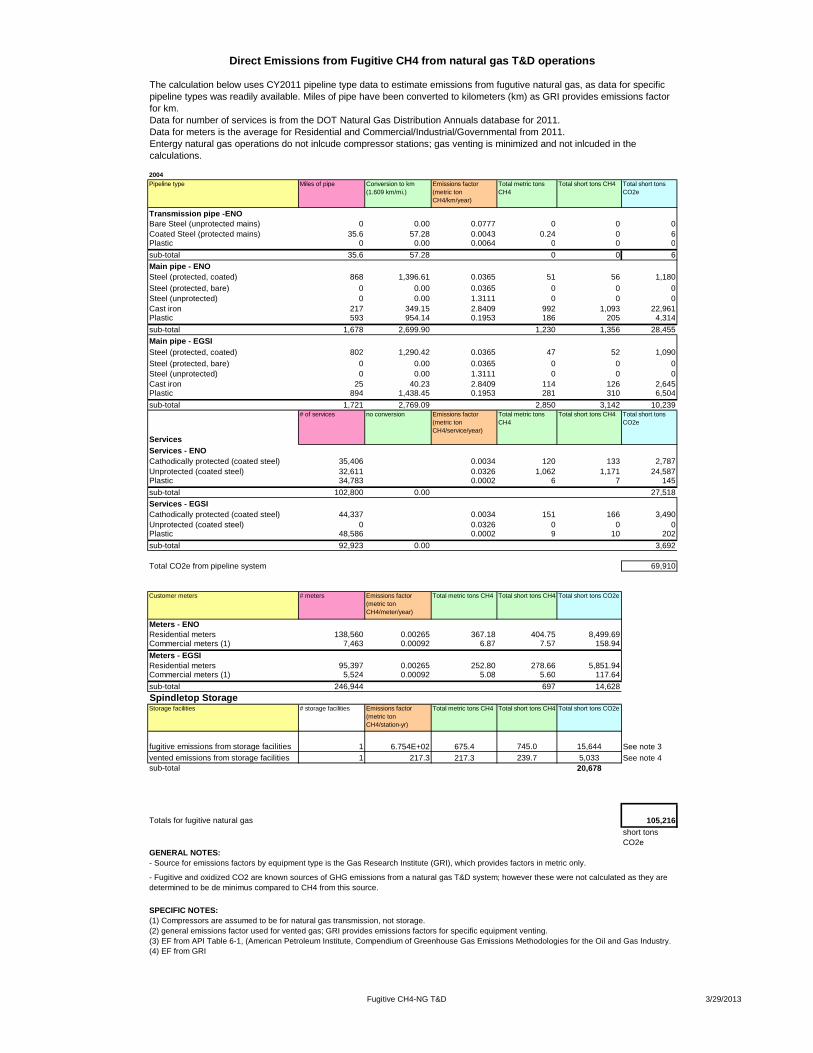
2004Pipeline type Miles of pipe Conversion to km
(1.609 km/mi.)Emissions factor(metric tonCH4/km/year)
Total metric tonsCH4
Total short tons CH4 Total short tonsCO2e
Transmission pipe -ENOBare Steel (unprotected mains) 0 0.00 0.0777 0 0 0Coated Steel (protected mains) 35.6 57.28 0.0043 0.24 0 6Plastic 0 0.00 0.0064 0 0 0sub-total 35.6 57.28 0 0 6Main pipe - ENOSteel (protected, coated) 868 1,396.61 0.0365 51 56 1,180Steel (protected, bare) 0 0.00 0.0365 0 0 0Steel (unprotected) 0 0.00 1.3111 0 0 0Cast iron 217 349.15 2.8409 992 1,093 22,961Plastic 593 954.14 0.1953 186 205 4,314sub-total 1,678 2,699.90 1,230 1,356 28,455Main pipe - EGSISteel (protected, coated) 802 1,290.42 0.0365 47 52 1,090Steel (protected, bare) 0 0.00 0.0365 0 0 0Steel (unprotected) 0 0.00 1.3111 0 0 0Cast iron 25 40.23 2.8409 114 126 2,645Plastic 894 1,438.45 0.1953 281 310 6,504sub-total 1,721 2,769.09 2,850 3,142 10,239
Services
# of services no conversion Emissions factor(metric tonCH4/service/year)
Total metric tonsCH4
Total short tons CH4 Total short tonsCO2e
Services - ENOCathodically protected (coated steel) 35,406 0.0034 120 133 2,787Unprotected (coated steel) 32,611 0.0326 1,062 1,171 24,587Plastic 34,783 0.0002 6 7 145sub-total 102,800 0.00 27,518Services - EGSICathodically protected (coated steel) 44,337 0.0034 151 166 3,490Unprotected (coated steel) 0 0.0326 0 0 0Plastic 48,586 0.0002 9 10 202sub-total 92,923 0.00 3,692
Total CO2e from pipeline system 69,910
Customer meters # meters Emissions factor(metric tonCH4/meter/year)
Total metric tons CH4 Total short tons CH4 Total short tons CO2e
Meters - ENOResidential meters 138,560 0.00265 367.18 404.75 8,499.69Commercial meters (1) 7,463 0.00092 6.87 7.57 158.94Meters - EGSIResidential meters 95,397 0.00265 252.80 278.66 5,851.94Commercial meters (1) 5,524 0.00092 5.08 5.60 117.64sub-total 246,944 697 14,628Spindletop StorageStorage facilities # storage facilities Emissions factor
(metric tonCH4/station-yr)
Total metric tons CH4 Total short tons CH4 Total short tons CO2e
fugitive emissions from storage facilities 1 6.754E+02 675.4 745.0 15,644 See note 3vented emissions from storage facilities 1 217.3 217.3 239.7 5,033 See note 4sub-total 20,678
Totals for fugitive natural gas 105,216short tonsCO2e
GENERAL NOTES:
SPECIFIC NOTES:
(4) EF from GRI
- Fugitive and oxidized CO2 are known sources of GHG emissions from a natural gas T&D system; however these were not calculated as they aredetermined to be de minimus compared to CH4 from this source.
The calculation below uses CY2011 pipeline type data to estimate emissions from fugutive natural gas, as data for specificpipeline types was readily available. Miles of pipe have been converted to kilometers (km) as GRI provides emissions factorfor km.Data for number of services is from the DOT Natural Gas Distribution Annuals database for 2011.Data for meters is the average for Residential and Commercial/Industrial/Governmental from 2011.Entergy natural gas operations do not inlcude compressor stations; gas venting is minimized and not inlcuded in thecalculations.
Direct Emissions from Fugitive CH4 from natural gas T&D operations
(3) EF from API Table 6-1, (American Petroleum Institute, Compendium of Greenhouse Gas Emissions Methodologies for the Oil and Gas Industry.
- Source for emissions factors by equipment type is the Gas Research Institute (GRI), which provides factors in metric only.
(1) Compressors are assumed to be for natural gas transmission, not storage.(2) general emissions factor used for vented gas; GRI provides emissions factors for specific equipment venting.
Fugitive CH4-NG T&D 3/29/2013
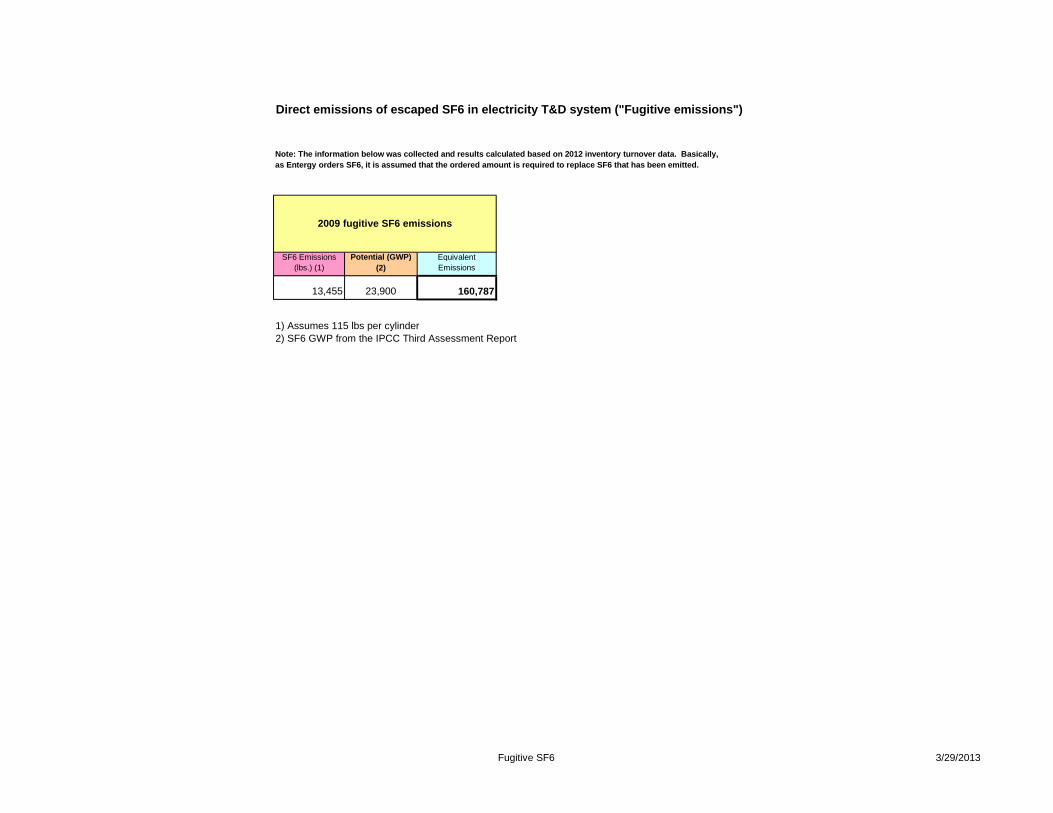
SF6 Emissions(lbs.) (1)
Potential (GWP)(2)
EquivalentEmissions
13,455 23,900 160,787
2) SF6 GWP from the IPCC Third Assessment Report
2009 fugitive SF6 emissions
Direct emissions of escaped SF6 in electricity T&D system ("Fugitive emissions")
1) Assumes 115 lbs per cylinder
Note: The information below was collected and results calculated based on 2012 inventory turnover data. Basically,as Entergy orders SF6, it is assumed that the ordered amount is required to replace SF6 that has been emitted.
Fugitive SF6 3/29/2013
2004
square footage air-conditioned
EF: fugitive HFCs(short tons CO2e/sq ft)*
Facility fugitive HFC(short tons CO2e)
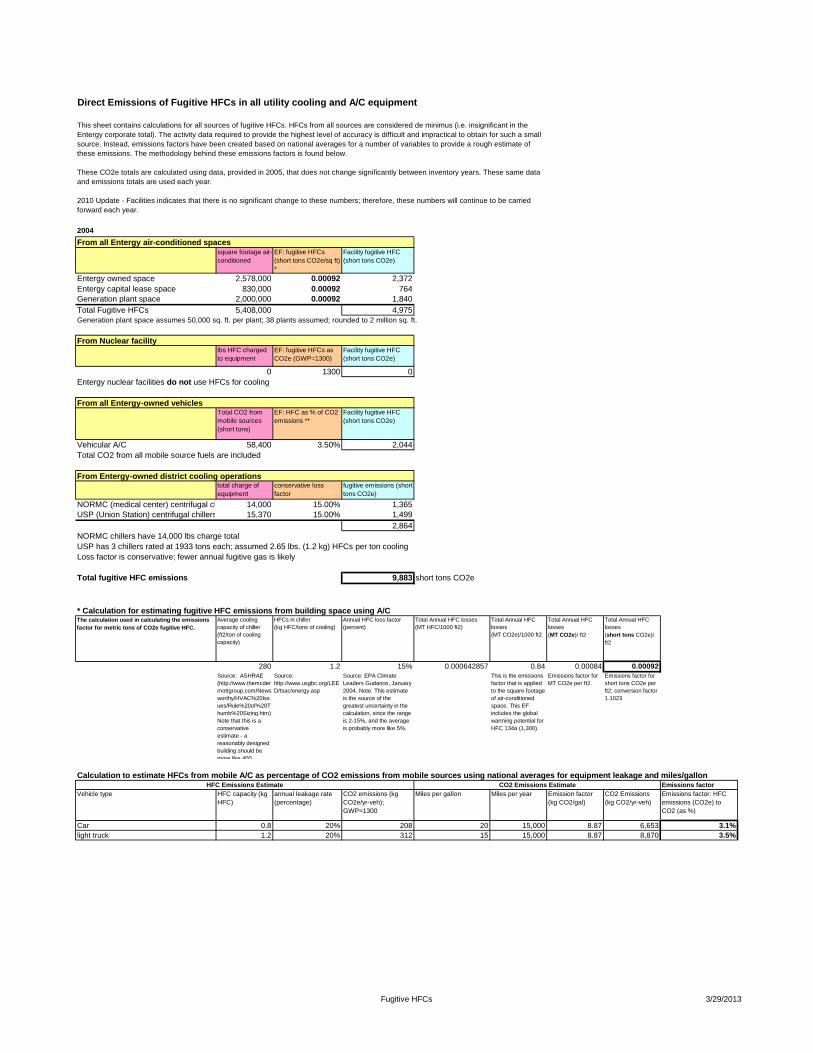
Entergy owned space 2,578,000 0.00092 2,372Entergy capital lease space 830,000 0.00092 764Generation plant space 2,000,000 0.00092 1,840Total Fugitive HFCs 5,408,000 4,975Generation plant space assumes 50,000 sq. ft. per plant; 38 plants assumed; rounded to 2 million sq. ft.
lbs HFC chargedto equipment
EF: fugitive HFCs asCO2e (GWP=1300)
Facility fugitive HFC(short tons CO2e)
0 1300 0Entergy nuclear facilities do not use HFCs for cooling
Total CO2 frommobile sources(short tons)
EF: HFC as % of CO2emissions **
Facility fugitive HFC(short tons CO2e)
Vehicular A/C 58,400 3.50% 2,044Total CO2 from all mobile source fuels are included
total charge ofequipment
conservative lossfactor
fugitive emissions (shorttons CO2e)
NORMC (medical center) centrifugal chiller 14,000 15.00% 1,365USP (Union Station) centrifugal chillers (3) 15,370 15.00% 1,499
2,864NORMC chillers have 14,000 lbs charge totalUSP has 3 chillers rated at 1933 tons each; assumed 2.65 lbs. (1.2 kg) HFCs per ton coolingLoss factor is conservative; fewer annual fugitive gas is likely
Total fugitive HFC emissions 9,883 short tons CO2e
* Calculation for estimating fugitive HFC emissions from building space using A/CThe calculation used in calculating the emissionsfactor for metric tons of CO2e fugitive HFC.
Average coolingcapacity of chiller(ft2/ton of coolingcapacity)
HFCs in chiller(kg HFC/tons of cooling)
Annual HFC loss factor(percent)
Total Annual HFC losses(MT HFC/1000 ft2)
Total Annual HFClosses(MT CO2e)/1000 ft2
Total Annual HFClosses(MT CO2e)/ ft2
Total Annual HFClosses(short tons CO2e)/ft2
280 1.2 15% 0.000642857 0.84 0.00084 0.00092Source: ASHRAE(http://www.themcdermottgroup.com/Newsworthy/HVAC%20Issues/Rule%20of%20Thumb%20Sizing.htm)Note that this is aconservativeestimate - areasonably designedbuilding should bemore like 400.
Source:http://www.usgbc.org/LEED/tsac/energy.asp
Source: EPA ClimateLeaders Gudance, January2004. Note: This estimateis the source of thegreatest uncertainty in thecalculation, since the rangeis 2-15%, and the averageis probably more like 5%.
This is the emissionsfactor that is appliedto the square footageof air-conditionedspace. This EFincludes the globalwarming potential forHFC 134a (1,300).
Emissions factor forMT CO2e per ft2.
Emissions factor forshort tons CO2e perft2; conversion factor1.1023
Calculation to estimate HFCs from mobile A/C as percentage of CO2 emissions from mobile sources using national averages for equipment leakage and miles/gallonEmissions factor
Vehicle type HFC capacity (kgHFC)
annual leakage rate(percentage)
CO2 emissions (kgCO2e/yr-veh);GWP=1300
Miles per gallon Miles per year Emission factor(kg CO2/gal)
CO2 Emissions(kg CO2/yr-veh)
Emissions factor: HFCemissions (CO2e) toCO2 (as %)
Car 0.8 20% 208 20 15,000 8.87 6,653 3.1%light truck 1.2 20% 312 15 15,000 8.87 8,870 3.5%
HFC Emissions Estimate CO2 Emissions Estimate
Direct Emissions of Fugitive HFCs in all utility cooling and A/C equipment
From all Entergy air-conditioned spaces
From Nuclear facility
From all Entergy-owned vehicles
This sheet contains calculations for all sources of fugitive HFCs. HFCs from all sources are considered de minimus (i.e. insignificant in theEntergy corporate total). The activity data required to provide the highest level of accuracy is difficult and impractical to obtain for such a smallsource. Instead, emissions factors have been created based on national averages for a number of variables to provide a rough estimate ofthese emissions. The methodology behind these emissions factors is found below.
These CO2e totals are calculated using data, provided in 2005, that does not change significantly between inventory years. These same dataand emissions totals are used each year.
2010 Update - Facilities indicates that there is no significant change to these numbers; therefore, these numbers will continue to be carriedforward each year.
From Entergy-owned district cooling operations
Fugitive HFCs 3/29/2013
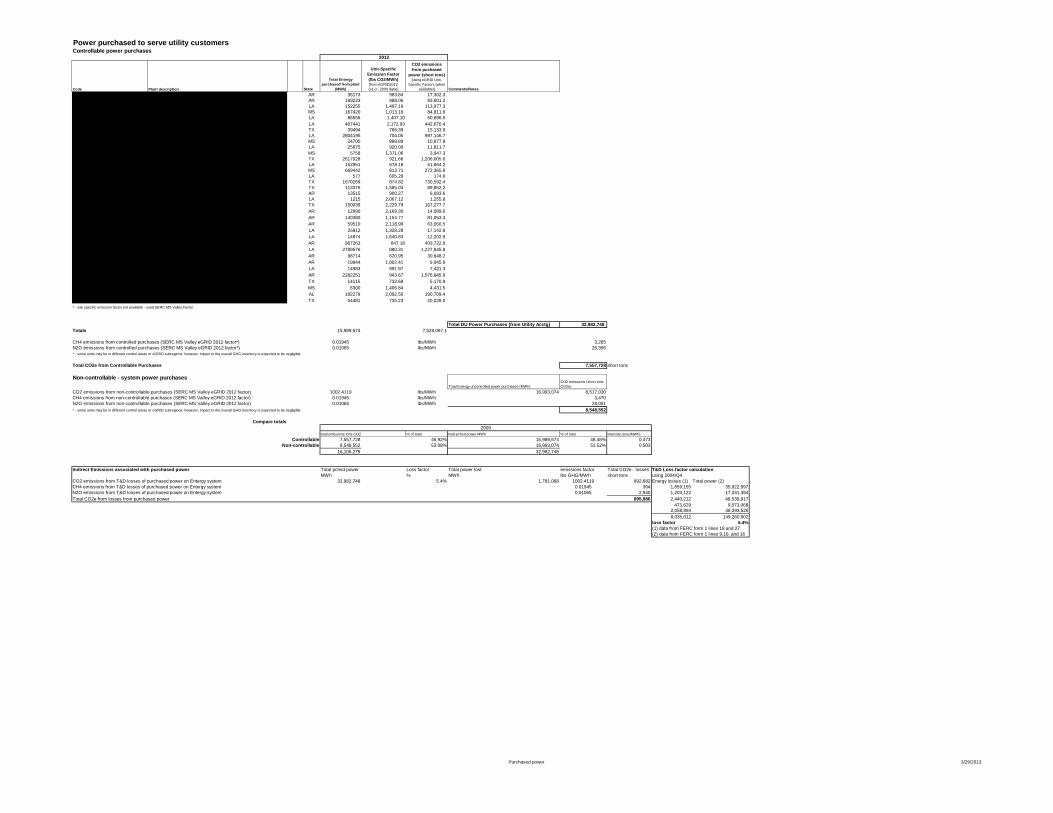
Controllable power purchases
Code Plant description State
Total Entergypurchased from plant
(MWh)
Unit-SpecificEmission Factor(lbs CO2/MWh)[from eGRID2012(v1.0 - 2009 data)]
CO2 emissionsfrom puchased
power (short tons)[using eGRID Unit-
Specific Factors (whenavailable)] Comments/Notes
AR 35173 983.84 17,302.3AR 169223 988.06 83,601.2LA 152255 1,497.19 113,977.3MS 167420 1,013.16 84,811.6LA 86556 1,407.10 60,896.5LA 407441 2,172.93 442,670.4TX 39494 766.39 15,133.9LA 2804195 704.05 987,146.7MS 24700 888.89 10,977.8LA 25675 920.09 11,811.7MS 5758 1,371.06 3,947.3TX 2617028 921.66 1,206,005.0LA 152951 678.18 51,864.2MS 669442 813.71 272,365.8LA 577 605.29 174.6TX 1670269 874.82 730,592.4TX 113376 1,585.03 89,852.2AR 13515 900.27 6,083.6LA 1215 2,067.12 1,255.8TX 150039 2,229.79 167,277.7AR 12990 2,169.30 14,089.6AR 140380 1,154.77 81,053.3AR 59510 2,118.99 63,050.5LA 25812 1,328.28 17,142.8LA 14874 1,640.83 12,202.9AR 967263 847.18 409,722.9LA 2789576 880.31 1,227,845.8AR 98714 620.95 30,648.2AR 19844 1,002.41 9,945.9LA 14983 991.97 7,431.3AR 2282251 943.67 1,076,845.9TX 14115 732.68 5,170.9MS 6300 1,406.84 4,431.5AL 182279 2,092.50 190,709.4TX 54481 735.23 20,028.0
Total DU Power Purchases (from Utility Acctg) 32,982,748Totals 15,989,674 7,528,067.1
CH4 emissions from controlled purchases (SERC MS Valley eGRID 2012 factor*) 0.01945 lbs/MWh 3,265N2O emissions from controlled purchases (SERC MS Valley eGRID 2012 factor*) 0.01065 lbs/MWh 26,395
Total CO2e from Controllable Purchases 7,557,728 short tons
Non-controllable - system power purchasesTotal Entergy uncontrolled power purchases (MWh)
CO2 emissions (short tonsCO2e)
CO2 emissions from non-controllable purchases (SERC MS Valley eGRID 2012 factor) 1002.4119 lbs/MWh 16,993,074 8,517,030CH4 emissions from non-controllable purchases (SERC MS Valley eGRID 2012 factor) 0.01945 lbs/MWh 3,470N2O emissions from non-controllable purchases (SERC MS Valley eGRID 2012 factor) 0.01065 lbs/MWh 28,051
8,548,552
Compare totals
total emissions tons CO2 % of total total pchsd power MWh % of total intensity (tons/MWh)Controllable 7,557,728 46.92% 15,989,674 48.48% 0.473
Non-controllable 8,548,552 53.08% 16,993,074 51.52% 0.50316,106,279 32,982,748
Indirect Emissions associated with purchased power Total pchsd power Loss factor Total power lost emissions factor Total CO2e - losses T&D Loss factor calculationMWh % MWh lbs GHG/MWh short tons using 2004/Q4
CO2 emissions from T&D losses of purchased power on Entergy system 32,982,748 5.4% 1,781,068 1002.4119 892,682 Energy losses (1) Total power (2)CH4 emissions from T&D losses of purchased power on Entergy system 0.01945 364 1,859,155 35,922,997N2O emissions from T&D losses of purchased power on Entergy system 0.01065 2,940 1,203,122 17,331,394Total CO2e from losses from purchased power 895,986 2,440,212 48,539,917
473,629 9,073,0682,058,894 38,393,5268,035,012 149,260,902
loss factor 5.4%(1) data from FERC form 1 lines 18 and 27(2) data from FERC form 1 lines 9,10, and 16
2009
2012
Power purchased to serve utility customers
* - site specific emission factor not available - used SERC MS Valley Factor
* - some units may be in different control areas or eGRID subregions; however, impact to the overall GHG inventory is expected to be negligible.
* - some units may be in different control areas or eGRID subregions; however, impact to the overall GHG inventory is expected to be negligible.
Purchased power 3/29/2013
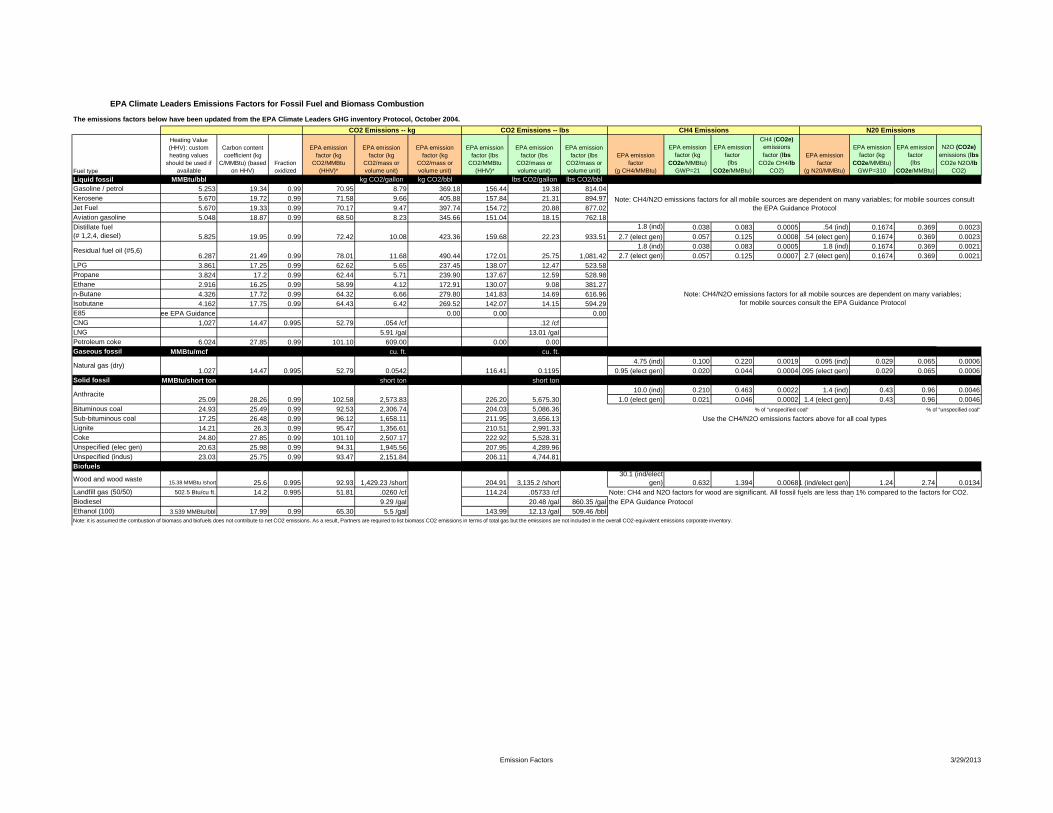
The emissions factors below have been updated from the EPA Climate Leaders GHG inventory Protocol, October 2004.
Fuel type
EPA StandardHeating Value(HHV): customheating values
should be used ifavailable
Carbon contentcoefficient (kg
C/MMBtu) (basedon HHV)
Fractionoxidized
EPA emissionfactor (kg
CO2/MMBtu(HHV)*
EPA emissionfactor (kg
CO2/mass orvolume unit)
EPA emissionfactor (kg
CO2/mass orvolume unit)
EPA emissionfactor (lbs
CO2/MMBtu(HHV)*
EPA emissionfactor (lbs
CO2/mass orvolume unit)
EPA emissionfactor (lbs
CO2/mass orvolume unit)
EPA emissionfactor
(g CH4/MMBtu)
EPA emissionfactor (kg
CO2e/MMBtu)GWP=21
EPA emissionfactor(lbs
CO2e/MMBtu)
CH4 (CO2e)emissionsfactor (lbs
CO2e CH4/lbCO2)
EPA emissionfactor
(g N20/MMBtu)
EPA emissionfactor (kg
CO2e/MMBtu)GWP=310
EPA emissionfactor(lbs
CO2e/MMBtu)
N2O (CO2e)emissions (lbsCO2e N2O/lb
CO2)Liquid fossil MMBtu/bbl kg CO2/gallon kg CO2/bbl lbs CO2/gallon lbs CO2/bblGasoline / petrol 5.253 19.34 0.99 70.95 8.79 369.18 156.44 19.38 814.04Kerosene 5.670 19.72 0.99 71.58 9.66 405.88 157.84 21.31 894.97Jet Fuel 5.670 19.33 0.99 70.17 9.47 397.74 154.72 20.88 877.02Aviation gasoline 5.048 18.87 0.99 68.50 8.23 345.66 151.04 18.15 762.18
1.8 (ind) 0.038 0.083 0.0005 .54 (ind) 0.1674 0.369 0.00232.7 (elect gen) 0.057 0.125 0.0008 .54 (elect gen) 0.1674 0.369 0.0023
1.8 (ind) 0.038 0.083 0.0005 1.8 (ind) 0.1674 0.369 0.00212.7 (elect gen) 0.057 0.125 0.0007 2.7 (elect gen) 0.1674 0.369 0.0021
LPG 3.861 17.25 0.99 62.62 5.65 237.45 138.07 12.47 523.58Propane 3.824 17.2 0.99 62.44 5.71 239.90 137.67 12.59 528.98Ethane 2.916 16.25 0.99 58.99 4.12 172.91 130.07 9.08 381.27n-Butane 4.326 17.72 0.99 64.32 6.66 279.80 141.83 14.69 616.96Isobutane 4.162 17.75 0.99 64.43 6.42 269.52 142.07 14.15 594.29E85 see EPA Guidance 0.00 0.00 0.00CNG 1,027 14.47 0.995 52.79 .054 /cf .12 /cfLNG 5.91 /gal 13.01 /galPetroleum coke 6.024 27.85 0.99 101.10 609.00 0.00 0.00Gaseous fossil MMBtu/mcf cu. ft. cu. ft.
4.75 (ind) 0.100 0.220 0.0019 0.095 (ind) 0.029 0.065 0.00060.95 (elect gen) 0.020 0.044 0.00040.095 (elect gen) 0.029 0.065 0.0006
Solid fossil MMBtu/short ton short ton short ton10.0 (ind) 0.210 0.463 0.0022 1.4 (ind) 0.43 0.96 0.0046
1.0 (elect gen) 0.021 0.046 0.0002 1.4 (elect gen) 0.43 0.96 0.0046Bituminous coal 24.93 25.49 0.99 92.53 2,306.74 204.03 5,086.36 % of "unspecified coal" % of "unspecified coal"
Sub-bituminous coal 17.25 26.48 0.99 96.12 1,658.11 211.95 3,656.13Lignite 14.21 26.3 0.99 95.47 1,356.61 210.51 2,991.33Coke 24.80 27.85 0.99 101.10 2,507.17 222.92 5,528.31Unspecified (elec gen) 20.63 25.98 0.99 94.31 1,945.56 207.95 4,289.96Unspecified (indus) 23.03 25.75 0.99 93.47 2,151.84 206.11 4,744.81Biofuels
Wood and wood waste 15.38 MMBtu /short 25.6 0.995 92.93 1,429.23 /short 204.91 3,135.2 /short30.1 (ind/elect
gen) 0.632 1.394 0.00684.01 (ind/elect gen) 1.24 2.74 0.0134Landfill gas (50/50) 502.5 Btu/cu ft. 14.2 0.995 51.81 .0260 /cf 114.24 .05733 /cfBiodiesel 9.29 /gal 20.48 /gal 860.35 /galEthanol (100) 3.539 MMBtu/bbl 17.99 0.99 65.30 5.5 /gal 143.99 12.13 /gal 509.46 /bbl
Note: CH4/N2O emissions factors for all mobile sources are dependent on many variables; for mobile sources consultthe EPA Guidance Protocol
Note: it is assumed the combustion of biomass and biofuels does not contribute to net CO2 emissions. As a result, Partners are required to list biomass CO2 emissions in terms of total gas but the emissions are not included in the overall CO2-equivalent emissions corporate inventory.
Natural gas (dry)1.027
226.20 5,675.30
Distillate fuel(# 1,2,4, diesel)
1,081.42
22.23
172.01Residual fuel oil (#5,6)
6.287 21.49
5.825
490.44
10.08 423.36
78.01
EPA Climate Leaders Emissions Factors for Fossil Fuel and Biomass Combustion
25.09 28.26 0.99 102.58Anthracite
14.47 0.995
19.95
0.99 25.75
CH4 Emissions N20 Emissions
11.68
CO2 Emissions -- lbsCO2 Emissions -- kg
0.99 72.42 159.68 933.51
52.79
Note: CH4 and N2O factors for wood are significant. All fossil fuels are less than 1% compared to the factors for CO2.Note: CH4/N2O emissions factors for all mobile sources are dependent on many variables; for mobile sources consultthe EPA Guidance Protocol
Note: CH4/N2O emissions factors for all mobile sources are dependent on many variables;for mobile sources consult the EPA Guidance Protocol
Use the CH4/N2O emissions factors above for all coal types
0.1195
2,573.83
116.410.0542
Emission Factors 3/29/2013
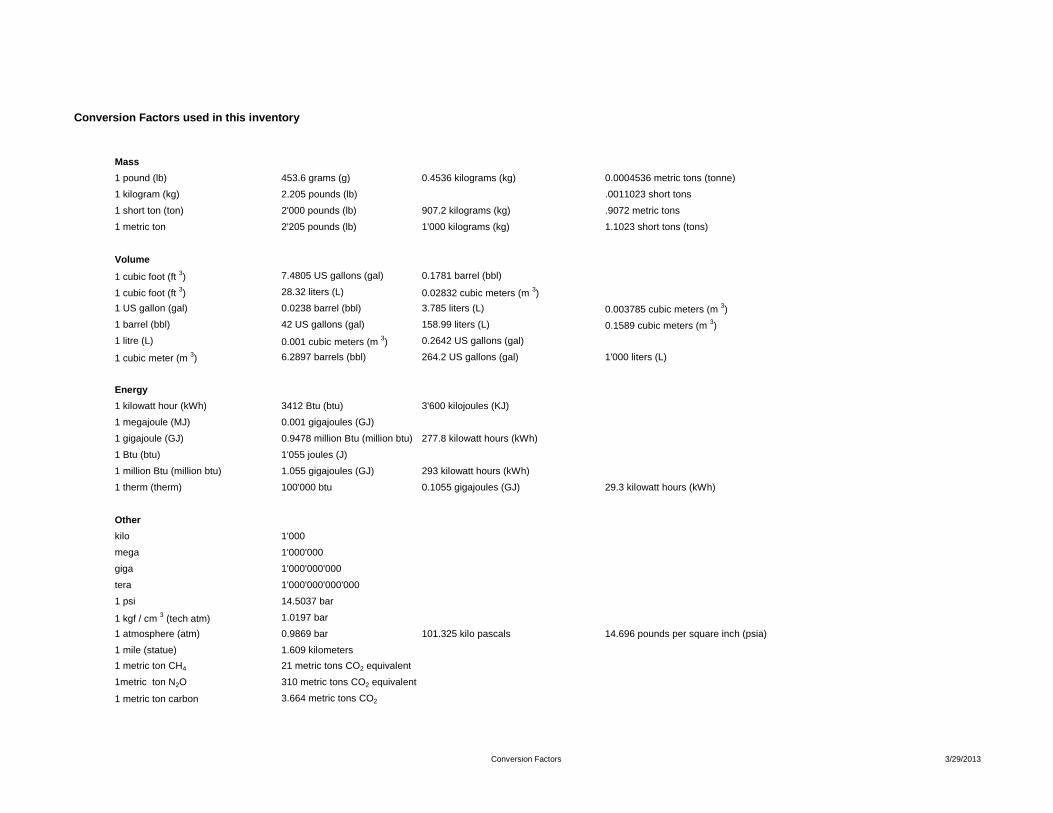
Mass1 pound (lb) 453.6 grams (g) 0.4536 kilograms (kg) 0.0004536 metric tons (tonne)
1 kilogram (kg) 2.205 pounds (lb) .0011023 short tons
1 short ton (ton) 2'000 pounds (lb) 907.2 kilograms (kg) .9072 metric tons
1 metric ton 2'205 pounds (lb) 1'000 kilograms (kg) 1.1023 short tons (tons)
Volume
1 cubic foot (ft 3) 7.4805 US gallons (gal) 0.1781 barrel (bbl)
1 cubic foot (ft 3) 28.32 liters (L) 0.02832 cubic meters (m 3)1 US gallon (gal) 0.0238 barrel (bbl) 3.785 liters (L) 0.003785 cubic meters (m 3)1 barrel (bbl) 42 US gallons (gal) 158.99 liters (L) 0.1589 cubic meters (m 3)1 litre (L) 0.001 cubic meters (m 3) 0.2642 US gallons (gal)
1 cubic meter (m 3) 6.2897 barrels (bbl) 264.2 US gallons (gal) 1'000 liters (L)
Energy1 kilowatt hour (kWh) 3412 Btu (btu) 3'600 kilojoules (KJ)
1 megajoule (MJ) 0.001 gigajoules (GJ)
1 gigajoule (GJ) 0.9478 million Btu (million btu) 277.8 kilowatt hours (kWh)
1 Btu (btu) 1'055 joules (J)
1 million Btu (million btu) 1.055 gigajoules (GJ) 293 kilowatt hours (kWh)
1 therm (therm) 100'000 btu 0.1055 gigajoules (GJ) 29.3 kilowatt hours (kWh)
Otherkilo 1'000
mega 1'000'000
giga 1'000'000'000
tera 1'000'000'000'000
1 psi 14.5037 bar
1 kgf / cm 3 (tech atm) 1.0197 bar
1 atmosphere (atm) 0.9869 bar 101.325 kilo pascals 14.696 pounds per square inch (psia)
1 mile (statue) 1.609 kilometers1 metric ton CH4 21 metric tons CO2 equivalent
1metric ton N2O 310 metric tons CO2 equivalent
1 metric ton carbon 3.664 metric tons CO2
Conversion Factors used in this inventory
Conversion Factors 3/29/2013
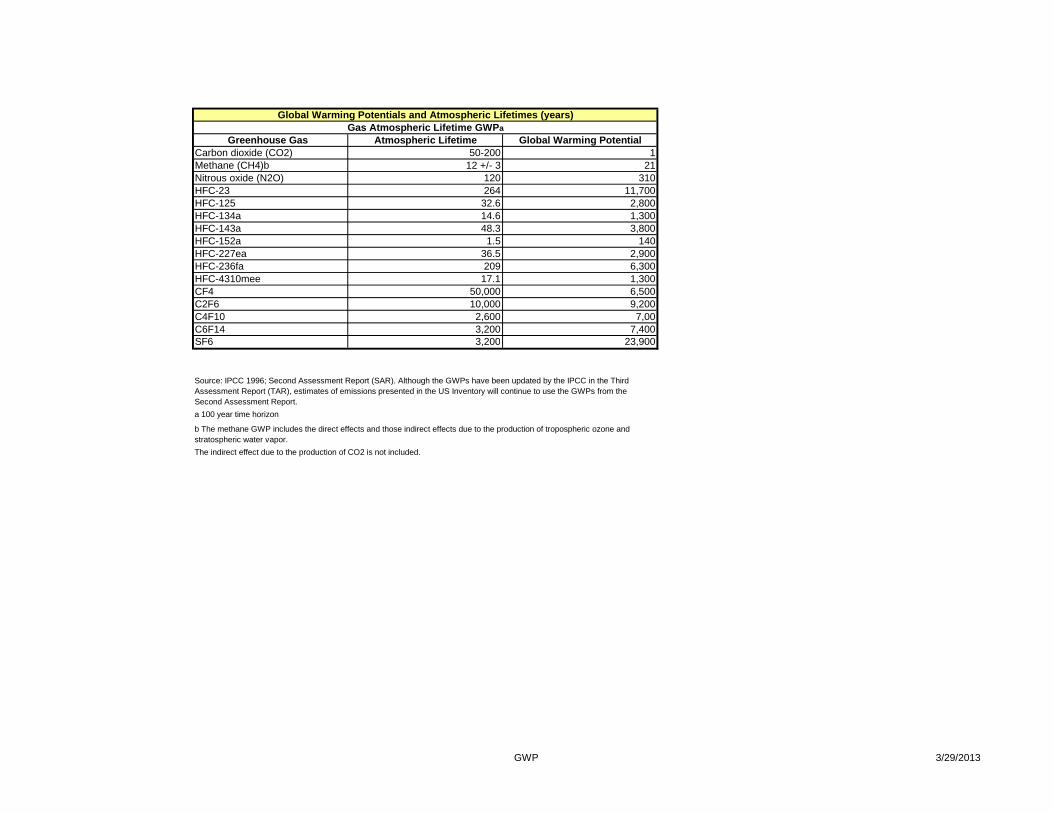
Greenhouse Gas Atmospheric Lifetime Global Warming PotentialCarbon dioxide (CO2) 50-200 1Methane (CH4)b 12 +/- 3 21Nitrous oxide (N2O) 120 310HFC-23 264 11,700HFC-125 32.6 2,800HFC-134a 14.6 1,300HFC-143a 48.3 3,800HFC-152a 1.5 140HFC-227ea 36.5 2,900HFC-236fa 209 6,300HFC-4310mee 17.1 1,300CF4 50,000 6,500C2F6 10,000 9,200C4F10 2,600 7,00C6F14 3,200 7,400SF6 3,200 23,900
a 100 year time horizon
Global Warming Potentials and Atmospheric Lifetimes (years)Gas Atmospheric Lifetime GWPa
Source: IPCC 1996; Second Assessment Report (SAR). Although the GWPs have been updated by the IPCC in the ThirdAssessment Report (TAR), estimates of emissions presented in the US Inventory will continue to use the GWPs from theSecond Assessment Report.
b The methane GWP includes the direct effects and those indirect effects due to the production of tropospheric ozone andstratospheric water vapor.The indirect effect due to the production of CO2 is not included.
GWP 3/29/2013
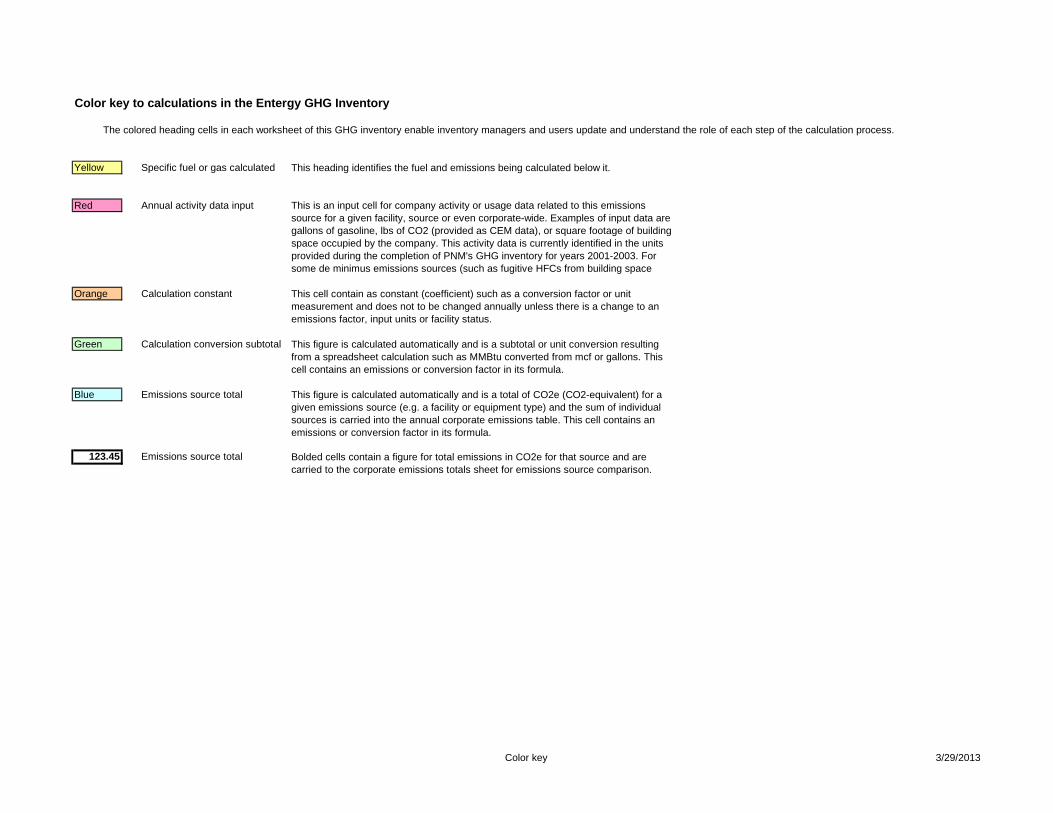
Yellow Specific fuel or gas calculated
Red Annual activity data input
Orange Calculation constant
Green Calculation conversion subtotal
Blue Emissions source total
123.45 Emissions source total
Color key to calculations in the Entergy GHG Inventory
The colored heading cells in each worksheet of this GHG inventory enable inventory managers and users update and understand the role of each step of the calculation process.
Bolded cells contain a figure for total emissions in CO2e for that source and arecarried to the corporate emissions totals sheet for emissions source comparison.
This heading identifies the fuel and emissions being calculated below it.
This is an input cell for company activity or usage data related to this emissionssource for a given facility, source or even corporate-wide. Examples of input data aregallons of gasoline, lbs of CO2 (provided as CEM data), or square footage of buildingspace occupied by the company. This activity data is currently identified in the unitsprovided during the completion of PNM's GHG inventory for years 2001-2003. Forsome de minimus emissions sources (such as fugitive HFCs from building space
This cell contain as constant (coefficient) such as a conversion factor or unitmeasurement and does not to be changed annually unless there is a change to anemissions factor, input units or facility status.
This figure is calculated automatically and is a subtotal or unit conversion resultingfrom a spreadsheet calculation such as MMBtu converted from mcf or gallons. Thiscell contains an emissions or conversion factor in its formula.
This figure is calculated automatically and is a total of CO2e (CO2-equivalent) for agiven emissions source (e.g. a facility or equipment type) and the sum of individualsources is carried into the annual corporate emissions table. This cell contains anemissions or conversion factor in its formula.
Color key 3/29/2013
Attachment 2
Entergy Corporation General Emissions Source Checklist
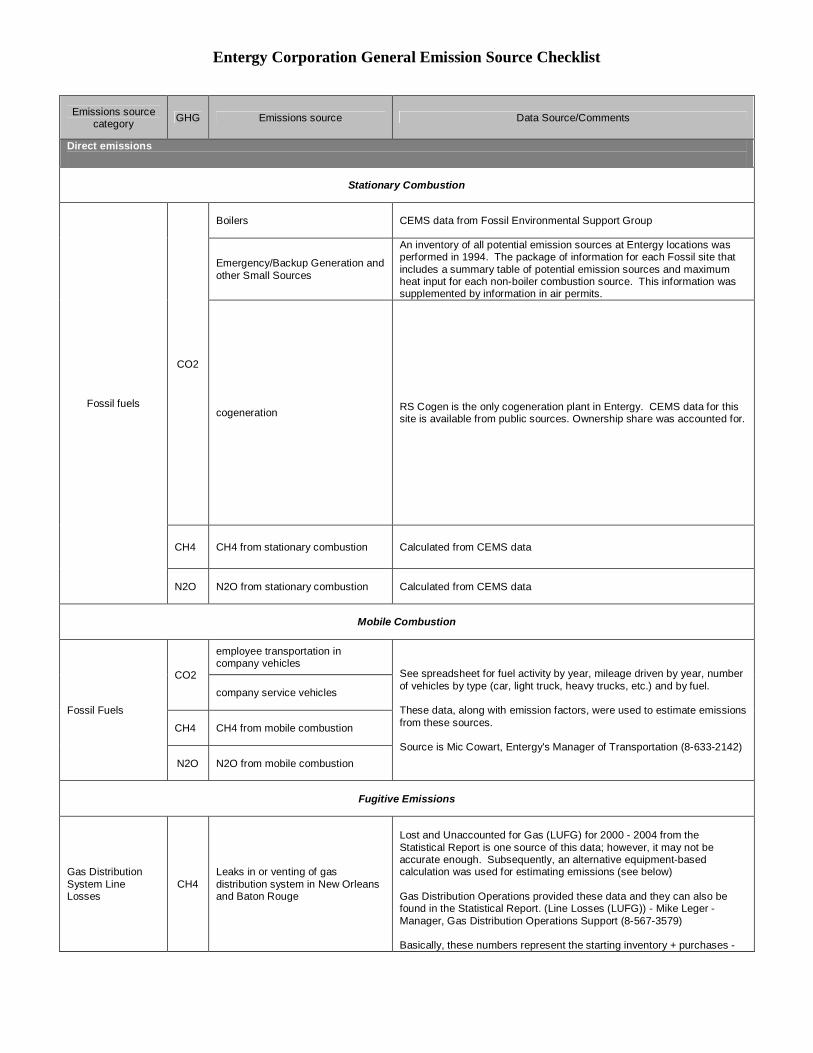
Entergy Corporation General Emission Source Checklist
Emissions sourcecategory GHG Emissions source Data Source/Comments
Direct emissions
Stationary Combustion
Fossil fuels
CO2
Boilers CEMS data from Fossil Environmental Support Group
Emergency/Backup Generation andother Small Sources
An inventory of all potential emission sources at Entergy locations wasperformed in 1994. The package of information for each Fossil site thatincludes a summary table of potential emission sources and maximumheat input for each non-boiler combustion source. This information wassupplemented by information in air permits.
cogeneration RS Cogen is the only cogeneration plant in Entergy. CEMS data for thissite is available from public sources. Ownership share was accounted for.
CH4 CH4 from stationary combustion Calculated from CEMS data
N2O N2O from stationary combustion Calculated from CEMS data
Mobile Combustion
Fossil Fuels
CO2
employee transportation incompany vehicles
See spreadsheet for fuel activity by year, mileage driven by year, numberof vehicles by type (car, light truck, heavy trucks, etc.) and by fuel.
These data, along with emission factors, were used to estimate emissionsfrom these sources.
Source is Mic Cowart, Entergy's Manager of Transportation (8-633-2142)
company service vehicles
CH4 CH4 from mobile combustion
N2O N2O from mobile combustion
Fugitive Emissions
Gas DistributionSystem LineLosses
CH4Leaks in or venting of gasdistribution system in New Orleansand Baton Rouge
Lost and Unaccounted for Gas (LUFG) for 2000 - 2004 from theStatistical Report is one source of this data; however, it may not beaccurate enough. Subsequently, an alternative equipment-basedcalculation was used for estimating emissions (see below)
Gas Distribution Operations provided these data and they can also befound in the Statistical Report. (Line Losses (LUFG)) - Mike Leger -Manager, Gas Distribution Operations Support (8-567-3579)
Basically, these numbers represent the starting inventory + purchases -
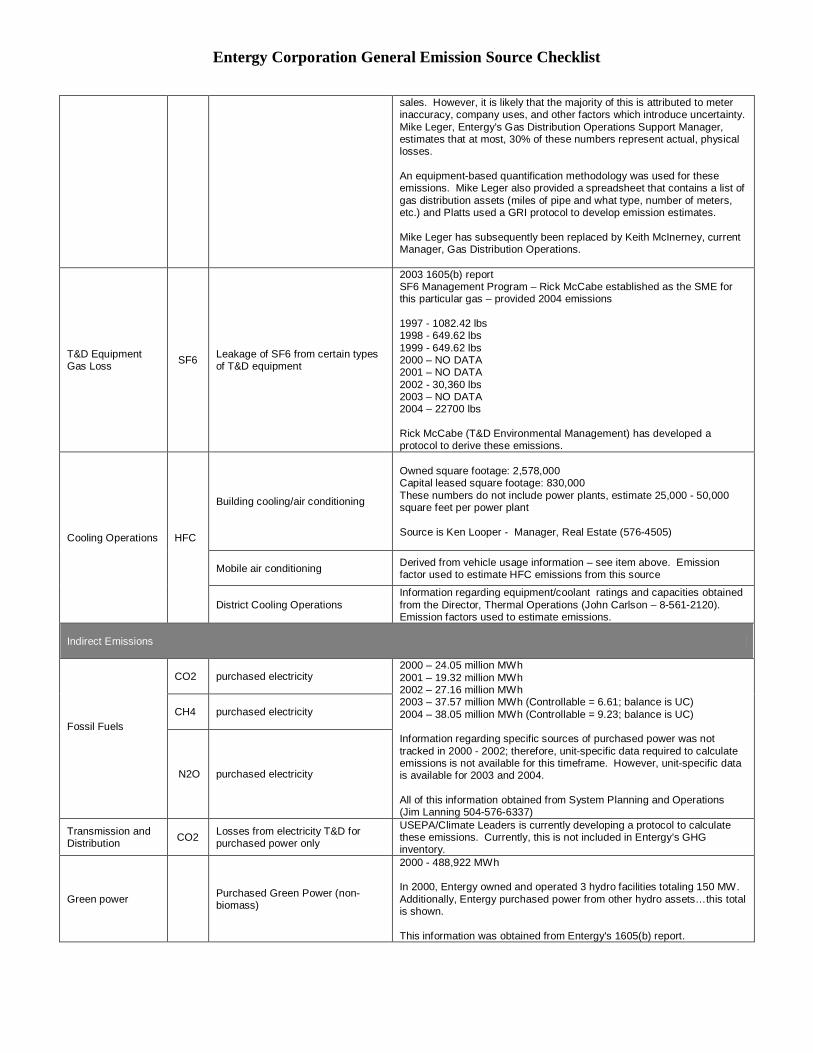
Entergy Corporation General Emission Source Checklist
sales. However, it is likely that the majority of this is attributed to meterinaccuracy, company uses, and other factors which introduce uncertainty.Mike Leger, Entergy's Gas Distribution Operations Support Manager,estimates that at most, 30% of these numbers represent actual, physicallosses.
An equipment-based quantification methodology was used for theseemissions. Mike Leger also provided a spreadsheet that contains a list ofgas distribution assets (miles of pipe and what type, number of meters,etc.) and Platts used a GRI protocol to develop emission estimates.
Mike Leger has subsequently been replaced by Keith McInerney, currentManager, Gas Distribution Operations.
T&D EquipmentGas Loss SF6 Leakage of SF6 from certain types
of T&D equipment
2003 1605(b) reportSF6 Management Program – Rick McCabe established as the SME forthis particular gas – provided 2004 emissions
1997 - 1082.42 lbs1998 - 649.62 lbs1999 - 649.62 lbs2000 – NO DATA2001 – NO DATA2002 - 30,360 lbs2003 – NO DATA2004 – 22700 lbs
Rick McCabe (T&D Environmental Management) has developed aprotocol to derive these emissions.
Cooling Operations HFC
Building cooling/air conditioning
Owned square footage: 2,578,000Capital leased square footage: 830,000These numbers do not include power plants, estimate 25,000 - 50,000square feet per power plant
Source is Ken Looper - Manager, Real Estate (576-4505)
Mobile air conditioning Derived from vehicle usage information – see item above. Emissionfactor used to estimate HFC emissions from this source
District Cooling OperationsInformation regarding equipment/coolant ratings and capacities obtainedfrom the Director, Thermal Operations (John Carlson – 8-561-2120).Emission factors used to estimate emissions.
Indirect Emissions
Fossil Fuels
CO2 purchased electricity2000 – 24.05 million MWh2001 – 19.32 million MWh2002 – 27.16 million MWh2003 – 37.57 million MWh (Controllable = 6.61; balance is UC)2004 – 38.05 million MWh (Controllable = 9.23; balance is UC)
Information regarding specific sources of purchased power was nottracked in 2000 - 2002; therefore, unit-specific data required to calculateemissions is not available for this timeframe. However, unit-specific datais available for 2003 and 2004.
All of this information obtained from System Planning and Operations(Jim Lanning 504-576-6337)
CH4 purchased electricity
N2O purchased electricity
Transmission andDistribution CO2 Losses from electricity T&D for
purchased power only
USEPA/Climate Leaders is currently developing a protocol to calculatethese emissions. Currently, this is not included in Entergy’s GHGinventory.
Green power Purchased Green Power (non-biomass)
2000 - 488,922 MWh
In 2000, Entergy owned and operated 3 hydro facilities totaling 150 MW.Additionally, Entergy purchased power from other hydro assets…this totalis shown.
This information was obtained from Entergy's 1605(b) report.
Attachment 3
2012 GHG Inventory Verification Statement and Report
Entergy Corporate Greenhouse Gas Inventory for Calendar Year 2012
Verification Report
March 8, 2013
ICF International 620 Folsom Street, 2nd Floor
San Francisco, CA 94107 (415) 677-7100

This page intentionally blank
Verification Report Entergy’s 2012 Corporate GHG Inventory
Statement of Verification
March 8th, 2013
Entergy Corporation Environmental Strategy & Policy Group Entergy Services, Inc. 639 Loyola Ave (L-ENT-13D) New Orleans, LA 70113
Scope Entergy Corporation (“Responsible Party”) engaged ICF International in cooperation with Cventure LLC (“ICF”) to review Entergy Corporation’s 2012 Corporate Greenhouse Gas (GHG) Inventory, and supporting evidence including Entergy’s Inventory Management Planning and Reporting Document (IMPRD), detailing the GHG emissions and associated source documents over the period January 1, 2012 to December 31, 2012. These components are collectively referred to as the “GHG Assertion” for the purposes of this report.
The Responsible Party is responsible for the preparation and presentation of the information within the GHG Assertion. Our responsibility is to express a conclusion as to whether anything has come to our attention to suggest that the GHG Assertion is not presented fairly in accordance with generally accepted greenhouse gas (GHG) accounting standards, in particular ISO 14064 Part 1: Specification with guidance at the organization level for quantification and reporting of greenhouse gas emissions and removals (ISO, 2006).
Methodology We completed our review in accordance with the ISO 14064 Part 3: Greenhouse Gases: Specification with guidance for the validation and verification of greenhouse gas assertions (ISO, 2006). As such, we planned and performed our work in order to provide limited, rather than absolute, assurance with respect to the GHG Assertion. Our review criteria were based on this guidance. We reviewed the GHG Assertion and associated documentation. We believe our work provides a reasonable basis for our conclusion.
Conclusion Based on our review, nothing has come to our attention which causes us to believe that the GHG Assertion is not presented fairly in accordance with the relevant criteria. The emission estimates were calculated in a consistent and transparent manner and were found to be a fair and accurate representation of Entergy Corporation’s actual emissions and were free from material misstatement. ICF identified several minor, immaterial discrepancies in Entergy’s greenhouse gas inventory which were corrected by Entergy during the course of the verification. ICF has verified a total of 49,438,750 metric tons of CO2 equivalent (CO2e) emissions for calendar year 2012.
Craig Ebert Senior Vice President 601 W. 5th St., Suite 900 Los Angeles, CA 90071, USA Email: [email protected] Tel.: (202) 276-2054
ICF International Page 1
Verification Report Entergy’s 2012 Corporate GHG Inventory
1 Verification Summary
Verifiers: Craig Ebert, Khalid Husain (ICF International); Kevin Johnson (Cventure)
Internal Peer Reviewer: Aaron Schroeder, P.Eng.
Verification Timeframe: December 2012 to March 2013
Objective of the verification: Limited level of assurance on Entergy’s Corporate 2012 GHG Inventory
Assurance being provided to: Entergy Corporation
Verification standard: ISO 14064-3:2006 (ISO, 2006)
Verification criteria employed: Inventory prepared according to the World Resources Institute and World Business Council for Sustainable Development GHG Protocol Corporate Standard.
Verification scope – Gases: Carbon Dioxide, Methane, Nitrous Oxide, Sulfur Hexafluoride, Hydrofluorocarbons
Organization: Entergy Corporation
Location: U.S.A.
Temporal period: January 1, 2012 – December 31, 2012
Main Contact Craig Ebert Senior Vice President 601 W. 5th St., Suite 900
Los Angeles, CA 90071, USA Email: [email protected]
Tel. (213) 312-1792 Main Contact Rick N. Johnson
Manager, Corporate Environmental Operations Environmental Strategy & Policy Group Entergy Services, Inc. 639 Loyola Ave (L-ENT-13D) New Orleans, LA 70113 [email protected] (504) 576-5246 (office)
ICF International Page 2
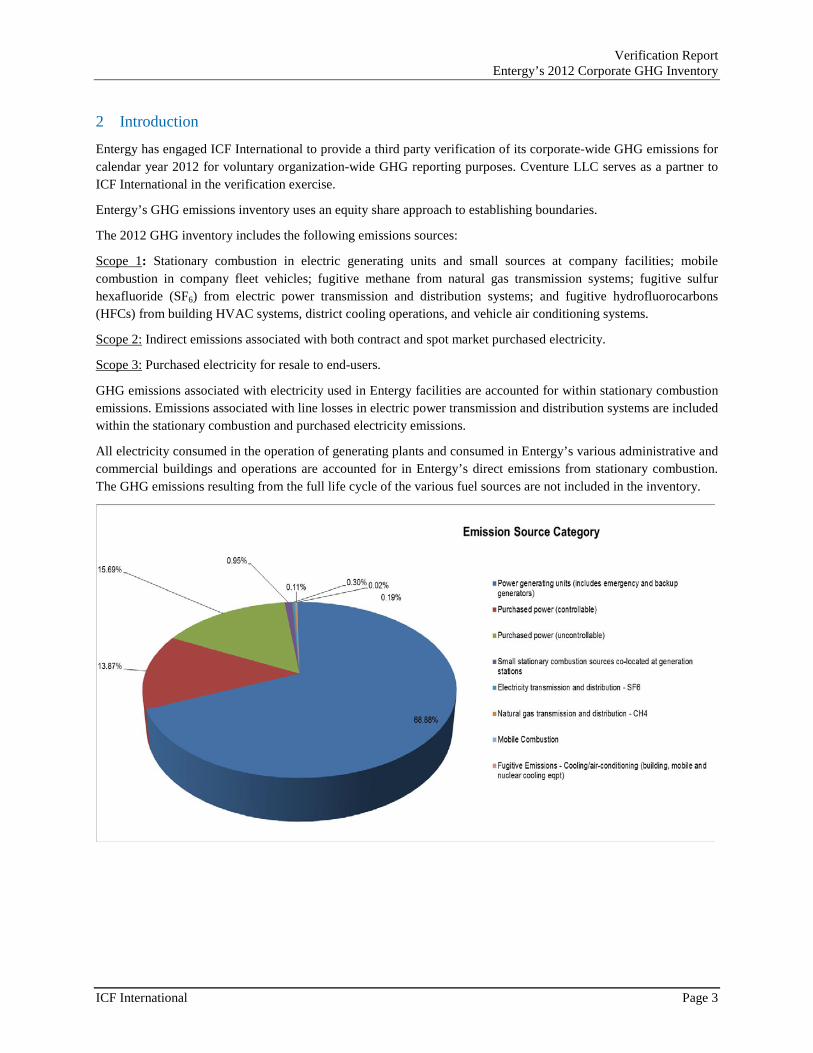
Verification Report Entergy’s 2012 Corporate GHG Inventory
2 Introduction
Entergy has engaged ICF International to provide a third party verification of its corporate-wide GHG emissions for calendar year 2012 for voluntary organization-wide GHG reporting purposes. Cventure LLC serves as a partner to ICF International in the verification exercise.
Entergy’s GHG emissions inventory uses an equity share approach to establishing boundaries.
The 2012 GHG inventory includes the following emissions sources:
Scope 1: Stationary combustion in electric generating units and small sources at company facilities; mobile combustion in company fleet vehicles; fugitive methane from natural gas transmission systems; fugitive sulfur hexafluoride (SF6) from electric power transmission and distribution systems; and fugitive hydrofluorocarbons (HFCs) from building HVAC systems, district cooling operations, and vehicle air conditioning systems.
Scope 2: Indirect emissions associated with both contract and spot market purchased electricity.
Scope 3: Purchased electricity for resale to end-users.
GHG emissions associated with electricity used in Entergy facilities are accounted for within stationary combustion emissions. Emissions associated with line losses in electric power transmission and distribution systems are included within the stationary combustion and purchased electricity emissions.
All electricity consumed in the operation of generating plants and consumed in Entergy’s various administrative and commercial buildings and operations are accounted for in Entergy’s direct emissions from stationary combustion. The GHG emissions resulting from the full life cycle of the various fuel sources are not included in the inventory.
ICF International Page 3
Verification Report Entergy’s 2012 Corporate GHG Inventory
3 Verification Execution
The scope of the verification was defined during the verification planning stage and is detailed in the Verification Plan, which is appended to this document. The Verification Plan also describes ICF’s verification process that was executed through the course of the verification. The specific verification procedures that were planned and executed are described in the appended Sampling Plan.
This is an ISO 14064-3 -based verification exercise, having been conducted to achieve a limited level of assurance. Given the status of Entergy Corporation’s GHG emissions inventory and management system, and that this was only the second verification activity under the ISO 14064 guidelines and specifications, a limited level of assurance verification was appropriate for this project.
The 2012 GHG inventory verification focused primarily on direct emissions from fossil fuel usage at large electric generating facilities using Continuous Emission Monitoring System (CEMS) data; indirect emissions from purchased power facilities; and direct emissions from small stationary combustion sources at Entergy fossil and nuclear generating stations. Entergy’s 2012 GHG Inventory includes small sources that are de minimus in nature (small stationary combustion; mobile combustion from company fleets; and fugitive emissions including CH4 from natural gas transmission and distribution, SF6 from electricity transmission and distribution, and air conditioning/cooling refrigerant HFC emissions). Entergy noted in its 2012 GHG Inventory Management Planning and Reporting Document (IMPRD) and also in its 2012 GHG Inventory that all of these small sources except HFC-related emissions were updated for the 2012 Inventory. As such, our verification efforts have included a review of these small sources except HFC emissions as this sector’s emissions was a carry-forward from previous years, and they were already reviewed in prior year verifications.
3.1 Site Visit
A site visit was conducted during the period of January 21-23, 2013 in Arkansas. The site visit consisted of two types of meetings. One set of meetings was devoted to better understanding the operations, data gathering processes and links to other data systems, management controls, and overall information systems at the System Operations Control (SOC) center in Pine Bluff, Arkansas, as well as at the Arkansas-Transmission Operations Center (TOC) in Little Rock, Arkansas. The second set of meetings included visits to pre-selected plants (White Bluff Plant and Lake Catherine Plant, both in Arkansas), as part of our sampling exercise in an effort to obtain data from plants and to better understand GHG information and data management systems. This included a review of all greenhouse gas emission sources and sinks in the facility through a review of the process flow, metering and data flow diagrams. Subsequently, a review of metering and data management processes was discussed with control room operations staff, including a review of meter calibration/validation procedures.
The site visit was an important step in planning and executing the verification. During the course of the office and selected plant tours, ICF interviewed key site operations personnel regarding power and fossil fuel generation plants operations and environmental data management at Entergy.
Key Entergy staff interviewed at Pine Bluff SOC and Little Rock TOC included:
• Cameron Warren and Frank Bowers, Pine Bluff SOC • James (Von) Puska, Little Rock TOC
Key Entergy staff interviewed in-person during the White Bluff Plant and Lake Catherine Plant included:
• Barry Snow, Senior Environmental Specialist (White Bluff Plant) • Tommy Gunn, Chemistry/Environmental Specialist (Lake Catherine Plant) • Tracy Johnson, Fossil Environmental Manager for Entergy Arkansas accompanied the verification
team to both plants. • Control Room Operators at both plants.
ICF International Page 4
Verification Report Entergy’s 2012 Corporate GHG Inventory
In addition to the site visit, ICF held conference calls with the following key personnel to gain a better understanding of Entergy’s operations and data management procedures:
• Rick Johnson, Corporate Environmental Operations • Charles John and Diane Mehra, Intra-System Billing (ISB) • Scott Celino, Generation and Fuels Accounting • Grady Kaough, Power Trading Operations • Scott McMahan, Pine Bluff System Operations Center (SOC) • Cameron Warren, Pine Bluff System Operations Center (SOC) • Ryan Trushenski, Solid Fuel Supply – System Planning and Operations (SPO) • Dave Sommers and Jeff Hogsett, Gas and Oil Supply • Tad Chenet and Minh Nguyen, Fossil Environmental Services, Emissions Monitoring and Markets • Juan Jones, Transmission Operations
3.2 Verification Approach
This ISO limited level of assurance verification effort involved the review of the logic and procedures used to compile the emission estimates, determine completeness and accuracy in calculations, and to assess the validity of the inventory design itself. It also focused on a review of the procedures in place and identified any missing or incorrectly calculated values. Emissions data were reviewed at a high level to detect internal inconsistencies, identify outliers and find potential errors in reporting, and included boundaries’ completeness checks. Data in supporting spreadsheets and from corporate Entergy databases were also examined under this verification review.
A detailed technical review of the methodologies, approaches, and calculations used in Entergy Corporation’s inventory estimates was conducted in this verification effort. This was combined with a sampling of data sources used during the compilation of the GHG emissions inventory by Entergy. Documentation was examined, including reviews of disaggregated data, and the audit trail followed below the business entity level to raw data sources for several Entergy power generation units and power purchase agreements. The section that follows outlines the approaches used to review the main sources of the 2012 GHG inventory.
Stationary Combustion: Fossil Fuel Usage at Generating Facilities
The entire inventory of Entergy fossil generation units was reviewed at a limited depth, and a significant sample of data from select units was reviewed in greater detail. Generation units were selected for detailed audit trail reviews based primarily on relative contribution to the 2012 corporate GHG emissions inventory, e.g., using the 1% de minimus accounting methodology/reporting threshold of Entergy’s GHG inventory, as unit selection screening priority. Other considerations in selecting units for detailed review included large, “sister” units at the same selected facility, availability of facility fuel usage validation data (for gas-fired facilities), and also to account for some overlap with last year’s samples (to test for any changes), as well as a selection of new samples.
The nineteen (19) generation units selected for this more detailed desktop review included the following six (6) coal and thirteen (13) gas units:
Coal
• Big Cajun 2 – 2B3
• Independence 1
• Independence 2
ICF International Page 5
Verification Report Entergy’s 2012 Corporate GHG Inventory
• RS Nelson 6
• White Bluff 1
• White Bluff 2
Gas
• Acadia CT4
• Baxter Wilson 1
• Baxter Wilson 2
• Gerald Andrus 1
• Lake Catherine 4
• Lewis Creek 1
• Lewis Creek 2
• Michoud 3
• Ninemile Point 4
• Ninemile Point 5
• Perryville Power Station 1-1
• Perryville Power Station 1-2
• RS Nelson 4
The following information was received from Entergy and reviewed in relation to the above samples:
• Annual CO2 /flue gas flow monitors relative accuracy test audits (RATAs) for the six (6) selected coal units;
• Quarterly CO2 CEM linearity checks for the six (6) selected coal units;
• Natural gas flow meter CEMS calibration/accuracy checks for all thirteen (13) gas units;
• EPA emissions collection and monitoring plan system (ECMPS) quarterly feedback reports for all nineteen (19) units;
• Annual data on CO2 emissions, electricity generation (MWh), and heat input (total Btu) for all nineteen (19) units (from EPA Clean Air Markets database);
• Monthly data on electricity generation (MWh) and heat input (total Btu) for seventeen (17) of the Entergy-operated units (from Entergy’s Performance Monitoring and Diagnostics [PM&D] data historian database; PM&D data are not available on the combustion turbines at Acadia, and Entergy does not operate Big Cajun 2);
• Monthly facility-level gas burn data for all natural gas-fired electric generation facilities (from Entergy’s Gas Database, maintained by the natural gas purchasing and accounting department);
• Hourly CO2 CEMS data for 2012 obtained directly from the plant’s CEMS DAHS for the two units at the on-site survey visit coal-fired facility (White Bluff 1 and 2); and
• Multiple days of coal burn sampling data for one (1) coal-fired unit (RS Nelson 6), and two (2) coal-fired plants (Independence and White Bluff).
ICF International Page 6
Verification Report Entergy’s 2012 Corporate GHG Inventory
The nineteen (19) units above that were reviewed in greater detail represented approximately 73% of Entergy’s total direct CO2 emissions from power generation units, and approximately 50% of Entergy’s total corporate GHG emissions, in 2012.
Organizational boundaries were verified using information contained in Entergy’s SEC 10-K report for 2012, Entergy’s 2011 Statistical Report and Investor Guide, Entergy’s 2011 Annual Report, and Entergy’s inventory list of generation assets. As described in Entergy’s GHG Inventory Management Planning and Reporting Document (IMPRD), Entergy GHG emissions inventory boundaries are determined on an equity share basis (i.e., the percent equity share of those facilities owned by Entergy which Entergy owns jointly with other companies) which was used to calculate the GHG emissions in the inventory database for this category. These equity share values in the GHG inventory were cross-checked against the data provided in the IMPRD, and Entergy’s statistical and 10-K reports.
CEMS reports supplied by Entergy were checked against both the GHG emissions data in their GHG inventory spreadsheet database, and the EPA Clean Air Markets’ air monitoring program data (AMPD) database, for the nineteen (19) above selected units. Monthly and annual CO2 CEMS reports were generated by ICF from queries of the AMPD database, and were checked and confirmed against the data for those nineteen (19) sampled units as reported in Entergy’s GHG emissions inventory spreadsheets. Annual AMPD database query report results for all Entergy fossil generation units were checked and confirmed against the Entergy GHG Inventory spreadsheets.
Associated CEM system and natural gas flow meter QA/QC supporting documentation (including relative accuracy test audits, linearity checks, and flow meter calibration tests) was reviewed for all nineteen (19) Entergy generating units sampled. These documentary evidence verification checks were performed and confirmed that the reported GHG emissions data, and CO2 emissions/flue gas flow and natural gas flow monitoring measurements and monitoring calibrations, were accurate, and the associated measurements data were reliable and reported correctly in the Entergy GHG inventory.
For each of the units sampled, various error checking tests were performed on the Entergy GHG inventory spreadsheets, and the sampled data to assess the information collected, including some examples such as record counts, missing data, re-computation, and other cross-checks. For each of the selected units, some aggregation calculation checks, and source type and equity share checks, were made and compared against database outputs/reports and the Entergy GHG inventory spreadsheets. Also, for each fuel type among the selected generating units, a sampling of daily CO2 emissions values were checked using an alternative quantification methodology, based on activity data (e.g., fuel heat input values) and emissions factors.
Through the course of the verification program, the data management systems and controls employed in the quantification of emissions were reviewed, as detailed in the Sampling Plan procedures. These systems were found to be effective in the calculation of the GHG Assertion.
Purchased Power
The key emissions factors, sources, and calculations that Entergy used for its Purchased Power (comprising Controllable Power Purchases and Non-Controllable Power Purchases) in the 2012 inventory database were checked. Together the data from these two sources correspond to approximately 30% of the total Entergy Corporate GHG emissions in 2012.
A monthly breakdown of total purchased power was obtained from Entergy’s Generation and Fuels Accounting for review purposes and cross-checked against the GHG Assertion. In addition, raw data from the TRADES database containing controllable purchased power for 2012 was received from System Planning and Operations (SPO) and was cross-checked against the Entergy GHG inventory spreadsheets. These two processes were outlined in the IMPRD as being central to the determination of the purchased power-related emissions.
ICF International Page 7
Verification Report Entergy’s 2012 Corporate GHG Inventory
This year, an additional comparison was performed between the total purchased power amount from Entergy’s Generation and Fuels Accounting and the total purchased power amount in the Intra-System Billing (ISB), as well as with data extracted from the Pine Bluff SOC. While these checks were not central to the GHG Assertion, they revealed useful information on various systems and their linkages, and served as an additional exploratory check.
Small Stationary Combustion Sources – Fossil Generating Plants
GHG emissions data for these sources (i.e., auxiliary boilers and other sources, considered ‘smaller’ than large fossil generating plants) were updated to reflect Entergy’s CO2e 2011 estimates submitted under the U.S. Environmental Protection Agency’s (EPA) Mandatory Reporting Rule. ICF reviewed the 2011 data submitted by Entergy to the EPA GHG Reporting Program in relation to the GHG Assertion.
Other Sources
Entergy has a number of small sources that individually and collectively are de minimus in nature, as noted in the IMPRD. Nonetheless, Entergy did update all of those small sources’ emissions for its 2012 GHG Inventory except air conditioning/cooling refrigerant emissions, which were a carryover from past years. Sources that were updated included small stationary fossil; mobile combustion from company fleets; CH4 from natural gas transmission and distribution; and SF6 from electricity transmission and distribution. Back-up data and explanations were provided for each of these sources and checked by ICF against the GHG assertion. Telephone calls were held with Entergy’s Environmental Manager to discuss the methods used and data employed in the updates.
ICF International Page 8
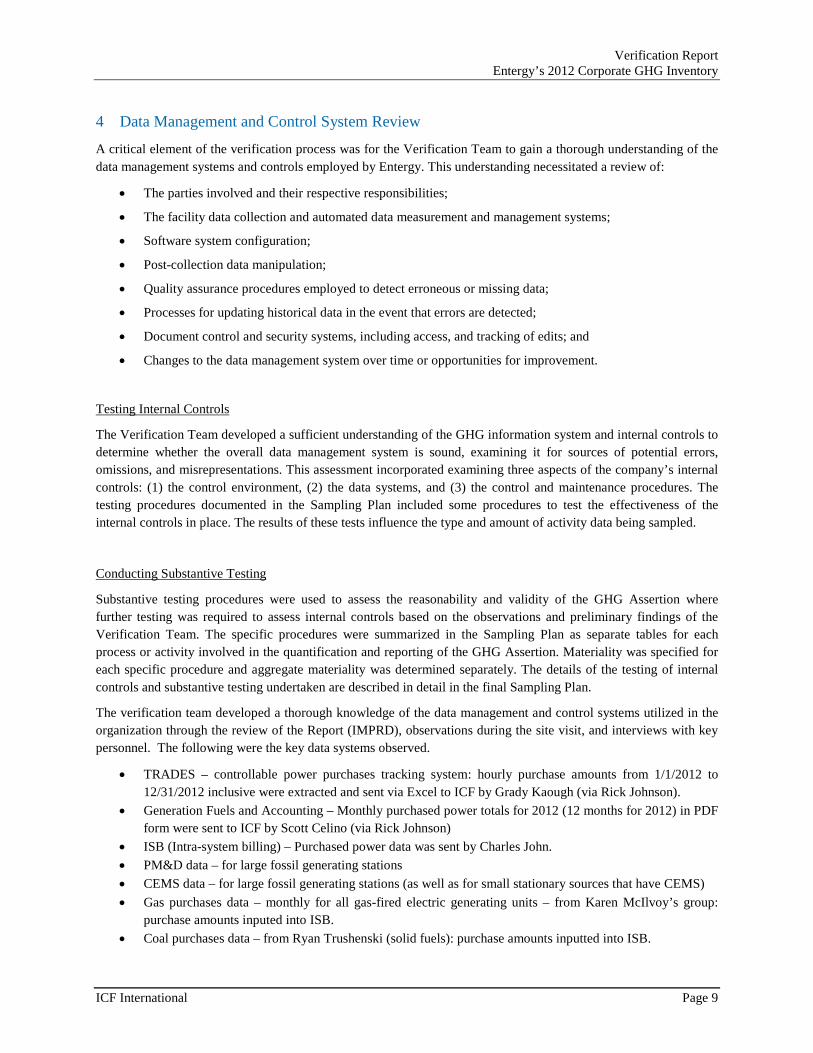
Verification Report Entergy’s 2012 Corporate GHG Inventory
4 Data Management and Control System Review
A critical element of the verification process was for the Verification Team to gain a thorough understanding of the data management systems and controls employed by Entergy. This understanding necessitated a review of:
• The parties involved and their respective responsibilities;
• The facility data collection and automated data measurement and management systems;
• Software system configuration;
• Post-collection data manipulation;
• Quality assurance procedures employed to detect erroneous or missing data;
• Processes for updating historical data in the event that errors are detected;
• Document control and security systems, including access, and tracking of edits; and
• Changes to the data management system over time or opportunities for improvement.
Testing Internal Controls
The Verification Team developed a sufficient understanding of the GHG information system and internal controls to determine whether the overall data management system is sound, examining it for sources of potential errors, omissions, and misrepresentations. This assessment incorporated examining three aspects of the company’s internal controls: (1) the control environment, (2) the data systems, and (3) the control and maintenance procedures. The testing procedures documented in the Sampling Plan included some procedures to test the effectiveness of the internal controls in place. The results of these tests influence the type and amount of activity data being sampled.
Conducting Substantive Testing
Substantive testing procedures were used to assess the reasonability and validity of the GHG Assertion where further testing was required to assess internal controls based on the observations and preliminary findings of the Verification Team. The specific procedures were summarized in the Sampling Plan as separate tables for each process or activity involved in the quantification and reporting of the GHG Assertion. Materiality was specified for each specific procedure and aggregate materiality was determined separately. The details of the testing of internal controls and substantive testing undertaken are described in detail in the final Sampling Plan.
The verification team developed a thorough knowledge of the data management and control systems utilized in the organization through the review of the Report (IMPRD), observations during the site visit, and interviews with key personnel. The following were the key data systems observed.
• TRADES – controllable power purchases tracking system: hourly purchase amounts from 1/1/2012 to 12/31/2012 inclusive were extracted and sent via Excel to ICF by Grady Kaough (via Rick Johnson).
• Generation Fuels and Accounting – Monthly purchased power totals for 2012 (12 months for 2012) in PDF form were sent to ICF by Scott Celino (via Rick Johnson)
• ISB (Intra-system billing) – Purchased power data was sent by Charles John. • PM&D data – for large fossil generating stations • CEMS data – for large fossil generating stations (as well as for small stationary sources that have CEMS) • Gas purchases data – monthly for all gas-fired electric generating units – from Karen McIlvoy’s group:
purchase amounts inputed into ISB. • Coal purchases data – from Ryan Trushenski (solid fuels): purchase amounts inputted into ISB.
ICF International Page 9
Verification Report Entergy’s 2012 Corporate GHG Inventory
The following non-critical data was requested and obtained for exploratory checks and knowledge enhancement for both GHG data comparison purposes as well as for information systems:
• TRADES – a subset of non-controllable power purchases data from 1/1/2012 to 12/31/2012 inclusive was extracted and sent via Excel to ICF by Grady Kaough (via Rick Johnson).
• SOC – a subset of power purchases data from 1/1/2012 to 12/31/2012 inclusive was extracted and sent via Excel to ICF by Cameron Warren (via Rick Johnson).
ICF International Page 10
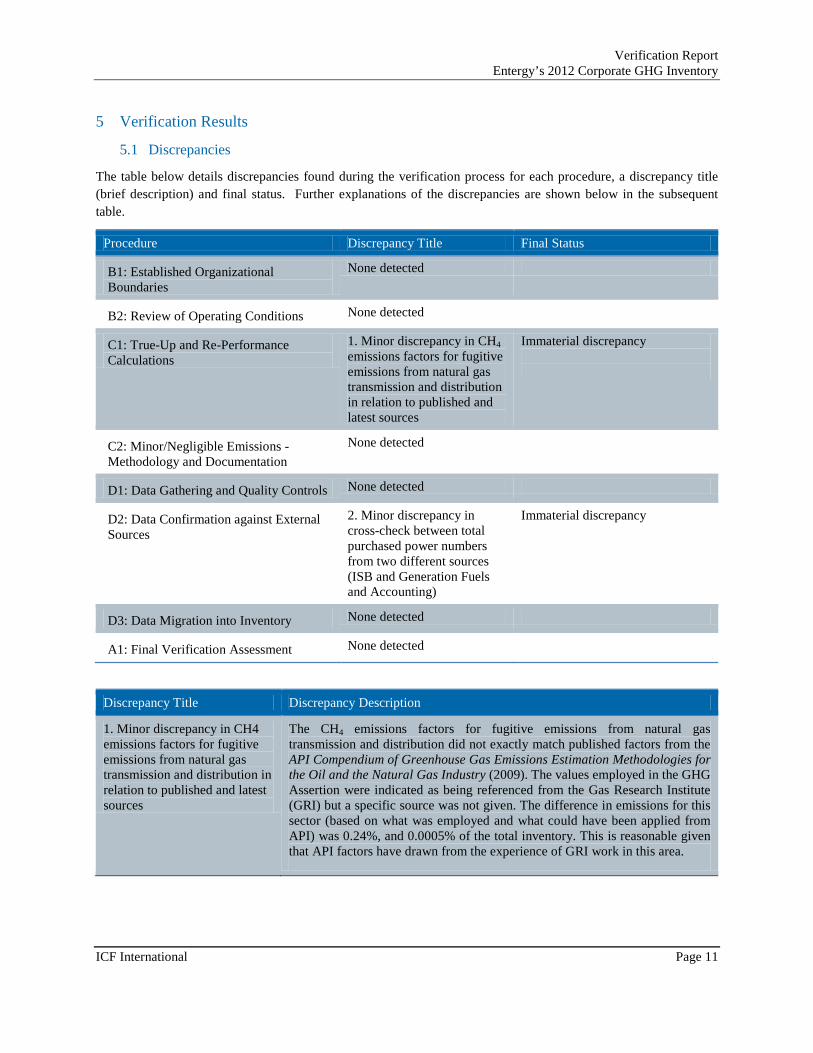
Verification Report Entergy’s 2012 Corporate GHG Inventory
5 Verification Results
5.1 Discrepancies
The table below details discrepancies found during the verification process for each procedure, a discrepancy title (brief description) and final status. Further explanations of the discrepancies are shown below in the subsequent table.
Procedure Discrepancy Title Final Status
B1: Established Organizational Boundaries
None detected
B2: Review of Operating Conditions None detected
C1: True-Up and Re-Performance Calculations
1. Minor discrepancy in CH4 emissions factors for fugitive emissions from natural gas transmission and distribution in relation to published and latest sources
Immaterial discrepancy
C2: Minor/Negligible Emissions - Methodology and Documentation
None detected
D1: Data Gathering and Quality Controls None detected
D2: Data Confirmation against External Sources
2. Minor discrepancy in cross-check between total purchased power numbers from two different sources (ISB and Generation Fuels and Accounting)
Immaterial discrepancy
D3: Data Migration into Inventory None detected
A1: Final Verification Assessment None detected
Discrepancy Title Discrepancy Description
1. Minor discrepancy in CH4 emissions factors for fugitive emissions from natural gas transmission and distribution in relation to published and latest sources
The CH4 emissions factors for fugitive emissions from natural gas transmission and distribution did not exactly match published factors from the API Compendium of Greenhouse Gas Emissions Estimation Methodologies for the Oil and the Natural Gas Industry (2009). The values employed in the GHG Assertion were indicated as being referenced from the Gas Research Institute (GRI) but a specific source was not given. The difference in emissions for this sector (based on what was employed and what could have been applied from API) was 0.24%, and 0.0005% of the total inventory. This is reasonable given that API factors have drawn from the experience of GRI work in this area.
ICF International Page 11
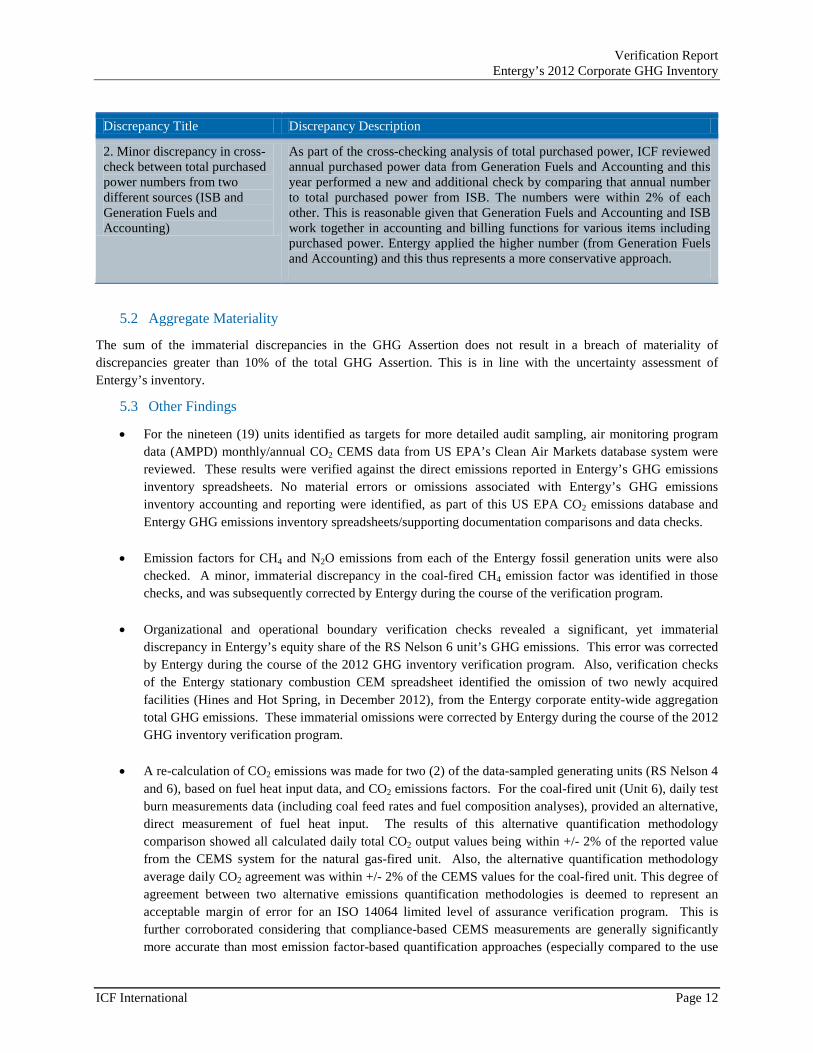
Verification Report Entergy’s 2012 Corporate GHG Inventory
Discrepancy Title Discrepancy Description
2. Minor discrepancy in cross-check between total purchased power numbers from two different sources (ISB and Generation Fuels and Accounting)
As part of the cross-checking analysis of total purchased power, ICF reviewed annual purchased power data from Generation Fuels and Accounting and this year performed a new and additional check by comparing that annual number to total purchased power from ISB. The numbers were within 2% of each other. This is reasonable given that Generation Fuels and Accounting and ISB work together in accounting and billing functions for various items including purchased power. Entergy applied the higher number (from Generation Fuels and Accounting) and this thus represents a more conservative approach.
5.2 Aggregate Materiality
The sum of the immaterial discrepancies in the GHG Assertion does not result in a breach of materiality of discrepancies greater than 10% of the total GHG Assertion. This is in line with the uncertainty assessment of Entergy’s inventory.
5.3 Other Findings
• For the nineteen (19) units identified as targets for more detailed audit sampling, air monitoring program data (AMPD) monthly/annual CO2 CEMS data from US EPA’s Clean Air Markets database system were reviewed. These results were verified against the direct emissions reported in Entergy’s GHG emissions inventory spreadsheets. No material errors or omissions associated with Entergy’s GHG emissions inventory accounting and reporting were identified, as part of this US EPA CO2 emissions database and Entergy GHG emissions inventory spreadsheets/supporting documentation comparisons and data checks.
• Emission factors for CH4 and N2O emissions from each of the Entergy fossil generation units were also checked. A minor, immaterial discrepancy in the coal-fired CH4 emission factor was identified in those checks, and was subsequently corrected by Entergy during the course of the verification program.
• Organizational and operational boundary verification checks revealed a significant, yet immaterial discrepancy in Entergy’s equity share of the RS Nelson 6 unit’s GHG emissions. This error was corrected by Entergy during the course of the 2012 GHG inventory verification program. Also, verification checks of the Entergy stationary combustion CEM spreadsheet identified the omission of two newly acquired facilities (Hines and Hot Spring, in December 2012), from the Entergy corporate entity-wide aggregation total GHG emissions. These immaterial omissions were corrected by Entergy during the course of the 2012 GHG inventory verification program.
• A re-calculation of CO2 emissions was made for two (2) of the data-sampled generating units (RS Nelson 4 and 6), based on fuel heat input data, and CO2 emissions factors. For the coal-fired unit (Unit 6), daily test burn measurements data (including coal feed rates and fuel composition analyses), provided an alternative, direct measurement of fuel heat input. The results of this alternative quantification methodology comparison showed all calculated daily total CO2 output values being within +/- 2% of the reported value from the CEMS system for the natural gas-fired unit. Also, the alternative quantification methodology average daily CO2 agreement was within +/- 2% of the CEMS values for the coal-fired unit. This degree of agreement between two alternative emissions quantification methodologies is deemed to represent an acceptable margin of error for an ISO 14064 limited level of assurance verification program. This is further corroborated considering that compliance-based CEMS measurements are generally significantly more accurate than most emission factor-based quantification approaches (especially compared to the use
ICF International Page 12
Verification Report Entergy’s 2012 Corporate GHG Inventory
of default emission factors, as opposed to site-specific factors). Therefore, the alternative quantification methodology comparison results provide additional verification confirmation of the CEM systems measurement approach and results.
• For the nine (9) natural gas-fired facilities with generation units audit-sampled under this verification program, monthly and annual gas fuel use/total heat input data from the Entergy Gas Database (which tracks gas utility purchases and pipeline deliveries to Entergy generating stations) were compared to the EPA AMPD database results. (Note: Total heat input comparisons for natural gas-fired generation units were deemed appropriate here as the CEMS emissions reported are based on natural gas fuel flow rate measurements.) The results of these cross-check comparisons showed the facility-wide deviations between the two datasets had an overall average of +0.2% difference for the nine (9) facilities, with only one (1) of those facilities exhibiting a deviation greater than +/- 5% (-6.1%). Given the distinct differences between the metering characteristics (e.g., Entergy’s electric generation unit-specific natural gas fuel flow meters, and the respective natural gas pipeline company’s utility gas sales meter), as well as the Entergy natural gas fuel flow meters’ measurements aggregated across a total of 2-5 units (except for Gerald Andrus 1), this level of agreement provides an additional degree of confidence in the reliability of reported results for Entergy’s gas-fired generation, and reduction in the associated residual risk of misstatement.
• For the five (5) Entergy-operated coal-fired units, and twelve (12) of the natural gas-fired units selected for audit data sampling, comparisons on unit-specific fuel heat input from the EPA AMPD database were made by cross-checking MMBtu values from Entergy’s Plant Performance Monitoring & Diagnostics (PM&D) department. This Entergy database contains unit operational data recorded by each unit’s Pi historian (i.e., the data monitoring component of Entergy’s supervisory control and data acquisition [SCADA] system). Unit-specific data were supplied on a monthly basis, for fuel flow, heat input (MMBtu), and power generation (MW-hr), for seventeen (17) of the nineteen (19) audit-sampled units. The results of these cross-checking comparisons showed individual unit deviations between the two datasets having an average deviation of -3.1% for the five (5) coal-fired units, with only two (2) coal units’ deviations being greater than +/-5% (e.g., -6.7% and -7.5%, respectively). For the twelve (12) gas units with PM&D data, the individual unit deviations between the two data sets showed an average deviation of +0.1%, with only two (2) units having deviations greater than +/-5% (+8.5% and -11.9%, respectively). As in the case of the Gas Database comparison above, the results of this cross-check add further credibility to Entergy’s coal- and gas-fired generation GHG emissions inventory reporting.
• ICF’s review of controllable purchased power emissions led to identification of incorrect emissions factors in a few cases as well as two omitted and one mismatched amounts of power from controllable sources. These were subsequently corrected by Entergy during the course of the verification.
• ICF undertook a series of checks on non-controllable power purchases by requesting such data from ISB,
TRADES and SOC. While our understanding of how such data can be extracted, the limitations in doing so, and the linkages between these systems increased, this effort underlined that further investigation (i.e., next year or thereafter) is warranted. In the meantime, the current method for obtaining non-controllable purchased data in view of limitations around the above data sets appears to be reasonable.
• Emissions factors for CH4 and N2O were initially inconsistent in some cases with latest published sources
for mobile combustion. This was an immaterial finding but was corrected during the course of verification by Entergy.
ICF International Page 13
Verification Report Entergy’s 2012 Corporate GHG Inventory
• Total CO2 emissions for small stationary combustion were initially slightly inconsistent in relation to 2011 GHG reports to EPA in a few cases. This was an immaterial finding but was corrected during the course of verification by Entergy.
• Through the course of the verification, the data management systems and controls employed in the
quantification of emissions were reviewed, as detailed in the Sampling Plan procedures. These systems were found to be effective in the calculation of the GHG Assertion.
ICF International Page 14
Verification Report Entergy’s 2012 Corporate GHG Inventory
6 Verification Team
Since 1969, ICF International has been serving major corporations, all levels of government, and multilateral institutions. Globally, approximately 400 of our approximately 4,500 employees are dedicated climate change specialists, with experience advising public and private-sector clients. ICF International has earned an international reputation in the field of climate change consulting for its analytical rigor, in-depth expertise, and technical integrity through scores of GHG emissions-related assignments over the past two decades.
ICF International has carried out numerous facility-level GHG verifications and verifications of emission reduction projects. ICF has developed the necessary internal controls to ensure qualified and competent staffing uphold the principles of the relevant standard while quality control processes are utilized to assure data integrity is maintained and safeguarded. ICF’s clients choose ICF for its strong brand, technical expertise, and rigorous methodological approach.
For this verification, ICF assembled a Verification Team consisting of experienced greenhouse gas verifiers and relevant technical experts.
Verifiers Craig Ebert is a Managing Director in ICF’s Los Angeles Office, and supports commercial and public clients internationally on strategic management of the risks and opportunities posed by climate change and attendant impacts on shareholder value. He has worked for a wide variety of public and private clients, including most recently Yahoo!, News Corporation, eBay, Time Warner, Exelon, Duke, Fidelity, TransCanada, El Paso, World Bank, Lafarge, Repsol, Aracruz, and Petrobras. He has directed ICF’s support to the US EPA as its primary climate change contractor, including support to about 50 countries under the US Country Studies Program, compilation of the official US greenhouse gas inventory to meet international commitments under the United Nations Framework Convention on Climate Change, and analysis of the cost and availability of options to reduce US emissions in support of international climate negotiations. His support includes assessing the cost and availability of various offset classes for different public and private sector clients and helping clients unlock the financial value of potential emission reduction projects in both voluntary and compliance markets.
Khalid Husain is a Manager for climate change mitigation and sustainability issues in ICF’s Environmental and Social Sustainability Division within ICF’s Energy, Environment and Transportation (EET) Practice. A LEED-EB accredited professional, he has approximately 12 years of experience in climate change, energy and environmental issues in both public and private sector capacities. His current work involves a range of technical assistance on greenhouse gas management issues. Mr. Husain brings strong knowledge and experience in GHG inventory development and verification, as well as in corporate sustainability at large through work with diverse clients. He has carried out, or is in the process of conducting, verification of GHG inventories against the Alberta’s Specified Gas Emitters Regulation, California Climate Change Registry (CCAR), EPA Climate Leaders Protocol and the Carbon Disclosure Project. He has also worked of EPA Task Orders and is knowledgeable of international GHG protocols for the EU ETS, CDM and JI. His experience also includes advisory and analytical services on carbon offsets, on both the buy and sell sides, for both voluntary and CDM projects. Services include undertaking feasibility studies, conducting risk assessments and due diligence, drafting and revising project design documents (PDDs), and reviewing methodologies for offsets. Mr. Husain holds a Masters degree in International Affairs, joint focus in Economic & Political Development & Environmental Studies from Columbia University and a B.Sc. (Honors) in Earth and Planetary Sciences from McGill University.
ICF International Page 15

Verification Report Entergy’s 2012 Corporate GHG Inventory
Kevin Johnson (Cventure LLC) has over 25 years energy and environmental consulting experience, focusing over the last decade on climate change, greenhouse gas (GHG) and CO2 emissions inventories, sustainability programs, and verification. In 2005, he founded Carbon Solutions, Inc., an independent consulting services firm, and in 2007 co-founded Cventure LLC. Mr. Johnson was a primary author of the “Corporate GHG Verification Guideline”, a CDP-approved verification standard, prepared for the US EPA Climate Leaders program. He also drafted the verification guidelines for the American Carbon Registry (ACR); and conducted dozens of verification projects, for various US companies’ GHG inventories, and carbon offset projects. Mr. Johnson has also led the development of a carbon offset project evaluation and quality rating software tool. Prior to forming Carbon Solutions, Inc., he previously served as the leader of URS Corporation’s corporate GHG/climate change practice. Some of his other project management experience includes sustainability report reviews and verification, corporate strategy development, carbon offset project/technology due diligence assessments and feasibility studies, GHG emission inventories/protocols, environmental management information system (EMIS) implementations, ERC verification and trading support, benchmarking, and life cycle analysis. Some climate change clients include Exelon, Eni, El Paso, Bloomberg LP, NewsCorp, Broadridge Financial Solutions, Compuware, Wal-Mart, Marathon, Unocal, Conoco, BlueSource, EDF, U.S. DOE, GRI, U.S. EPA, and several independent oil producers.
Internal Peer Reviewer Aaron Schroeder is a Professional Engineer in the Province of Alberta and holds a BSc. in Engineering from the University of Saskatchewan. He has completed supplementary training in ISO 14064 as well as Auditing and Assurance Engagements through the University of Toronto, School of Continuing Studies. Aaron has acted as lead verifier on third-party assurance assignments for multiple compliance periods under Alberta’s Specified Gas Emitters Regulation. These projects included work at SAGD facilities in Alberta’s oil sands, a complex sour gas processing facility, two of Alberta’s largest natural gas pipelines and combined-cycle electric generating facilities. Additionally, Aaron has completed numerous verifications as lead verifier for emission reduction (offset) projects in agricultural tillage management, wind electricity generation, and acid gas injection projects.
ICF International Page 16

Verification Report Entergy’s 2012 Corporate GHG Inventory
Conflict of Interest
ICF has conducted a review of any real or perceived conflicts of interest resulting from advocacy, intimidation, self-review, self-interest or familiarity. No threats to independence, either real or perceived, have been identified.
Statement of Qualifications
The information contained within this document and this statement of qualifications is complete and correctly represents the qualifications of ICF and the members of the Verification Team described herein. Dated this eighth day of March, 2013.
Craig Ebert Senior Vice President 601 W. 5th St., Suite 900 Los Angeles, CA 90071, USA Email: [email protected] Tel.: (202) 276-2054
ICF International Page 17

Verification Report Entergy’s 2012 Corporate GHG Inventory
Appendices
Verification Plan Sampling Plan
ICF International Page 18
Verification Report Entergy’s 2012 Corporate GHG Inventory
Verification Plan Entergy
1 Introduction
This document provides details on the verification scope and process that is planned to conduct a limited level verification of their assertion, namely the 2012 organization-wide GHG inventory, for Entergy Corporation (“Entergy”). The GHG Assertion made by Entergy requires the quantification of the emissions produced during, and related primarily to stationary combustion of fossil fuels and purchased power, as well as a number of minor sources. An overview of operations for the organization will be provided in the Verification Report.
A Verification Risk Assessment will be conducted during the verification planning stage. Additionally, the results of the Risk Assessment will inform the development of the Sampling Plan, which will be included in the Verification Report.
The Verification and Sampling Plans will be updated through the course of the verification as additional information becomes available.
The verification conclusion will be documented in the Verification Statement and the verification findings will be further described in the Verification Report. The Verification and Sampling Plans will be appended to the Verification Report to provide information related to the verification scope and process.
2 Verification Scope
2.1 Objective
The primary objective of this verification engagement is to provide assurance to Entergy that the GHG Assertion is reliable, and of sufficient quality for:
• Internal purposes, namely tracking towards internal reduction targets as well as annual reports, corporate social responsibility (CSR) reports, and other disclosures;
• External voluntary reporting, primarily to the American Carbon Registry (ACR), the Carbon Disclosure Project (CDP), and the Dow Jones Sustainability Index (DJSI).
2.2 Parties and Users
The person or persons responsible for the provision of the GHG Assertion and the supporting information, as defined in Section 2.23 of ISO 14064-1:2006, is the “Responsible Party”. For this verification, Entergy is the Responsible Party.
ICF International has been engaged to provide a third-party verification of the GHG Assertion. Experts from ICF International as well as from CVenture compose the “Verification Team”.
The “Intended User,” is defined in Section 2.24 of ISO 14064-1:2006 as the individual or organization identified by those reporting GHG-related information that relies on that information to make decisions. Entergy (and the public at large) are the intended users of the information contained in this verification.
ICF International Page 19
Verification Report Entergy’s 2012 Corporate GHG Inventory
2.3 Scope
The verification will be conducted in accordance with ISO 14064-3: Specification with guidance for the validation and verification of greenhouse gas assertions. The verification will be carried out at a limited level of assurance.
The following table defines the scope elements specified for the organization.
Scope Element ISO 14064-3 Definition
Boundary The Facility boundary, including legal, financial, operational and geographic boundaries
Infrastructure and Activities
The physical infrastructure, activities, technologies and processes of the organization
GHG Sources GHG sources to be included GHG Types Types of GHGs to be included Reporting Period Time period to be covered
The manner in which each of the above scope elements apply to Entergy’s GHG Assertion are described below.
Boundaries During the initial verification planning, the organizational boundaries and the sources, sinks and reservoirs (“SSRs”) which would be required to be included in the emissions inventory quantification will be explored. The procedures utilized to review the GHG Assertion were designed to support a limited level of assurance. These procedures systematically review:
• the emissions sources included in the quantification procedures; • the methodology employed in the quantification procedures; • data handling, information and management system and associated controls, and quality assurance /
quality control activities; • any changes in the quantification methodology, or to organizational boundaries due to acquisitions or
divestitures, as compared to previous corporate GHG emissions reports; • the GHG Assertion
Entergy has chosen to include all company owned assets and those under a capital lease consistent with 'equity share' reporting under EPA and WRI reporting protocols.
Infrastructure and Activities According to Entergy’s website1, “Entergy Corporation is an integrated energy company engaged primarily in electric power production and retail distribution operations. Entergy owns and operates power plants with approximately 30,000 megawatts of electric generating capacity, including more than 10,000 megawatts of nuclear power, making it one of the nation’s leading nuclear generators. Entergy delivers electricity to 2.8 million utility customers in Arkansas, Louisiana, Mississippi and Texas. Entergy has annual revenues of more than $11 billion and approximately 15,000 employees.”
1 Accessed on January 9, 2013 at http://www.entergy.com/about_entergy/
ICF International Page 20
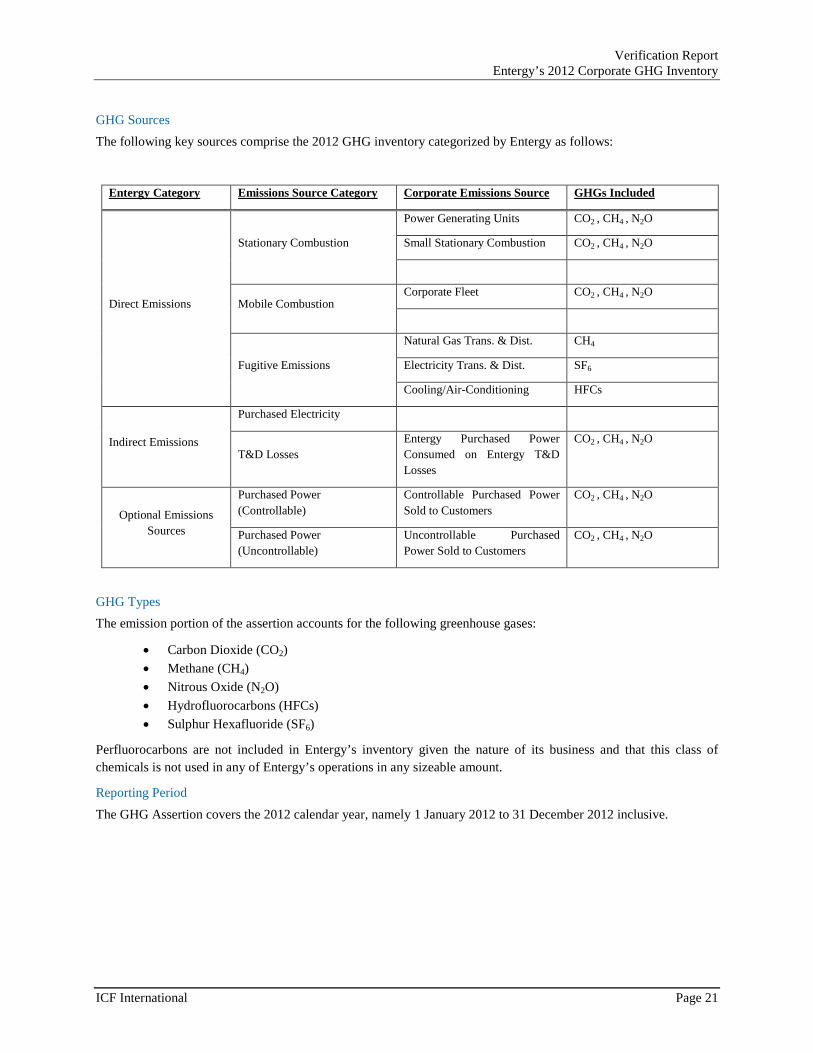
Verification Report Entergy’s 2012 Corporate GHG Inventory
GHG Sources The following key sources comprise the 2012 GHG inventory categorized by Entergy as follows:
Entergy Category Emissions Source Category Corporate Emissions Source GHGs Included
Direct Emissions
Stationary Combustion
Power Generating Units CO2 , CH4 , N2O
Small Stationary Combustion CO2 , CH4 , N2O
Mobile Combustion Corporate Fleet CO2 , CH4 , N2O
Fugitive Emissions
Natural Gas Trans. & Dist. CH4
Electricity Trans. & Dist. SF6
Cooling/Air-Conditioning HFCs
Indirect Emissions
Purchased Electricity
T&D Losses Entergy Purchased Power Consumed on Entergy T&D Losses
CO2 , CH4 , N2O
Optional Emissions Sources
Purchased Power (Controllable)
Controllable Purchased Power Sold to Customers
CO2 , CH4 , N2O
Purchased Power (Uncontrollable)
Uncontrollable Purchased Power Sold to Customers
CO2 , CH4 , N2O
GHG Types The emission portion of the assertion accounts for the following greenhouse gases:
• Carbon Dioxide (CO2) • Methane (CH4) • Nitrous Oxide (N2O) • Hydrofluorocarbons (HFCs) • Sulphur Hexafluoride (SF6)
Perfluorocarbons are not included in Entergy’s inventory given the nature of its business and that this class of chemicals is not used in any of Entergy’s operations in any sizeable amount.
Reporting Period The GHG Assertion covers the 2012 calendar year, namely 1 January 2012 to 31 December 2012 inclusive.
ICF International Page 21
Verification Report Entergy’s 2012 Corporate GHG Inventory
2.4 Materiality
During the course of the verification, individual errors, omissions or misrepresentations (collectively referred to as discrepancies) or the aggregate of these discrepancies will be evaluated qualitatively and quantitatively.
Materiality defines the level at which discrepancies in the GHG Assertion or any underlying supporting information precludes the issuance of a limited level of assurance.
The verification team is responsible for applying professional judgment to determine if qualitative discrepancies could adversely affect the GHG Assertion and subsequently influence the decisions of the Intended User, in which case, the discrepancies are deemed to be material.
Quantitative discrepancies will be calculated individually to determine the impact of the discrepancy as a percentage of the GHG Assertion.
All discrepancies that are outstanding at the conclusion of the verification will be documented in the Verification Report and classified on an individual basis as either material or immaterial
Materiality Threshold In the framework of a corporate entity-wide GHG inventory, the concept of materiality is defined in the context of the overall uncertainty in the reported data. A quantity, in this case errors and/or uncertainties associated with reported results, is typically considered to be “material” if it would influence any decision or action taken by users of the information. This definition of materiality is consistent with verification guidelines and goals for the reliability of reported data.
Materiality is not the same as a de minimus emissions threshold for either the exclusion of specific sources from the inventory, or the use of estimated values without ongoing, annual collection of associated activity data. While a de minimus exclusion from the inventory would contribute to overall uncertainty, completeness is only one component contributing to overall uncertainty.
Entergy’s current GHG inventory management plan and reporting document (IMPRD) states that “..emissions estimated to be less than 1% of the total inventory are considered de minimus unless they are anticipated to change dramatically and grow above this threshold.” Given the nature and relative magnitude of the various types of emissions sources in Entergy’s GHG inventory, such a de minimus size threshold for Entergy’s quantification methodology approach is reasonable. However, for its GHG inventory verification program, an appropriate materiality threshold needs to be devised in line with uncertainty and risk estimates. Based on those assessments, we suggest that such a materiality threshold for an ISO verification program, conducted to achieve a limited level of assurance, be established as 10%. Note that this materiality threshold may be breached by individual errors, or the sum of multiple errors detected in the various SSRs.
Individual discrepancies and the aggregate of individual discrepancies will be analyzed to determine if the materiality threshold has been breached.
ICF International Page 22
Verification Report Entergy’s 2012 Corporate GHG Inventory
2.5 Principles
ISO 14064-3:2006 defines six principles that should be upheld in the development of the GHG Assertion. These principles are intended to ensure a fair representation and a credible and balanced account of GHG emissions. The verification procedures developed and executed during the course of this verification will present evidence such that each of these principles is satisfied.
Relevance Appropriate data sources are used to quantify, monitor, or estimate GHG sources. Appropriate minimum thresholds associated with emissions levels, i.e., from de minimus sources, are used to justify the exclusion or the aggregation of minor GHG sources or the number and/or frequency of data points monitored.
Completeness All sources within Entergy’s boundaries (as defined earlier) are included within an identified source category.
Consistency Uniform calculations are employed between the base year and current accounting/reporting periods. Emission calculations for each source are calculated uniformly. If more accurate procedures and methodologies become available, documentation should be provided to justify the changes and show that all other principles are upheld.
Accuracy Measurements and estimates are presented, without bias as far as is practical. Where sufficient accuracy is not possible or practical, measurements and estimates should be used while maintaining the principle of conservativeness.
Transparency Information is presented in an open, clear, factual, neutral, and coherent matter that facilitates independent review. All assumptions are stated clearly and explicitly and all calculation methodologies and background material are clearly referenced.
Conservativeness Appropriate parameters affecting the sources are utilized in the calculation of the GHG Assertion. When parameters or data sources are highly uncertain, the choice of a specific parameter, data source, or estimated or default value to be utilized, results in an overestimation of the GHG Assertion (i.e., total annual emissions would be overstated for the sake of conservativeness, and to avoid the risks associated with understating reported emissions).
2.6 Limitation of Liability
Due to the complex nature of the operations within the organization and the inherent limitations of the verification procedures employed, it is possible that fraud, error, or non-compliance with laws, regulations, and relevant criteria may occur and not be detected.
ICF International Page 23
Verification Report Entergy’s 2012 Corporate GHG Inventory
3 Verification Team
Since 1969, ICF International has been serving major corporations, all levels of government, and multilateral institutions. Globally, approximately 400 of our approximately 4,500 employees are dedicated climate change specialists, with experience advising public and private-sector clients. ICF International has earned an international reputation in the field of climate change consulting for its analytical rigor, in-depth expertise, and technical integrity through scores of GHG emissions-related assignments over the past two decades.
ICF International has carried out numerous facility-level GHG verifications and verifications of emission reduction projects. ICF has developed the necessary internal controls to ensure qualified and competent staffing uphold the principles of the relevant standard while quality control processes are utilized to assure data integrity is maintained and safeguarded. ICF’s clients choose ICF for its strong brand, technical expertise, and rigorous methodological approach.
For this verification, ICF has assembled a Verification Team consisting of experienced greenhouse gas verifiers and relevant technical experts.
Verifiers Khalid Husain is a Manager in the Climate Change Mitigation and Sustainability group of ICF’s Energy, Environment and Transportation (EET) Practice. A LEED-EB accredited professional, he has approximately 12 years of experience in climate change, energy and environmental issues in both public and private sector capacities. His current work involves a range of technical assistance on greenhouse gas management issues. Mr. Husain brings strong knowledge and experience in GHG inventory development and verification, as well as in corporate sustainability at large through work with diverse clients. He has carried out, or is in the process of conducting, verification of GHG inventories under ISO 14064, Alberta’s Specified Gas Emitters Regulation, California Climate Change Registry (CCAR), EPA Climate Leaders Protocol and the Carbon Disclosure Project. He has also worked on EPA’s Task Order 70 and is knowledgeable of international GHG protocols for the EU ETS, CDM and JI. His experience also includes advisory and analytical services on carbon offsets, on both the buy and sell sides, for both voluntary and CDM projects. Services include undertaking feasibility studies, conducting risk assessments and due diligence, drafting and revising project design documents (PDDs), and reviewing methodologies for offsets. Mr. Husain holds a Masters degree in International Affairs, joint focus in Economic & Political Development & Environmental Studies from Columbia University and a B.Sc. (Honors) in Earth and Planetary Sciences from McGill University.
Craig Ebert is a Managing Director in ICF’s Los Angeles Office, and supports commercial and public clients internationally on strategic management of the risks and opportunities posed by climate change and attendant impacts on shareholder value. He has worked for a wide variety of public and private clients, including most recently Yahoo!, News Corporation, eBay, Time Warner, Exelon, Duke, Fidelity, TransCanada, El Paso, World Bank, Lafarge, Repsol, Aracruz, and Petrobras. He has directed ICF’s support to the US EPA as its primary climate change contractor, including support to about 50 countries under the US Country Studies Program, compilation of the official US greenhouse gas inventory to meet international commitments under the United Nations Framework Convention on Climate Change, and analysis of the cost and availability of options to reduce US emissions in support of international climate negotiations. His support includes assessing the cost and availability of various offset classes for different public and private sector clients and helping clients unlock the financial value of potential emission reduction projects in both voluntary and compliance markets.
ICF International Page 24
Verification Report Entergy’s 2012 Corporate GHG Inventory
Kevin Johnson (Cventure LLC) has over 25 years energy and environmental consulting experience, focusing over the last decade on climate change, greenhouse gas (GHG) and CO2 emissions inventories, sustainability programs, and verification. In 2005, he founded Carbon Solutions, Inc., an independent consulting services firm, and in 2007 co-founded Cventure LLC. Mr. Johnson was a primary author of the “Corporate GHG Verification Guideline”, a CDP-approved verification standard, prepared for the US EPA Climate Leaders program. He also drafted the verification guidelines for the American Carbon Registry (ACR); and conducted dozens of verification projects, for various US companies’ GHG inventories, and carbon offset projects. Mr. Johnson has also led the development of a carbon offset project evaluation and quality rating software tool. Prior to forming Carbon Solutions, Inc., he previously served as the leader of URS Corporation’s corporate GHG/climate change practice. Some of his other project management experience includes sustainability report reviews and verification, corporate strategy development, carbon offset project/technology due diligence assessments and feasibility studies, GHG emission inventories/protocols, environmental management information system (EMIS) implementations, ERC verification and trading support, benchmarking, and life cycle analysis. Some climate change clients include Exelon, Eni, El Paso, Bloomberg LP, NewsCorp, Broadridge Financial Solutions, Compuware, Wal-Mart, Marathon, Unocal, Conoco, BlueSource, EDF, U.S. DOE, GRI, U.S. EPA, and several independent oil producers.
Internal Peer Reviewer Aaron Schroeder is a Professional Engineer in the Province of Alberta and holds a B.Sc. in Engineering from the University of Saskatchewan. He has completed supplementary training in ISO 14064 as well as Auditing and Assurance Engagements through the University of Toronto, School of Continuing Studies. Aaron has acted as lead verifier on third-party assurance assignments for multiple compliance periods under Alberta’s Specified Gas Emitters Regulation. These projects included work at SAGD facilities in Alberta’s oil sands, a complex sour gas processing facility, two of Alberta’s largest natural gas pipelines and combined-cycle electric generating facilities. Additionally, Aaron has completed numerous verifications as lead verifier for emission reduction (offset) projects in agricultural tillage management, wind electricity generation, and acid gas injection projects.
ICF International Page 25
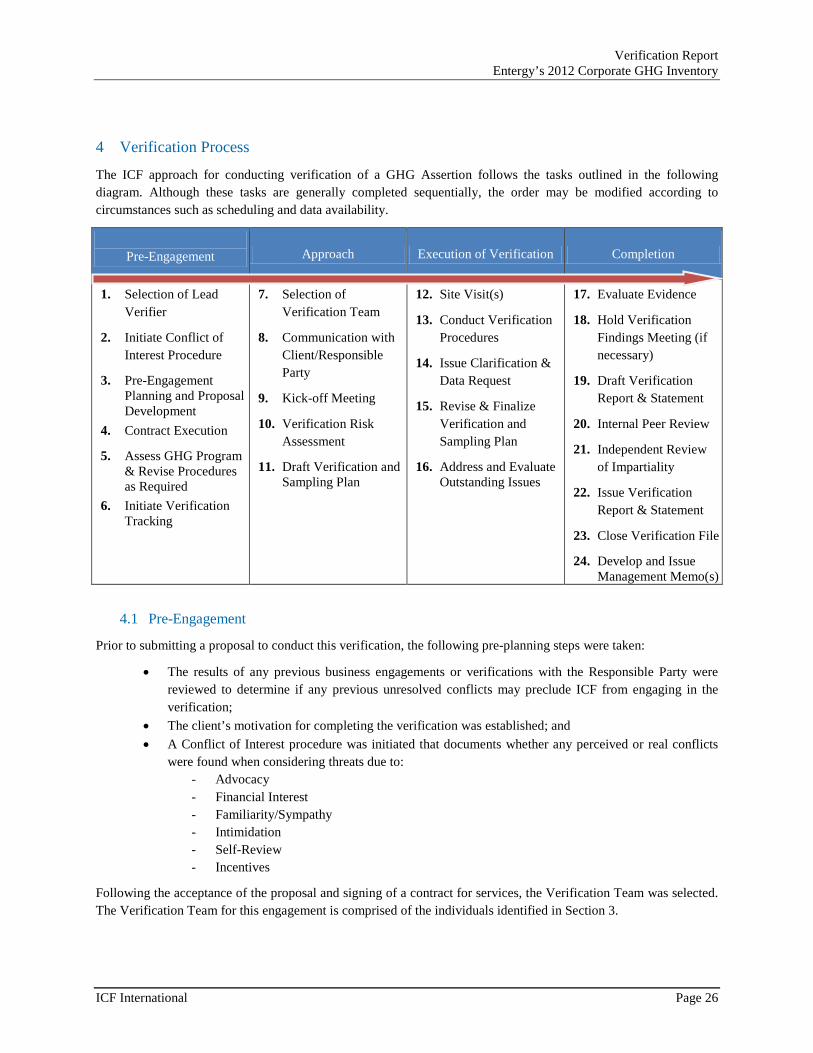
Verification Report Entergy’s 2012 Corporate GHG Inventory
4 Verification Process
The ICF approach for conducting verification of a GHG Assertion follows the tasks outlined in the following diagram. Although these tasks are generally completed sequentially, the order may be modified according to circumstances such as scheduling and data availability.
Pre-Engagement Approach Execution of Verification Completion
1. Selection of Lead Verifier
2. Initiate Conflict of Interest Procedure
3. Pre-Engagement Planning and Proposal Development
4. Contract Execution
5. Assess GHG Program & Revise Procedures as Required
6. Initiate Verification Tracking
7. Selection of Verification Team
8. Communication with Client/Responsible Party
9. Kick-off Meeting
10. Verification Risk Assessment
11. Draft Verification and Sampling Plan
12. Site Visit(s)
13. Conduct Verification Procedures
14. Issue Clarification & Data Request
15. Revise & Finalize Verification and Sampling Plan
16. Address and Evaluate Outstanding Issues
17. Evaluate Evidence
18. Hold Verification Findings Meeting (if necessary)
19. Draft Verification Report & Statement
20. Internal Peer Review
21. Independent Review of Impartiality
22. Issue Verification Report & Statement
23. Close Verification File
24. Develop and Issue Management Memo(s)
4.1 Pre-Engagement
Prior to submitting a proposal to conduct this verification, the following pre-planning steps were taken:
• The results of any previous business engagements or verifications with the Responsible Party were reviewed to determine if any previous unresolved conflicts may preclude ICF from engaging in the verification;
• The client’s motivation for completing the verification was established; and • A Conflict of Interest procedure was initiated that documents whether any perceived or real conflicts
were found when considering threats due to: - Advocacy - Financial Interest - Familiarity/Sympathy - Intimidation - Self-Review - Incentives
Following the acceptance of the proposal and signing of a contract for services, the Verification Team was selected. The Verification Team for this engagement is comprised of the individuals identified in Section 3.
ICF International Page 26
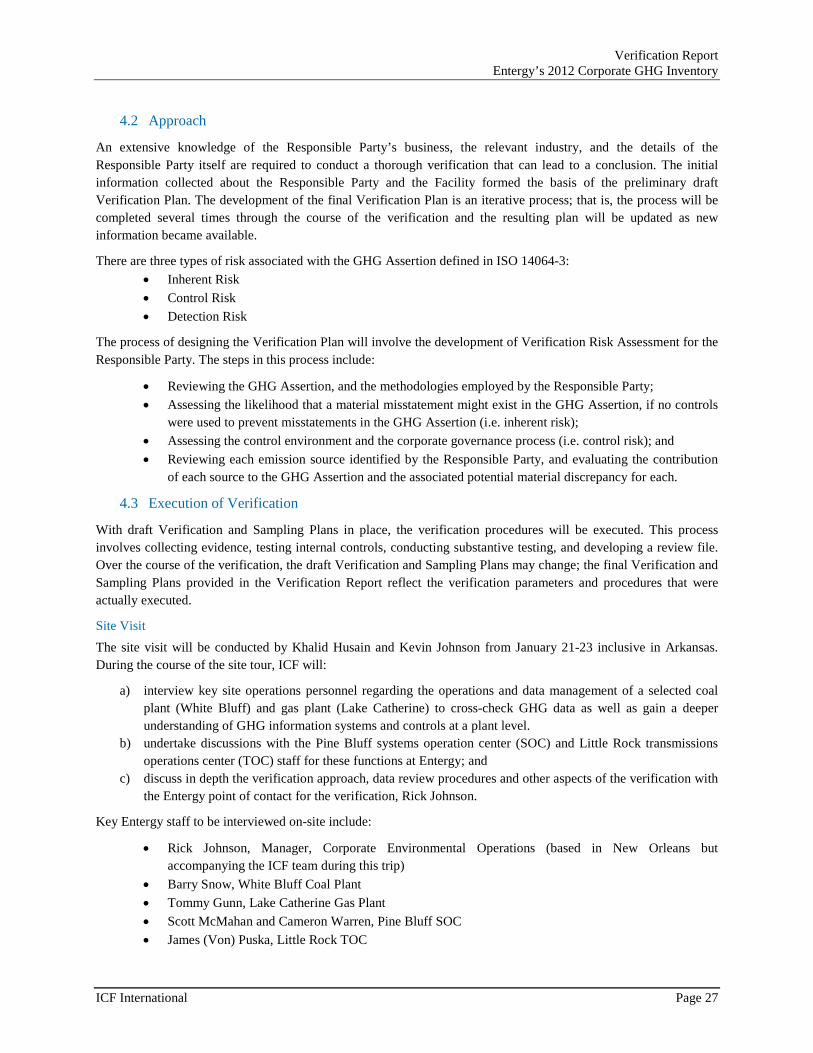
Verification Report Entergy’s 2012 Corporate GHG Inventory
4.2 Approach
An extensive knowledge of the Responsible Party’s business, the relevant industry, and the details of the Responsible Party itself are required to conduct a thorough verification that can lead to a conclusion. The initial information collected about the Responsible Party and the Facility formed the basis of the preliminary draft Verification Plan. The development of the final Verification Plan is an iterative process; that is, the process will be completed several times through the course of the verification and the resulting plan will be updated as new information became available.
There are three types of risk associated with the GHG Assertion defined in ISO 14064-3: • Inherent Risk • Control Risk • Detection Risk
The process of designing the Verification Plan will involve the development of Verification Risk Assessment for the Responsible Party. The steps in this process include:
• Reviewing the GHG Assertion, and the methodologies employed by the Responsible Party; • Assessing the likelihood that a material misstatement might exist in the GHG Assertion, if no controls
were used to prevent misstatements in the GHG Assertion (i.e. inherent risk); • Assessing the control environment and the corporate governance process (i.e. control risk); and • Reviewing each emission source identified by the Responsible Party, and evaluating the contribution
of each source to the GHG Assertion and the associated potential material discrepancy for each.
4.3 Execution of Verification
With draft Verification and Sampling Plans in place, the verification procedures will be executed. This process involves collecting evidence, testing internal controls, conducting substantive testing, and developing a review file. Over the course of the verification, the draft Verification and Sampling Plans may change; the final Verification and Sampling Plans provided in the Verification Report reflect the verification parameters and procedures that were actually executed.
Site Visit The site visit will be conducted by Khalid Husain and Kevin Johnson from January 21-23 inclusive in Arkansas. During the course of the site tour, ICF will:
a) interview key site operations personnel regarding the operations and data management of a selected coal plant (White Bluff) and gas plant (Lake Catherine) to cross-check GHG data as well as gain a deeper understanding of GHG information systems and controls at a plant level.
b) undertake discussions with the Pine Bluff systems operation center (SOC) and Little Rock transmissions operations center (TOC) staff for these functions at Entergy; and
c) discuss in depth the verification approach, data review procedures and other aspects of the verification with the Entergy point of contact for the verification, Rick Johnson.
Key Entergy staff to be interviewed on-site include:
• Rick Johnson, Manager, Corporate Environmental Operations (based in New Orleans but accompanying the ICF team during this trip)
• Barry Snow, White Bluff Coal Plant • Tommy Gunn, Lake Catherine Gas Plant • Scott McMahan and Cameron Warren, Pine Bluff SOC • James (Von) Puska, Little Rock TOC
ICF International Page 27
Verification Report Entergy’s 2012 Corporate GHG Inventory
During the site visit all GHG emission sources for the White Bluff and Lake Catherine facilities will be reviewed to ensure appropriate identification and categorization. A review of process flow and metering diagrams will be followed by physical observation of the facilities.
Collecting Evidence and Review of Documentation Sufficiency and appropriateness are two interrelated concepts that are fundamental to the collection of verification evidence. The decision as to whether an adequate quantity (sufficiency) of evidence has been obtained is influenced by its quality (appropriateness).
Through the execution of the verification procedures described in the final Verification Plan, the Verification Team will review key forms of evidence including physical, documentary and testimonial.
• Management documentation: policies, programs, and procedures related to the collection, safeguarding, and management of the data supporting the GHG Assertion;
• Records: records comprise time-sensitive data, correspondence, and files. • Interviews: the interviews will provide information regarding operations and data management and
will provide evidence to support the sufficiency of data controls; and • Computer systems: data systems used to capture and manage the GHG-related data and to calculate the
GHG Assertion.
The following are the key data systems that will be reviewed:
• TRADES – controllable power purchases tracking system: hourly purchase amounts from 1/1/2012 to 12/31/2012 inclusive.
• Generation Fuels and Accounting – Monthly purchased power totals for 2012 (12 months for 2012) in PDF form by Scott Celino.
• ISB (Intra-system billing) – Total purchased power data by Charles John. • PM&D data – for large fossil generating stations • CEMS data – for large fossil generating stations (as well as for small stationary sources that have CEMS) • Gas purchases data – monthly for all gas-fired electric generating units – from Karen McIlvoy: purchase
amounts inputed into ISB. • Coal purchases data – from Ryan Trushenski (solid fuels): purchase amounts inputted into ISB.
The following non-critical data will be requested and obtained for exploratory checks and knowledge enhancement for both GHG data comparison purposes as well as for information systems:
• TRADES – a subset of non-controllable power purchases data from 1/1/2012 to 12/31/2012 to be sent via Excel to ICF by Grady Kaough (via Rick Johnson).
• SOC – a subset of power purchases data from 1/1/2012 to 12/31/2012 inclusive to be sent via Excel to ICF by Cameron Warren (via Rick Johnson).
Telephone and videoconference interviews will be held with staff involved in the above systems in order to review procedures and obtain relevant data.
Testing and Assessment of Internal Controls The Verification Team will develop a sufficient understanding of the GHG information system and internal controls to determine whether the overall data management system is sound and if it supports the GHG Assertion. This assessment will seek to identify any weakness or gaps in the controls that pose a significant risk of not preventing or correcting problems with the quality of the data and examining it for sources of potential errors, omissions, and
ICF International Page 28
Verification Report Entergy’s 2012 Corporate GHG Inventory
misrepresentations. It will incorporate an examination of three aspects of the Responsible Party’s internal controls: (1) the control environment, (2) the data systems, and (3) the control and maintenance procedures.
Assessment of Data Substantive testing procedures will be used to assess the reasonability and validity of the GHG Assertion. Both quantitative and qualitative analysis will be performed to achieve the desired level of assurance. The verification procedures are described in the final Verification Plan as separate tables for each process or activity involved in the quantification and reporting of the GHG Assertion. The verification procedures include verification activities designed to:
• Review the Responsible Party’s boundary, including a review of the completeness of emission sources identified;
• Review the Responsible Party’s data sources to ensure the GHG Assertion is calculated based on metered or estimated data;
• Re-calculate the GHG Assertion, which demonstrates transparency and accuracy; and • Review the GHG Assertion to ensure the emissions calculated by the Responsible Party has been
accurately reported.
Clarification and Data Request To facilitate information flow between the Verification Team and the Responsible Party, a consolidated request for additional information will be developed through the course of the verification and issued to the Responsible Party. This “Clarification and Data Request” will be used to document information requests and summarize the responses. It will also be used to document the Verification Team’s assessment of each response.
Developing a Review File A review file (the “File”) comprised of documents, records, working papers and other evidence collected and created during the course of the review that support the review conclusions will be developed for this verification. This evidence stored in hard copy and/or electronic format will serve to provide support for the verification conclusion, provide evidence that the verification was conducted in accordance with the criteria set forth in this document, and aid the Verifier in conducting current and future reviews.
The File will include:
• The GHG Assertion and supporting documentation, as submitted to Entergy; • Decisions on the level of materiality and the results of the Verification Risk Assessment; • Documentation on the Responsible Party’s internal controls; • Descriptions of the controls assessment work and results; • Documentation of the substantive testing procedures that were carried out and the results; • Copies of any correspondence with the Responsible Party or other parties relevant to the review; • The Verification Team’s working papers; • The Clarification and Data Request with documented responses from the Responsible Party; and • Client data (copies of relevant records, spreadsheets, and other data files).
ICF International Page 29
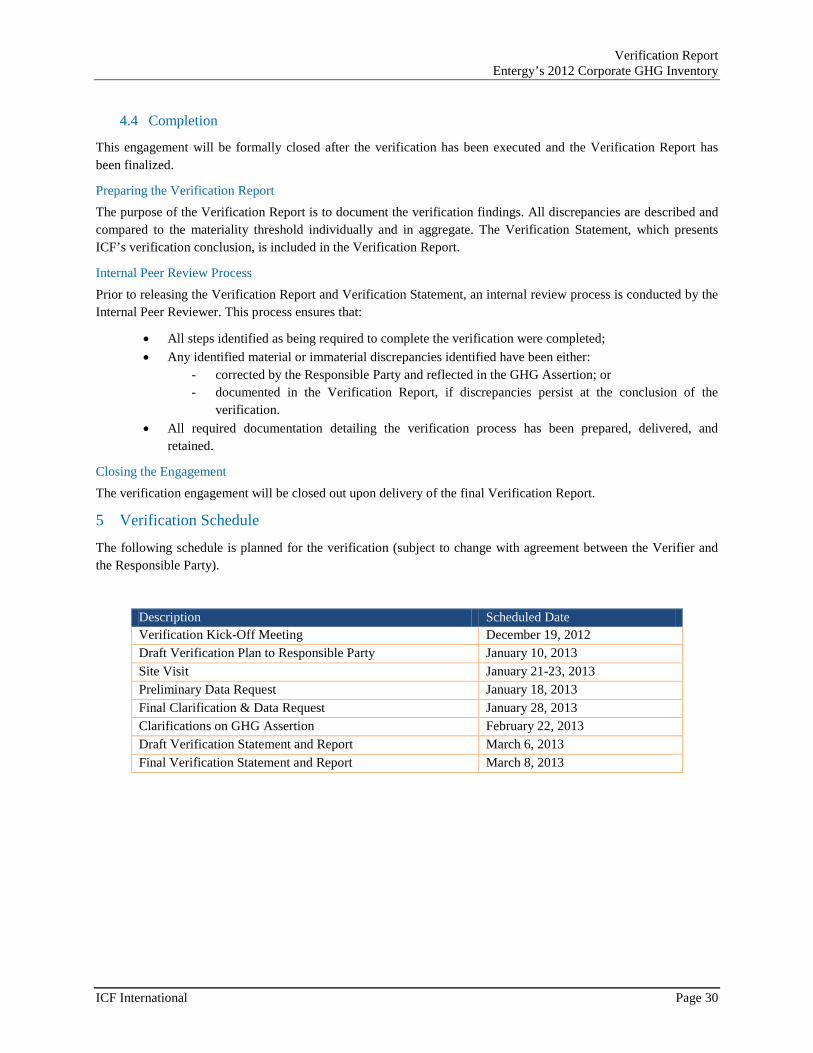
Verification Report Entergy’s 2012 Corporate GHG Inventory
4.4 Completion
This engagement will be formally closed after the verification has been executed and the Verification Report has been finalized.
Preparing the Verification Report The purpose of the Verification Report is to document the verification findings. All discrepancies are described and compared to the materiality threshold individually and in aggregate. The Verification Statement, which presents ICF’s verification conclusion, is included in the Verification Report.
Internal Peer Review Process Prior to releasing the Verification Report and Verification Statement, an internal review process is conducted by the Internal Peer Reviewer. This process ensures that:
• All steps identified as being required to complete the verification were completed; • Any identified material or immaterial discrepancies identified have been either:
- corrected by the Responsible Party and reflected in the GHG Assertion; or - documented in the Verification Report, if discrepancies persist at the conclusion of the
verification. • All required documentation detailing the verification process has been prepared, delivered, and
retained.
Closing the Engagement The verification engagement will be closed out upon delivery of the final Verification Report.
5 Verification Schedule
The following schedule is planned for the verification (subject to change with agreement between the Verifier and the Responsible Party).
Description Scheduled Date Verification Kick-Off Meeting December 19, 2012 Draft Verification Plan to Responsible Party January 10, 2013 Site Visit January 21-23, 2013 Preliminary Data Request January 18, 2013 Final Clarification & Data Request January 28, 2013 Clarifications on GHG Assertion February 22, 2013 Draft Verification Statement and Report March 6, 2013 Final Verification Statement and Report March 8, 2013
ICF International Page 30
Verification Report Entergy’s 2012 Corporate GHG Inventory
6 Verification Risk Assessment
There are three types of risk associated with the GHG data management system and the GHG Assertion defined in ISO 14064-3:
• Inherent Risk • Control Risk • Detection Risk
The assessed level of risk for this verification dictates the degree of rigor planned for the verification procedures described in the accompanying Sampling Plan. Our established audit procedures and documentation systems ensure a thorough treatment of any risk identified, including determination of magnitude and sensitivity of that risk, during the assessment process. A qualitative risk assessment will be completed based on observations made by reviewing and assessing accompanying documentation, as well as assessing available information such as the GHG inventory file, interviewing key personnel, and reviewing supporting documents.
The inherent risk in Entergy’s corporate-wide 2012 GHG Assertion will emanate from the large and complex nature of the company, the number of parties involved in managing their emissions inventory and developing their assertion, the number of emission sources, a large number of natural gas and coal plants used in the process, and a large number of power purchases occurring throughout the year. Entergy Corporation is an integrated energy company engaged primarily in electric power production and retail distribution operations. Entergy owns and operates power plants with approximately 30,000 megawatts of electric generating capacity, including more than 10,000 megawatts of nuclear power, making it one of the nation’s leading nuclear generators. Because of these reasons, in particular the sheer magnitude of Entergy’s GHG footprint, the inherent risk is likely to be medium.
Control risk relates to the likelihood that a material misstatement in the 2012 GHG Assertion will not be prevented or detected by Entergy’s internal control and data management systems. Control risks will be assessed primarily by reviewing data controls and management systems for large fossil generating units and purchased power, both comprising in aggregate nearly 99% of total company-wide emission as noted in the 2012 GHG Assertion. This percentage has remained largely the same over the last three years. The largest control risk in relation to the 2012 GHG assertion is likely to be the manual transcription method in which the inventory is prepared (i.e., emissions values are extracted from various sources and manually entered into an Excel spreadsheet). For purchased power, a number of data systems (such as TRADES and gas and coal purchases) feed into ISB (intra-system billing system). Both the individual data systems that comprise data input into ISB as well as ISB itself undergo QA/QC checks several times on an annualized basis. For all of the large, CEMS-equipped fossil fuel electric generation units, which contribute approximately 70% of Entergy’s total GHG emissions inventory, there are very rigorous measurement, monitoring, and reporting (MMR) requirements established by the U.S. EPA. These CEMS MMR programs, and their robust associated QA/QC activities, serve as the basis for demonstrating regulatory compliance with various federal Clean Air Act and state air permit compliance requirements. Also, the equipment utilized in these CEM systems are well established technologies with demonstrated track records of accuracy, precision, and reliability. Because of all of these reasons, the control risk is likely to be low.
The detection risk is a measure of the risk that the verification evidence collected and reviewed will fail to detect material misstatements, should such misstatements exist. Unlike inherent and control risk, which are typically attributes of the facility types and technologies employed therein, detection risk is variable but can be maintained at a low level by designing an appropriate number of tests, and collecting an adequate sample size. ICF conducted a number of sampling tests, focused on large fossil electric generation units and purchased power facilities. These tests are outlined in the sampling plan. Our assessment is that detection risk is likely low, given the large number and appropriateness of the tests which have focused on the largest sector (by relative magnitude) of Entergy’s 2012 GHG Assertion.
ICF International Page 31
Verification Report Entergy’s 2012 Corporate GHG Inventory
These tests have been designed and targeted at the greatest risk areas within Entergy’s overall GHG inventory information management and data quality control system, namely the manual parts of the process. Also, for the large CEMS-equipped generation units, because there are so many of them in Entergy’s system (~50), there would have to be multiple, long duration undetected control failures to create errors which would lead to material misstatement of Entergy’s entity-wide inventory. (For example, in the 2010 case of two highly unusual CEM system failures, which went undetected for several months, while they affected GHG emissions of each unit by 5-10%, their collective impact on Entergy’s overall corporate GHG inventory was less than 1%.)
ICF International Page 32
Verification Report Entergy’s 2012 Corporate GHG Inventory
Sampling Plan
Entergy’s 2012 GHG Inventory Verification
ICF International Page 33
Verification Report Entergy’s 2012 Corporate GHG Inventory
Objective:
The Sampling Plan describes the procedures that will be conducted within the verification to review Entergy’s 2012 GHG Inventory, specifically the GHG Assertion. These procedures have been developed in accordance with the verification principles described in the Verification Plan and customized for Entergy.
Testing Procedures:
The specific verification activities are summarized in separate tables for each procedure that has been designed to review the evidence supporting the GHG Assertion. As relevant, materiality is specified for each specific procedure. Aggregate materiality is determined separately.
Summary of Procedures:
Note that the following procedures are not necessarily performed in a sequential manner and may be dictated by the receipt of appropriate data sources. These procedures may also be conducted in an iterative manner as required. While it is appropriate to correct any errors or omissions as identified by the Verification Team, the Responsible Party must perform any required corrections to avoid the threat of self-review to the Verification Team.
Organizational Boundaries and Definition B1: Established Organizational Boundaries B2: Review of Operating Conditions
Calculation C1: True-up and Re-Performance Calculations C2: Minor / Negligible Emissions - Methodology and Documentation
Data Sources and Supporting Data D1: Data Gathering and Quality Controls D2: Data Confirmation against External Sources D3: Data Migration into Inventory
Assertion A1: Verification Assessment
ICF International Page 34
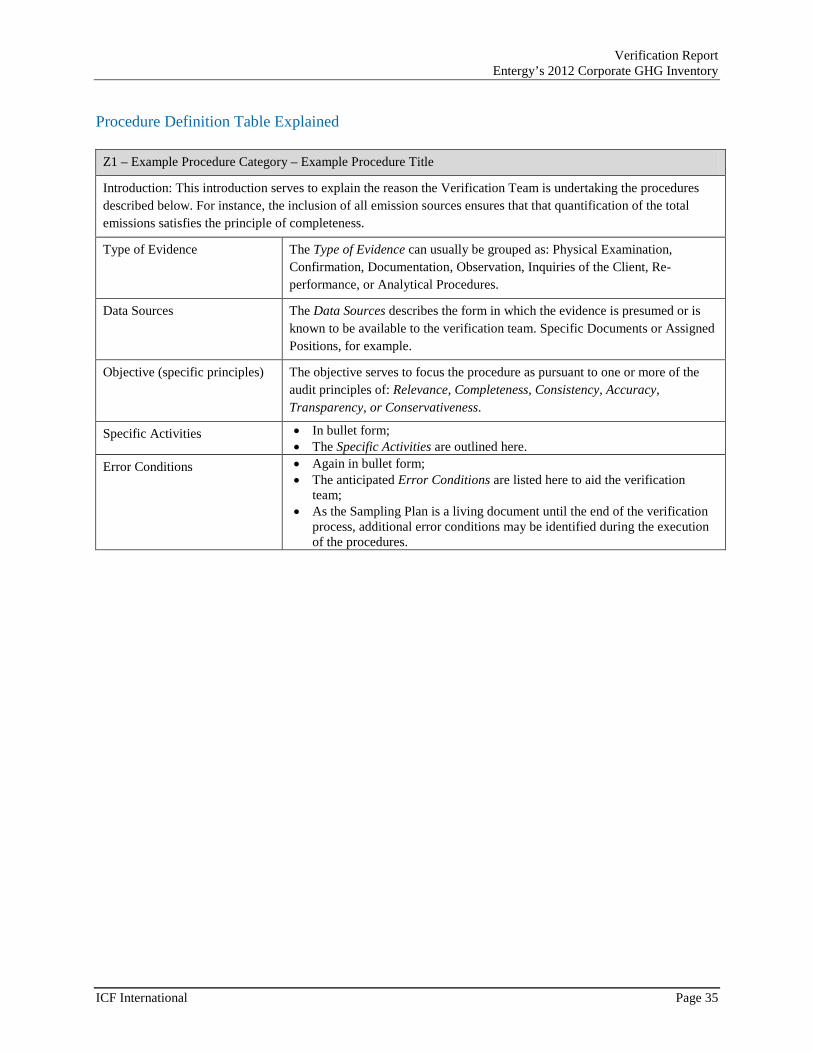
Verification Report Entergy’s 2012 Corporate GHG Inventory
Procedure Definition Table Explained
Z1 – Example Procedure Category – Example Procedure Title
Introduction: This introduction serves to explain the reason the Verification Team is undertaking the procedures described below. For instance, the inclusion of all emission sources ensures that that quantification of the total emissions satisfies the principle of completeness.
Type of Evidence The Type of Evidence can usually be grouped as: Physical Examination, Confirmation, Documentation, Observation, Inquiries of the Client, Re-performance, or Analytical Procedures.
Data Sources The Data Sources describes the form in which the evidence is presumed or is known to be available to the verification team. Specific Documents or Assigned Positions, for example.
Objective (specific principles) The objective serves to focus the procedure as pursuant to one or more of the audit principles of: Relevance, Completeness, Consistency, Accuracy, Transparency, or Conservativeness.
Specific Activities • In bullet form; • The Specific Activities are outlined here.
Error Conditions • Again in bullet form; • The anticipated Error Conditions are listed here to aid the verification
team; • As the Sampling Plan is a living document until the end of the verification
process, additional error conditions may be identified during the execution of the procedures.
ICF International Page 35
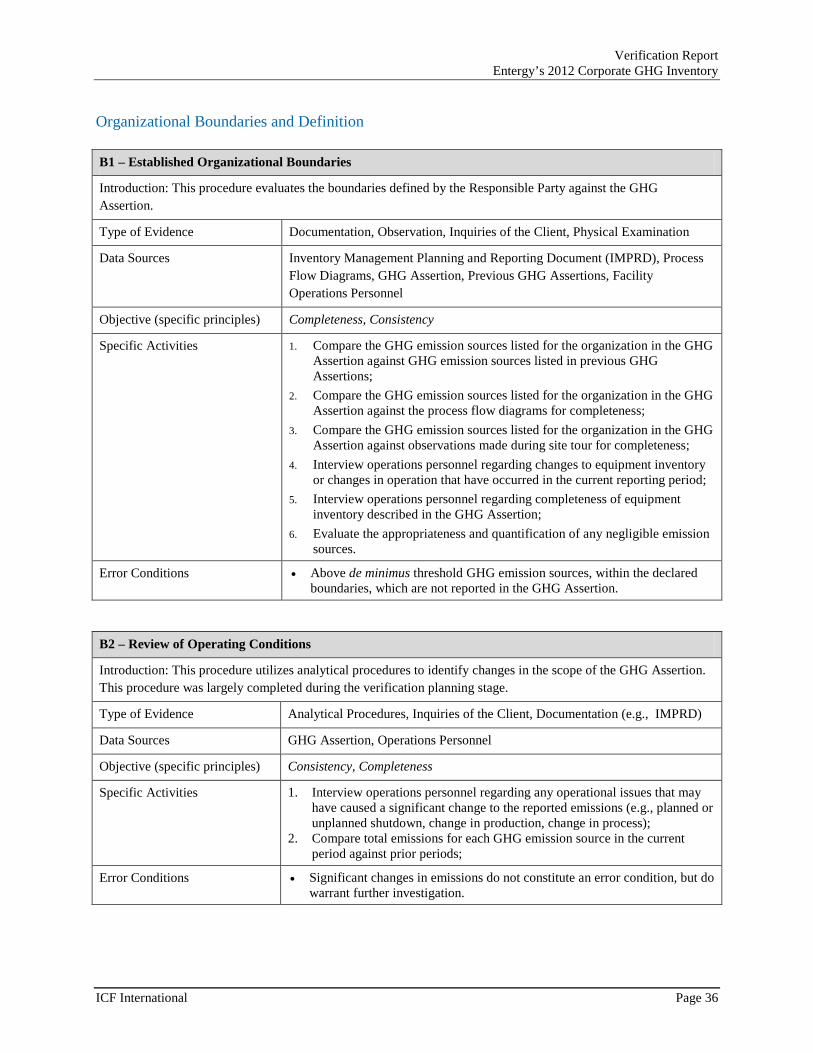
Verification Report Entergy’s 2012 Corporate GHG Inventory
Organizational Boundaries and Definition
B1 – Established Organizational Boundaries
Introduction: This procedure evaluates the boundaries defined by the Responsible Party against the GHG Assertion.
Type of Evidence Documentation, Observation, Inquiries of the Client, Physical Examination
Data Sources Inventory Management Planning and Reporting Document (IMPRD), Process Flow Diagrams, GHG Assertion, Previous GHG Assertions, Facility Operations Personnel
Objective (specific principles) Completeness, Consistency
Specific Activities 1. Compare the GHG emission sources listed for the organization in the GHG Assertion against GHG emission sources listed in previous GHG Assertions;
2. Compare the GHG emission sources listed for the organization in the GHG Assertion against the process flow diagrams for completeness;
3. Compare the GHG emission sources listed for the organization in the GHG Assertion against observations made during site tour for completeness;
4. Interview operations personnel regarding changes to equipment inventory or changes in operation that have occurred in the current reporting period;
5. Interview operations personnel regarding completeness of equipment inventory described in the GHG Assertion;
6. Evaluate the appropriateness and quantification of any negligible emission sources.
Error Conditions • Above de minimus threshold GHG emission sources, within the declared boundaries, which are not reported in the GHG Assertion.
B2 – Review of Operating Conditions
Introduction: This procedure utilizes analytical procedures to identify changes in the scope of the GHG Assertion. This procedure was largely completed during the verification planning stage.
Type of Evidence Analytical Procedures, Inquiries of the Client, Documentation (e.g., IMPRD)
Data Sources GHG Assertion, Operations Personnel
Objective (specific principles) Consistency, Completeness
Specific Activities 1. Interview operations personnel regarding any operational issues that may have caused a significant change to the reported emissions (e.g., planned or unplanned shutdown, change in production, change in process);
2. Compare total emissions for each GHG emission source in the current period against prior periods;
Error Conditions • Significant changes in emissions do not constitute an error condition, but do warrant further investigation.
ICF International Page 36
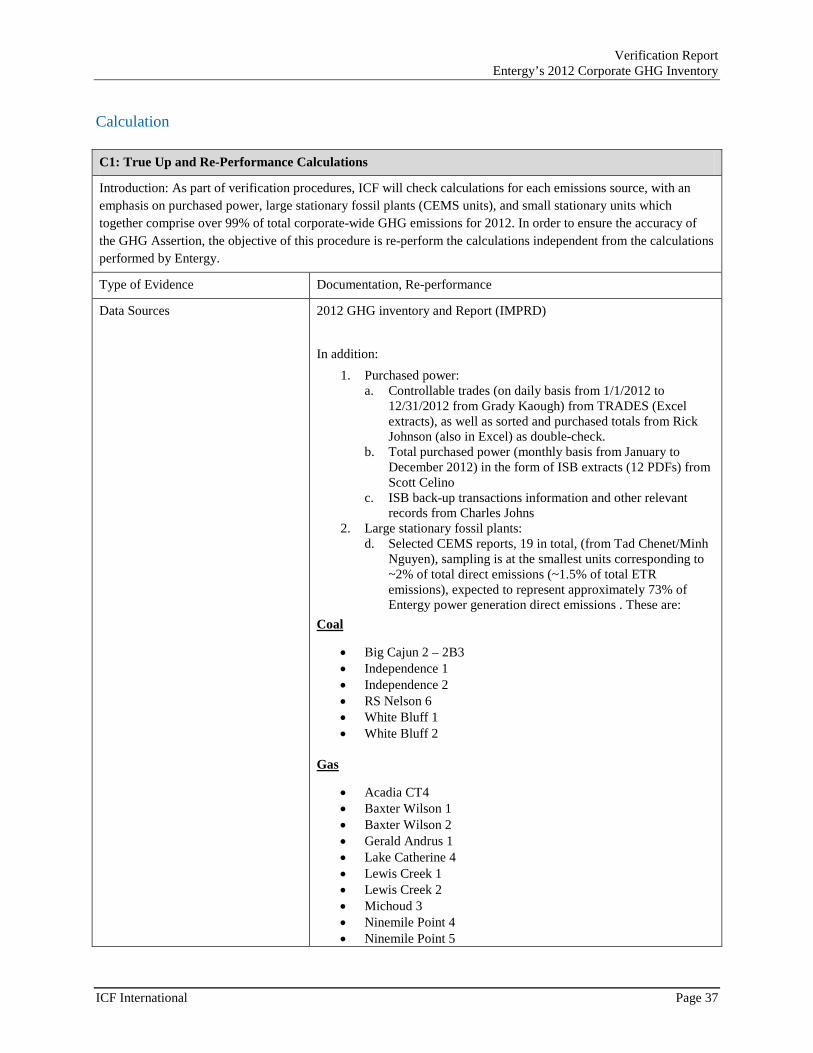
Verification Report Entergy’s 2012 Corporate GHG Inventory
Calculation
C1: True Up and Re-Performance Calculations
Introduction: As part of verification procedures, ICF will check calculations for each emissions source, with an emphasis on purchased power, large stationary fossil plants (CEMS units), and small stationary units which together comprise over 99% of total corporate-wide GHG emissions for 2012. In order to ensure the accuracy of the GHG Assertion, the objective of this procedure is re-perform the calculations independent from the calculations performed by Entergy.
Type of Evidence Documentation, Re-performance
Data Sources 2012 GHG inventory and Report (IMPRD) In addition:
1. Purchased power: a. Controllable trades (on daily basis from 1/1/2012 to
12/31/2012 from Grady Kaough) from TRADES (Excel extracts), as well as sorted and purchased totals from Rick Johnson (also in Excel) as double-check.
b. Total purchased power (monthly basis from January to December 2012) in the form of ISB extracts (12 PDFs) from Scott Celino
c. ISB back-up transactions information and other relevant records from Charles Johns
2. Large stationary fossil plants: d. Selected CEMS reports, 19 in total, (from Tad Chenet/Minh
Nguyen), sampling is at the smallest units corresponding to ~2% of total direct emissions (~1.5% of total ETR emissions), expected to represent approximately 73% of Entergy power generation direct emissions . These are:
Coal
• Big Cajun 2 – 2B3 • Independence 1 • Independence 2 • RS Nelson 6 • White Bluff 1 • White Bluff 2
Gas
• Acadia CT4 • Baxter Wilson 1 • Baxter Wilson 2 • Gerald Andrus 1 • Lake Catherine 4 • Lewis Creek 1 • Lewis Creek 2 • Michoud 3 • Ninemile Point 4 • Ninemile Point 5
ICF International Page 37
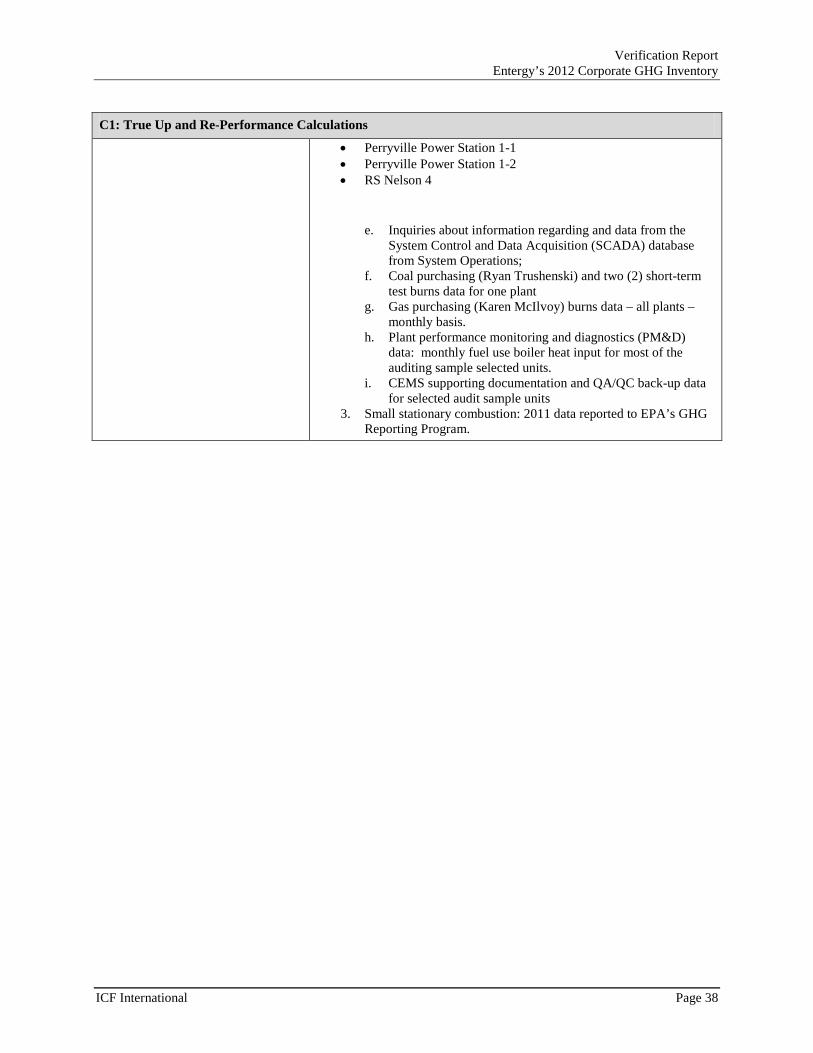
Verification Report Entergy’s 2012 Corporate GHG Inventory
C1: True Up and Re-Performance Calculations
• Perryville Power Station 1-1 • Perryville Power Station 1-2 • RS Nelson 4
e. Inquiries about information regarding and data from the System Control and Data Acquisition (SCADA) database from System Operations;
f. Coal purchasing (Ryan Trushenski) and two (2) short-term test burns data for one plant
g. Gas purchasing (Karen McIlvoy) burns data – all plants – monthly basis.
h. Plant performance monitoring and diagnostics (PM&D) data: monthly fuel use boiler heat input for most of the auditing sample selected units.
i. CEMS supporting documentation and QA/QC back-up data for selected audit sample units
3. Small stationary combustion: 2011 data reported to EPA’s GHG Reporting Program.
ICF International Page 38
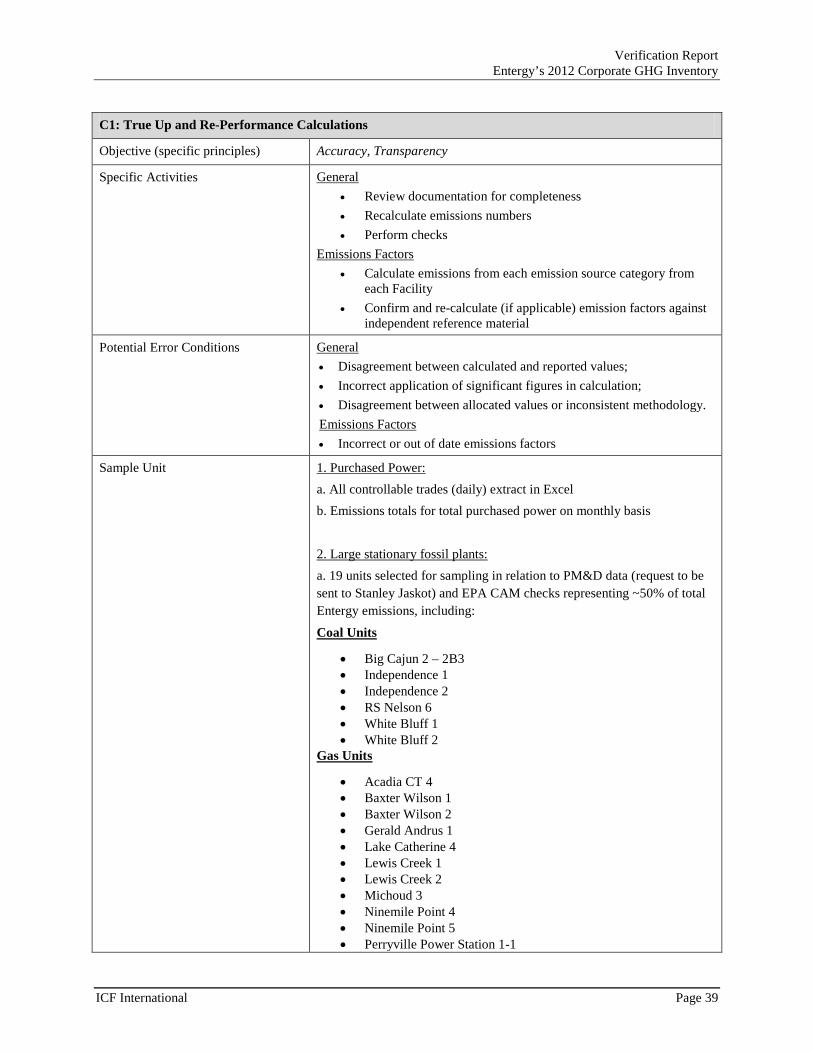
Verification Report Entergy’s 2012 Corporate GHG Inventory
C1: True Up and Re-Performance Calculations
Objective (specific principles) Accuracy, Transparency
Specific Activities General • Review documentation for completeness • Recalculate emissions numbers • Perform checks
Emissions Factors • Calculate emissions from each emission source category from
each Facility • Confirm and re-calculate (if applicable) emission factors against
independent reference material
Potential Error Conditions General • Disagreement between calculated and reported values; • Incorrect application of significant figures in calculation; • Disagreement between allocated values or inconsistent methodology. Emissions Factors • Incorrect or out of date emissions factors
Sample Unit 1. Purchased Power: a. All controllable trades (daily) extract in Excel b. Emissions totals for total purchased power on monthly basis 2. Large stationary fossil plants: a. 19 units selected for sampling in relation to PM&D data (request to be sent to Stanley Jaskot) and EPA CAM checks representing ~50% of total Entergy emissions, including:
Coal Units
• Big Cajun 2 – 2B3 • Independence 1 • Independence 2 • RS Nelson 6 • White Bluff 1 • White Bluff 2
Gas Units
• Acadia CT 4 • Baxter Wilson 1 • Baxter Wilson 2 • Gerald Andrus 1 • Lake Catherine 4 • Lewis Creek 1 • Lewis Creek 2 • Michoud 3 • Ninemile Point 4 • Ninemile Point 5 • Perryville Power Station 1-1
ICF International Page 39
Verification Report Entergy’s 2012 Corporate GHG Inventory
C1: True Up and Re-Performance Calculations
• Perryville Power Station 1-2 • RS Nelson 4
For the selected units ICF would like to receive the following unit-specific, reported data from a query of the PM&D database of historical data, for calendar year 2012:
• Fuel flow: MCF for gas or tons for coal • Heat input: MMbtu • Power generation: MW-hr • Average heat rate for aggregation period: Btu/kw-hr • Aggregation period for reporting totalized activity data on fuel
flow, heat input, and power generation on a monthly basis. b. CEMS reports – for the following coal-fired and gas-fired units– request made to Tad Chenet/Minh Nguyen at Fossil Environmental:
Coal
• Big Cajun 2 – 2B3 • Independence 1 • Independence 2 • RS Nelson 6 • White Bluff 1 • White Bluff 2
Gas
• Acadia CT4 • Baxter Wilson 1 • Baxter Wilson 2 • Gerald Andrus 1 • Lake Catherine 4 • Lewis Creek 1 • Lewis Creek 2 • Michoud 3 • Ninemile Point 4 • Ninemile Point 5 • Perryville Power Station 1-1 • Perryville Power Station 1-2 • RS Nelson 4
For each of the above CEMS-equipped gas or coal-fired units, ICF will request the following information for calendar year 2012:
• Gas flow meter accuracy test/CEMS gas flow transmitter calibration analysis (gas-fired units)
• CO2 and stack gas flow meter CEMS relative accuracy test audit (RATA) annual test results (coal-fired units)
• CO2 CEMS quarterly linearity checks (coal-fired units)
ICF International Page 40
Verification Report Entergy’s 2012 Corporate GHG Inventory
C1: True Up and Re-Performance Calculations
• CO2 quarterly electronic data report (EDRs) • ECPMS (emissions collection and monitoring plan system)
feedback reports: Q1 – Q4
For the on-site sampled coal and gas units, respectively, at White Bluff and Lake Catherine, ICF will request similar information as above from the respective plant managers / environmental managers on site, including hourly CO2 data for 2012 from the White Bluff on-site CEMS data acquisition and handling system (DAHS). 3. Small stationary plants – check “fossil fuel generating stations” emissions against EPA GHG Reporting Program data for 2011 . “Nuclear generating stations” and “other small plants” emissions are carryovers from 2005.
Sample Size All emissions sources and values for: - Purchased power, broken out by controllable trades and total
purchased power (to account for non-controllable trades). - Large stationary fossil plants. - Small stationary combustion (fossil generating plants only).
Materiality Threshold 10% of the GHG Assertion; qualitative errors will be reviewed on a case by case basis for materiality.
C2 – Minor/Negligible Emissions - Methodology and Documentation
Introduction: In order to ensure that all relevant emission sources are included in the GHG Assertion, it is necessary to confirm that any negligible emission sources have been appropriately excluded.
Type of Evidence Documentation, Discussions with Entergy’s Environmental Manager
Data Sources 2012 GHG Assertion, IMP
Objective (specific principles) Accuracy, Transparency
Specific Activities 1. Review minor/negligible sources and discuss with Entergy environmental manager
2. Compare to earlier year inventories (2009, 2010 and 2011)
Potential Error Conditions Material emission source(s) improperly excluded from GHG Assertion
Sample Unit N/A
Sample Size Minor/negligible emission categories and sources
Materiality Threshold Qualitative and quantitative errors will be reviewed on a case by case basis for materiality
ICF International Page 41
Verification Report Entergy’s 2012 Corporate GHG Inventory
Data Sources and Supporting Data
D1 – Data Collection and Quality Controls
Introduction: This procedure is intended to systematically review the Responsible Party’s internal procedures and controls that are used to calculate the GHG Assertion.
Type of Evidence Documentation, Confirmation, Observation, Inquiries of the Client, Analytical Procedures
Data Sources Data systems personnel, Operations personnel, Standard Operating Procedures and Manuals
Objective (specific principles) Completeness, Consistency, Accuracy, Transparency, Conservativeness
Specific Activities 1. Observe or interview operations personnel regarding the operation of data transfer systems, including manual data entry procedures and associated controls;
2. Review or interview operations personnel regarding on-site sampling, laboratory and other analytical procedures;
3. Compare original data sources to data in calculation systems for consistency.
4. Assess the conformance of the GHG information systems and controls with the verification criteria.
Error Conditions • Inconsistency between raw data and data supporting GHG Assertion
ICF International Page 42
Verification Report Entergy’s 2012 Corporate GHG Inventory
D2 – Data Confirmation against External Sources
Introduction: Where possible, this verification procedure is used to provide further evidence to the data used to calculate emissions and production quantities reported.
Type of Evidence Confirmation, Analytical Procedures
Data Sources Inventory Report and supporting external data/information: 1. Large fossil generating stations: a. PM&D data – monthly (all 12 months for 2012) b. CEMS data – ECMPS reports (for 19 gas and coal-fired units (representing ~73% of Entergy power generation direct emissions, and ~50% of total Entergy emissions), and EPA CAM emissions database query reports c. Gas and coal burn data – monthly for all gas units (all 12 months for 2012); two sets of select daily burn data for White Bluff and Independence plants, and one set of daily burn data for RS Nelson 6. d. All CEMS-related QA/QC documentation for White Bluff and Lake Catherine units, and hourly CO2 data for White Bluff units; 2. Small stationary combustion sources – 2011 (or later) EPA GHG Reporting Program data submitted for all fossil generating stations – annual. 3. Purchased power: In addition to expected data from TRADES (hourly controllable purchased power for all of 2012) and from Generation Fuels and Accounting (monthly purchased power totals), ICF will request the following as an external check:
• ISB (Intra-system billing) – Purchased power data will be sent by Charles John.
In addition, the following non-critical data will be requested and obtained for exploratory checks and knowledge enhancement for both GHG data comparison purposes as well as for information systems:
• TRADES – a subset of non-controllables power purchases data from 1/1/2012 to 12/31/2012 inclusive via Excel to ICF by Grady Kaough (via Rick Johnson).
• SOC – a subset of power purchases data from 1/1/2012 to 12/31/2012 inclusive via Excel to ICF by Cameron Warren (via Rick Johnson).
Objective (specific principles) Accuracy, Conservativeness
Specific Activities 1. Review use of external data sources in GHG inventory for appropriateness; 2. Compare reported/metered values to those provided by secondary sources
ICF International Page 43
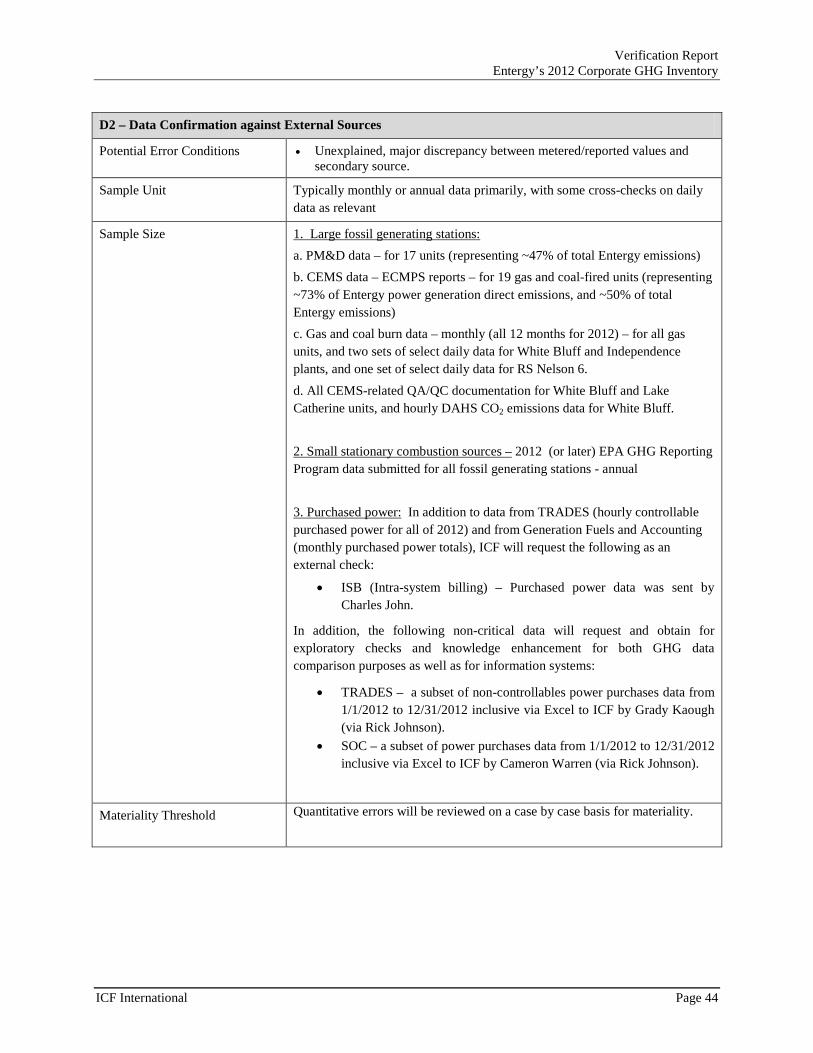
Verification Report Entergy’s 2012 Corporate GHG Inventory
D2 – Data Confirmation against External Sources
Potential Error Conditions • Unexplained, major discrepancy between metered/reported values and secondary source.
Sample Unit Typically monthly or annual data primarily, with some cross-checks on daily data as relevant
Sample Size 1. Large fossil generating stations: a. PM&D data – for 17 units (representing ~47% of total Entergy emissions) b. CEMS data – ECMPS reports – for 19 gas and coal-fired units (representing ~73% of Entergy power generation direct emissions, and ~50% of total Entergy emissions) c. Gas and coal burn data – monthly (all 12 months for 2012) – for all gas units, and two sets of select daily data for White Bluff and Independence plants, and one set of select daily data for RS Nelson 6. d. All CEMS-related QA/QC documentation for White Bluff and Lake Catherine units, and hourly DAHS CO2 emissions data for White Bluff. 2. Small stationary combustion sources – 2012 (or later) EPA GHG Reporting Program data submitted for all fossil generating stations - annual 3. Purchased power: In addition to data from TRADES (hourly controllable purchased power for all of 2012) and from Generation Fuels and Accounting (monthly purchased power totals), ICF will request the following as an external check:
• ISB (Intra-system billing) – Purchased power data was sent by Charles John.
In addition, the following non-critical data will request and obtain for exploratory checks and knowledge enhancement for both GHG data comparison purposes as well as for information systems:
• TRADES – a subset of non-controllables power purchases data from 1/1/2012 to 12/31/2012 inclusive via Excel to ICF by Grady Kaough (via Rick Johnson).
• SOC – a subset of power purchases data from 1/1/2012 to 12/31/2012 inclusive via Excel to ICF by Cameron Warren (via Rick Johnson).
Materiality Threshold Quantitative errors will be reviewed on a case by case basis for materiality.
ICF International Page 44
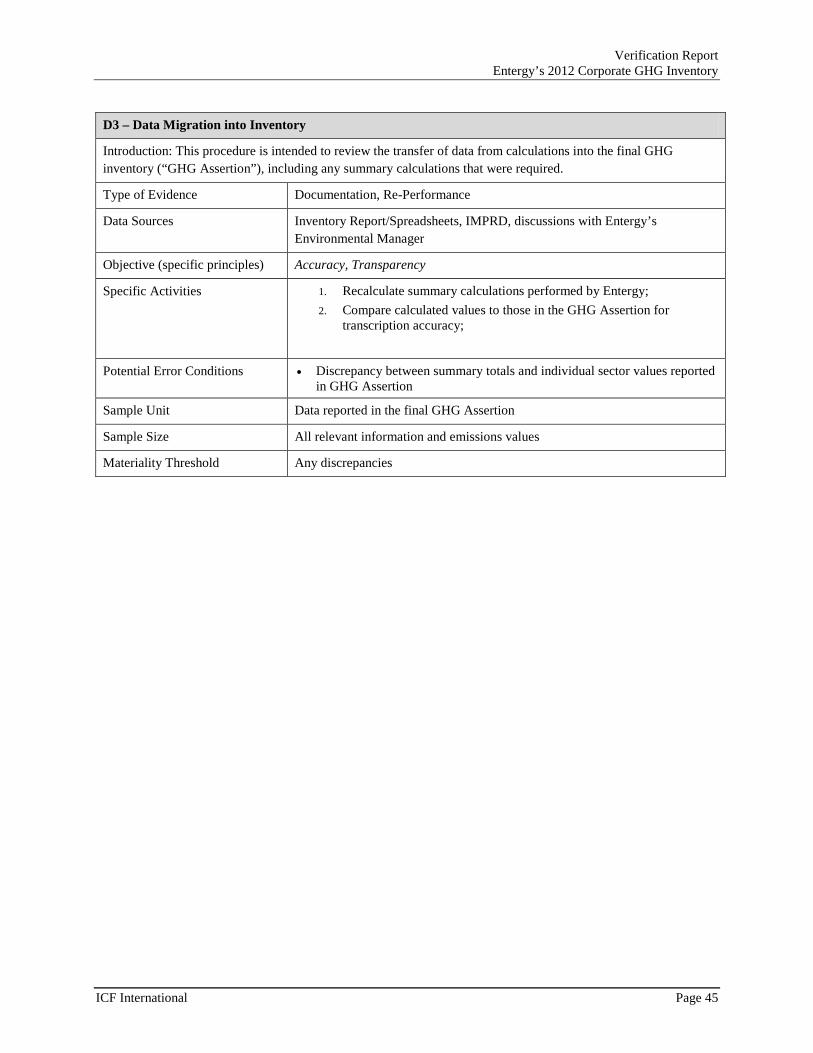
Verification Report Entergy’s 2012 Corporate GHG Inventory
D3 – Data Migration into Inventory
Introduction: This procedure is intended to review the transfer of data from calculations into the final GHG inventory (“GHG Assertion”), including any summary calculations that were required.
Type of Evidence Documentation, Re-Performance
Data Sources Inventory Report/Spreadsheets, IMPRD, discussions with Entergy’s Environmental Manager
Objective (specific principles) Accuracy, Transparency
Specific Activities 1. Recalculate summary calculations performed by Entergy; 2. Compare calculated values to those in the GHG Assertion for
transcription accuracy;
Potential Error Conditions • Discrepancy between summary totals and individual sector values reported in GHG Assertion
Sample Unit Data reported in the final GHG Assertion
Sample Size All relevant information and emissions values
Materiality Threshold Any discrepancies
ICF International Page 45
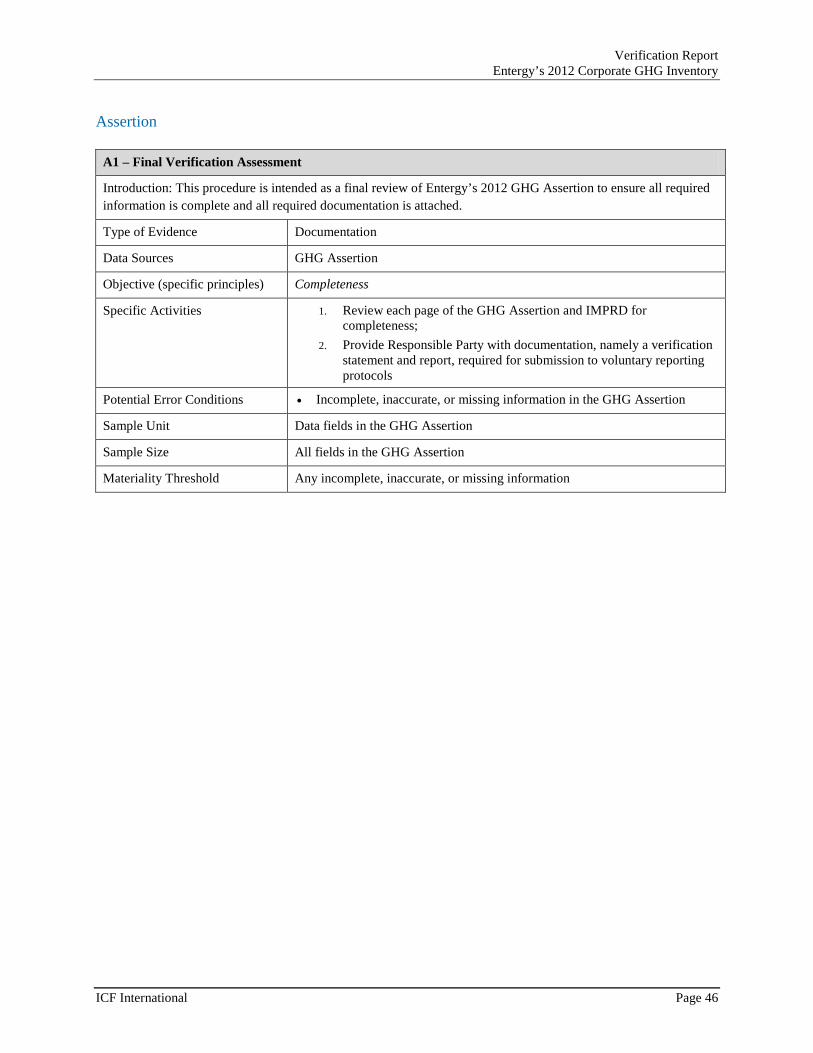
Verification Report Entergy’s 2012 Corporate GHG Inventory
Assertion
A1 – Final Verification Assessment
Introduction: This procedure is intended as a final review of Entergy’s 2012 GHG Assertion to ensure all required information is complete and all required documentation is attached.
Type of Evidence Documentation
Data Sources GHG Assertion
Objective (specific principles) Completeness
Specific Activities 1. Review each page of the GHG Assertion and IMPRD for completeness;
2. Provide Responsible Party with documentation, namely a verification statement and report, required for submission to voluntary reporting protocols
Potential Error Conditions • Incomplete, inaccurate, or missing information in the GHG Assertion
Sample Unit Data fields in the GHG Assertion
Sample Size All fields in the GHG Assertion
Materiality Threshold Any incomplete, inaccurate, or missing information
ICF International Page 46

Attachment 4
IMPRD Revision Log
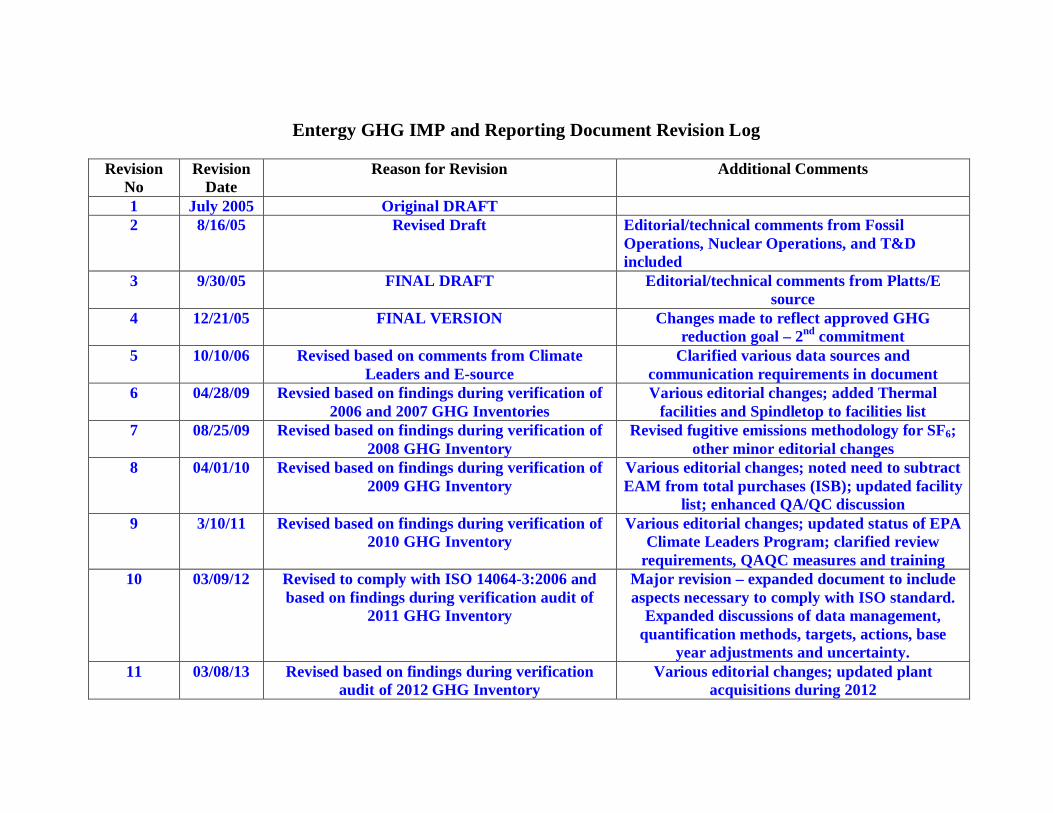
Entergy GHG IMP and Reporting Document Revision Log
RevisionNo
RevisionDate
Reason for Revision Additional Comments
1 July 2005 Original DRAFT2 8/16/05 Revised Draft Editorial/technical comments from Fossil
Operations, Nuclear Operations, and T&Dincluded
3 9/30/05 FINAL DRAFT Editorial/technical comments from Platts/Esource
4 12/21/05 FINAL VERSION Changes made to reflect approved GHGreduction goal – 2nd commitment
5 10/10/06 Revised based on comments from ClimateLeaders and E-source
Clarified various data sources andcommunication requirements in document
6 04/28/09 Revsied based on findings during verification of2006 and 2007 GHG Inventories
Various editorial changes; added Thermalfacilities and Spindletop to facilities list
7 08/25/09 Revised based on findings during verification of2008 GHG Inventory
Revised fugitive emissions methodology for SF6;other minor editorial changes
8 04/01/10 Revised based on findings during verification of2009 GHG Inventory
Various editorial changes; noted need to subtractEAM from total purchases (ISB); updated facility
list; enhanced QA/QC discussion9 3/10/11 Revised based on findings during verification of
2010 GHG InventoryVarious editorial changes; updated status of EPA
Climate Leaders Program; clarified reviewrequirements, QAQC measures and training
10 03/09/12 Revised to comply with ISO 14064-3:2006 andbased on findings during verification audit of
2011 GHG Inventory
Major revision – expanded document to includeaspects necessary to comply with ISO standard.
Expanded discussions of data management,quantification methods, targets, actions, base
year adjustments and uncertainty.11 03/08/13 Revised based on findings during verification
audit of 2012 GHG InventoryVarious editorial changes; updated plant
acquisitions during 2012