Thailand's National Greenhouse Gas Inventory 1994
118
Transcript of Thailand's National Greenhouse Gas Inventory 1994

Thailand’s National Greenhouse Gas Inventory 1994
Available from International Environmental Affairs DivisionOffice of Environmental Policy and Planning (OEPP)Ministry of Science, Technology and Environment60/1 Soi Phibul Wattana 7, Rama VI Rd., Bangkok 10400,THAILANDTelephone (662) 2714322, 2986054Facsimile (662) 2714322, 2986054www.oepp.go.th
Copyright 2000, Office of Environmental Policy and Planning
Citation Office of Environmental Policy and Planning. 2000.Thailand’s National Greenhouse Gas Inventory 1994.Ministry of Science, Technology and Environment. Bangkok,Thailand. 118 p.
Printing December 2000
Advisors: Dr. Saksit TridechDr. Wanee SamphantharakMs. Orapin WongchumpitMr. Surin Vivajsirin
Technical Co-ordinators: Dr. Srisuda JarayabhandMs. Wilailak Suraphruk
Technical Support: Center for Applied Economic Research,Faculty of Economics, Kasetsart University
Reviewers: Mr. Suphavit Piampongsant
Editors: Mr. Camilo Lim
Designed & printed by Integrated Promotion Technology Co., Ltd.Telephone (662) 5852076, 5860837, 9137761-2
Thailand’s National Greenhouse Gas Inventory 1994
RESEARCHERTeam Leader Asst. Prof. Dr. Vute WangwacharakulEnergy Asst. Prof. Dr. Pojanie KhummongkolAgriculture and soil Asst. Prof. Dr. Pimpan JermsawatdipongLivestock Assoc. Prof. Dr. Pravee VijchulataForestry Asst. Prof. Dr. Ladawan PuangchitWaste Assoc. Prof. Dr.Sirintornthep Towprayoon
REVIEWERSEnergy Dr. Supachart Chungpaibulpatana
Sirindhorn International Institute of Technology, Thamasart UniversityProf. Dr.Somchart Soponronarit
Kingmongkut University of Technology ThonburiMr. Viraphol Jirapraditkul
National Energy Policy OfficeMs. Sirinthorn Vongsoasup
Department of Energy Development and PromotionDr. Prasert Sinsukprasert
Department of Energy Development and Promotion
Agriculture and soil Dr. Pornpimol ChaiwanakuptDepartment of Agriculture
Dr. Prapai ChairojDepartment of Agriculture
Dr. Chawalit HongprayoonKasetsart University
Dr. Pichit PongsakulDepartment of Agriculture
Livestock Mr. Tawatchai IndratulaDepartment of Livestock Development
Assoc. Prof. Dr. Somchai ChantsavangKasetsart University
Prof. Dr. Chanvit VajrabukkaKasetsart University
Forestry Dr. Bunvong ThaiutsaKasetsart University
Dr. Jesada LuangjamRoyal Forest Department
Mr. Boonchoob BoontaweeRoyal Forest Department
Dr. Suwit OngsomwangRoyal Forest Department
Ms. Doojduan SasanavinOffice of the Permanent Secretary, Ministry of Agriculture and Cooperatives
Waste Ms. Wanna RodratanaDepartment of Industrial Works
Mr. Adisak ThongkaimookPollution Control Department
Mr. Chungtong OpassiriwitBangkok Metropolitan Administration
Mr. Kitti KumpeeraKenan Institute Asia
Thailand’s National Greenhouse Gas Inventory 1994
TABLE OF CONTENTPage
Table of Content .................................................................................................................................................................................................................................................................................................................................. 5List of Table ............................................................................................................................................................................................................................................................................................................................................... 6List of Figure ........................................................................................................................................................................................................................................................................................................................................... 9List of Units & Abbreviations .................................................................................................................................................................................................................................................................................. 10
Summary ................................................................................................................................................................................................................................................................................................................................................ 13
Chapter 1 Energy Sector ............................................................................................................................................................................................................................................................................. 19Introduction ............................................................................................................................................................................................................................................................................................. 20Methodology .......................................................................................................................................................................................................................................................................................... 24Data ...................................................................................................................................................................................................................................................................................................................... 32Results ............................................................................................................................................................................................................................................................................................................. 33
Chapter 2 Industrial Process Sector .................................................................................................................................................................................................................................. 41Introduction ............................................................................................................................................................................................................................................................................................. 42Methodology .......................................................................................................................................................................................................................................................................................... 42Data ...................................................................................................................................................................................................................................................................................................................... 44Results ............................................................................................................................................................................................................................................................................................................. 45
Chapter 3 Agriculture Sector: Rice ....................................................................................................................................................................................................................................... 49Introduction ............................................................................................................................................................................................................................................................................................. 50Methodology .......................................................................................................................................................................................................................................................................................... 50Data ...................................................................................................................................................................................................................................................................................................................... 51Results ............................................................................................................................................................................................................................................................................................................. 52Appendix ..................................................................................................................................................................................................................................................................................................... 56
Chapter 4 Agriculture Sector: Livestock ................................................................................................................................................................................................................... 61Introduction ............................................................................................................................................................................................................................................................................................. 62Methodology .......................................................................................................................................................................................................................................................................................... 62Data ...................................................................................................................................................................................................................................................................................................................... 63Results ............................................................................................................................................................................................................................................................................................................. 67Appendix ..................................................................................................................................................................................................................................................................................................... 71
Chapter 5 Agriculture Sector: Agricultural Soil ......................................................................................................................................................................................... 73Introduction ............................................................................................................................................................................................................................................................................................. 74Methodology .......................................................................................................................................................................................................................................................................................... 74Data ...................................................................................................................................................................................................................................................................................................................... 75Results ............................................................................................................................................................................................................................................................................................................. 80
Chapter 6 Forestry Sector ........................................................................................................................................................................................................................................................................ 83Introduction ............................................................................................................................................................................................................................................................................................. 84Methodology .......................................................................................................................................................................................................................................................................................... 85Data ...................................................................................................................................................................................................................................................................................................................... 85Results ............................................................................................................................................................................................................................................................................................................. 90Appendix ..................................................................................................................................................................................................................................................................................................... 94
Chapter 7 Waste Sector ............................................................................................................................................................................................................................................................................. 107Introduction ......................................................................................................................................................................................................................................................................................... 108Methodology ...................................................................................................................................................................................................................................................................................... 108Data .................................................................................................................................................................................................................................................................................................................. 110Results ......................................................................................................................................................................................................................................................................................................... 112Appendix ................................................................................................................................................................................................................................................................................................. 115
Thailand’s National Greenhouse Gas Inventory 1994
LIST OF TABLEPage
Summary
Table I Thailand’s National Greenhouse Gas Inventory, 1994 (Gg) ................................................................................................................................. 15
Table II Emissions of the Three Main Greenhouse Gases of Thailand, 1994 .................................................................................................... 15
Chapter 1
Table 1.1 Emission Factor to Convert Energy Consumed from Physical Units intothe International Standard Energy Unit, Classified by Fuel Type .............................................................................................................. 25
Table 1.2 Carbon and Carbon Dioxide Emission Factors, by Fuel Type ......................................................................................................................... 26
Table 1.3 Methane Emission Factors ........................................................................................................................................................................................................................................... 27
Table 1.4 Oxides of Nitrogen Emission Factors ....................................................................................................................................................................................................... 28
Table 1.5 Nitrous Oxide Emission Factors ........................................................................................................................................................................................................................ 29
Table 1.6 Carbon Monoxide Emission Factors ............................................................................................................................................................................................................ 30
Table 1.7 Non-methane Volatile Organic Carbon (NMVOC) Emission Factors ................................................................................................... 31
Table 1.8 Energy Consumption, by Fuel Type, 1994 ....................................................................................................................................................................................... 32
Table 1.9 Energy Consumption, by Sector, 1994 .................................................................................................................................................................................................... 33
Table 1.10 CO2 Emissions from Fuel Combustion, by Fuel Type, 1994 ............................................................................................................................. 34
Table 1.11 Non-CO2 Emission from Fuel Combustion, by Sector, 1994 ............................................................................................................................. 35
Table 1.12 Methane Emission Factors for Crude Oil and Natural Gas .................................................................................................................................. 37
Table 1.13 Coal, Oil and Natural Gas Production Activities, 1994 .............................................................................................................................................. 37
Table 1.14 Methane Emissions from Fossil Fuel Production Activities, 1994 ............................................................................................................ 38
Chapter 2
Table 2.1 A List of Industrial Processes Evaluated for GHG Emissions ......................................................................................................................... 42
Table 2.2 Cement, Glass, Lime, Paper Pulp, Iron and Steel Production, 1994 ..................................................................................................... 45
Table 2.3 Production of Bread, Beer, Wine and Whisky in Thailand, 1994 .............................................................................................................. 45
Table 2.4 Emissions of CO2 from Cement, Glass, Paper Pulp, Iron and Steel ManufacturingProcesses, 1994 .............................................................................................................................................................................................................................................................................. 46
Table 2.5 Emissions of CH4 and NMVOC from Glass and Petrochemical Industrial Processes, 1994 ......................... 46
Table 2.6 Emissions of NMVOC from Fermentation Processes, 1994 ................................................................................................................................ 46
Chapter 3
Table 3.1 Measured Methane Emissions in kg CH4/ha/day from Various Rice Cultivation Areas,with and without Soil Amendments ............................................................................................................................................................................................................. 51
Table 3.2 Methane Emission Factors for Different Water Ecosystem and Organic Amendment .............................................. 52
Table 3.3 Methane Emission from Paddy Fields in Thailand (Estimates Based on 1996 IPCCScaling Factors for Rice Ecosystem and Correction Factors for Organic Amendmentand Country Emission Data) .................................................................................................................................................................................................................................... 53
Table 3.4 Methane Emission from Paddy Fields in Thailand (Estimates Based onLocally Measured Methane Emission Factors) .......................................................................................................................................................................... 53
Table A3.1 Projections of Rice Production and Cultivation Area Based on Local Demandand Exports, 1994-2020 ................................................................................................................................................................................................................................................... 56
Table A3.2 Irrigated Rice Cultivation Area for Major Rice Classified by the Royal IrrigationDepartment ............................................................................................................................................................................................................................................................................................. 59
Table A3.3 Projections of Methane Emission from Paddy Fields with Mitigation Options (Tg) ................................................. 59
Greenhouse Gas Emission Inventory 7
Page
Chapter 4
Table 4.1 Number of Livestock in Thailand, 1994 .............................................................................................................................................................................................. 63
Table 4.2 Methods Used to Estimate Methane Emissions from Various Animal Types ......................................................................... 63
Table 4.3 Methane Producing Capacities (Bo) of Manure from Livestock ................................................................................................................... 65
Table 4.4 Methane Conversion Factors for Different Manure Management Systemsand the Proportion of Manure Handling Systems Used for Various Animals ........................................................................ 66
Table 4.5 Methane Conversion Factors (MCF x MS) for the Manure of Various Animals ............................................................. 66
Table 4.6 Nitrous Oxide Emission Factors (EF) and Percentage of Different ManureManagement Systems used for Various Animals .................................................................................................................................................................... 67
Table 4.7 Estimated Nitrogen Excretion from Animals (Next) and Waste Management (Nexawms) ........................................ 67
Table 4.8 Methane and Nitrous Oxide Emission from Livestock, 1994 ........................................................................................................................... 68
Table A4.1 Percentage of Large Ruminant Population Scheduled for Feed Improvementand Feed Additive Extension Program, 1995-2020 ............................................................................................................................................................ 72
Table A4.2 Schedule of Manure System Modification for Fecal Methane and NitrousOxide Emission Mitigation from Swine, 1995-2020 ........................................................................................................................................................ 72
Chapter 5
Table 5.1 Nitrogen Produced From Synthetic Nitrogen Fertilizer Application, 1994 .................................................................................. 75
Table 5.2 Animal Population of Thailand, 1994 ....................................................................................................................................................................................................... 76
Table 5.3 Nitrogen Entering Agricultural Soils from Animal Manure, Estimated usingRevised IPCC Methodology ...................................................................................................................................................................................................................................... 76
Table 5.4 Nitrogen Entering Agricultural Soils from Crop Residues, Estimated usingIPCC Methodology .................................................................................................................................................................................................................................................................. 77
Table 5.5 Nitrogen Entering Agricultural Soils, Estimated using Country Information ........................................................................... 77
Table 5.6 Nitrogen Input into Soils from Nitrogen-fixing Crops Estimated using IPCCMethodology and Country Information .................................................................................................................................................................................................. 78
Table 5.7 Nitrogen Entering into Agricultural Soils from Compost ......................................................................................................................................... 78
Table 5.8 Nitrogen Excretion from Grazing Animal .......................................................................................................................................................................................... 79
Table 5.9 Nitrous Oxide Emission Derived from NH3 and NOx Volatilization fromSynthetic Fertilizer and Animal Manure ............................................................................................................................................................................................... 79
Table 5.10 Estimated Nitrous Oxide Derived from Leached/Runoff Nitrogen ........................................................................................................... 80
Table 5.11 Nitrous Oxide Emissions from Direct Sources .......................................................................................................................................................................... 80
Table 5.12 Indirect N2O Emission from Atmospheric Deposition of Volatile SyntheticNitrogen Fertilizer and Animal Manure and Leached Soil Nitrogen ..................................................................................................... 81
Table 5.13 Total Emission of N2O from Agricultural Soils, 1994 .................................................................................................................................................. 81
Chapter 6
Table 6.1 Total Reforestation Area in Thailand ......................................................................................................................................................................................................... 86
Table 6.2 Annual Growth Rate of Plantation Species in Thailand ............................................................................................................................................. 86
Table 6.3 Forest Area in Thailand, 1985-1995 ............................................................................................................................................................................................................ 87
Table 6.4 Forest Area, by Type, 1982 ....................................................................................................................................................................................................................................... 88
Table 6.5 Estimated Forest Area, by Forest Type, in Thailand (1993-1995) andthe Average Annual Change ...................................................................................................................................................................................................................................... 88
Table 6.6 Values of Aboveground and Stem Wood Biomass and Carbon Content ofDry Biomass, by Various Forest Types .................................................................................................................................................................................................. 89
Table 6.7 Non-CO2 Trace Gas Emission Ratios for Open Burning .......................................................................................................................................... 89
Table 6.8 Estimated Annual Rate of Aboveground Biomass Regrowth in Abandoned Land,by Forest Type ................................................................................................................................................................................................................................................................................. 91
Thailand’s National Greenhouse Gas Inventory 19948
Page
Table 6.9 Estimates of Carbon and Carbon Dioxide Emission and Sequestration from Forests, 1994 .......................... 91
Table 6.10 Comparison of Carbon Dioxide Emission and Sequestration from Forests, 1990 and 1994 ......................... 91
Table 6.11 Comparison of Non-CO2 Trace Gases Emission from Forest Clearing, 1990 and 1994 ...................................... 92
Table A6.1 Calculation Worksheet on Changes in Forest and Other Woody Biomass Submodule ........................................... 94
Table A6.2 Calculation Worksheet on Forest Conversion Submodule ....................................................................................................................................... 97
Table A6.3 Calculation Worksheet of non-CO2 trace gas from burning biomass onForest Conversion Submodule ........................................................................................................................................................................................................................... 102
Table A6.4 Calculation Worksheet on Abandonment of Managed Lands Submodule ................................................................................. 103
Chapter 7
Table 7.1 Number of SWDS and Amount of Wastes by Disposal Types, 1994 .............................................................................................. 110
Table 7.2 Estimates of Methane Emissions from Land Disposal, 1994 ......................................................................................................................... 112
Table 7.3 Estimates of Methane Emissions from Domestic Wastewater Handling, 1990 and 1994 ............................... 113
Table A7.1 Electricity Generation Potentials from Waste, by Region and Province ...................................................................................... 117
Table A7.2 Estimates of Methane Emissions from Domestic Wastewater, 1990-2010 ............................................................................... 117
LIST OF FIGUREPage
Chapter 1
Figure 1.1 Consumption of Primary Energy in Thailand, by Source, 1990-1998 .............................................................................................. 20
Figure 1.2 Energy Production, 1994-1997 ........................................................................................................................................................................................................................... 22
Figure 1.3 Energy Imports, by Type of Fuel, 1994 ............................................................................................................................................................................................. 23
Figure 1.4 Fossil Energy Consumption, Classified by Economic Sectors, 1994-1997 ............................................................................... 23
Figure 1.5 Carbon Dioxide Emissions, by Fuel Type, 1994-1997 ............................................................................................................................................... 34
Figure 1.6 Carbon Dioxide Emissions, by Economic Sector, 1994 ........................................................................................................................................... 35
Figure 1.7 Emissions of Non-CO2, 1994-1997 ............................................................................................................................................................................................................. 36
Figure 1.8 Fugitive Emission from Coal, Oil, and Gas Production Activities, 1994-1997 ................................................................. 38
Chapter 4
Figure 4.1 Contribution of Certain Livestock on Enteric Methane Emission, 1994 ...................................................................................... 69
Figure 4.2 Contribution of Certain Livestock on Manure Nitrous Oxide Emission, 1994 .................................................................. 69
Figure 4.3 Contribution of Certain Livestock on Manure Methane Emission, 1994 ..................................................................................... 69
Chapter 7
Figure 7.1 Comparison of Methane Emissions Using Two Different Methods .................................................................................................. 112
Figure A7.1 Proposed Landfill Sites for Electricity Generation, by Region ................................................................................................................ 116
Thailand’s National Greenhouse Gas Inventory 1994
Thailand’s National Greenhouse Gas Inventory 199410
LIST OF UNITS & ABBREVIATIONS
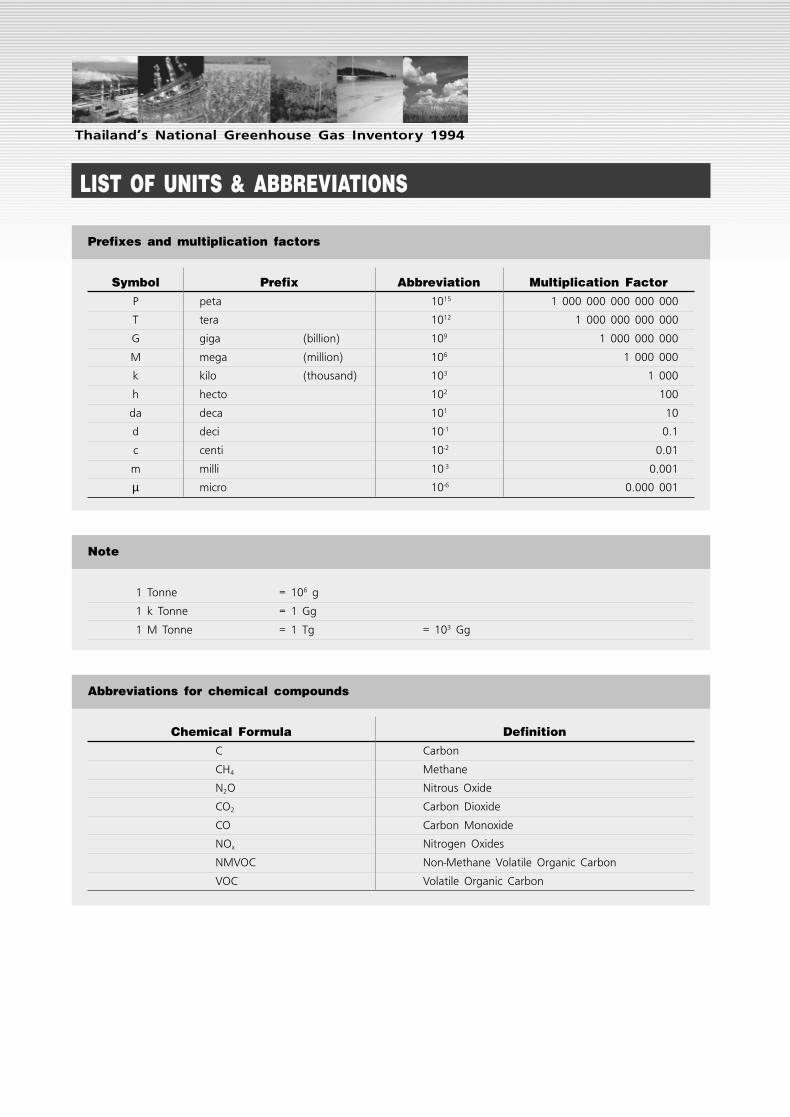
Symbol Prefix Abbreviation Multiplication Factor
P peta 1015 1 000 000 000 000 000
T tera 1012 1 000 000 000 000
G giga (billion) 109 1 000 000 000
M mega (million) 106 1 000 000
k kilo (thousand) 103 1 000
h hecto 102 100
da deca 101 10
d deci 10-1 0.1
c centi 10-2 0.01
m milli 10-3 0.001
µ micro 10-6 0.000 001
Prefixes and multiplication factors
1 Tonne = 106 g
1 k Tonne = 1 Gg
1 M Tonne = 1 Tg = 103 Gg
Note
Chemical Formula Definition
C Carbon
CH4 Methane
N2O Nitrous Oxide
CO2 Carbon Dioxide
CO Carbon Monoxide
NOx Nitrogen Oxides
NMVOC Non-Methane Volatile Organic Carbon
VOC Volatile Organic Carbon
Abbreviations for chemical compounds
Thailand’s National Greenhouse Gas Inventory 1994
Greenhouse Gas Emission Inventory 11
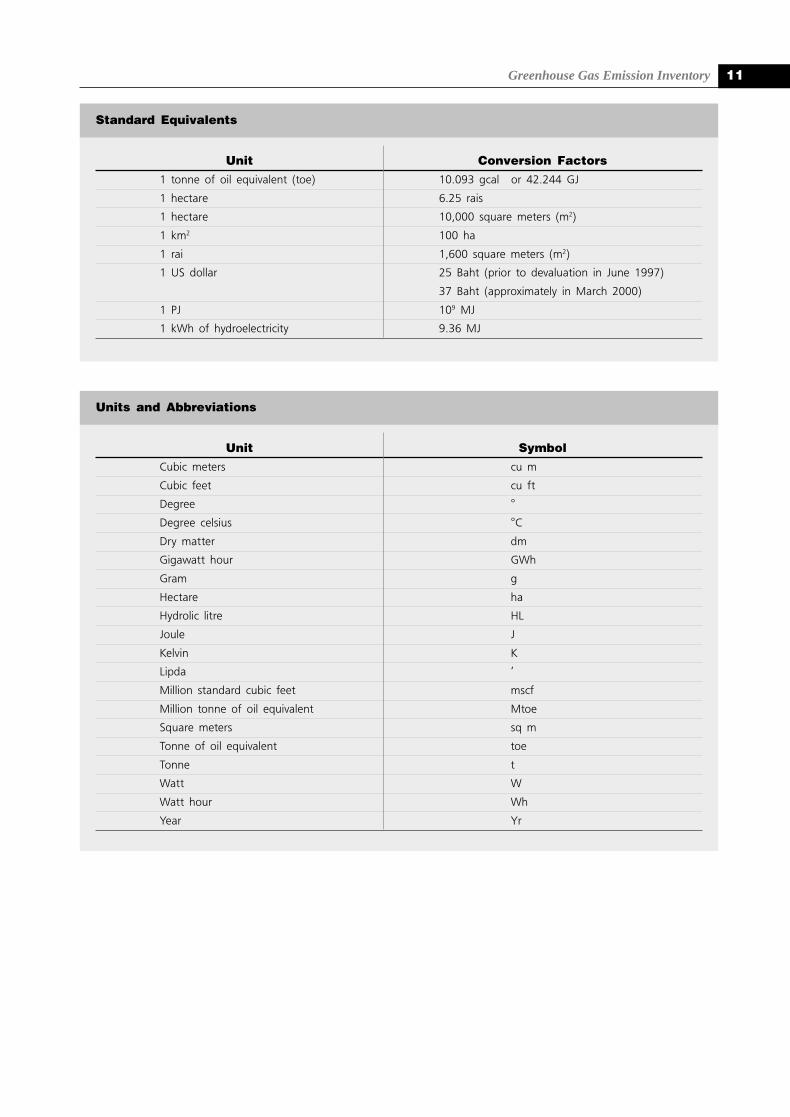
Unit Conversion Factors
1 tonne of oil equivalent (toe) 10.093 gcal or 42.244 GJ
1 hectare 6.25 rais
1 hectare 10,000 square meters (m2)
1 km2 100 ha
1 rai 1,600 square meters (m2)
1 US dollar 25 Baht (prior to devaluation in June 1997)
37 Baht (approximately in March 2000)
1 PJ 109 MJ
1 kWh of hydroelectricity 9.36 MJ
Standard Equivalents
Unit Symbol
Cubic meters cu m
Cubic feet cu ft
Degree °
Degree celsius °C
Dry matter dm
Gigawatt hour GWh
Gram g
Hectare ha
Hydrolic litre HL
Joule J
Kelvin K
Lipda ’
Million standard cubic feet mscf
Million tonne of oil equivalent Mtoe
Square meters sq m
Tonne of oil equivalent toe
Tonne t
Watt W
Watt hour Wh
Year Yr
Units and Abbreviations
Thailand’s National Greenhouse Gas Inventory 199412
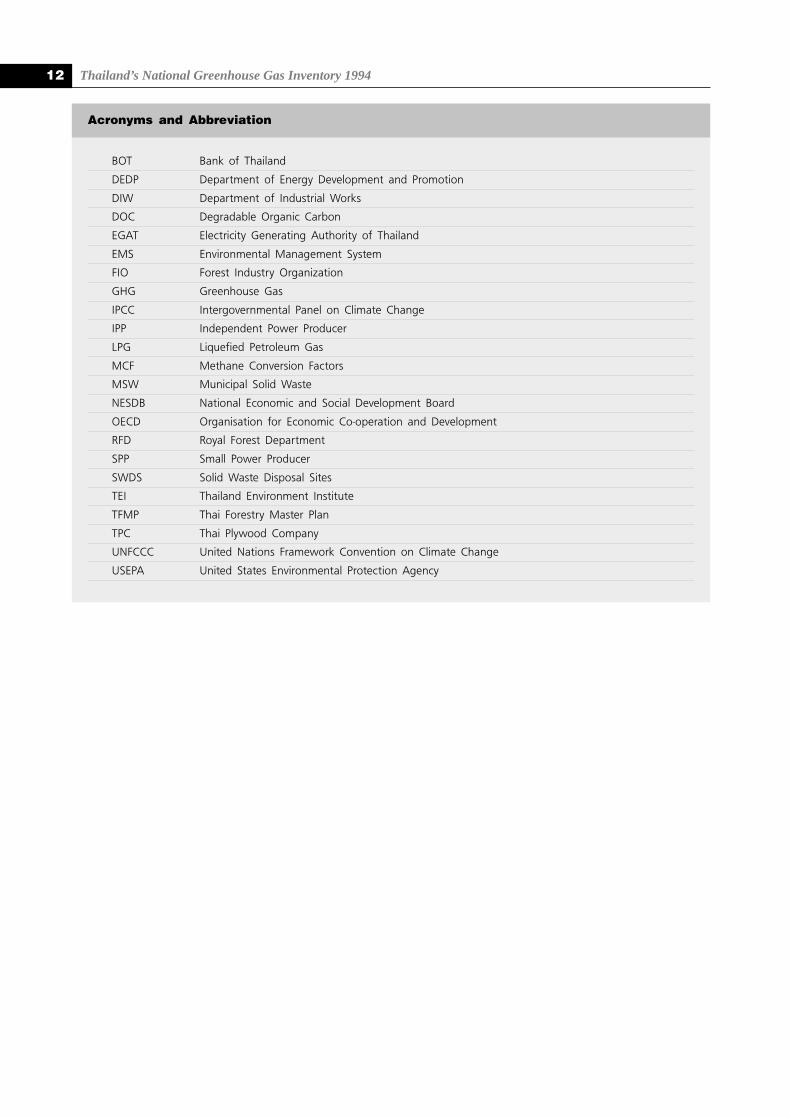
BOT Bank of Thailand
DEDP Department of Energy Development and Promotion
DIW Department of Industrial Works
DOC Degradable Organic Carbon
EGAT Electricity Generating Authority of Thailand
EMS Environmental Management System
FIO Forest Industry Organization
GHG Greenhouse Gas
IPCC Intergovernmental Panel on Climate Change
IPP Independent Power Producer
LPG Liquefied Petroleum Gas
MCF Methane Conversion Factors
MSW Municipal Solid Waste
NESDB National Economic and Social Development Board
OECD Organisation for Economic Co-operation and Development
RFD Royal Forest Department
SPP Small Power Producer
SWDS Solid Waste Disposal Sites
TEI Thailand Environment Institute
TFMP Thai Forestry Master Plan
TPC Thai Plywood Company
UNFCCC United Nations Framework Convention on Climate Change
USEPA United States Environmental Protection Agency
Acronyms and Abbreviation
SUMMARY
Thailand’s National Greenhouse Gas Inventory 199414
Thailand’s National Greenhouse Gas Inventory 1994
SUMMARYThe 1994 national inventory of greenhouse gases
(GHGs) represents the second official inventory of GHGsin Thailand. The first official GHG inventory for the year1990 was prepared in 1997. The 1994 inventory is theresult of the recent studies conducted by researchers fromvarious research and academic institutes. In estimatingthe 1994 GHG inventory, the researchers used the 1996IPCC Revised Guidelines for National Greenhouse GasInventories (IPCC, 1997). To the extent possible, theresearchers used local activity data to substitute for thedefault data recommended by the IPCC, thus making thelatest estimates more accurate and relevant to Thailand.
Still, many gaps in knowledge exist. These suggestthat continued research be undertaken to generatescientific and technical information that is suitable to localconditions and circumstances. Basic research, fieldobservations and testing are needed to improve the qualityof the data, to reduce uncertainties, and to enhance theunderstanding of the relationship of these emissions withproductive activities in order to help determine the needsand limitations of reducing them.
1994 National GHG Emission
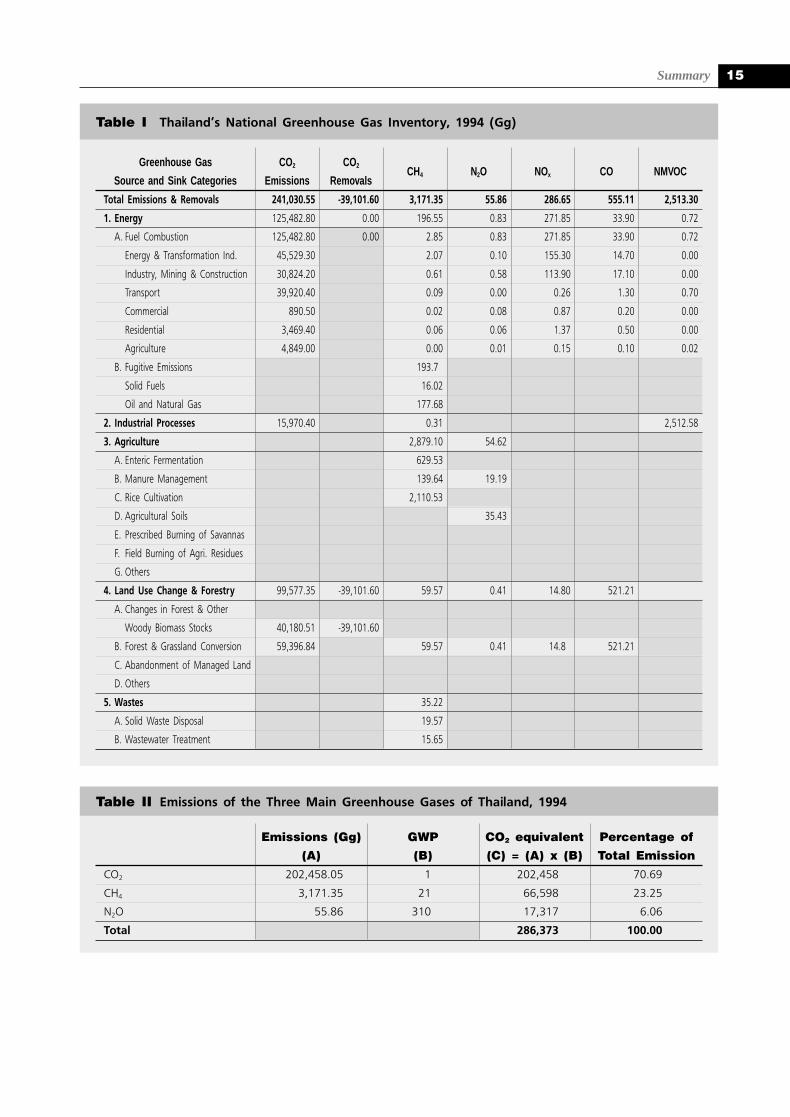
The national inventory of GHGs for 1994 ispresented on Table I below. Gross emissions of carbondioxide (CO2), the main greenhouse gas, amounted toabout 241 Teragrams (Tg) in 1994. Due to carbonsequestration from reforestation activities and the re-growth of natural vegetation on abandoned lands,however, net CO2 emissions were estimated at 202 Tg.
Unlike previous GHG inventories, the amount of CO2
emissions from forestry and land use changes has declinedcompared with emissions from energy activities. Energycombustion and fugitive emissions was the largest sourceof CO2 emissions, accounting for about 52 percent ofgross emissions of CO2 in 1994. Industrial process alsoemitted a small amount of 16 Tg of CO2 in 1994. Severalfactors have contributed to the slowdown in emissionsfrom forestry and land use changes. These include theimposition of the logging ban since 1989 and increasedreforestation and commercial plantation activities. At thesame time, the reforestation and plantation activities haveraised the amount of carbon removals from theatmosphere.
Total CH4 emissions in Thailand were estimated at3,157 Gg in 1994. About 2,866 Gg or 91 percent of theemissions were from agriculture. Land use change andforestry sector activities emitted about 60 Gg of CH4,while solid waste disposal and wastewater treatmentgenerated about 35 Gg. Thailand also producedapproximately 56 Gg of N2O in 1994, almost all of whichcame from agriculture. Other minor sources were energysupply sector, land use change and forestry.
Other GHG emissions estimated for 1994 were NOx,CO and NMVOC. The emissions were 287 Gg, 555 Ggand 2,513 Gg, respectively. The energy sector was themain source of NOx emissions (89 percent) whileindustrial process was almost the only source of NMVOC.Land use changes and forestry were the main COemitters.
In terms of GWP, in 1994, Thailand emitted GHGsapproximately 286 Tg of CO2 equivalent. CO2 contributedmore than 71 percent while CH4 emitted about 23 percentand N2O constituted about 6 percent of the total. Theamount was marginal, compared to the World total (TableII).
Energy Sector
The energy sector was the largest source of CO2
emissions in Thailand in 1994, accounting for more thanhalf of total national CO2 emissions. It was also thelargest source of CO and NOx and the main source offugitive CH4 emissions.
Combustion of fuels was the main CO2 emitter inenergy sector accounted to 125,483 Gg in 1994. As thelargest consumer of fuel, the energy supply sector (mainlypower plants) emitted the largest share of CO2 (36percent), followed by the transport sector (32 percent)and the industry and construction sector (25 percent).When combined, these three sectors emitted more than90 percent of CO2 emissions and at least 97 percent ofNOx.
There were also GHGs emitted from coal mining andoil and natural gas drilling as well as from varioustransmission, storage and distribution systems. CO2 andgases that have low molecular weights such as CH4 andvolatile organic carbon (VOC) are released during theprocess of mining, extraction and other post-miningactivities, but only CH4 emissions are estimated in thisreport. Nonetheless, the estimates suffer from the lack ofreliable emission factors that take into consideration thestratum and depth of deposits and the quality andcharacteristics of the fuels.
Summary 15
Table I Thailand’s National Greenhouse Gas Inventory, 1994 (Gg)
Table II Emissions of the Three Main Greenhouse Gases of Thailand, 1994
Greenhouse Gas CO2 CO2CH4 N2O NOx CO NMVOC
Source and Sink Categories Emissions Removals
Total Emissions & Removals 241,030.55 -39,101.60 3,171.35 55.86 286.65 555.11 2,513.30
1. Energy 125,482.80 0.00 196.55 0.83 271.85 33.90 0.72
A. Fuel Combustion 125,482.80 0.00 2.85 0.83 271.85 33.90 0.72
Energy & Transformation Ind. 45,529.30 2.07 0.10 155.30 14.70 0.00
Industry, Mining & Construction 30,824.20 0.61 0.58 113.90 17.10 0.00
Transport 39,920.40 0.09 0.00 0.26 1.30 0.70
Commercial 890.50 0.02 0.08 0.87 0.20 0.00
Residential 3,469.40 0.06 0.06 1.37 0.50 0.00
Agriculture 4,849.00 0.00 0.01 0.15 0.10 0.02
B. Fugitive Emissions 193.7
Solid Fuels 16.02
Oil and Natural Gas 177.68
2. Industrial Processes 15,970.40 0.31 2,512.58
3. Agriculture 2,879.10 54.62
A. Enteric Fermentation 629.53
B. Manure Management 139.64 19.19
C. Rice Cultivation 2,110.53
D. Agricultural Soils 35.43
E. Prescribed Burning of Savannas
F. Field Burning of Agri. Residues
G. Others
4. Land Use Change & Forestry 99,577.35 -39,101.60 59.57 0.41 14.80 521.21
A. Changes in Forest & Other
Woody Biomass Stocks 40,180.51 -39,101.60
B. Forest & Grassland Conversion 59,396.84 59.57 0.41 14.8 521.21
C. Abandonment of Managed Land
D. Others
5. Wastes 35.22
A. Solid Waste Disposal 19.57
B. Wastewater Treatment 15.65
Emissions (Gg) GWP CO2 equivalent Percentage of(A) (B) (C) = (A) x (B) Total Emission
CO2 202,458.05 1 202,458 70.69
CH4 3,171.35 21 66,598 23.25
N2O 55.86 310 17,317 6.06
Total 286,373 100.00
Thailand’s National Greenhouse Gas Inventory 199416
Methane emissions from coal mining as well as oiland gas production activities were estimated at around194 Gg in 1994. The bulk of fugitive CH4 emissions (91percent) came from natural gas production activities,which included extraction, processing, transport,distribution, venting and flaring. The production of 17million tonnes of coal from surface mining leaked some16 Gg of CH4 into the atmosphere, while oil production,refining and storage activities produced 0.9 Gg of fugitiveCH4 emissions.
Industrial Process
Industrial production process also emitted GHGs. Themost significant GHG emission from industrial processis CO2. Industries covered in the 1994 inventory ofThailand were cement production, lime manufacturing,glass production, pulping process, iron and steelproduction, other chemical production, food and drink,bread production and fermentation processes.
Cement production was the largest contributor of CO2
from industrial process by emitting nearly 15 Tg or about93 percent, followed by lime production (6 percent). Theremaining industrial process produced marginal amountof CO2. Industrial process was almost the only source ofNMVOC emission by releasing about 2.519 Tg out ofthe total of 2.52 Tg. Of the industrial process, whiskyproduction alone produced about 2.48 Tg of NMVOC,followed by beer, wine and glass production. Ethylenewas the only source of CH4 which was marginal (0.3Gg).
Agriculture
Rice and Agricultural Soil
Despite being one of the major rice producingcountries in the world, Thailand’s contribution to globalCH4 emissions is relatively small. Methane emissionsfrom paddy fields were estimated at 2,110 Gg in 1994.About 86 percent of these was emitted from thecultivation of major rice, while the rest came from secondrice. The reason is that only irrigated land could producesecond rice, and only about a third of total irrigated landwere planted to second rice in 1994.
Total emissions of N2O from agricultural soils wereestimated at 35 Gg in 1994. Of this amount, 41 percentcame from direct sources through the incorporation ofsynthetic nitrogen fertilizer, animal manure and cropresidues into the soil. About 30 percent of N2O emissionswere from indirect sources through their formationin leached/runoff water and fertilized soils. The rest ofthe emissions came from animal waste excreted inpasture.
The emissions of N2O depend mainly on the amountof synthetic or chemical nitrogen fertilizers used inagricultural soils as well as on the organic fertilizers suchas animal manure and crop residues that are applied tothe soils. They are emitted through the fractionsvolatilized directly from cultivated soils and from theindirect formation of N2O from leached or contaminatedgroundwater. Several other factors influence theamount of N2O emissions as well. They include climateconditions, cultivation practices, soil and watermanagement, and crop type.
Livestock
The two main sources of GHGs from livestockproduction are enteric fermentation and manuremanagement. Methane gas is produced from entericfermentation and from animal feces, while N2O isproduced from the management of animal manure.
Enteric fermentation is a process of digestion inherbivores or plant-eating animals, which producesmethane as a by-product. Both ruminant livestock (e.g.,cattle and buffalo) and some non-ruminants (e.g., pigsand horses) produce methane, but ruminants are thelargest source. The amount of methane produced,however, depends upon various factors, including animalspecies and body size as well as the quantity and qualityof feed digested.
Methane and nitrous oxide are produced fromanaerobic decomposition of manure. These conditionsoften occur when a large number of animals are managedin a confined area such as dairy farms, beef feedlots orpig and poultry farms.
Methane emissions from enteric fermentation inlivestock were estimated at 630 Gg in 1994. The largestsource of enteric methane among ruminants was non-dairycattle, followed by buffalo, dairy cattle, goat and sheep.Swine, which had a larger population than non-dairycattle, emitted only about 13 Gg of enteric CH4. FecalCH4 emissions amounted to around 139 Gg in 1994, whileN2O emissions from various manure management systemswas estimated at 19 Gg. The largest source of fecal CH4
was swine, which accounted for 87 percent of total CH4
emitted from manure management.
Forests and Land Use
Forests act both as a source and a store (or sink) forCO2. CO2 is produced when forested land is convertedinto other land uses such as for agriculture and settlement,while CO2 is stored when trees absorb CO2 from theatmosphere through the process of photosynthesis. Theamounts of CO2 emitted and sequestered from forests arevery difficult to estimate because of complex biological
Summary 17
factors and the lack of reliable data, especially with regardto the rate of land use changes, the use of converted forestland, and the biomass density of forests.
Total CO2 emitted from Thai forests was 99,577 Ggin 1994, while total CO2 sequestered was estimated at39,102 Gg, resulting in net CO2 emissions of about60,475 Gg (see Table I). The consumption of wood asfuel accounted for about 41 percent of total CO2
emissions. The rest of the CO2 emissions came from theoff-site and on-site burning of biomass.
Wastes
The disposal of wastes and the processes employedto treat these wastes give rise to greenhouse gases, themost significant of which is methane. The two mainsources of CH4 emissions in Thailand are land disposalof waste (both landfill and open dumping methods) andthe treatment of wastewaters from the domestic andindustrial sectors. Although landfill is the most commondisposal system for solid waste in other countries, datafor Thailand in 1994 indicates that less than a quarter ofwastes were disposed using this method. About 40 percentof solid wastes ended up being burned, while 30 percentwere dumped in trenches or open sites. Moreover, out ofthe 137 solid wastes disposal systems throughout thecountry (excluding Bangkok), only 22 were landfills.
Estimates of the amount of CH4 emissions fromwastes amounted to 35 Gg in 1994 (see Table I). Of these,about 20 Gg were emitted from solid waste disposal.CH4 emissions from landfill sites were estimated at 8 Ggor 43 percent of the total.
Meanwhile, about 16 Gg of CH4 were emitted fromwastewater treatment. Of these, almost 90 percent camefrom industrial wastewater treatment facilities. Methaneemissions from domestic wastewater handling camemostly from sludge handling.
Limitations
Despite the use of local values for emission factors,cropping periods and harvesting area, the uncertainty ofthese estimates is still high. This is mainly due to theextreme spatial and temporal variability of methane fluxesthroughout the cropping season, soil characteristics,water and crop management practices, organic matteramendments, and fertilizer application. Actualmeasurements of methane emissions conducted in fourprovinces throughout Thailand indicate a wide divergencein results. For example, methane emissions from paddyfields without fertilizer application vary from 7.49Gg/sq m to 35.23 Gg/sq m. Field measurements alsoshowed that the addition of organic matter to rice paddieswith chemical fertilizer further increased methaneemissions by as much as 135 percent compared to thosewithout organic fertilization.
Mitigation Options
In addition to estimating the amounts of GHGsemitted, many researchers examined possible mitigationmeasures to reduce GHG emissions. Some were able toquantify the potentials for GHG emissions reduction,while others were limited only to identifying mitigationoptions and did not estimate how much could be reducedby each measure. In several cases, the suggestedmitigation measures were based on studies conductedelsewhere. Hence, their suitability, acceptability andeffectiveness to local conditions have yet to be proven.
The potential mitigation options identified rangedfrom the generation of electricity from landfills to thechemical treatment of feeds for ruminants. Some weretechnology based, while others, like the shift from thetransplanting of rice seedlings to the direct seedingmethod in rice cultivation, involved a change in culturalpractices. Some estimates showed that GHG emissionscould be reduced by as much as 70-80 percent. Thepotential for reduction was even much larger when theoptions were combined. In the rice cultivation sector, forinstance, improved water management and the use of pre-fermented organic matter instead of green manure couldreduce total methane emissions by up to 30 percent.

1C H A P T E R
ENERGY SECTOR
● Introduction
● Methodology
● Data
● Results
b y P o j a n i e K h u m m o n g k o l
Thailand’s National Greenhouse Gas Inventory 199420
Thailand’s National Greenhouse Gas Inventory 1994
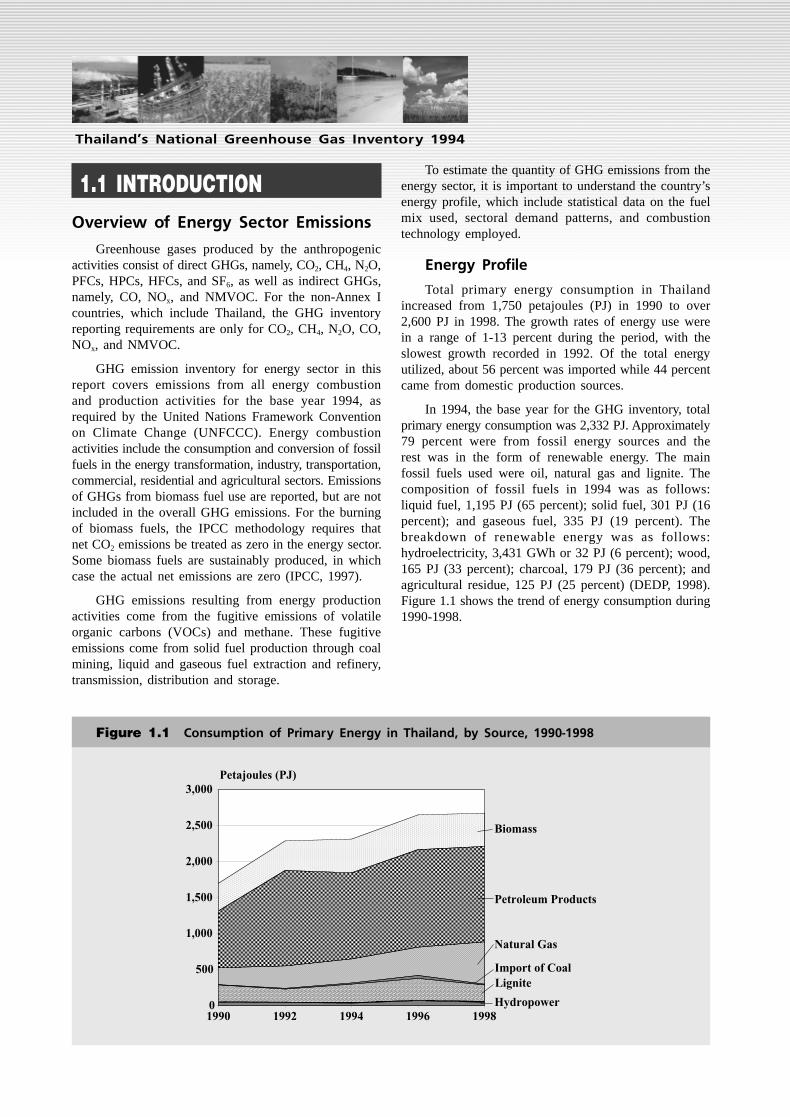
Figure 1.1 Consumption of Primary Energy in Thailand, by Source, 1990-1998
1.1 INTRODUCTIONOverview of Energy Sector Emissions
Greenhouse gases produced by the anthropogenicactivities consist of direct GHGs, namely, CO2, CH4, N2O,PFCs, HPCs, HFCs, and SF6, as well as indirect GHGs,namely, CO, NOx, and NMVOC. For the non-Annex Icountries, which include Thailand, the GHG inventoryreporting requirements are only for CO2, CH4, N2O, CO,NOx, and NMVOC.
GHG emission inventory for energy sector in thisreport covers emissions from all energy combustionand production activities for the base year 1994, asrequired by the United Nations Framework Conventionon Climate Change (UNFCCC). Energy combustionactivities include the consumption and conversion of fossilfuels in the energy transformation, industry, transportation,commercial, residential and agricultural sectors. Emissionsof GHGs from biomass fuel use are reported, but are notincluded in the overall GHG emissions. For the burningof biomass fuels, the IPCC methodology requires thatnet CO2 emissions be treated as zero in the energy sector.Some biomass fuels are sustainably produced, in whichcase the actual net emissions are zero (IPCC, 1997).
GHG emissions resulting from energy productionactivities come from the fugitive emissions of volatileorganic carbons (VOCs) and methane. These fugitiveemissions come from solid fuel production through coalmining, liquid and gaseous fuel extraction and refinery,transmission, distribution and storage.
To estimate the quantity of GHG emissions from theenergy sector, it is important to understand the country’senergy profile, which include statistical data on the fuelmix used, sectoral demand patterns, and combustiontechnology employed.
Energy Profile
Total primary energy consumption in Thailandincreased from 1,750 petajoules (PJ) in 1990 to over2,600 PJ in 1998. The growth rates of energy use werein a range of 1-13 percent during the period, with theslowest growth recorded in 1992. Of the total energyutilized, about 56 percent was imported while 44 percentcame from domestic production sources.
In 1994, the base year for the GHG inventory, totalprimary energy consumption was 2,332 PJ. Approximately79 percent were from fossil energy sources and therest was in the form of renewable energy. The mainfossil fuels used were oil, natural gas and lignite. Thecomposition of fossil fuels in 1994 was as follows:liquid fuel, 1,195 PJ (65 percent); solid fuel, 301 PJ (16percent); and gaseous fuel, 335 PJ (19 percent). Thebreakdown of renewable energy was as follows:hydroelectricity, 3,431 GWh or 32 PJ (6 percent); wood,165 PJ (33 percent); charcoal, 179 PJ (36 percent); andagricultural residue, 125 PJ (25 percent) (DEDP, 1998).Figure 1.1 shows the trend of energy consumption during1990-1998.
Energy Sector 21
Fossil Fuel Consumption
This section reviews the sources of fossil fuelconsumption in the country. They include natural gas,petroleum products, lignite and imported coal.
● Natural Gas
Natural gas consumption was 9,159 million cu m(330 PJ) in 1994. Approximately 305 PJ (92 percent) wereused to generate electricity, while 25 PJ (8 percent) wereconsumed in the industrial sector.
● Petroleum Products
In 1994, total petroleum products consumptionwas 32,466 million liters (1,194 PJ). Imported petroleumproducts were 9,815 million liters in the same year.Refinery output from the four domestic refineries was491,700 barrels per day (78 million liters per day). Theaddition of two new oil refineries in 1996, however, hasincreased production capacities at present to 767,500barrels per day (122 million liters per day). Petroleumproducts account for 53 percent of the total final energyconsumed.
● Lignite/Coal
There are various lignite resources scatteredaround Thailand. The total proven reserves is estimatedat about 2,312 million tonnes. In 1994, ligniteconsumption was 12 million tonnes (127 PJ), most ofwhich were used by the power generating plants. Thesub-bituminous coal produced in the country amountedto about 5 million tonnes (130 PJ) and were used mostlyin the cement and tobacco-curing industries (DEDP,1995). The tobacco-curing industry utilized a smallamount of lignite (0.062 million tonnes or 0.6 PJ) in thesame year.
Coal of bituminous grade were imported. In 1994,some 1.5 million tonnes (40 PJ) were imported for usemainly in the cement and pulp and paper industries.
Renewable Energy Consumption
The two most important sources of renewableenergy are hydro-electricity and biomass. Other forms ofrenewable energy such as solar, wind and photovoltaichave not been utilized extensively in the country.
● Hydro-electricity
The hydroelectric potential in Thailand isestimated at about 37,010 megawatts (MW), of which15,155 MW are within the domestic boundaries ofThailand and 21,855 MW are from international projectswith neighboring countries (DEDP, 1998). In 1994, only3,873 MW of hydropower capacity or 26 percent of thetotal domestic potential were utilized. Of this amount,2,873 MW were in operation, while 1,000 MW was underconstruction and/or committed for implementation.
● Solar
The average solar radiation in Thailand is about17 MJ per sq m per day. As the diffused componentaccounts for approximately 50 percent of the totalradiation, solar concentrators which collect only directradiation are hardly economical. Although non-commercial uses of solar thermal energy have been wellrecognized for salt production and for drying of paddy,fruits and vegetables, large-scale drying of agriculturalproducts has been implemented with limited successowing to high capital costs. Solar thermal energy is nowcommercially used for water heating, with about 5,000sq m of collectors installed per year (Soponronnarit,1997).
● Photovoltaic
Photovoltaic systems have been installed mainlyfor lighting, water pumping and telecommunications inrural areas. More than 2 MW of photovoltaic systemshave been installed in the country, with an estimatedannual growth of about 50 kW per year (Kirtikara, 1993).
● Wind
The potential for wind energy in Thailand israther low. The average wind speed in the country is onlyabout 2.5 m/s. However, several locations on the southerncoast and the gulf area have average wind speeds over 4m/s, which are suitable for energy conversion. Windmillshave traditionally been used in salt farms and rice fieldsin these areas. Wind electric power systems with a totalgenerating capacity of 22 kW have been installed fordemonstration purposes (Jivacate, 1994).
● Biomass
Biomass have been the main indigenous sourceof energy for the country. In 1994, the total supply ofbiomass, which included fuel wood, paddy husk andbagasse, amounted to 468 PJ and accounted for 27 percentof the country’s total energy supply (DEDP, 1995).
● Bagasse
The sugar industry is one of the largest energyconsuming industries in Thailand. In 1996, over fiftysugar mills obtained their requirements for power andprocess heat from 17.6 million tonnes of bagasse, whichaccounted for about 4 percent of the total energy supplyfor the country (Wibulswas and Khummongkok, 1998).The same study estimated the total power generatingcapacity in Thai sugar mills at 850 MW, equivalent toabout 5 percent of the total power generating capacity ofthe country in 1996.
● Paddy Husk
Paddy husk is used as fuel in rice mills, brickmaking, cooking stoves, and others. In 1994, the supplyof paddy husk was about 1.3 million tonnes, representing1 percent of the total energy supply of the country.Another 3 million tonnes of paddy husk were not utilized
Thailand’s National Greenhouse Gas Inventory 199422
as fuel and were simply burned in rice mills. Among themore than 46,000 rice mills all over Thailand, 312 arelarge rice mills with capacities greater than 100 tonnesof paddy per day, 52 are parboiled rice mills, and 260are white rice mills (Ekasilp, 1996). Most of the parboiledrice mills generate power for milling and heat forparboiling.
● Fuel Wood from Fast Growing Trees
The commercial plantation of fast-growing treessuch as eucalyptus and acacia can partly alleviate theadverse environmental impacts posed by deforestation dueto fuel wood use and the construction of large hydropowerplants. It can also help reduce carbon dioxide and sulfurdioxide emissions from combustion of fossil fuels.
Large plantations of Eucalyptus camaldulensiscan be found in the eastern region of Thailand. A surveyconducted by the Forestry Research Center in 1996showed that the total area of Eucalyptus camaldulensisplantations in the eastern region was 119,271 ha or 34percent of the total Eucalyptus plantation area of thecountry (Hoamuangkaew, 1997). Approximately 66percent of the total private plantations were owned bythe farmers; the rest belonged to the chip wood and woodpulp industry owners.
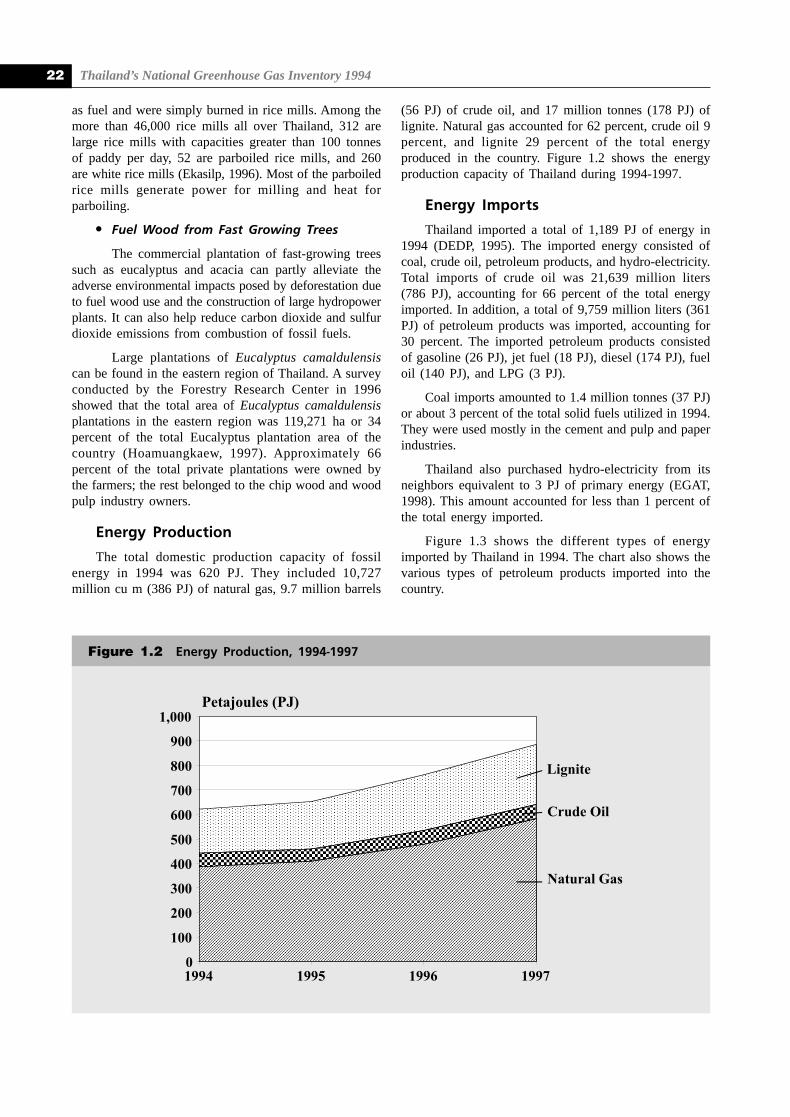
Energy Production
The total domestic production capacity of fossilenergy in 1994 was 620 PJ. They included 10,727million cu m (386 PJ) of natural gas, 9.7 million barrels
Figure 1.2 Energy Production, 1994-1997
(56 PJ) of crude oil, and 17 million tonnes (178 PJ) oflignite. Natural gas accounted for 62 percent, crude oil 9percent, and lignite 29 percent of the total energyproduced in the country. Figure 1.2 shows the energyproduction capacity of Thailand during 1994-1997.
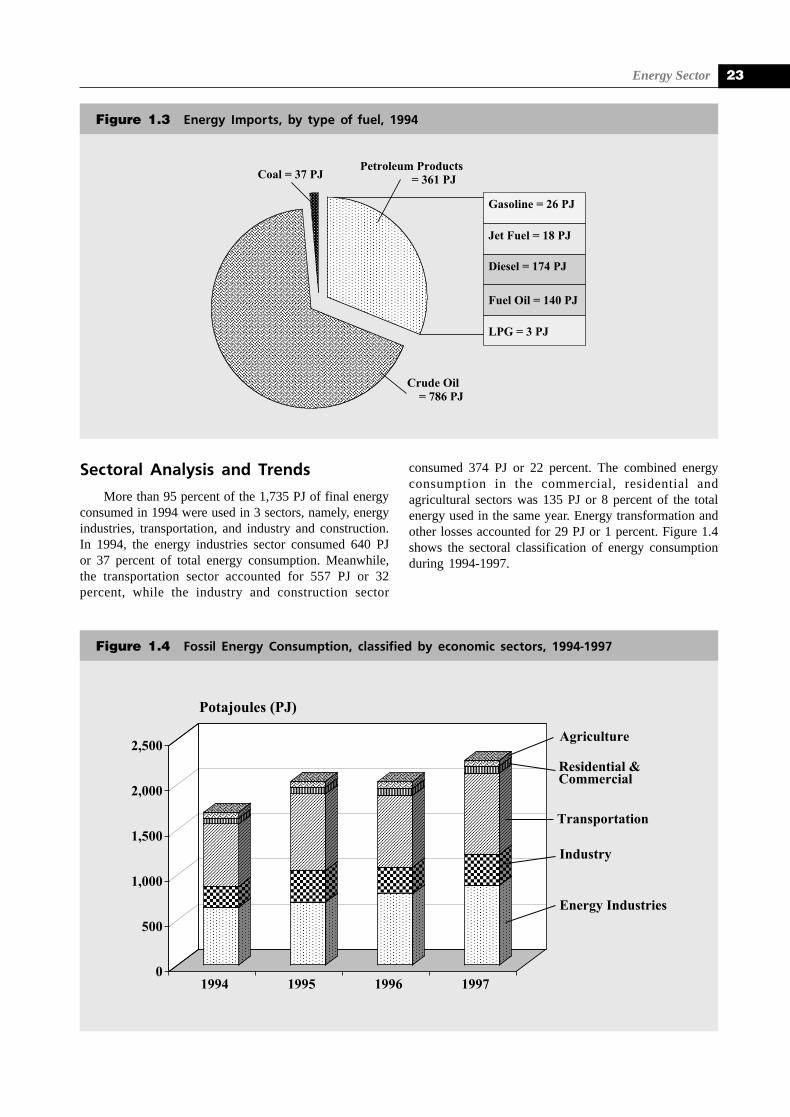
Energy Imports
Thailand imported a total of 1,189 PJ of energy in1994 (DEDP, 1995). The imported energy consisted ofcoal, crude oil, petroleum products, and hydro-electricity.Total imports of crude oil was 21,639 million liters(786 PJ), accounting for 66 percent of the total energyimported. In addition, a total of 9,759 million liters (361PJ) of petroleum products was imported, accounting for30 percent. The imported petroleum products consistedof gasoline (26 PJ), jet fuel (18 PJ), diesel (174 PJ), fueloil (140 PJ), and LPG (3 PJ).
Coal imports amounted to 1.4 million tonnes (37 PJ)or about 3 percent of the total solid fuels utilized in 1994.They were used mostly in the cement and pulp and paperindustries.
Thailand also purchased hydro-electricity from itsneighbors equivalent to 3 PJ of primary energy (EGAT,1998). This amount accounted for less than 1 percent ofthe total energy imported.
Figure 1.3 shows the different types of energyimported by Thailand in 1994. The chart also shows thevarious types of petroleum products imported into thecountry.
Energy Sector 23
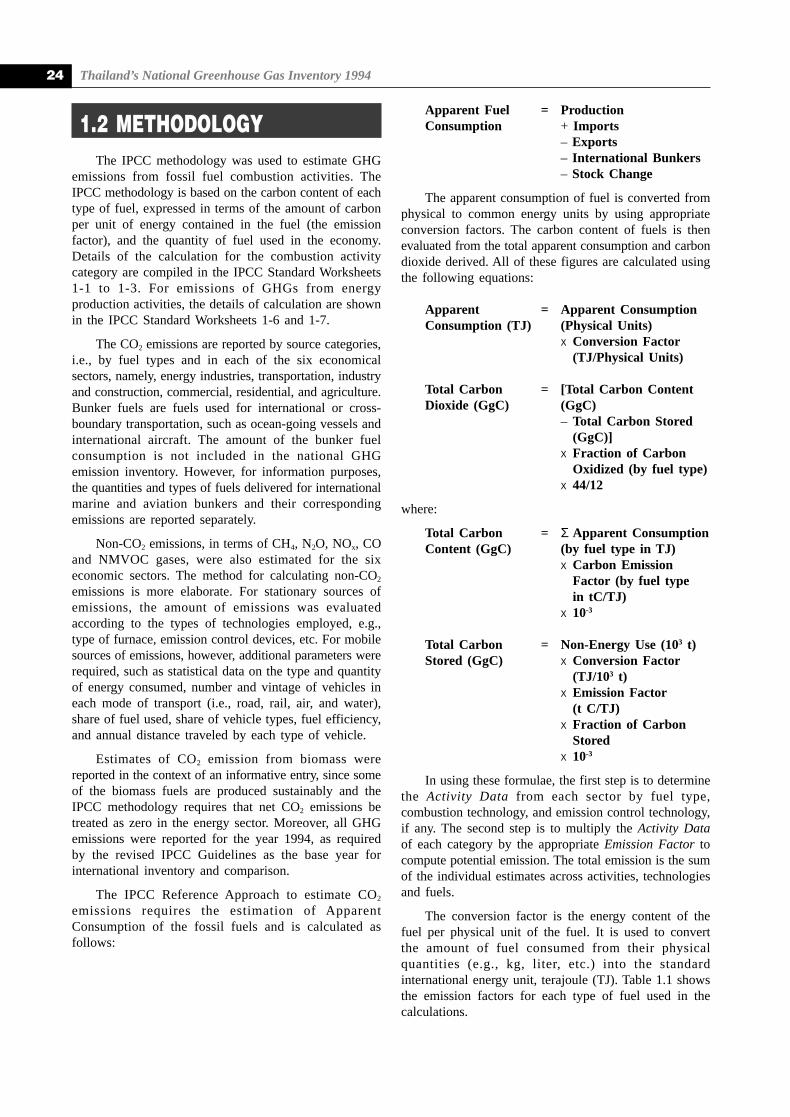
Sectoral Analysis and Trends
More than 95 percent of the 1,735 PJ of final energyconsumed in 1994 were used in 3 sectors, namely, energyindustries, transportation, and industry and construction.In 1994, the energy industries sector consumed 640 PJor 37 percent of total energy consumption. Meanwhile,the transportation sector accounted for 557 PJ or 32percent, while the industry and construction sector
consumed 374 PJ or 22 percent. The combined energyconsumption in the commercial, residential andagricultural sectors was 135 PJ or 8 percent of the totalenergy used in the same year. Energy transformation andother losses accounted for 29 PJ or 1 percent. Figure 1.4shows the sectoral classification of energy consumptionduring 1994-1997.
Figure 1.3 Energy Imports, by type of fuel, 1994
Figure 1.4 Fossil Energy Consumption, classified by economic sectors, 1994-1997
Thailand’s National Greenhouse Gas Inventory 199424
1.2 METHODOLOGYThe IPCC methodology was used to estimate GHG
emissions from fossil fuel combustion activities. TheIPCC methodology is based on the carbon content of eachtype of fuel, expressed in terms of the amount of carbonper unit of energy contained in the fuel (the emissionfactor), and the quantity of fuel used in the economy.Details of the calculation for the combustion activitycategory are compiled in the IPCC Standard Worksheets1-1 to 1-3. For emissions of GHGs from energyproduction activities, the details of calculation are shownin the IPCC Standard Worksheets 1-6 and 1-7.
The CO2 emissions are reported by source categories,i.e., by fuel types and in each of the six economicalsectors, namely, energy industries, transportation, industryand construction, commercial, residential, and agriculture.Bunker fuels are fuels used for international or cross-boundary transportation, such as ocean-going vessels andinternational aircraft. The amount of the bunker fuelconsumption is not included in the national GHGemission inventory. However, for information purposes,the quantities and types of fuels delivered for internationalmarine and aviation bunkers and their correspondingemissions are reported separately.
Non-CO2 emissions, in terms of CH4, N2O, NOx, COand NMVOC gases, were also estimated for the sixeconomic sectors. The method for calculating non-CO2
emissions is more elaborate. For stationary sources ofemissions, the amount of emissions was evaluatedaccording to the types of technologies employed, e.g.,type of furnace, emission control devices, etc. For mobilesources of emissions, however, additional parameters wererequired, such as statistical data on the type and quantityof energy consumed, number and vintage of vehicles ineach mode of transport (i.e., road, rail, air, and water),share of fuel used, share of vehicle types, fuel efficiency,and annual distance traveled by each type of vehicle.
Estimates of CO2 emission from biomass werereported in the context of an informative entry, since someof the biomass fuels are produced sustainably and theIPCC methodology requires that net CO2 emissions betreated as zero in the energy sector. Moreover, all GHGemissions were reported for the year 1994, as requiredby the revised IPCC Guidelines as the base year forinternational inventory and comparison.
The IPCC Reference Approach to estimate CO2
emissions requires the estimation of ApparentConsumption of the fossil fuels and is calculated asfollows:
Apparent Fuel = ProductionConsumption + Imports
– Exports– International Bunkers– Stock Change
The apparent consumption of fuel is converted fromphysical to common energy units by using appropriateconversion factors. The carbon content of fuels is thenevaluated from the total apparent consumption and carbondioxide derived. All of these figures are calculated usingthe following equations:
Apparent = Apparent ConsumptionConsumption (TJ) (Physical Units)
x Conversion Factor(TJ/Physical Units)
Total Carbon = [Total Carbon ContentDioxide (GgC) (GgC)
– Total Carbon Stored(GgC)]
x Fraction of CarbonOxidized (by fuel type)
x 44/12
where:
Total Carbon = Σ Apparent ConsumptionContent (GgC) (by fuel type in TJ)
x Carbon EmissionFactor (by fuel typein tC/TJ)
x 10-3
Total Carbon = Non-Energy Use (103 t)Stored (GgC) x Conversion Factor
(TJ/103 t)x Emission Factor
(t C/TJ)x Fraction of Carbon
Storedx 10-3
In using these formulae, the first step is to determinethe Activity Data from each sector by fuel type,combustion technology, and emission control technology,if any. The second step is to multiply the Activity Dataof each category by the appropriate Emission Factor tocompute potential emission. The total emission is the sumof the individual estimates across activities, technologiesand fuels.
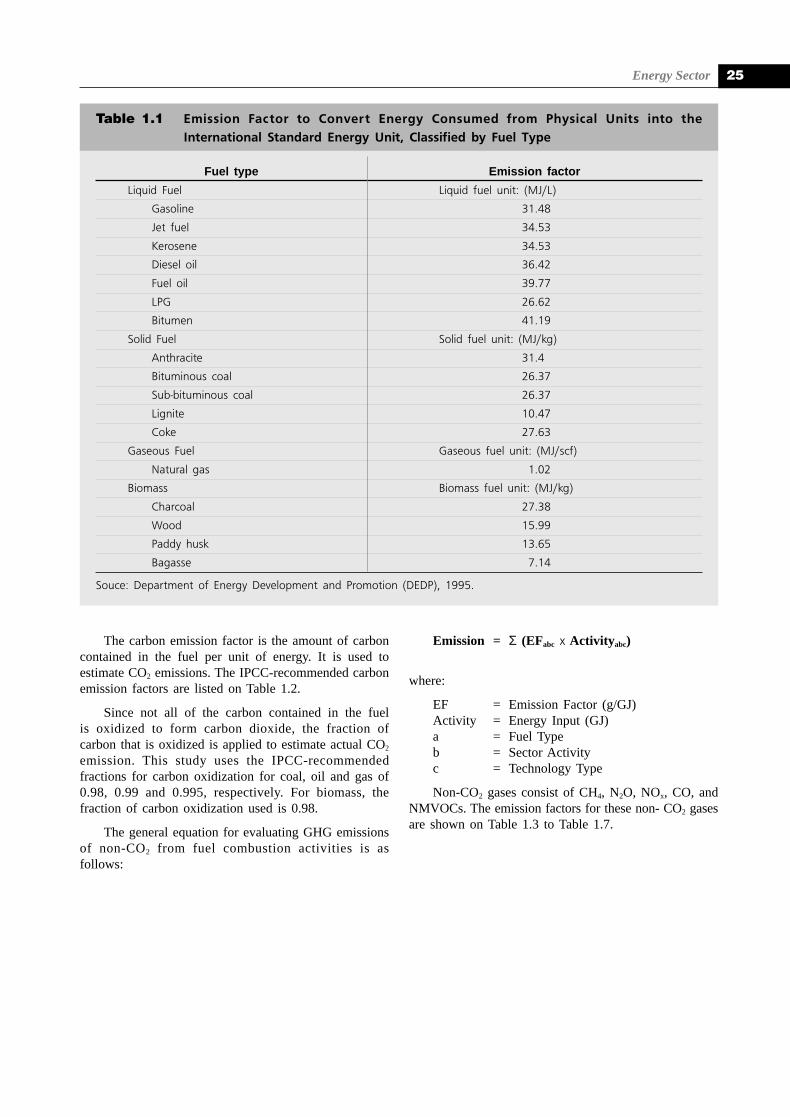
The conversion factor is the energy content of thefuel per physical unit of the fuel. It is used to convertthe amount of fuel consumed from their physicalquantities (e.g., kg, liter, etc.) into the standardinternational energy unit, terajoule (TJ). Table 1.1 showsthe emission factors for each type of fuel used in thecalculations.
Energy Sector 25
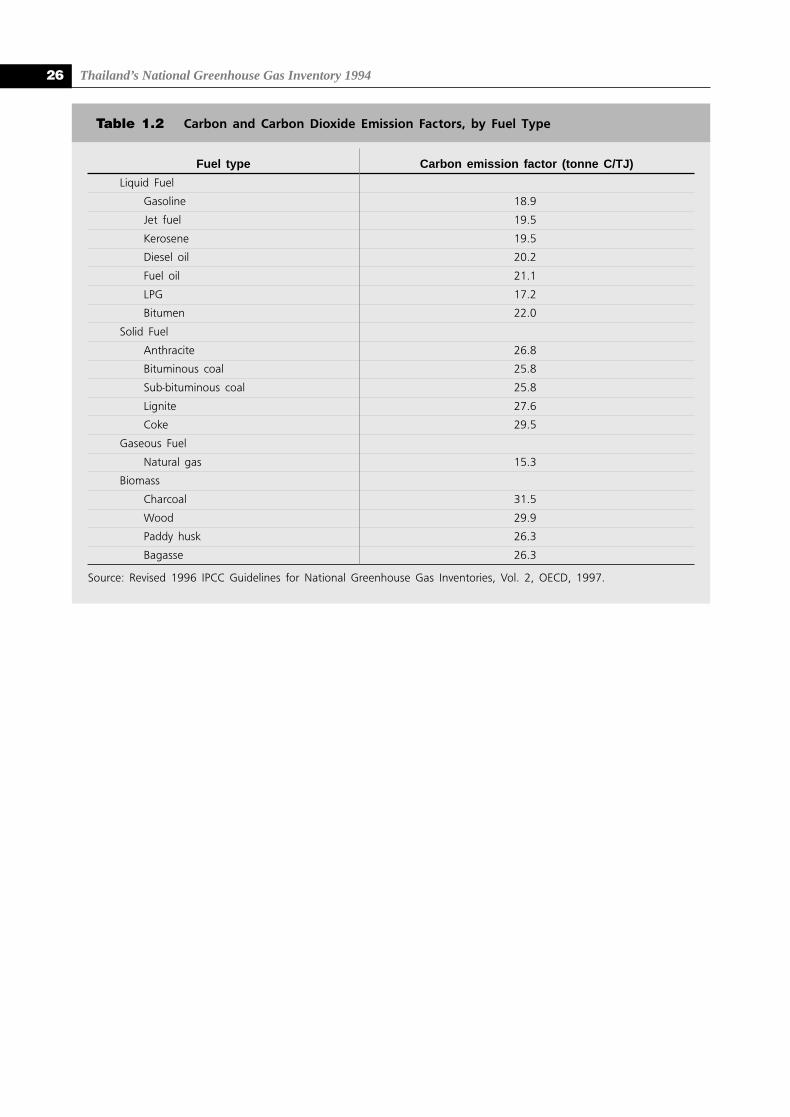
The carbon emission factor is the amount of carboncontained in the fuel per unit of energy. It is used toestimate CO2 emissions. The IPCC-recommended carbonemission factors are listed on Table 1.2.
Since not all of the carbon contained in the fuelis oxidized to form carbon dioxide, the fraction ofcarbon that is oxidized is applied to estimate actual CO2
emission. This study uses the IPCC-recommendedfractions for carbon oxidization for coal, oil and gas of0.98, 0.99 and 0.995, respectively. For biomass, thefraction of carbon oxidization used is 0.98.
The general equation for evaluating GHG emissionsof non-CO2 from fuel combustion activities is asfollows:
Emission = Σ (EFabc x Activityabc)
where:
EF = Emission Factor (g/GJ)Activity = Energy Input (GJ)a = Fuel Typeb = Sector Activityc = Technology Type
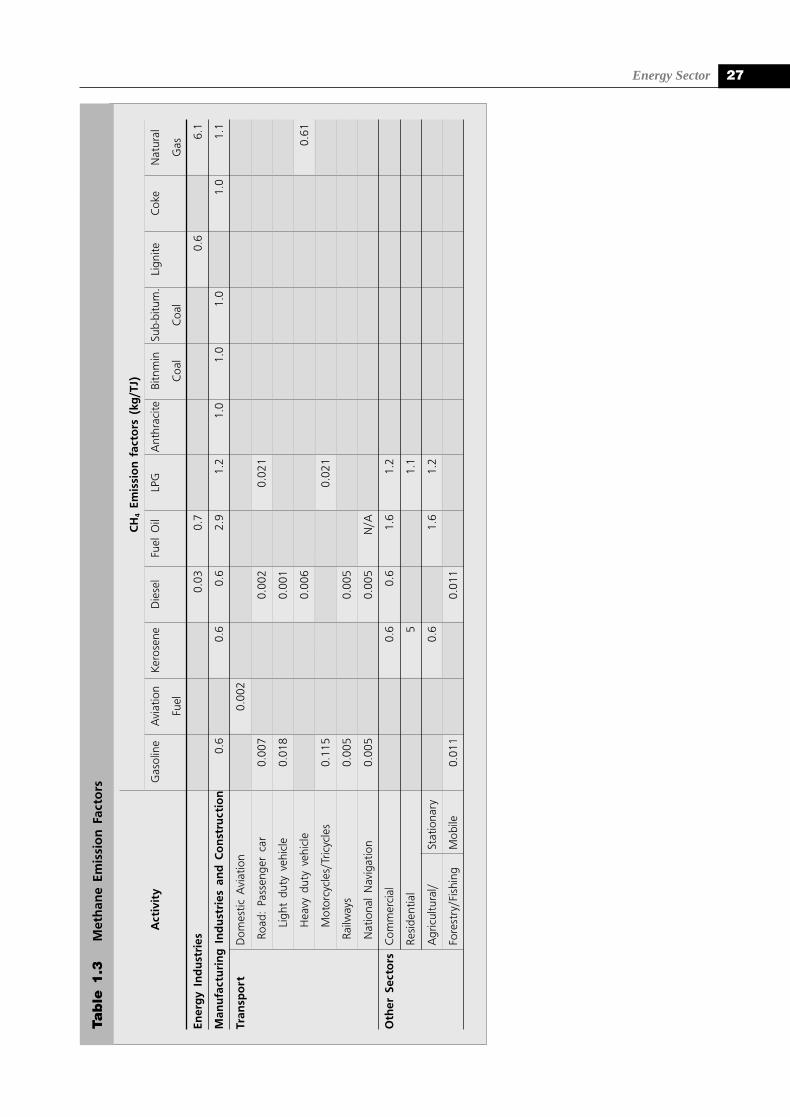
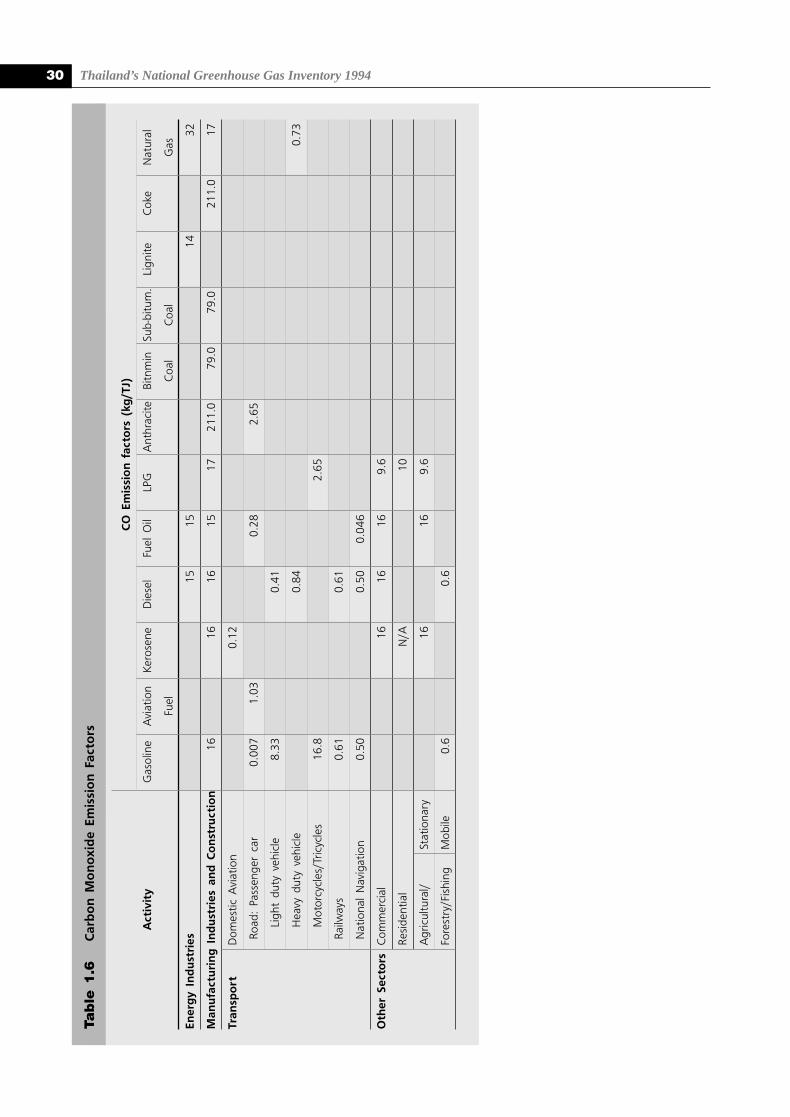
Non-CO2 gases consist of CH4, N2O, NOx, CO, andNMVOCs. The emission factors for these non- CO2 gasesare shown on Table 1.3 to Table 1.7.
Fuel type Emission factor
Liquid Fuel Liquid fuel unit: (MJ/L)
Gasoline 31.48
Jet fuel 34.53
Kerosene 34.53
Diesel oil 36.42
Fuel oil 39.77
LPG 26.62
Bitumen 41.19
Solid Fuel Solid fuel unit: (MJ/kg)
Anthracite 31.4
Bituminous coal 26.37
Sub-bituminous coal 26.37
Lignite 10.47
Coke 27.63
Gaseous Fuel Gaseous fuel unit: (MJ/scf)
Natural gas 1.02
Biomass Biomass fuel unit: (MJ/kg)
Charcoal 27.38
Wood 15.99
Paddy husk 13.65
Bagasse 7.14
Souce: Department of Energy Development and Promotion (DEDP), 1995.
Table 1.1 Emission Factor to Convert Energy Consumed from Physical Units into theInternational Standard Energy Unit, Classified by Fuel Type
Thailand’s National Greenhouse Gas Inventory 199426
Fuel type Carbon emission factor (tonne C/TJ)
Liquid Fuel
Gasoline 18.9
Jet fuel 19.5
Kerosene 19.5
Diesel oil 20.2
Fuel oil 21.1
LPG 17.2
Bitumen 22.0
Solid Fuel
Anthracite 26.8
Bituminous coal 25.8
Sub-bituminous coal 25.8
Lignite 27.6
Coke 29.5
Gaseous Fuel
Natural gas 15.3
Biomass
Charcoal 31.5
Wood 29.9
Paddy husk 26.3
Bagasse 26.3
Source: Revised 1996 IPCC Guidelines for National Greenhouse Gas Inventories, Vol. 2, OECD, 1997.
Table 1.2 Carbon and Carbon Dioxide Emission Factors, by Fuel Type
Energy Sector 27
Tab
le 1
.3M
eth
ane
Emis
sio
n F
acto
rs
CH
4 Em
issi
on
fac
tors
(kg
/TJ)
Act
ivit
yG
asol
ine
Avi
atio
nKe
rose
neD
iese
lFu
el O
ilLP
GA
nthr
acite
Bitn
min
Sub-
bitu
m.
Lign
iteC
oke
Nat
ural
Fuel
Coa
lC
oal
Gas
Ener
gy
Ind
ust
ries
0.03
0.7
0.6
6.1
Man
ufa
ctu
rin
g I
nd
ust
ries
an
d C
on
stru
ctio
n0.
60.
60.
62.
91.
21.
01.
01.
01.
01.
1
Tran
spo
rtD
omes
tic A
viat
ion
0.00
2
Road
: Pa
ssen
ger
car
0.00
70.
002
0.02
1
Ligh
t du
ty v
ehic
le0.
018
0.00
1
Hea
vy d
uty
vehi
cle
0.00
60.
61
Mot
orcy
cles
/Tric
ycle
s0.
115
0.02
1
Railw
ays
0.00
50.
005
Nat
iona
l N
avig
atio
n0.
005
0.00
5N
/A
Oth
er S
ecto
rsC
omm
erci
al0.
60.
61.
61.
2
Resi
dent
ial
51.
1
Agr
icul
tura
l/St
atio
nary
0.6
1.6
1.2
Fore
stry
/Fis
hing
Mob
ile0.
011
0.01
1

Thailand’s National Greenhouse Gas Inventory 199428
NO
x Em
issi
on
fac
tors
(kg
/TJ)
Act
ivit
yG
asol
ine
Avi
atio
nKe
rose
neD
iese
lFu
el O
ilLP
GA
nthr
acite
Bitn
min
Sub-
bitu
m.
Lign
iteC
oke
Nat
ural
Fuel
Coa
lC
oal
Gas
Ener
gy
Ind
ust
ries
6820
146
118
7
Man
ufa
ctu
rin
g I
nd
ust
ries
an
d C
on
stru
ctio
n64
6464
161
67N
/A52
7.0
527.
0N
/A67
Tran
spo
rtD
omes
tic A
viat
ion
0.29
Road
: Pa
ssen
ger
car
0.00
70.
180.
260.
8
Ligh
t du
ty v
ehic
le0.
660.
37
Hea
vy d
uty
vehi
cle
1.0
0.35
Mot
orcy
cles
/Tric
ycle
s0.
060.
8
Railw
ays
1.8
1.8
Nat
iona
l N
avig
atio
n1.
61.
62.
1
Oth
er S
ecto
rsC
omm
erci
al64
6464
48
Resi
dent
ial
N/A
47
Agr
icul
tura
l/St
atio
nary
6464
48
Fore
stry
/Fis
hing
Mob
ile1.
51.
5
Tab
le 1
.4O
xid
es o
f N
itro
gen
Em
issi
on
Fac
tors

Energy Sector 29
N2O
Em
issi
on
fac
tors
(kg
/TJ)
Act
ivit
yG
asol
ine
Avi
atio
nKe
rose
neD
iese
lFu
el O
ilLP
GA
nthr
acite
Bitn
min
Sub-
bitu
m.
Lign
iteC
oke
Nat
ural
Fuel
Coa
lC
oal
Gas
Ener
gy
Ind
ust
ries
N/A
N/A
0.8
N/A
Man
ufa
ctu
rin
g I
nd
ust
ries
an
d C
on
stru
ctio
n15
.715
.715
.7N
/AN
/AN
/AN
/AN
/AN
/AN
/A
Tran
spo
rtD
omes
tic A
viat
ion
N/A
Road
: Pa
ssen
ger
car
0.00
70.
002
0.00
40.
000
Ligh
t du
ty v
ehic
le0.
0009
0.00
4
Hea
vy d
uty
vehi
cle
0.00
3N
/A
Mot
orcy
cles
/Tric
ycle
s0.
002
0.00
0
Railw
ays
0.00
20.
002
Nat
iona
l N
avig
atio
n0.
002
0.00
20.
002
Oth
er S
ecto
rsC
omm
erci
al15
.715
.715
.72.
4
Resi
dent
ial
51.
1
Agr
icul
tura
l/St
atio
nary
15.7
15.7
2.4
Fore
stry
/Fis
hing
Mob
ile0.
002
0.00
2
Tab
le 1
.5N
itro
us
Oxi
de
Emis
sio
n F
acto
rs
Thailand’s National Greenhouse Gas Inventory 199430
CO
Em
issi
on
fac
tors
(kg
/TJ)
Act
ivit
yG
asol
ine
Avi
atio
nKe
rose
neD
iese
lFu
el O
ilLP
GA
nthr
acite
Bitn
min
Sub-
bitu
m.
Lign
iteC
oke
Nat
ural
Fuel
Coa
lC
oal
Gas
Ener
gy
Ind
ust
ries
1515
1432
Man
ufa
ctu
rin
g I
nd
ust
ries
an
d C
on
stru
ctio
n16
1616
1517
211.
079
.079
.021
1.0
17
Tran
spo
rtD
omes
tic A
viat
ion
0.12
Road
: Pa
ssen
ger
car
0.00
71.
030.
282.
65
Ligh
t du
ty v
ehic
le8.
330.
41
Hea
vy d
uty
vehi
cle
0.84
0.73
Mot
orcy
cles
/Tric
ycle
s16
.82.
65
Railw
ays
0.61
0.61
Nat
iona
l N
avig
atio
n0.
500.
500.
046
Oth
er S
ecto
rsC
omm
erci
al16
1616
9.6
Resi
dent
ial
N/A
10
Agr
icul
tura
l/St
atio
nary
1616
9.6
Fore
stry
/Fis
hing
Mob
ile0.
60.
6
Tab
le 1
.6C
arb
on
Mo
no
xid
e Em
issi
on
Fac
tors
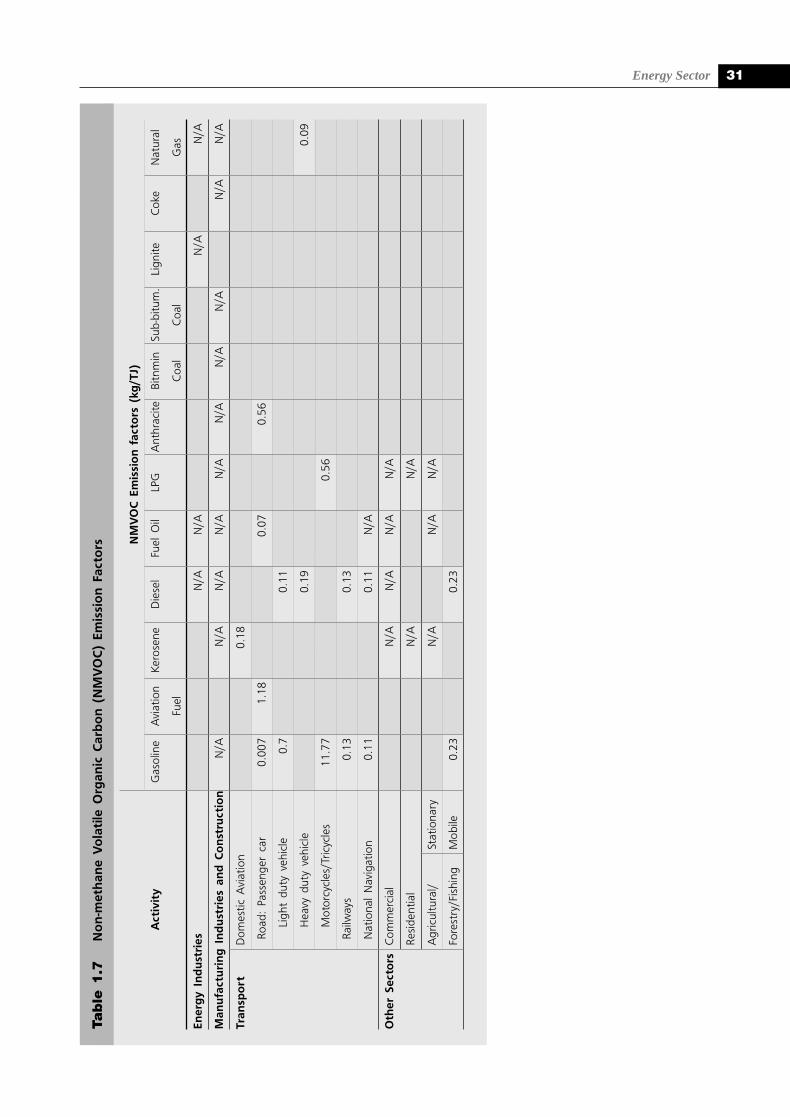
Energy Sector 31
NM
VO
C E
mis
sio
n f
acto
rs (
kg/T
J)
Act
ivit
yG
asol
ine
Avi
atio
nKe
rose
neD
iese
lFu
el O
ilLP
GA
nthr
acite
Bitn
min
Sub-
bitu
m.
Lign
iteC
oke
Nat
ural
Fuel
Coa
lC
oal
Gas
Ener
gy
Ind
ust
ries
N/A
N/A
N/A
N/A
Man
ufa
ctu
rin
g I
nd
ust
ries
an
d C
on
stru
ctio
nN
/AN
/AN
/AN
/AN
/AN
/AN
/AN
/AN
/AN
/A
Tran
spo
rtD
omes
tic A
viat
ion
0.18
Road
: Pa
ssen
ger
car
0.00
71.
180.
070.
56
Ligh
t du
ty v
ehic
le0.
70.
11
Hea
vy d
uty
vehi
cle
0.19
0.09
Mot
orcy
cles
/Tric
ycle
s11
.77
0.56
Railw
ays
0.13
0.13
Nat
iona
l N
avig
atio
n0.
110.
11N
/A
Oth
er S
ecto
rsC
omm
erci
alN
/AN
/AN
/AN
/A
Resi
dent
ial
N/A
N/A
Agr
icul
tura
l/St
atio
nary
N/A
N/A
N/A
Fore
stry
/Fis
hing
Mob
ile0.
230.
23
Tab
le 1
.7N
on
-met
han
e V
ola
tile
Org
anic
Car
bo
n (
NM
VO
C)
Emis
sio
n F
acto
rs
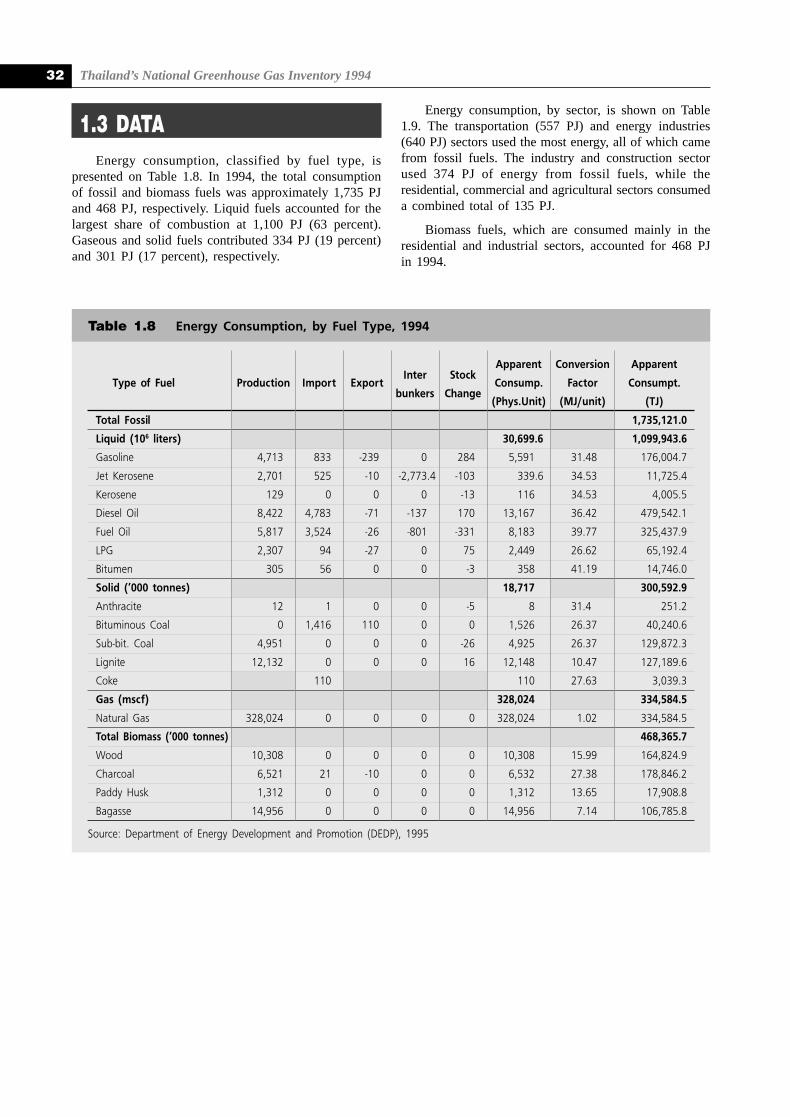
Thailand’s National Greenhouse Gas Inventory 199432
1.3 DATAEnergy consumption, classified by fuel type, is
presented on Table 1.8. In 1994, the total consumptionof fossil and biomass fuels was approximately 1,735 PJand 468 PJ, respectively. Liquid fuels accounted for thelargest share of combustion at 1,100 PJ (63 percent).Gaseous and solid fuels contributed 334 PJ (19 percent)and 301 PJ (17 percent), respectively.
Energy consumption, by sector, is shown on Table1.9. The transportation (557 PJ) and energy industries(640 PJ) sectors used the most energy, all of which camefrom fossil fuels. The industry and construction sectorused 374 PJ of energy from fossil fuels, while theresidential, commercial and agricultural sectors consumeda combined total of 135 PJ.
Biomass fuels, which are consumed mainly in theresidential and industrial sectors, accounted for 468 PJin 1994.
Inter StockApparent Conversion Apparent
Type of Fuel Production Import Exportbunkers Change
Consump. Factor Consumpt.
(Phys.Unit) (MJ/unit) (TJ)
Total Fossil 1,735,121.0
Liquid (106 liters) 30,699.6 1,099,943.6
Gasoline 4,713 833 -239 0 284 5,591 31.48 176,004.7
Jet Kerosene 2,701 525 -10 -2,773.4 -103 339.6 34.53 11,725.4
Kerosene 129 0 0 0 -13 116 34.53 4,005.5
Diesel Oil 8,422 4,783 -71 -137 170 13,167 36.42 479,542.1
Fuel Oil 5,817 3,524 -26 -801 -331 8,183 39.77 325,437.9
LPG 2,307 94 -27 0 75 2,449 26.62 65,192.4
Bitumen 305 56 0 0 -3 358 41.19 14,746.0
Solid (’000 tonnes) 18,717 300,592.9
Anthracite 12 1 0 0 -5 8 31.4 251.2
Bituminous Coal 0 1,416 110 0 0 1,526 26.37 40,240.6
Sub-bit. Coal 4,951 0 0 0 -26 4,925 26.37 129,872.3
Lignite 12,132 0 0 0 16 12,148 10.47 127,189.6
Coke 110 110 27.63 3,039.3
Gas (mscf) 328,024 334,584.5
Natural Gas 328,024 0 0 0 0 328,024 1.02 334,584.5
Total Biomass (’000 tonnes) 468,365.7
Wood 10,308 0 0 0 0 10,308 15.99 164,824.9
Charcoal 6,521 21 -10 0 0 6,532 27.38 178,846.2
Paddy Husk 1,312 0 0 0 0 1,312 13.65 17,908.8
Bagasse 14,956 0 0 0 0 14,956 7.14 106,785.8
Source: Department of Energy Development and Promotion (DEDP), 1995
Table 1.8 Energy Consumption, by Fuel Type, 1994
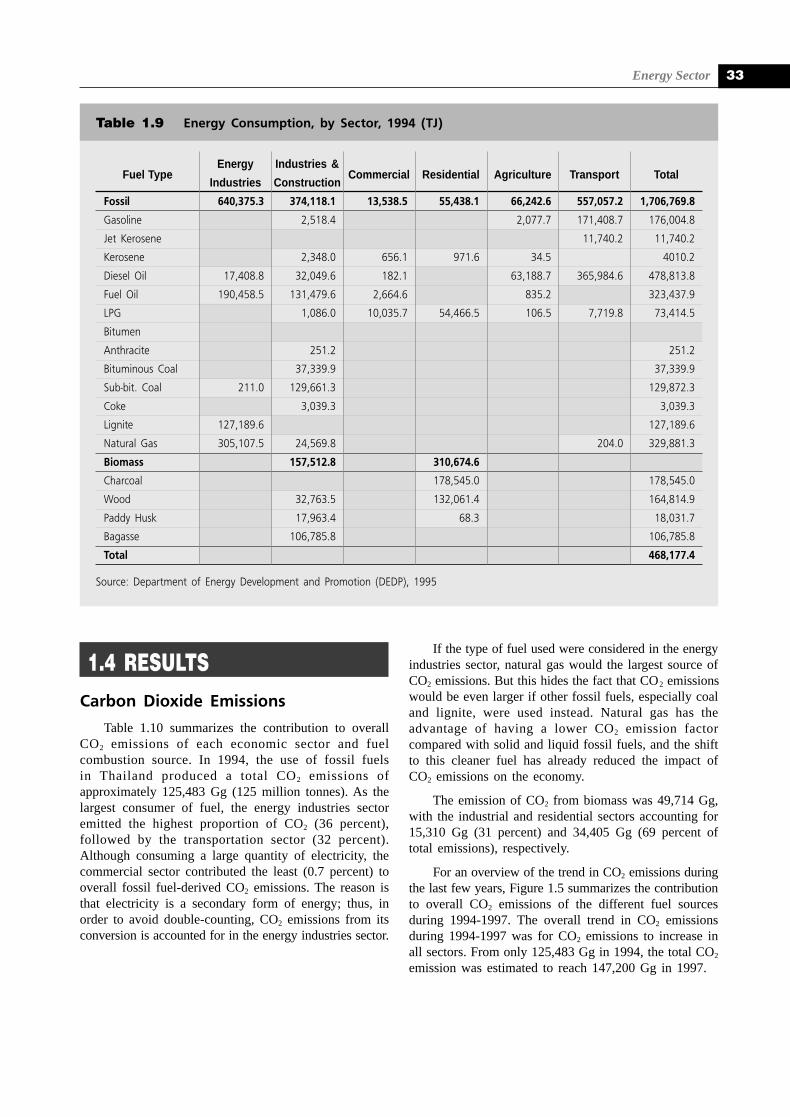
Energy Sector 33
Fuel TypeEnergy Industries &
Commercial Residential Agriculture Transport TotalIndustries Construction
Fossil 640,375.3 374,118.1 13,538.5 55,438.1 66,242.6 557,057.2 1,706,769.8
Gasoline 2,518.4 2,077.7 171,408.7 176,004.8
Jet Kerosene 11,740.2 11,740.2
Kerosene 2,348.0 656.1 971.6 34.5 4010.2
Diesel Oil 17,408.8 32,049.6 182.1 63,188.7 365,984.6 478,813.8
Fuel Oil 190,458.5 131,479.6 2,664.6 835.2 323,437.9
LPG 1,086.0 10,035.7 54,466.5 106.5 7,719.8 73,414.5
Bitumen
Anthracite 251.2 251.2
Bituminous Coal 37,339.9 37,339.9
Sub-bit. Coal 211.0 129,661.3 129,872.3
Coke 3,039.3 3,039.3
Lignite 127,189.6 127,189.6
Natural Gas 305,107.5 24,569.8 204.0 329,881.3
Biomass 157,512.8 310,674.6
Charcoal 178,545.0 178,545.0
Wood 32,763.5 132,061.4 164,814.9
Paddy Husk 17,963.4 68.3 18,031.7
Bagasse 106,785.8 106,785.8
Total 468,177.4
Source: Department of Energy Development and Promotion (DEDP), 1995
Table 1.9 Energy Consumption, by Sector, 1994 (TJ)
1.4 RESULTSCarbon Dioxide Emissions
Table 1.10 summarizes the contribution to overallCO2 emissions of each economic sector and fuelcombustion source. In 1994, the use of fossil fuelsin Thailand produced a total CO2 emissions ofapproximately 125,483 Gg (125 million tonnes). As thelargest consumer of fuel, the energy industries sectoremitted the highest proportion of CO2 (36 percent),followed by the transportation sector (32 percent).Although consuming a large quantity of electricity, thecommercial sector contributed the least (0.7 percent) tooverall fossil fuel-derived CO2 emissions. The reason isthat electricity is a secondary form of energy; thus, inorder to avoid double-counting, CO2 emissions from itsconversion is accounted for in the energy industries sector.
If the type of fuel used were considered in the energyindustries sector, natural gas would the largest source ofCO2 emissions. But this hides the fact that CO2 emissionswould be even larger if other fossil fuels, especially coaland lignite, were used instead. Natural gas has theadvantage of having a lower CO2 emission factorcompared with solid and liquid fossil fuels, and the shiftto this cleaner fuel has already reduced the impact ofCO2 emissions on the economy.
The emission of CO2 from biomass was 49,714 Gg,with the industrial and residential sectors accounting for15,310 Gg (31 percent) and 34,405 Gg (69 percent oftotal emissions), respectively.
For an overview of the trend in CO2 emissions duringthe last few years, Figure 1.5 summarizes the contributionto overall CO2 emissions of the different fuel sourcesduring 1994-1997. The overall trend in CO2 emissionsduring 1994-1997 was for CO2 emissions to increase inall sectors. From only 125,483 Gg in 1994, the total CO2
emission was estimated to reach 147,200 Gg in 1997.
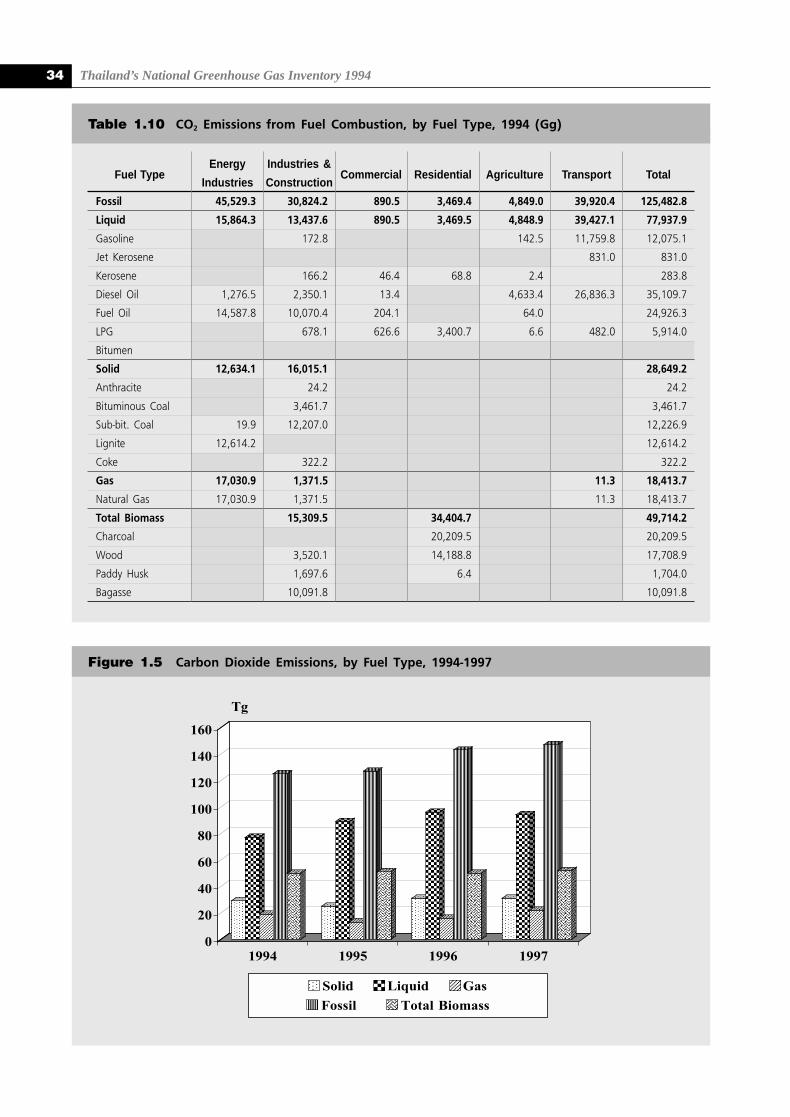
Thailand’s National Greenhouse Gas Inventory 199434
Fuel TypeEnergy Industries &
Commercial Residential Agriculture Transport TotalIndustries Construction
Fossil 45,529.3 30,824.2 890.5 3,469.4 4,849.0 39,920.4 125,482.8
Liquid 15,864.3 13,437.6 890.5 3,469.5 4,848.9 39,427.1 77,937.9
Gasoline 172.8 142.5 11,759.8 12,075.1
Jet Kerosene 831.0 831.0
Kerosene 166.2 46.4 68.8 2.4 283.8
Diesel Oil 1,276.5 2,350.1 13.4 4,633.4 26,836.3 35,109.7
Fuel Oil 14,587.8 10,070.4 204.1 64.0 24,926.3
LPG 678.1 626.6 3,400.7 6.6 482.0 5,914.0
Bitumen
Solid 12,634.1 16,015.1 28,649.2
Anthracite 24.2 24.2
Bituminous Coal 3,461.7 3,461.7
Sub-bit. Coal 19.9 12,207.0 12,226.9
Lignite 12,614.2 12,614.2
Coke 322.2 322.2
Gas 17,030.9 1,371.5 11.3 18,413.7
Natural Gas 17,030.9 1,371.5 11.3 18,413.7
Total Biomass 15,309.5 34,404.7 49,714.2
Charcoal 20,209.5 20,209.5
Wood 3,520.1 14,188.8 17,708.9
Paddy Husk 1,697.6 6.4 1,704.0
Bagasse 10,091.8 10,091.8
Table 1.10 CO2 Emissions from Fuel Combustion, by Fuel Type, 1994 (Gg)
Figure 1.5 Carbon Dioxide Emissions, by Fuel Type, 1994-1997
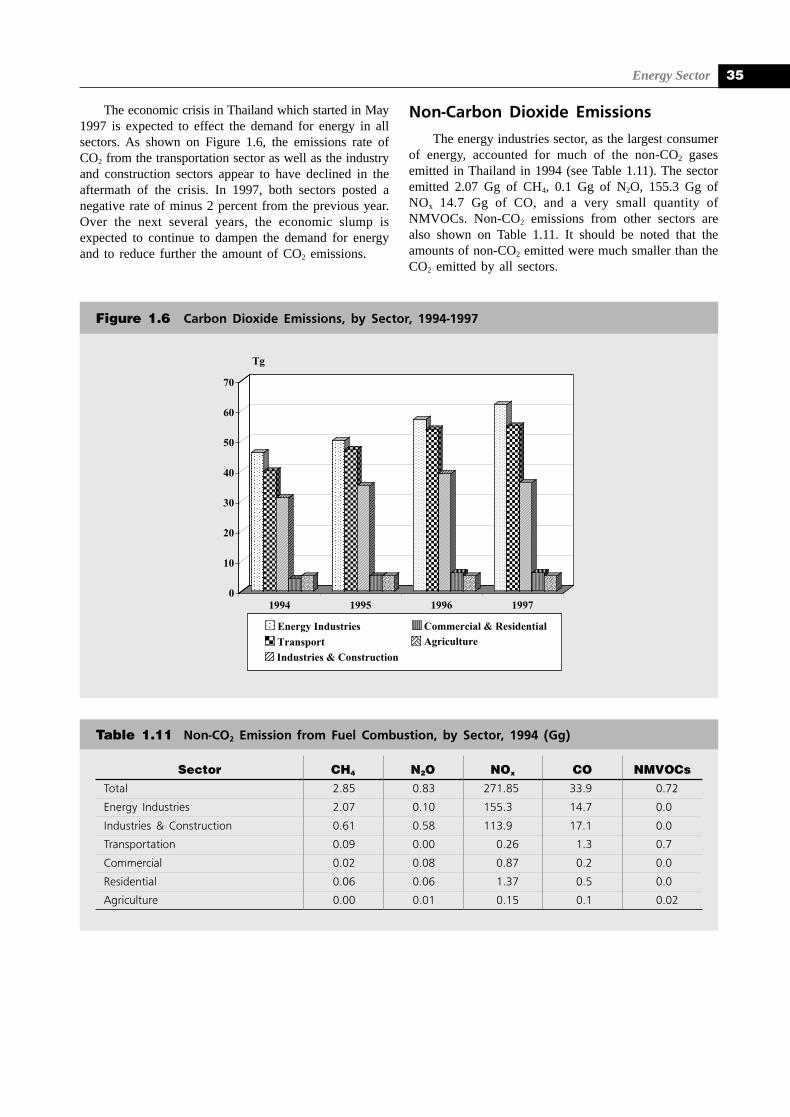
Energy Sector 35
Figure 1.6 Carbon Dioxide Emissions, by Sector, 1994-1997
The economic crisis in Thailand which started in May1997 is expected to effect the demand for energy in allsectors. As shown on Figure 1.6, the emissions rate ofCO2 from the transportation sector as well as the industryand construction sectors appear to have declined in theaftermath of the crisis. In 1997, both sectors posted anegative rate of minus 2 percent from the previous year.Over the next several years, the economic slump isexpected to continue to dampen the demand for energyand to reduce further the amount of CO2 emissions.
Non-Carbon Dioxide Emissions
The energy industries sector, as the largest consumerof energy, accounted for much of the non-CO2 gasesemitted in Thailand in 1994 (see Table 1.11). The sectoremitted 2.07 Gg of CH4, 0.1 Gg of N2O, 155.3 Gg ofNOx 14.7 Gg of CO, and a very small quantity ofNMVOCs. Non-CO2 emissions from other sectors arealso shown on Table 1.11. It should be noted that theamounts of non-CO2 emitted were much smaller than theCO2 emitted by all sectors.
Sector CH4 N2O NOx CO NMVOCsTotal 2.85 0.83 271.85 33.9 0.72
Energy Industries 2.07 0.10 155.3 14.7 0.0
Industries & Construction 0.61 0.58 113.9 17.1 0.0
Transportation 0.09 0.00 0.26 1.3 0.7
Commercial 0.02 0.08 0.87 0.2 0.0
Residential 0.06 0.06 1.37 0.5 0.0
Agriculture 0.00 0.01 0.15 0.1 0.02
Table 1.11 Non-CO2 Emission from Fuel Combustion, by Sector, 1994 (Gg)
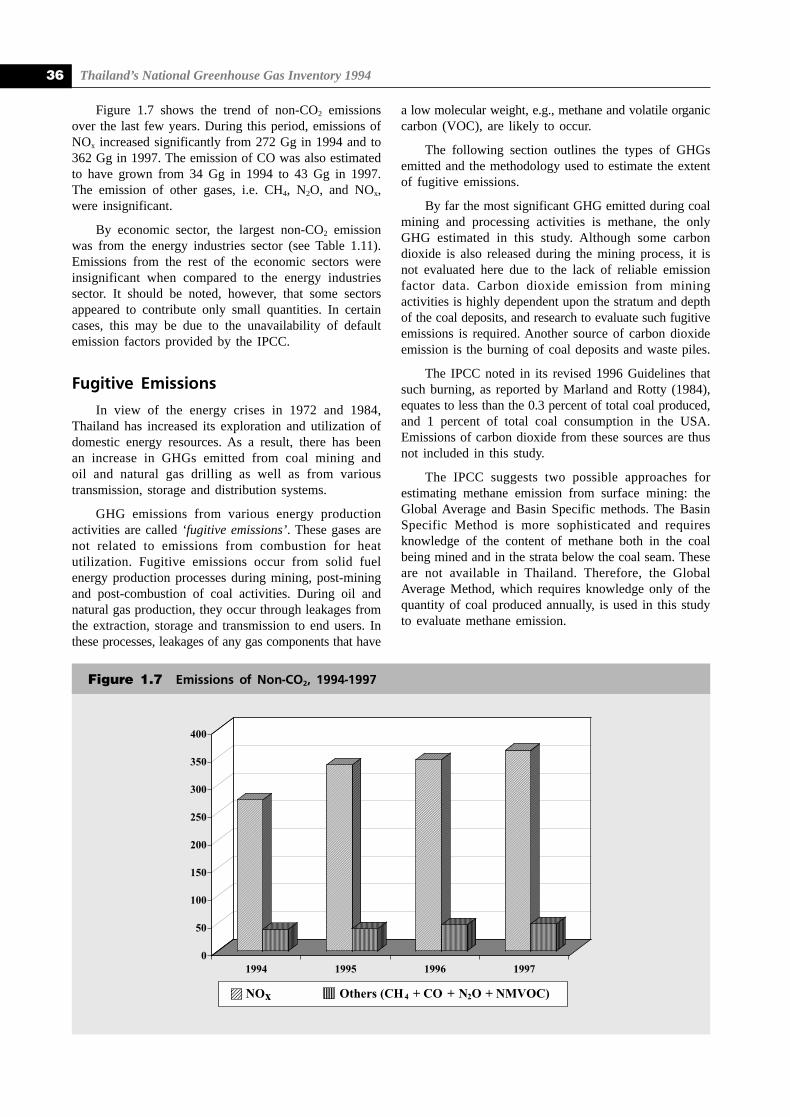
Thailand’s National Greenhouse Gas Inventory 199436
Figure 1.7 shows the trend of non-CO2 emissionsover the last few years. During this period, emissions ofNOx increased significantly from 272 Gg in 1994 and to362 Gg in 1997. The emission of CO was also estimatedto have grown from 34 Gg in 1994 to 43 Gg in 1997.The emission of other gases, i.e. CH4, N2O, and NOx,were insignificant.
By economic sector, the largest non-CO2 emissionwas from the energy industries sector (see Table 1.11).Emissions from the rest of the economic sectors wereinsignificant when compared to the energy industriessector. It should be noted, however, that some sectorsappeared to contribute only small quantities. In certaincases, this may be due to the unavailability of defaultemission factors provided by the IPCC.
Fugitive Emissions
In view of the energy crises in 1972 and 1984,Thailand has increased its exploration and utilization ofdomestic energy resources. As a result, there has beenan increase in GHGs emitted from coal mining andoil and natural gas drilling as well as from varioustransmission, storage and distribution systems.
GHG emissions from various energy productionactivities are called ‘fugitive emissions’. These gases arenot related to emissions from combustion for heatutilization. Fugitive emissions occur from solid fuelenergy production processes during mining, post-miningand post-combustion of coal activities. During oil andnatural gas production, they occur through leakages fromthe extraction, storage and transmission to end users. Inthese processes, leakages of any gas components that have
a low molecular weight, e.g., methane and volatile organiccarbon (VOC), are likely to occur.
The following section outlines the types of GHGsemitted and the methodology used to estimate the extentof fugitive emissions.
By far the most significant GHG emitted during coalmining and processing activities is methane, the onlyGHG estimated in this study. Although some carbondioxide is also released during the mining process, it isnot evaluated here due to the lack of reliable emissionfactor data. Carbon dioxide emission from miningactivities is highly dependent upon the stratum and depthof the coal deposits, and research to evaluate such fugitiveemissions is required. Another source of carbon dioxideemission is the burning of coal deposits and waste piles.
The IPCC noted in its revised 1996 Guidelines thatsuch burning, as reported by Marland and Rotty (1984),equates to less than the 0.3 percent of total coal produced,and 1 percent of total coal consumption in the USA.Emissions of carbon dioxide from these sources are thusnot included in this study.
The IPCC suggests two possible approaches forestimating methane emission from surface mining: theGlobal Average and Basin Specific methods. The BasinSpecific Method is more sophisticated and requiresknowledge of the content of methane both in the coalbeing mined and in the strata below the coal seam. Theseare not available in Thailand. Therefore, the GlobalAverage Method, which requires knowledge only of thequantity of coal produced annually, is used in this studyto evaluate methane emission.
Figure 1.7 Emissions of Non-CO2, 1994-1997
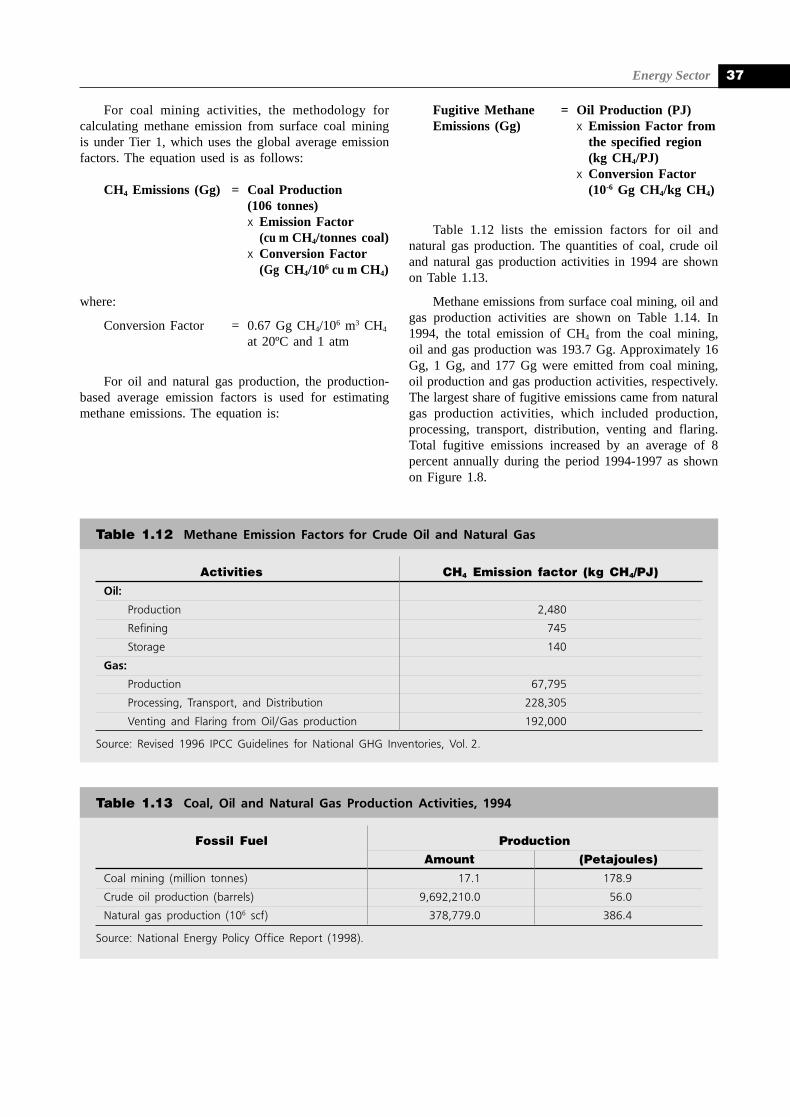
Energy Sector 37
Activities CH4 Emission factor (kg CH4/PJ)
Oil:
Production 2,480
Refining 745
Storage 140
Gas:
Production 67,795
Processing, Transport, and Distribution 228,305
Venting and Flaring from Oil/Gas production 192,000
Source: Revised 1996 IPCC Guidelines for National GHG Inventories, Vol. 2.
Table 1.12 Methane Emission Factors for Crude Oil and Natural Gas
Fossil Fuel ProductionAmount (Petajoules)
Coal mining (million tonnes) 17.1 178.9
Crude oil production (barrels) 9,692,210.0 56.0
Natural gas production (106 scf) 378,779.0 386.4
Source: National Energy Policy Office Report (1998).
Table 1.13 Coal, Oil and Natural Gas Production Activities, 1994
For coal mining activities, the methodology forcalculating methane emission from surface coal miningis under Tier 1, which uses the global average emissionfactors. The equation used is as follows:
CH4 Emissions (Gg) = Coal Production(106 tonnes)x Emission Factor
(cu m CH4/tonnes coal)x Conversion Factor
(Gg CH4/106 cu m CH4)
where:
Conversion Factor = 0.67 Gg CH4/106 m3 CH4
at 20ºC and 1 atm
For oil and natural gas production, the production-based average emission factors is used for estimatingmethane emissions. The equation is:
Fugitive Methane = Oil Production (PJ)Emissions (Gg) x Emission Factor from
the specified region(kg CH4/PJ)
x Conversion Factor(10-6 Gg CH4/kg CH4)
Table 1.12 lists the emission factors for oil andnatural gas production. The quantities of coal, crude oiland natural gas production activities in 1994 are shownon Table 1.13.
Methane emissions from surface coal mining, oil andgas production activities are shown on Table 1.14. In1994, the total emission of CH4 from the coal mining,oil and gas production was 193.7 Gg. Approximately 16Gg, 1 Gg, and 177 Gg were emitted from coal mining,oil production and gas production activities, respectively.The largest share of fugitive emissions came from naturalgas production activities, which included production,processing, transport, distribution, venting and flaring.Total fugitive emissions increased by an average of 8percent annually during the period 1994-1997 as shownon Figure 1.8.
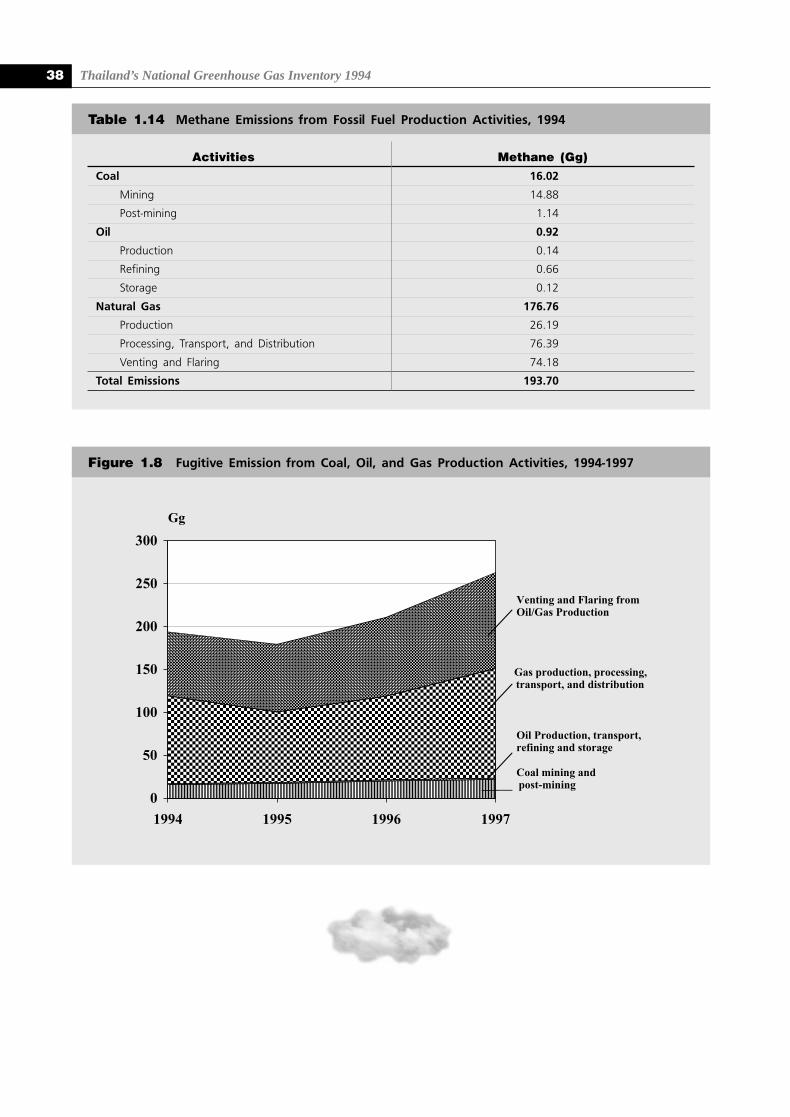
Thailand’s National Greenhouse Gas Inventory 199438
Activities Methane (Gg)
Coal 16.02
Mining 14.88
Post-mining 1.14
Oil 0.92
Production 0.14
Refining 0.66
Storage 0.12
Natural Gas 176.76
Production 26.19
Processing, Transport, and Distribution 76.39
Venting and Flaring 74.18
Total Emissions 193.70
Table 1.14 Methane Emissions from Fossil Fuel Production Activities, 1994
Figure 1.8 Fugitive Emission from Coal, Oil, and Gas Production Activities, 1994-1997
Energy Sector 39
Department of Energy Development and Promotion(DEDP). Thailand Energy Situation, 1994. Ministryof Science, Technology and the Environment. 1995.
Department of Energy Development and Promotion(DEDP). Thailand Energy Situation, 1997. Ministryof Science, Technology and the Environment. 1998.
Ekasilp, Wannie. “Co-generation Potential of Rice Millsin Thailand”. Doctoral Thesis. School of Energy andMaterials, King Mongkut Institute of Technology-Thonburi. 1996.
Electricity Generating Authority of Thailand (EGAT).Power Development Plan, PDP-98-01. GenerationSystem Development Planning Department, SystemPlanning Division. 1998.
Hoamuangkaew, W. “Demand for and Supply ofEucalyptus Camaldulensis in the East Region ofThailand.” Paper presented at IUFRO All Division 5Conference: Forest Products for Sustainable Forestry.Washington State University, Pullman, Washington,USA. 1-12 July 1997.
Intergovernmental Panel on Climate Change (IPCC).Revised 1996 Guidelines for National GreenhouseGas Inventories, Vol. 2. Organization for EconomicCo-operation and Development (OECD), 1995.
Jivacate, C. “Alternative Sources of Energy forElectricity.” In Proceedings of Techno Indochina,NSTDA, Bangkok. 1994, pp. 141-142.
Kirtikara, K. “Review of Solar PV Development inASEAN.” 31st Annual Meeting of Australia and NewZealand Solar Energy Society. Fremantle, Australia.1993.
Soponronnarit, S. “Status of Research and Developmenton Solar Thermal Energy.” Report Prepared for theNational Research Council of Thailand, 1997.
Wibulswas, P. and Khummongkok, P. “Renewable Energyfor Mitigating Greenhouse Gases: Case Study ofThailand.” Paper presented at the Conference on Newand Renewable Energy Resources. Manila,Philippines. 25-26 June 1998.
REFERENCES:

2C H A P T E R
INDUSTRIAL PROCESS SECTOR
● Introduction
● Methodology
● Data
● Results
b y P o j a n i e K h u m m o n g k o l
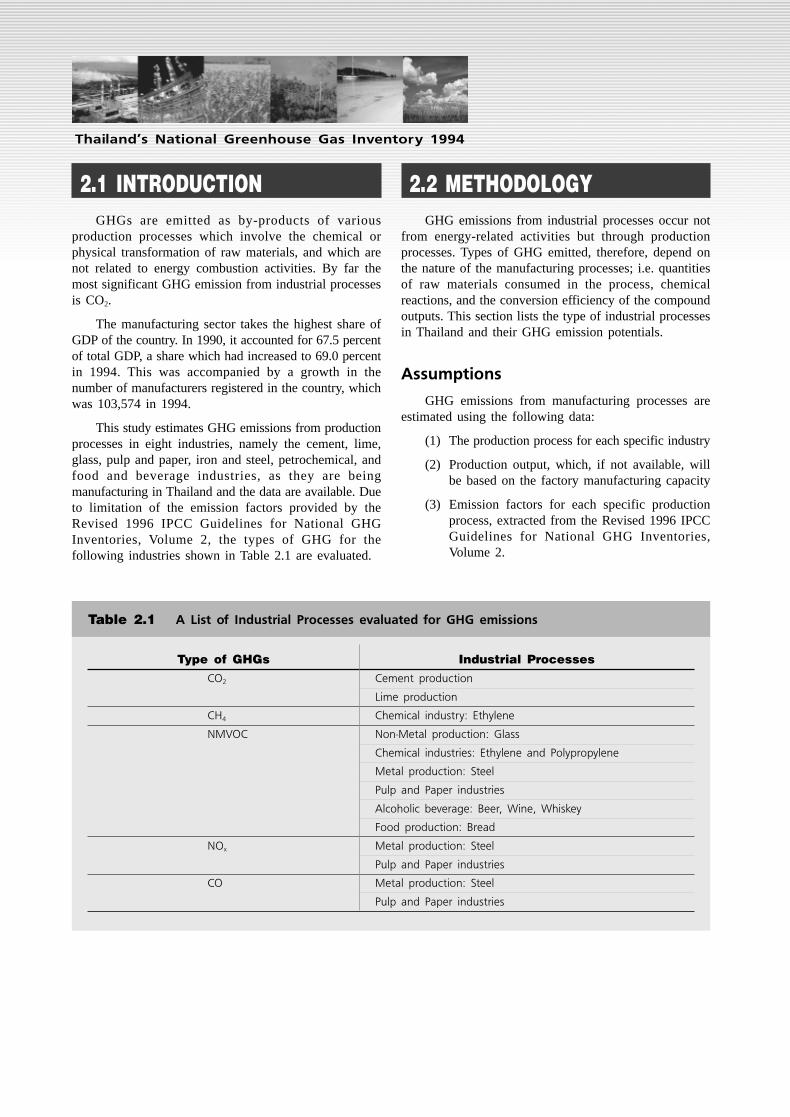
Thailand’s National Greenhouse Gas Inventory 199442
Thailand’s National Greenhouse Gas Inventory 1994
2.1 INTRODUCTIONGHGs are emitted as by-products of various
production processes which involve the chemical orphysical transformation of raw materials, and which arenot related to energy combustion activities. By far themost significant GHG emission from industrial processesis CO2.
The manufacturing sector takes the highest share ofGDP of the country. In 1990, it accounted for 67.5 percentof total GDP, a share which had increased to 69.0 percentin 1994. This was accompanied by a growth in thenumber of manufacturers registered in the country, whichwas 103,574 in 1994.
This study estimates GHG emissions from productionprocesses in eight industries, namely the cement, lime,glass, pulp and paper, iron and steel, petrochemical, andfood and beverage industries, as they are beingmanufacturing in Thailand and the data are available. Dueto limitation of the emission factors provided by theRevised 1996 IPCC Guidelines for National GHGInventories, Volume 2, the types of GHG for thefollowing industries shown in Table 2.1 are evaluated.
2.2 METHODOLOGYGHG emissions from industrial processes occur not
from energy-related activities but through productionprocesses. Types of GHG emitted, therefore, depend onthe nature of the manufacturing processes; i.e. quantitiesof raw materials consumed in the process, chemicalreactions, and the conversion efficiency of the compoundoutputs. This section lists the type of industrial processesin Thailand and their GHG emission potentials.
Assumptions
GHG emissions from manufacturing processes areestimated using the following data:
(1) The production process for each specific industry
(2) Production output, which, if not available, willbe based on the factory manufacturing capacity
(3) Emission factors for each specific productionprocess, extracted from the Revised 1996 IPCCGuidelines for National GHG Inventories,Volume 2.
Type of GHGs Industrial Processes
CO2 Cement production
Lime production
CH4 Chemical industry: Ethylene
NMVOC Non-Metal production: Glass
Chemical industries: Ethylene and Polypropylene
Metal production: Steel
Pulp and Paper industries
Alcoholic beverage: Beer, Wine, Whiskey
Food production: Bread
NOx Metal production: Steel
Pulp and Paper industries
CO Metal production: Steel
Pulp and Paper industries
Table 2.1 A List of Industrial Processes evaluated for GHG emissions

Industrial Process Sector 43
Calculations
TOTALij = Aj x EFij
Where:
TOTALij = the process emission (tonnes) of gas ifrom industrial sector j
Aj = the amount of activity or productionof process Material in industrial sectorj (tonnes/yr)
EFij = the emission factor associated withgas i per unit of activity in industrialsector j (tonne/tonne)
Cement Production
Raw materials used in the production of Portlandcement include limestonne (CaCO3), bauxite, aluminumdross, sand, and iron. These raw materials are finelyground, mixed, and heated in a rotary kiln to form cementclinker. The major concern in this GHG study is thatduring the calcination process which produces cementclinker, a large quantity of CO2 is emitted. The reactionwhich takes place is
CaCO3 + heat r CaO + CO2
The mass balance for CO2 emission is that forevery 1 mole of CaCO3 burned, 1 mole of CO2 will beproduced, or in terms of weight ratio: 0.4396 tonnesCO2 per tonne CaCO3 burned, or 0.7857 tonnes CO2 pertonne CaO produced. Since clinker is mixed with gypsum,which contains less lime per unit, to make cement-clinkerwhich has a higher lime content than finished cement,the emission factor in terms of per unit clinker is 0.5071tonnes CO2 per tonne clinker produced. The mostconvenient emission factor to use is expressed in tonnesCO2 per tonnes cement, since data on cement productionis reported annually. In this case, its value is 0.4985tonnes CO2 per tonne cement produced.
Lime Manufacturing
The production process of lime is similar to that ofcement, in that CO2 occurs via the calcination oflimestone. The reaction equation is
CaCO3 + heat r CaO + CO2
The stoichiometric balance of the equation is 1 moleCO2 per 1 mole CaCO3. The emission factor for theprocess is 0.79 tonnes CO2 per tonne quicklime produced.
Glass Production
95 percent of all glass manufactured in the worlduses the soda-lime process. The raw materials used tomake flat glass consist of: sand 47 percent, soda ash 16percent, salt cake 6 percent, powdered coal 0.2 percent,
lime 7 percent, cullet 23 percent, and other 0.8 percentby weight.
The general process reactions are:
Na2CO3 + aSiO2 r Na2O ● aSiO2 + CO2 (1)
aCO3 + bSiO2 r CaO ● bSiO2 + CO2 (2)
Na2SO4 + cSiO2 + C r Na2O ● cSiO2 + SO2 + CO (3)
To produce flat glass, the material mole ratio is 1.5mole Na2O: 1 mole CaO: 5 moles SiO2.
The process mole balance equations for glass are:
1.5Na2CO3 + 5SiO2 r 1.5Na2O ● 5SiO2 + 1.5CO2 (1)
CaCO3 + 5SiO2 r CaO ● 5SiO2 + CO2 (2)
1.5Na2SO4 + 5SiO2 +1.5 C r1.5Na2O ● 5SiO2 + 1.5SO2 + 1.5CO (3)
The mole balance is 2.5 moles CO2 per 1.5 molesNa2O ● 5SiO2 produced. The emission factor for CO2 interms of unit weight is 0.1315 tonnes per tonne flat glass.
Emission Factors for CO2 is not available by theIPCC. For other GHGs, only NMVOC is listed in theRevised 1996 IPCC Guideline with the value of 4.5 kgper tonne of product.
Pulping Process
The production of pulp and paper involves threemajor processing steps: pulping, bleaching and paperproduction. There are two main processes: Kraft pulpingand the Sulphite pulping. In Thailand most of the pulpingindustries used the Kraft pulping process.
Primary raw materials required to produce 1 tonneof dry pulp in the Kraft or sulphite pulping processesare consisted of: Wood 1.5-2 tonnes, Lime 250 kg, andSoda ash 125 kg.
CO2 evolves from the black liquor recovery process.The mole balance reactions are:
Na2SO4 + 2C r Na2S + 2CO2 (1)
CaCO3 + heat r CaO + CO2 (2)
The two equations above occur independently. Theprocess mole ratios are 2 moles CO2 per 1 mole Na2SO4
and 1 mole CO2 per 1 mole CaCO3. The emission factorof CO2 per unit weight is 0.2072 tonnes per tonne ofpulping product.
According to the Revised 1996 IPCC Guideline, theemission factor for NMVOC is 3.7 kg per tonne driedpulp.
Iron and Steel Production
Iron and Steel production in Thailand is a small-scale.The integrated facility (coke plus iron and/or steelproduction) was planned before the economic crisis but
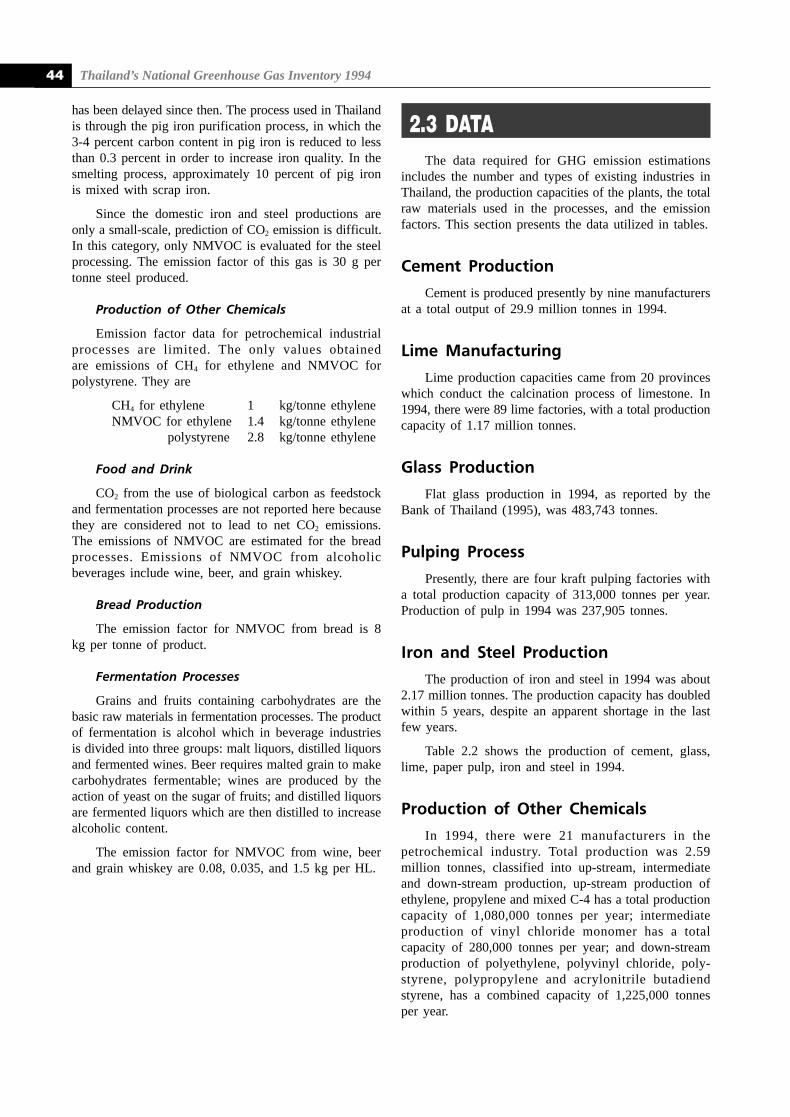
Thailand’s National Greenhouse Gas Inventory 199444
has been delayed since then. The process used in Thailandis through the pig iron purification process, in which the3-4 percent carbon content in pig iron is reduced to lessthan 0.3 percent in order to increase iron quality. In thesmelting process, approximately 10 percent of pig ironis mixed with scrap iron.
Since the domestic iron and steel productions areonly a small-scale, prediction of CO2 emission is difficult.In this category, only NMVOC is evaluated for the steelprocessing. The emission factor of this gas is 30 g pertonne steel produced.
Production of Other Chemicals
Emission factor data for petrochemical industrialprocesses are limited. The only values obtainedare emissions of CH4 for ethylene and NMVOC forpolystyrene. They are
CH4 for ethylene 1 kg/tonne ethyleneNMVOC for ethylene 1.4 kg/tonne ethylene
polystyrene 2.8 kg/tonne ethylene
Food and Drink
CO2 from the use of biological carbon as feedstockand fermentation processes are not reported here becausethey are considered not to lead to net CO2 emissions.The emissions of NMVOC are estimated for the breadprocesses. Emissions of NMVOC from alcoholicbeverages include wine, beer, and grain whiskey.
Bread Production
The emission factor for NMVOC from bread is 8kg per tonne of product.
Fermentation Processes
Grains and fruits containing carbohydrates are thebasic raw materials in fermentation processes. The productof fermentation is alcohol which in beverage industriesis divided into three groups: malt liquors, distilled liquorsand fermented wines. Beer requires malted grain to makecarbohydrates fermentable; wines are produced by theaction of yeast on the sugar of fruits; and distilled liquorsare fermented liquors which are then distilled to increasealcoholic content.
The emission factor for NMVOC from wine, beerand grain whiskey are 0.08, 0.035, and 1.5 kg per HL.
2.3 DATAThe data required for GHG emission estimations
includes the number and types of existing industries inThailand, the production capacities of the plants, the totalraw materials used in the processes, and the emissionfactors. This section presents the data utilized in tables.
Cement Production
Cement is produced presently by nine manufacturersat a total output of 29.9 million tonnes in 1994.
Lime Manufacturing
Lime production capacities came from 20 provinceswhich conduct the calcination process of limestone. In1994, there were 89 lime factories, with a total productioncapacity of 1.17 million tonnes.
Glass Production
Flat glass production in 1994, as reported by theBank of Thailand (1995), was 483,743 tonnes.
Pulping Process
Presently, there are four kraft pulping factories witha total production capacity of 313,000 tonnes per year.Production of pulp in 1994 was 237,905 tonnes.
Iron and Steel Production
The production of iron and steel in 1994 was about2.17 million tonnes. The production capacity has doubledwithin 5 years, despite an apparent shortage in the lastfew years.
Table 2.2 shows the production of cement, glass,lime, paper pulp, iron and steel in 1994.
Production of Other Chemicals
In 1994, there were 21 manufacturers in thepetrochemical industry. Total production was 2.59million tonnes, classified into up-stream, intermediateand down-stream production, up-stream production ofethylene, propylene and mixed C-4 has a total productioncapacity of 1,080,000 tonnes per year; intermediateproduction of vinyl chloride monomer has a totalcapacity of 280,000 tonnes per year; and down-streamproduction of polyethylene, polyvinyl chloride, poly-styrene, polypropylene and acrylonitrile butadiendstyrene, has a combined capacity of 1,225,000 tonnesper year.
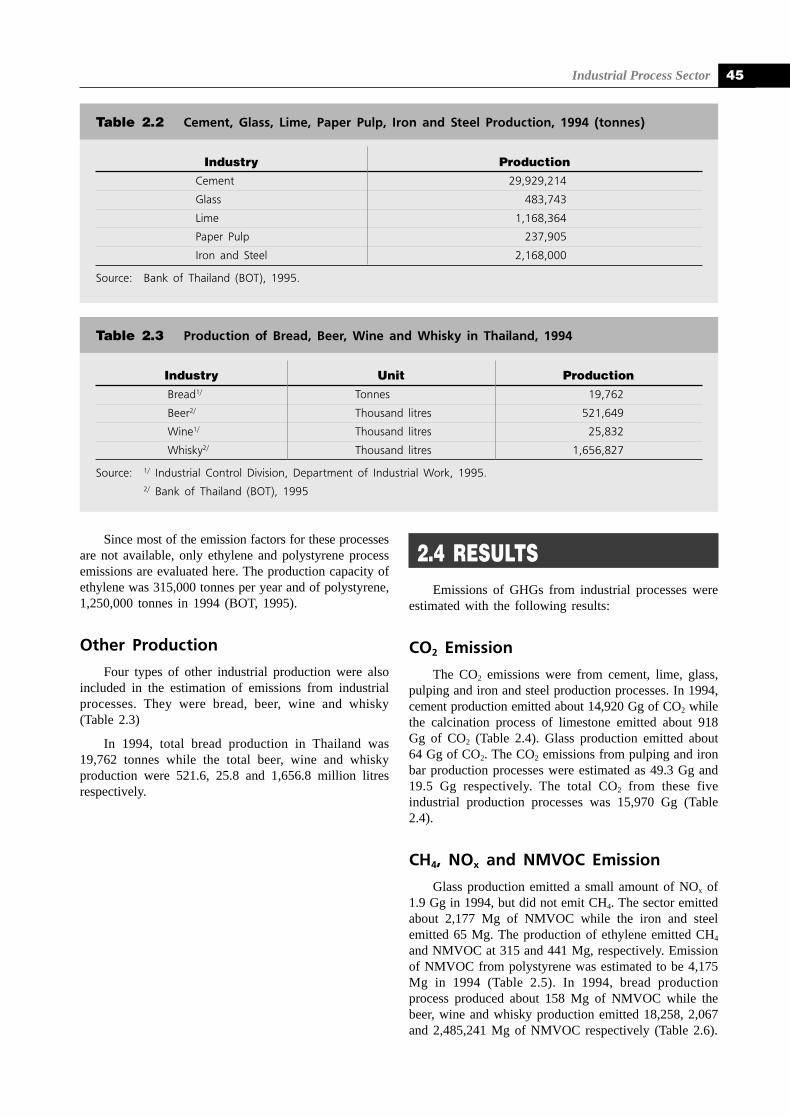
Industrial Process Sector 45
Since most of the emission factors for these processesare not available, only ethylene and polystyrene processemissions are evaluated here. The production capacity ofethylene was 315,000 tonnes per year and of polystyrene,1,250,000 tonnes in 1994 (BOT, 1995).
Other Production
Four types of other industrial production were alsoincluded in the estimation of emissions from industrialprocesses. They were bread, beer, wine and whisky(Table 2.3)
In 1994, total bread production in Thailand was19,762 tonnes while the total beer, wine and whiskyproduction were 521.6, 25.8 and 1,656.8 million litresrespectively.
Industry Unit Production
Bread1/ Tonnes 19,762
Beer2/ Thousand litres 521,649
Wine1/ Thousand litres 25,832
Whisky2/ Thousand litres 1,656,827
Source: 1/ Industrial Control Division, Department of Industrial Work, 1995.2/ Bank of Thailand (BOT), 1995
Table 2.3 Production of Bread, Beer, Wine and Whisky in Thailand, 1994
Industry ProductionCement 29,929,214
Glass 483,743
Lime 1,168,364
Paper Pulp 237,905
Iron and Steel 2,168,000
Source: Bank of Thailand (BOT), 1995.
Table 2.2 Cement, Glass, Lime, Paper Pulp, Iron and Steel Production, 1994 (tonnes)
2.4 RESULTSEmissions of GHGs from industrial processes were
estimated with the following results:
CO2 Emission
The CO2 emissions were from cement, lime, glass,pulping and iron and steel production processes. In 1994,cement production emitted about 14,920 Gg of CO2 whilethe calcination process of limestone emitted about 918Gg of CO2 (Table 2.4). Glass production emitted about64 Gg of CO2. The CO2 emissions from pulping and ironbar production processes were estimated as 49.3 Gg and19.5 Gg respectively. The total CO2 from these fiveindustrial production processes was 15,970 Gg (Table2.4).
CH4, NOx and NMVOC Emission
Glass production emitted a small amount of NOx of1.9 Gg in 1994, but did not emit CH4. The sector emittedabout 2,177 Mg of NMVOC while the iron and steelemitted 65 Mg. The production of ethylene emitted CH4
and NMVOC at 315 and 441 Mg, respectively. Emissionof NMVOC from polystyrene was estimated to be 4,175Mg in 1994 (Table 2.5). In 1994, bread productionprocess produced about 158 Mg of NMVOC while thebeer, wine and whisky production emitted 18,258, 2,067and 2,485,241 Mg of NMVOC respectively (Table 2.6).
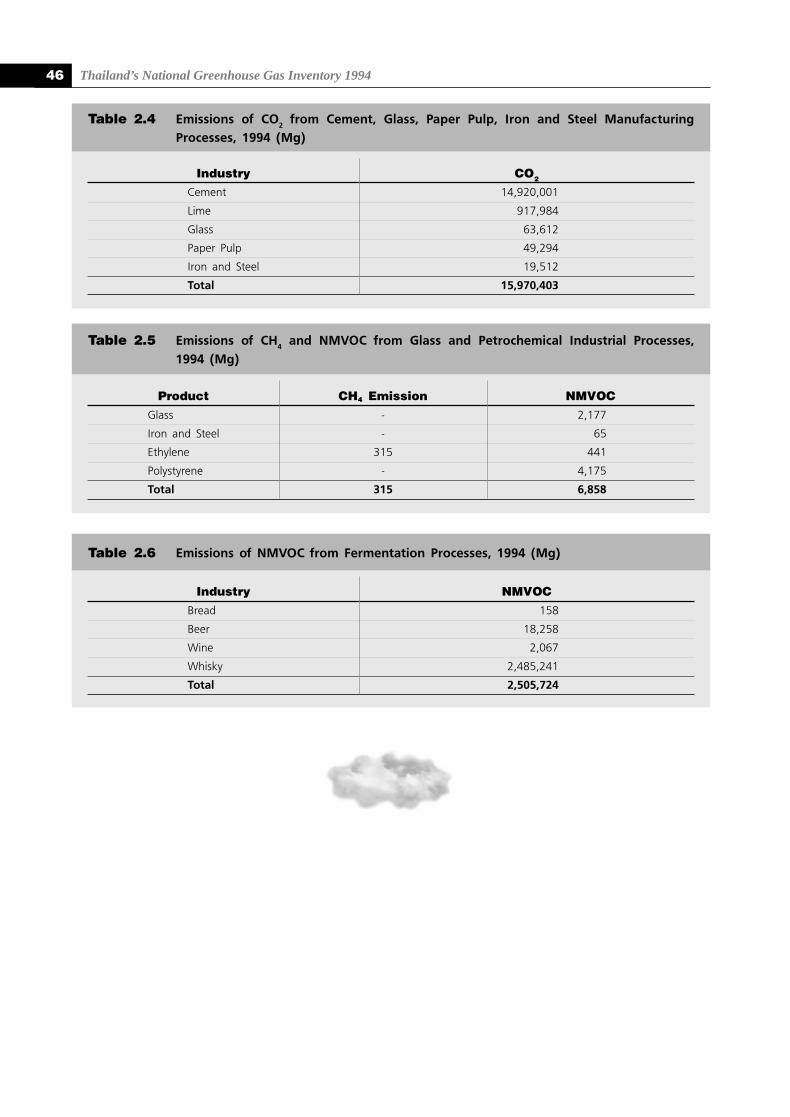
Thailand’s National Greenhouse Gas Inventory 199446
Product CH4 Emission NMVOC
Glass - 2,177
Iron and Steel - 65
Ethylene 315 441
Polystyrene - 4,175
Total 315 6,858
Table 2.5 Emissions of CH4 and NMVOC from Glass and Petrochemical Industrial Processes,
1994 (Mg)
Industry NMVOC
Bread 158
Beer 18,258
Wine 2,067
Whisky 2,485,241
Total 2,505,724
Table 2.6 Emissions of NMVOC from Fermentation Processes, 1994 (Mg)
Industry CO2
Cement 14,920,001
Lime 917,984
Glass 63,612
Paper Pulp 49,294
Iron and Steel 19,512
Total 15,970,403
Table 2.4 Emissions of CO2 from Cement, Glass, Paper Pulp, Iron and Steel Manufacturing
Processes, 1994 (Mg)
Industrial Process Sector 47
Austin, G.T., 1984: Shreve’s Chemical Process Industries,Fifth Edition, McGraw-Hill International Editions,Chemical Engineering Series.
Bank of Thailand (BOT), 1995: Summary of Business-Industry in 1994 and Trend in 1995, Industry Unit,Research Division, Bank of Thailand 1995.
Factory Control Division, 1995. Department of IndustrialWorks.
Intergovernmental Panel on Climate Change (IPCC).Revised 1996 Guidelines for National GreenhouseGas Inventories, Vol. 2. Organization for EconomicCo-operation and Development (OECD), 1995.
REFERENCES:

Thailand’s National Greenhouse Gas Inventory 199450
Thailand’s National Greenhouse Gas Inventory 1994
3.1 INTRODUCTIONThe global emissions of methane (CH4) are estimated
to be approximately 550 Teragrams (Tg) per year.Methane is recognized as one of the most importantgreenhouse gases and may account for 20 percent ofanticipated global warming. Agriculture plays animportant role in supplying CH4 to atmosphere and isestimated to contribute more than 50 percent ofanthropogenic emissions. Flooded rice fields, whichoccupy about 148 million hectares (Mha) of global areaand produce about 475 Mt rice, emit about 11 percent oftotal global emissions of methane or 50-60 Tg CH4 peryr. However, the uncertainty of these estimates isextremely high, ranging from 20-100 Tg CH4 per yr. Thisis mainly due to the extreme spatial and temporalvariability of fluxes and heterogeniety of soil, water andcrop management practices, organic matter amendmentsand fertilization.
The emission of methane from paddy fields inThailand for crop year 1990 were estimated by TEI (1997)at 1.786 Tg per year, which is equivalent to 65 percentof total country emission of methane or 15 percent oftotal country global warming potential (GWP). The GWPof CH4 is about 21 times that of CO2 in 100 years. Thisestimate was based on the Intergovernmental Panel onClimate Change (IPCC) methodology (IPCC, 1995) andlocal values for emission factors, cropping periods andharvesting area. When all the IPCC default values wereused in the estimation, the country’s total methaneemission increased substantially to 4.4 Tg per year.
In this study, methane emission from paddy fields isestimated using the revised 1996 IPCC Guidelines forNational Greenhouse Gas Inventories (IPCC, 1997). Thisversion of the IPCC Guidelines recommends the inclusionof some of the factors that control methane emission frompaddy fields. The factors clearly identified by fieldexperiments as being most important are: (1) waterregimes, (2) inorganic fertilizer application, (3) organicfertilizer application, (4) soil type and soil texture,(5) variety of rice cultivars, and (6) cultural practice suchas transplanting or direct seeding.
Experimental data indicate that the continuousflooding of paddy fields, high carbon-nitrogen ratio(C/N) of organic fertilizer application, and use oftraditional rice cultivars induce higher methane emissioncompared to intermittent flooding, and/or absence oforganic fertilization. Paddy areas are thus subcategorizedbased on different biological, chemical and physicalfactors that control methane emission from paddy fields.In the latest IPCC guidelines, scaling factors that takeinto account the emissions from rice grown under different
water regimes relative to continuous flooding are given.Many studies have also confirmed that the addition oforganic matter to rice paddies strongly increases methaneemission. Hence, a correction factor of 2-5 wasrecommended to convert the emission rate of methanefrom paddy soils without organic amendment to thesewith organic amendment.
At present, there is insufficient data on methaneemission under such conditions in Thailand. The scalingfactors for methane emission of rice cultivated underdifferent water regimes and organic matter amendmentproposed by the IPCC (IPCC, 1997) are therefore usedin this estimation.
In the rice sector, emission projection and mitigationobtion analysis has also been discussed and the resultsare shown in the Appendix.
3.2 METHODOLOGYThis national inventory, which presents estimates of
methane emission from rice cultivation for crop year1994, is based on methodology provided in the latestIPCC Guidelines (IPCC, 1997). Emissions of methanefrom paddy fields under different water regimes andorganic matter amendment were estimated independentlyand combined to represent the country’s total emission.
The total area under rice cultivation, subcategorizedinto different water regimes, was obtained from theagricultural statistics of Ministry of Agriculture andCooperatives (Agricultural Statistics,1994/95). Emissionfactors used were actual methane emission data asmeasured by Jermsawatdipong, et al. (1993).
Assumptions
The assumptions set out for this estimation ofmethane emission from paddy fields are as follows:
● Base year. The estimation of methane emissionfrom paddy fields is based on the cultivation inthe year 1994.
● Paddy area. Paddy areas include the harvestingareas for both major rice (wet season crop) andsecond rice (dry season crop).
● Water regimes. Major rice is planted in all 4types of water regimes, namely, upland, irrigated(continuously flooded and intermittently flooded),rain-fed (flood prone and drought prone), anddeepwater areas, while second rice is planted onlyunder irrigated (continuously flooded) areas.
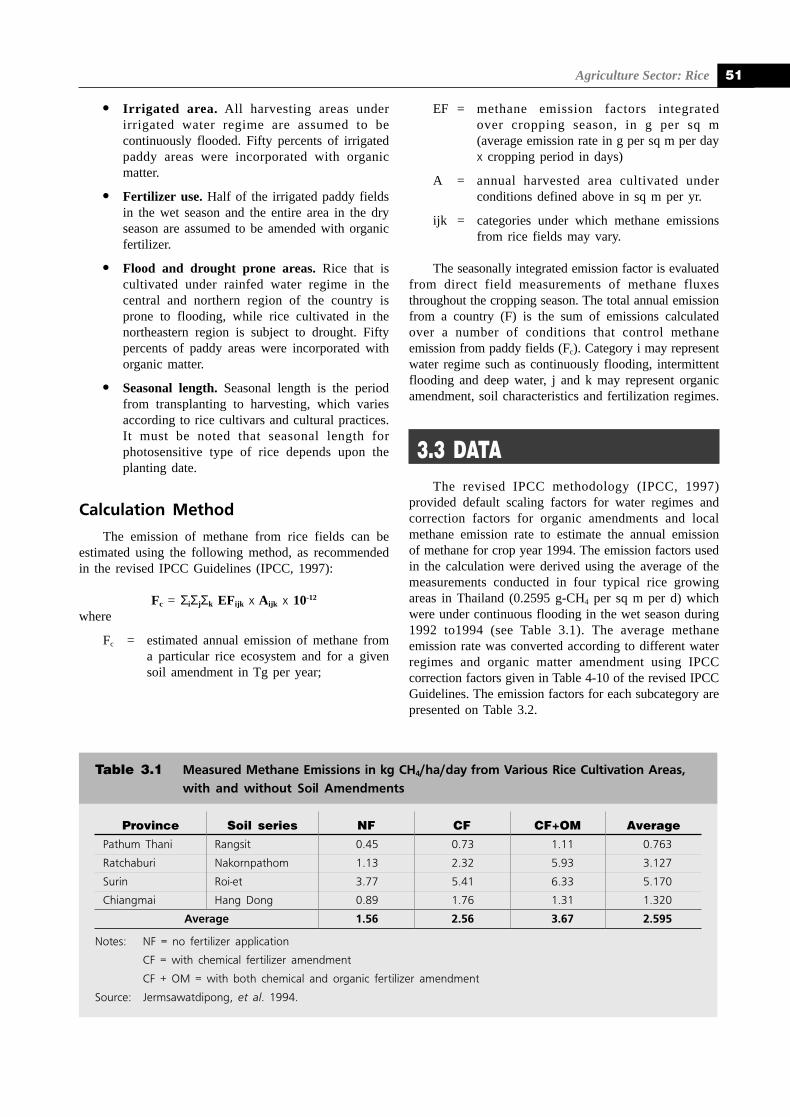
Agriculture Sector: Rice 51
Province Soil series NF CF CF+OM AveragePathum Thani Rangsit 0.45 0.73 1.11 0.763
Ratchaburi Nakornpathom 1.13 2.32 5.93 3.127
Surin Roi-et 3.77 5.41 6.33 5.170
Chiangmai Hang Dong 0.89 1.76 1.31 1.320
Average 1.56 2.56 3.67 2.595
Notes: NF = no fertilizer application
CF = with chemical fertilizer amendment
CF + OM = with both chemical and organic fertilizer amendment
Source: Jermsawatdipong, et al. 1994.
Table 3.1 Measured Methane Emissions in kg CH4/ha/day from Various Rice Cultivation Areas,with and without Soil Amendments
● Irrigated area. All harvesting areas underirrigated water regime are assumed to becontinuously flooded. Fifty percents of irrigatedpaddy areas were incorporated with organicmatter.
● Fertilizer use. Half of the irrigated paddy fieldsin the wet season and the entire area in the dryseason are assumed to be amended with organicfertilizer.
● Flood and drought prone areas. Rice that iscultivated under rainfed water regime in thecentral and northern region of the country isprone to flooding, while rice cultivated in thenortheastern region is subject to drought. Fiftypercents of paddy areas were incorporated withorganic matter.
● Seasonal length. Seasonal length is the periodfrom transplanting to harvesting, which variesaccording to rice cultivars and cultural practices.It must be noted that seasonal length forphotosensitive type of rice depends upon theplanting date.
Calculation Method
The emission of methane from rice fields can beestimated using the following method, as recommendedin the revised IPCC Guidelines (IPCC, 1997):
Fc = ΣiΣjΣk EFijk x Aijk x 10-12
where
Fc = estimated annual emission of methane froma particular rice ecosystem and for a givensoil amendment in Tg per year;
EF = methane emission factors integratedover cropping season, in g per sq m(average emission rate in g per sq m per dayx cropping period in days)
A = annual harvested area cultivated underconditions defined above in sq m per yr.
ijk = categories under which methane emissionsfrom rice fields may vary.
The seasonally integrated emission factor is evaluatedfrom direct field measurements of methane fluxesthroughout the cropping season. The total annual emissionfrom a country (F) is the sum of emissions calculatedover a number of conditions that control methaneemission from paddy fields (Fc). Category i may representwater regime such as continuously flooding, intermittentflooding and deep water, j and k may represent organicamendment, soil characteristics and fertilization regimes.
3.3 DATAThe revised IPCC methodology (IPCC, 1997)
provided default scaling factors for water regimes andcorrection factors for organic amendments and localmethane emission rate to estimate the annual emissionof methane for crop year 1994. The emission factors usedin the calculation were derived using the average of themeasurements conducted in four typical rice growingareas in Thailand (0.2595 g-CH4 per sq m per d) whichwere under continuous flooding in the wet season during1992 to1994 (see Table 3.1). The average methaneemission rate was converted according to different waterregimes and organic matter amendment using IPCCcorrection factors given in Table 4-10 of the revised IPCCGuidelines. The emission factors for each subcategory arepresented on Table 3.2.
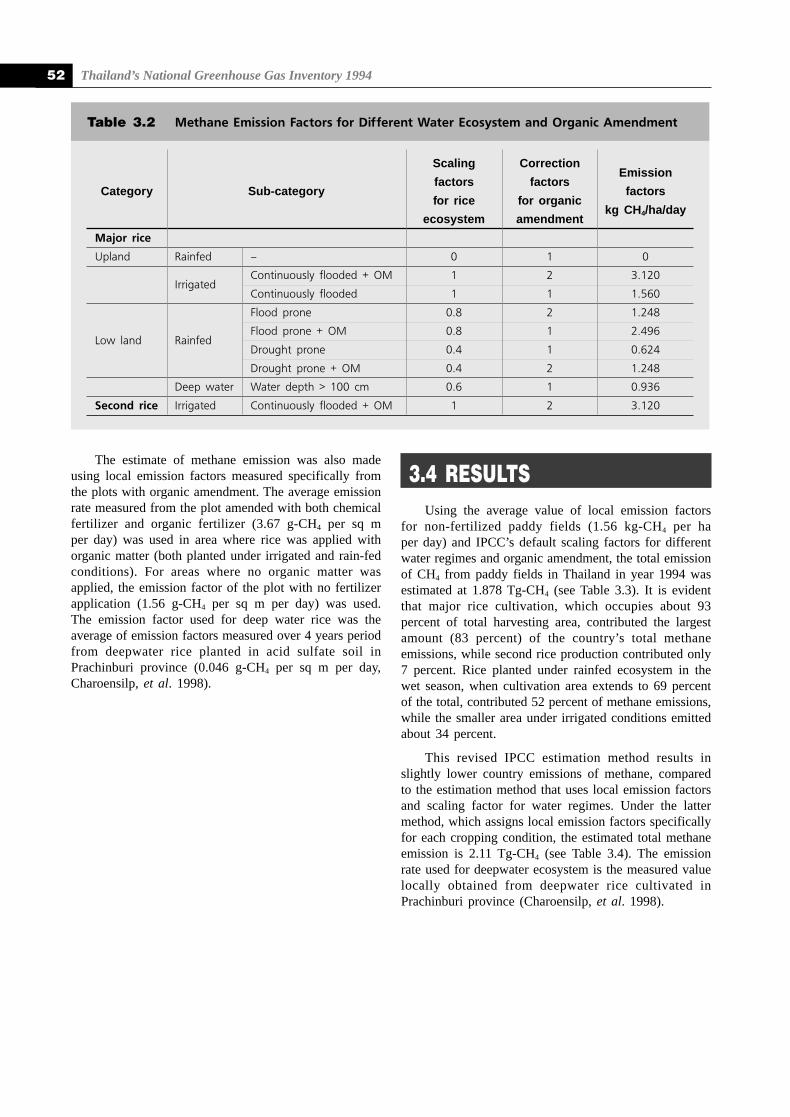
Thailand’s National Greenhouse Gas Inventory 199452
Scaling CorrectionEmission
Category Sub-categoryfactors factors
factorsfor rice for organic
kg CH4/ha/dayecosystem amendment
Major rice
Upland Rainfed – 0 1 0
IrrigatedContinuously flooded + OM 1 2 3.120
Continuously flooded 1 1 1.560
Flood prone 0.8 2 1.248
Low land RainfedFlood prone + OM 0.8 1 2.496
Drought prone 0.4 1 0.624
Drought prone + OM 0.4 2 1.248
Deep water Water depth > 100 cm 0.6 1 0.936
Second rice Irrigated Continuously flooded + OM 1 2 3.120
Table 3.2 Methane Emission Factors for Different Water Ecosystem and Organic Amendment
The estimate of methane emission was also madeusing local emission factors measured specifically fromthe plots with organic amendment. The average emissionrate measured from the plot amended with both chemicalfertilizer and organic fertilizer (3.67 g-CH4 per sq mper day) was used in area where rice was applied withorganic matter (both planted under irrigated and rain-fedconditions). For areas where no organic matter wasapplied, the emission factor of the plot with no fertilizerapplication (1.56 g-CH4 per sq m per day) was used.The emission factor used for deep water rice was theaverage of emission factors measured over 4 years periodfrom deepwater rice planted in acid sulfate soil inPrachinburi province (0.046 g-CH4 per sq m per day,Charoensilp, et al. 1998).
3.4 RESULTSUsing the average value of local emission factors
for non-fertilized paddy fields (1.56 kg-CH4 per haper day) and IPCC’s default scaling factors for differentwater regimes and organic amendment, the total emissionof CH4 from paddy fields in Thailand in year 1994 wasestimated at 1.878 Tg-CH4 (see Table 3.3). It is evidentthat major rice cultivation, which occupies about 93percent of total harvesting area, contributed the largestamount (83 percent) of the country’s total methaneemissions, while second rice production contributed only7 percent. Rice planted under rainfed ecosystem in thewet season, when cultivation area extends to 69 percentof the total, contributed 52 percent of methane emissions,while the smaller area under irrigated conditions emittedabout 34 percent.
This revised IPCC estimation method results inslightly lower country emissions of methane, comparedto the estimation method that uses local emission factorsand scaling factor for water regimes. Under the lattermethod, which assigns local emission factors specificallyfor each cropping condition, the estimated total methaneemission is 2.11 Tg-CH4 (see Table 3.4). The emissionrate used for deepwater ecosystem is the measured valuelocally obtained from deepwater rice cultivated inPrachinburi province (Charoensilp, et al. 1998).
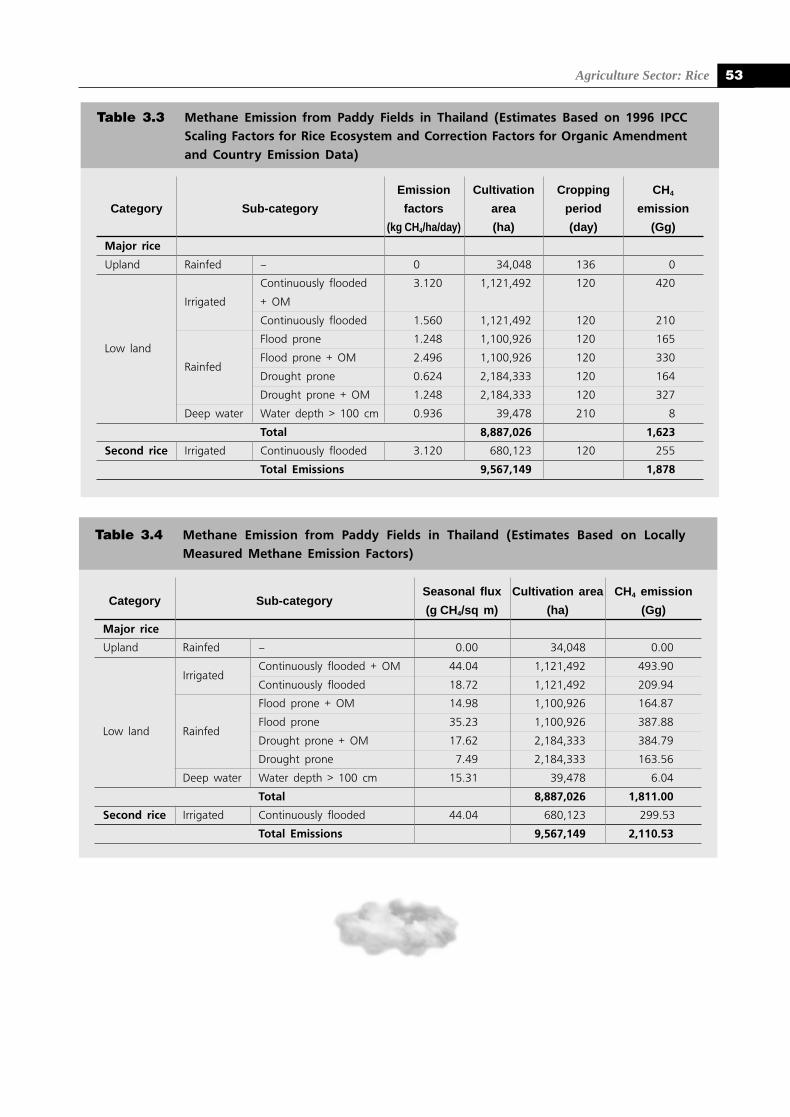
Agriculture Sector: Rice 53
Category Sub-categorySeasonal flux Cultivation area CH4 emission
(g CH4/sq m) (ha) (Gg)
Major rice
Upland Rainfed – 0.00 34,048 0.00
IrrigatedContinuously flooded + OM 44.04 1,121,492 493.90
Continuously flooded 18.72 1,121,492 209.94
Flood prone + OM 14.98 1,100,926 164.87
Low land RainfedFlood prone 35.23 1,100,926 387.88
Drought prone + OM 17.62 2,184,333 384.79
Drought prone 7.49 2,184,333 163.56
Deep water Water depth > 100 cm 15.31 39,478 6.04
Total 8,887,026 1,811.00
Second rice Irrigated Continuously flooded 44.04 680,123 299.53
Total Emissions 9,567,149 2,110.53
Table 3.4 Methane Emission from Paddy Fields in Thailand (Estimates Based on LocallyMeasured Methane Emission Factors)
Emission Cultivation Cropping CH4
Category Sub-category factors area period emission
(kg CH4/ha/day) (ha) (day) (Gg)
Major rice
Upland Rainfed – 0 34,048 136 0
Continuously flooded 3.120 1,121,492 120 420
Irrigated + OM
Continuously flooded 1.560 1,121,492 120 210
Low landFlood prone 1.248 1,100,926 120 165
RainfedFlood prone + OM 2.496 1,100,926 120 330
Drought prone 0.624 2,184,333 120 164
Drought prone + OM 1.248 2,184,333 120 327
Deep water Water depth > 100 cm 0.936 39,478 210 8
Total 8,887,026 1,623
Second rice Irrigated Continuously flooded 3.120 680,123 120 255
Total Emissions 9,567,149 1,878
Table 3.3 Methane Emission from Paddy Fields in Thailand (Estimates Based on 1996 IPCCScaling Factors for Rice Ecosystem and Correction Factors for Organic Amendmentand Country Emission Data)
Thailand’s National Greenhouse Gas Inventory 199454
Adhya, T.K., K. Bharati, S.R. Mohanty, S.R. Mishra,A.K. Rath, B. Ramakrishnan and V.R. Rao. 1998.Methane Emission from Rainfed Rice in Cuttack.Final Workshop and Annual Meeting, InterregionalResearch Programme on Methane Emission fromRice Fields (GLO/91/G31). IRRI-UNDP FinalWorkshop. Beijing and Hangzhou, 10-13 August1998.
Agricultural Statistics, 1996. Agricultural Statisticsof Thailand Crop Year 1994/1995. Ministry ofAgriculture and Cooperatives, Bangkok, Thailand.272 pp.
Bronson, K.F. and A.R. Mosier. 1991. Effect ofencapsulated calcium carbide on dinitrogen, nitrousoxide, methane, and carbon dioxide emission fromflooded rice. Biol. Fertil. Soils.11:116-120.
Buendia, L.V., R. Wassmann, R.S. Lantin, H.U. Neue,A.M. Javellana, C.S. Bueno, N. Nocon, A. Umali andL.A. Lubigan. 1998. Methane Emission from RainfedRice in Los Banos. Final Workshop and AnnualMeeting, Interregional Research Programme onMethane Emission from Rice Fields (GLO/91/G31).IRRI-UNDP Final Workshop, Beijing and Hangzhou,10-13 August 1998.
Charoensilp, N., P. Promnart and P. Charoendham. 1998.Methane Emission from Deepwater Rice in Thailand.Final Workshop and Annual Meeting, InterregionalResearch Programme on Methane Emission fromRice Fields (GLO/91/G31). IRRI-UNDP FinalWorkshop, Beijing and Hangzhou, 10-13 August1998.
Cicerone, R.J., C.C. Delwiche, S.C. Tyler and P.R.Zimmerman, 1992. Methane emission fromCalifornia rice paddies with varied treatments.Global Biogeochemical Cycles 6(3):233-248
De Datta, S.K. 1981. Principles and practices of riceproduction. John Wiley and Sons. New York. USA.
Goutam, D., M.C. Jain, S. Kumar, K. Sarkar and S.K.Sinha. 1996. Methane emission from rice fieldamended with biogas slurry and farm yard manure.Climate Change. 00:1-13.
Jain, M.C. and S. Kumar. 1998. Methane Emission fromIrrigated Rice in Delhi. Final Workshop and AnnualMeeting, Interregional Research Programme onMethane Emission from Rice Fields (GLO/91/G31).IRRI-UNDP Final Workshop, Beijing and Hangzhou,10-13 August 1998.
REFERENCES:
Jermsawatdipong, P., Jun Murase, P. Prabuddham, Y.Hasathon, N. Khomthong, K. Naklang, A. Watanabe,H. Haraguchi and M. Kimura. 1994. Methaneemission from plots with differences in fertilizerapplication in Thai paddy fields. Soil Sci. Plant Nutr.(40) 63-71.
IPCC, 1995. Intergovernmental Panel on Climate Change.Guidelines for National Greenhouse Gas Inventories.OECD, Paris, France.
IPCC, 1997. Intergovernmental Panel on ClimateChange. Guidelines for National Greenhouse GasInventories: Workbook,Chapter 4.3, Agriculture:Methane emission from rice cultivation. OECD, Paris,France.
Kimura, M. 1992. Methane emission from paddy soilsin Japan and Thailand. In World inventory of soilemission potentials. Batjes N. H., Bridge E. M., eds.WISE Report 2, ISRIC, Wageningen. P 73-79.
Kimura, M., Y. Miura, A. Watanabe, J. Murase andS. Kuwatsuka.1992. Methane production and its fatein rice paddies. I. Effects of rice straw applicationand percolation rate on the leaching into subsoil ofmethane and other soil components. Soil Sci. PlantNutr., 38:665-672.
Kimura, M., Y. Mimura, A. Watanabe, T. Katoh andH. Haraguchi, 1996. Methane emission from paddyfield (Part I). Effect of fertilization, growth stage andmid-summer drainage: pot experiment. Environ. Sci.4:265-271.
Lauren, J.G. and J.M. Duxbury. 1993. Methane emissionfrom flooded rice amended with green manure. InAgricultural Ecosystem Effects on Trace Gases andGlobal Climate Change, ASA Spec. Publ. No. 55,pp.183-192, Am. Soc. of Agronomy, Madison, WI.
Lindau, C.W., W.H. Patrick, R.D. DeLaune and K.R.Reddy. 1990. Rate of emission and accumulationand emission of N2, N2O, and CH4 from a floodedrice soil. Plant and Soil 129:269-276.
Lindau, C.W., P.K. Bollich, R.D. DeLaune. W.H. PatrickJr. and V.J. Law. 1991. Effect of urea fertilizerand environmental factors on methane emissionfrom a Lousiana, USA rice fields. Plant and soil.136:195-203.
Lindau, C.W., P.K. Bollich, R.D. DeLaune. A.R. Moisierand K.F. Bronson. 1993. Methane mitigation inflooded Lousiana rice fileds. Bio. Fert. Soils 15:174-178.
Agriculture Sector: Rice 55
Lu, J. and J. Cheng, 1996. Water management forhigh-yield rice production. Proceedings of theInternational Symposium on Maximizing sustainableRice Yields through Improved soil and environmentalmanagement. November 11-17, 1996 Khon Khen,Thailand, pp.559-568.
Makarim, A.K. and P. Setyanto. 1998. Methane Emissionfrom Rainfed Rice in Jakenan. Final Workshop andAnnual Meeting, Interregional Research Programmeon Methane Emission from Rice Fields (GLO/91/G31). IRRI-UNDP Final Workshop, Beijing andHangzhou, 10-13 August 1998.
Neue, H.U., P. Becker-Heidmann and H.W. Scharpenseel.1990. Organic matter dynamics, soil properties andcultural practices in rice lands and their relationshipto methane reduction. In Bouwman, A.F., ed. Soiland the Greenhouse effect. J. Wiley and sons, NewYork, pp.457-466.
Neue, H.U., R. Wassmann and R.S. Lantin. 1995.Mitigation Options for Methane Emissions fromRice Fields. Climate Change and Rice, edited byS. Peng, K.T. Ingram, H.U. Neue and L.H. Ziska,IRRI, Springer-Verlag Berlin, Heidelberg, New York,pp.136-146.
Oremland. R.S. and C.W. Culbertson. 1992. Importanceof methane oxidizing bacteria in the methanebudget as revealed by the use of a specific inhibitor.Nature, 356:421-423.
Patrick, W.H. and R.D. deLaune. 1997. Chemical andbiological redox systems affecting nutrient availabilityin the coastal wetlands. Geosci. And Man 18:131-137.
Sass, R.L., F.M. Fisher, F.T. Turner and M.F. Jund. 1991a.Methane emission from rice fields as influenced bysolar radiation, temperature, and straw incorporation.Global Biogeochem. Cycles 5:335-350.
Sass, R.L., F.M. Fisher, P.A. Harcombe, and F.T. Turner.1991b. Mitigation of methane emission from ricefields: Possible adverse effects on incorporated ricestraw. Global Biogeochem. Cycles 5:275-287.
Sass, R.L., F.M. Fischer, Y.B. Wang, F.T. Turner and M.F.Jund. 1992. Methane emission from rice fields: theeffect of flooded water management. Globa Biochem.Cycles 6(3):249-262.
Sethunathan, N., S. Kumaraswamy, A.K. Rath, B.Ramakrishnan, T.K. Adhya and V.R. Rao. 1998.Methane Production and Oxidation in Rice Soils.Final Workshop and Annual Meeting, InterregionalResearch Programme on Methane Emission fromRice Fields (GLO/91/G31). IRRI-UNDP FinalWorkshop, Beijing and Hangzhou, 10-13 August1998.
TEI, 1997. Thailand Environment Institute. Thailand’sNational Greenhouse Gas Inventory, 1990. A reportsubmitted to Office of Environmental Policy andPlanning.
Teodula, M.C., J. Bajita, 1998. Methane emission fromirrigated rice in Maligaya. Final Workshop andAnnual Meeting, Interregional Research Programmeon Methane Emission from Rice Fields (GLO/91/G31). IRRI-UNDP Final Workshop, Beijing andHangzhou, 10-13 August 1998.
Wanfang, L. and C. Wei. 1998. Methane emission fromIrrigated Rice in Hangzhou. Final Workshop andAnnual Meeting, Interregional Research Programmeon Methane Emission from Rice Fields (GLO/91/G31). IRRI-UNDP Final Workshop, Beijing andHangzhou, 10-13 August 1998.
Xu, H. and Z.C. Cai. 1998. Effect of Land Managementin Winter Crop season on Methane Emission duringthe Following Flooded or Rice-Growing Period.Final Workshop and Annual Meeting, InterregionalResearch Programme on Methane Emission fromRice Fields (GLO/91/G31). IRRI-UNDP FinalWorkshop, Beijing and Hangzhou, 10-13 August1998.
Yagi, K. and K. Minami. 1990. Effect of organic matterapplication on methane emission from some Japanesepaddy fields. Soil Sci. Plant Nutr. 36:599-610.
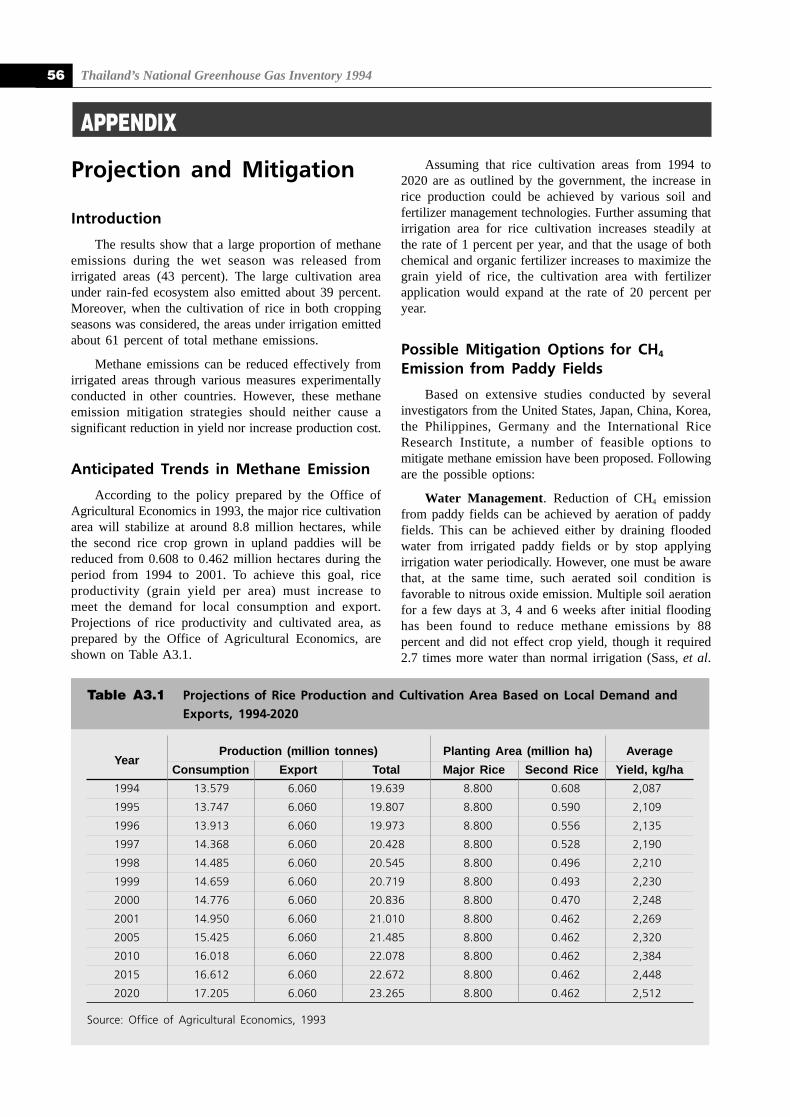
Thailand’s National Greenhouse Gas Inventory 199456
YearProduction (million tonnes) Planting Area (million ha) Average
Consumption Export Total Major Rice Second Rice Yield, kg/ha
1994 13.579 6.060 19.639 8.800 0.608 2,087
1995 13.747 6.060 19.807 8.800 0.590 2,109
1996 13.913 6.060 19.973 8.800 0.556 2,135
1997 14.368 6.060 20.428 8.800 0.528 2,190
1998 14.485 6.060 20.545 8.800 0.496 2,210
1999 14.659 6.060 20.719 8.800 0.493 2,230
2000 14.776 6.060 20.836 8.800 0.470 2,248
2001 14.950 6.060 21.010 8.800 0.462 2,269
2005 15.425 6.060 21.485 8.800 0.462 2,320
2010 16.018 6.060 22.078 8.800 0.462 2,384
2015 16.612 6.060 22.672 8.800 0.462 2,448
2020 17.205 6.060 23.265 8.800 0.462 2,512
Source: Office of Agricultural Economics, 1993
Table A3.1 Projections of Rice Production and Cultivation Area Based on Local Demand andExports, 1994-2020
APPENDIX
Projection and Mitigation
Introduction
The results show that a large proportion of methaneemissions during the wet season was released fromirrigated areas (43 percent). The large cultivation areaunder rain-fed ecosystem also emitted about 39 percent.Moreover, when the cultivation of rice in both croppingseasons was considered, the areas under irrigation emittedabout 61 percent of total methane emissions.
Methane emissions can be reduced effectively fromirrigated areas through various measures experimentallyconducted in other countries. However, these methaneemission mitigation strategies should neither cause asignificant reduction in yield nor increase production cost.
Anticipated Trends in Methane Emission
According to the policy prepared by the Office ofAgricultural Economics in 1993, the major rice cultivationarea will stabilize at around 8.8 million hectares, whilethe second rice crop grown in upland paddies will bereduced from 0.608 to 0.462 million hectares during theperiod from 1994 to 2001. To achieve this goal, riceproductivity (grain yield per area) must increase tomeet the demand for local consumption and export.Projections of rice productivity and cultivated area, asprepared by the Office of Agricultural Economics, areshown on Table A3.1.
Assuming that rice cultivation areas from 1994 to2020 are as outlined by the government, the increase inrice production could be achieved by various soil andfertilizer management technologies. Further assuming thatirrigation area for rice cultivation increases steadily atthe rate of 1 percent per year, and that the usage of bothchemical and organic fertilizer increases to maximize thegrain yield of rice, the cultivation area with fertilizerapplication would expand at the rate of 20 percent peryear.
Possible Mitigation Options for CH4
Emission from Paddy Fields
Based on extensive studies conducted by severalinvestigators from the United States, Japan, China, Korea,the Philippines, Germany and the International RiceResearch Institute, a number of feasible options tomitigate methane emission have been proposed. Followingare the possible options:
Water Management. Reduction of CH4 emissionfrom paddy fields can be achieved by aeration of paddyfields. This can be achieved either by draining floodedwater from irrigated paddy fields or by stop applyingirrigation water periodically. However, one must be awarethat, at the same time, such aerated soil condition isfavorable to nitrous oxide emission. Multiple soil aerationfor a few days at 3, 4 and 6 weeks after initial floodinghas been found to reduce methane emissions by 88percent and did not effect crop yield, though it required2.7 times more water than normal irrigation (Sass, et al.
Agriculture Sector: Rice 57
1992). A single aeration during mid-tillering or latetillering stage has also been found to decrease methaneemissions by more than 50 percent compared withcontinuous flooding (Kimura, 1992, Javellana, et al. 1995,Wang, et al. 1996, Wangfang, et al. 1996).
Organic Matter Amendment. As demand for riceconsumption increased, organic matter amendment hasbeen recognized as beneficial to crop production (bothin quantity and quality) for thousand of years. In Thailand,the Rice Soil and Fertilizer Research Group, Soil ScienceDivision, Ministry of Agriculture and Cooperatives hasconducted a number of long-term experiments to improvecrop productivity by incorporating various types oforganic matter into paddy soil, including farm residues,farm residue compost, green manure and animal manure.The incorporation of green manure from plants such asmungbean, soybean, Sesbania and Azolla has been foundto significantly increase rice production and improved soilproperties, particularly in sandy textured soil and salinesoil in the northeast of the country.
The incorporation of organic matter into floodedpaddy soils increases methane emission from all soil typesby providing a carbon source for methanogens.Experiments conducted in Thailand have indicated thatthe incorporation of only 2 percent of dry rice straw inacid sulfate soil increased methane emissions markedlyfrom 0.45 to 1.11 g-CH4 per sq m per day, while theincorporation of green manure plant, Sesbania rostrata,into clayey soil increased emissions from 1.13 to 5.93g-CH4 per sq m per day (see Table 3.1). Similar effectsof organic matter incorporation into soils were observedby Lauren and Duxbury (1993) and Sass, et al. (1991b).The effect of organic matter incorporation on methaneemission is acknowledged by IPCC (1997). The paneltherefore recommends a default correction factor of 2 formethane emission conversion in paddy soils with organicamendment, which is used in the estimation of methaneemission from rice cultivation in this report.
The addition of organic matter rich in easilydecomposable carbon such as green manure, rice straw,and farmyard manure into flooded soil causes an increasein methane emissions and should be minimized.Incorporation with pre-fermented farm residues, animalwaste or compost has been found to cause less methaneemissions (Yagi and Minami, 1990, Teodula and Bajita,1998, Wangfang and Wei, 1998, Goutam, et al. 1996),but required more labor in the production process anddelivery to farms.
Mineral Fertilization. Nitrogen is an essential plantnutrient and one of the significant constituents of allproteins, chlorophyll and coenzymes and nucleic acids.Nitrogen promotes rapid growth, especially thedevelopment of leaves and stems. It is normally lackingin rice fields, hence the application of different types ofnitrogenous fertilizer into paddy fields. However, suchapplication affects the emission of nitrous oxide andmethane gas.
Urea is the most common nitrogen fertilizer used fortop dressing at panicle initiation stage of plant growth inThailand, comprising of 75-80 percent of the total. Insteadof urea, though, ammonium sulfate or ammonium nitrateapplied to flooded paddy soils has been found effectivein suppressing methane production. The efficiencyincreases if applied also as basal fertilizer at the earlytillering stage. The oxidized components such as sulfateand nitrate tend to buffer soil redox potential (Eh),slowing down methane formation.
The efficiency of sulfate-containing nitrogen fertilizerin reducing methane emission is highly dependent on soilproperties, particularly soil pH and mode of application.Surface application of ammonium sulfate was observedto reduce methane emission more efficiently thanincorporation into soil (Patrick and Delaune, 1997). Butdeep application of urea was found to decrease methaneemission by as high as 23 percent compared to that ofbroadcasting on soil surface (Makarim and Setyanto,1998) since it increases the efficiency of nitrogen fertilizerby reducing the evaporation loss of nitrogen as ammonia.In the Philippines, results from a series of fieldexperiments indicated that paddy fields with ammoniumsulfate application reduced methane emission by as highas 60 percent (Buendia et al., 1998). The addition of ureawith phosphogypsum can also decrease emission by 74percent (Teodula and Bajita, 1998).
The widespread use of ammonium sulfate is inhibitednot only by its availability and price but also by its impacton soil acidity. Farmers prefer urea to ammonium sulfatefor its easy handling and broadcasting to the paddy. Thequantity of ammonium sulfate used for rice cultivationvaries from year to year depending on the market price.The average amount used during 1989 to 1994 was onlyabout 28 percent that of total nitrogen fertilizer used.
Rice Cultivars. The production and emission ofmethane into the atmosphere appear to depend on riceplant characteristics, not only in terms of their capacityfor transporting methane from roots into the atmospherebut also in the ability of the root themselves to exudecarbon compounds. Degrading leaves and roots areimportant sources of organic carbon, especially at laterstage of plant growth.
In general, traditional rice varieties emit less amountof methane than modern varieties. Field experimentsconducted in Thailand found that traditional deep waterrice emitted 50.4 mg-CH4 per sq m per day while themodern rice variety (IR72) planted in the same soilunder continuously flooded conditions emitted a higheramount of methane of 93.2 mg-CH4 per sq m per day(Charoensilp, et al. 1998). A study in Beijing also foundthat short grain Japonica rice emitted higher amounts ofmethane than Indica rice. The emission of methane alsovaries with water regimes (Jain and Kumar, 1998). Forexample, when planted under continuously floodedconditions, the modern rice variety (IR72) emitted 19.7mg-CH4 per sq m per day, while traditional varieties Pusa
Thailand’s National Greenhouse Gas Inventory 199458
and Pusa Basmati emitted 10.85 mg-CH4 per sq m perday. But under intermittently flooded conditions, methaneemission from the traditional rice varieties increased to11.69 mg-CH4 per sq m per day while that for the modernrice variety decreased to 8.45 mg-CH4 per sq m per day.
These findings suggest that an intensive study mustbe conducted to select the low methane emission varietiesand to identify the factors that may potentially reducemethane emission.
Cultural Practices. Land preparation, especiallypuddling, transplanting of rice seedlings, weeding, andfertilizer application in the flooded paddy fields causesoil disturbance which releases trapped CH4 intoatmosphere. Transplanting rice seedlings is a commonpractice employed in Thailand, though recently thegovernment has encouraged the planting of seeds directlyonto the soils for irrigated rice. Less soil disturbance ismade by the direct seeding method compared to thetransplanting method, thereby reducing the amount ofmethane emission to some degree.
Dry direct seeding method is presently increasing inpopularity. The harvesting area for dry direct seeding hadincreased remarkably from about 14 percent to 24 percentof the total area for major rice production between 1989and 1991, while the area for transplanting decreased from74 percent to 65 percent during the same period. Thisplanting method not only reduces the release of entrappedmethane and period of methane formation but alsoincreases the efficiency of water use. Thus the target areasare those under irrigation.
Methane Production Inhibitors. Chemicalcompounds inhibiting CH4 production are beinginvestigated. Some of the effective chemicals aresulfate compounds such as calcium sulfate or gypsum,sodium sulfate, and sulfate containing fertilizers asphosphogypsum and ammonium sulfate (Lindau, et al.1993). Neue (1994) observed that between 55-70 percentof CH4 emission is reduced from soil amended with 6.66tons per hectare of gypsum. In other studies, the slowrelease of acetylene from calcium carbide, encapsulatedin fertilizer granules, greatly reduced CH4 emission(Bronson and Mosier, 1991). The main limitations for theuse of these inhibitors are cost and availability. At present,the cost of gypsum in Thailand is almost the same asammonium sulfate.
Using methylfluoride as methane inhibitor in fieldinvestigations showed that methanotrophic bacteria canconsume more than 90 percent of the methane potentiallyavailable (Oremland and Culbertson, 1992). In anotherexperiment, the addition of a nitrification inhibitor,dicyandiamide, at the rate of 3 kg per ha was found toreduce methane production (Adhya, et al. 1998).Experiments conducted in India by Sethunathan, et al.(1998) showed that carbamate insecticide, carbofuran, andorganochlorine insecticide, hexachlorocyclohexane, whenapplied to paddy fields appeared to inhibit CH4 emission.
Crop Rotation Systems. Neue, et al. (1995) suggestthat the rotation of rice crop with other upland crops is afeasible option to reduce total annual CH4 emission. Italso helps to increase crop production and incomeparticularly in the intensive rice production areas. Theproduction of rice in areas where irrigation is availableall year round is generally increased by growing rice 2times per year or 5 times per 2 years in the central regionof Thailand. Neue, et al. (1995) recommended to reduceCH4 emission by growing other upland crops as rotationcrops before or after one or two crops of rice. Variousupland crops which can be grown in the paddy fieldbefore rice cultivation are baby corn, mungbean, cowpeas.After rice cultivation, soybean, corn, cowpeas, chickenbean and mungbean can also be grown. The sequencesof cropping rotation applicable to any region should beinvestigated. For example, an experiment conducted inKorea shows that planting alfalfa in winter before ricesignificantly increases CH4 emission than wheat or fallow(Xu and Cai,1998).
Proposed Mitigation Strategies
Methane emissions are expected to increase as riceproduction expands to meet the growing demand forconsumption. This would mean increasing rice yieldsthrough soil and fertilizer management and by breedinghigh yield rice varieties. In Thailand, the major sourceof methane emission is from rice cultivation during thewet season. Moreover, emission per cultivation area isevidently greater in irrigated areas than in rain-fed areas.With several mitigation technologies already identified,two possible strategies are being proposed forimplementation in Thailand:
Methane emission can be prevented or reduced inareas where mitigation technologies can be applied. Thisapproach can be employed in the cultivation of irrigatedrice using a single technology or a combination oftechnologies.
The reduction of methane emission in areas whererice cultivation is a necessity and therefore methaneemission can not be avoided. This approach can beapplied to rain-fed rice cultivation areas, particularly inthe unfertile paddies. The incorporation of organic matterhas been proven essential for yield improvement, cropnutrition nourishment and, more importantly, forincreasing soil buffering capacity and for improving thephysical properties of poor soil. The type, amount andapplication mode of organic matter must be furtherinvestigated locally in relation to methane production andemission.
To reduce methane emission from paddy fields inThailand, the possible technical options are:
Option 1: Water management in irrigated areas.This approach to mitigate methane emission can beapplied effectively to irrigated rice, where the water
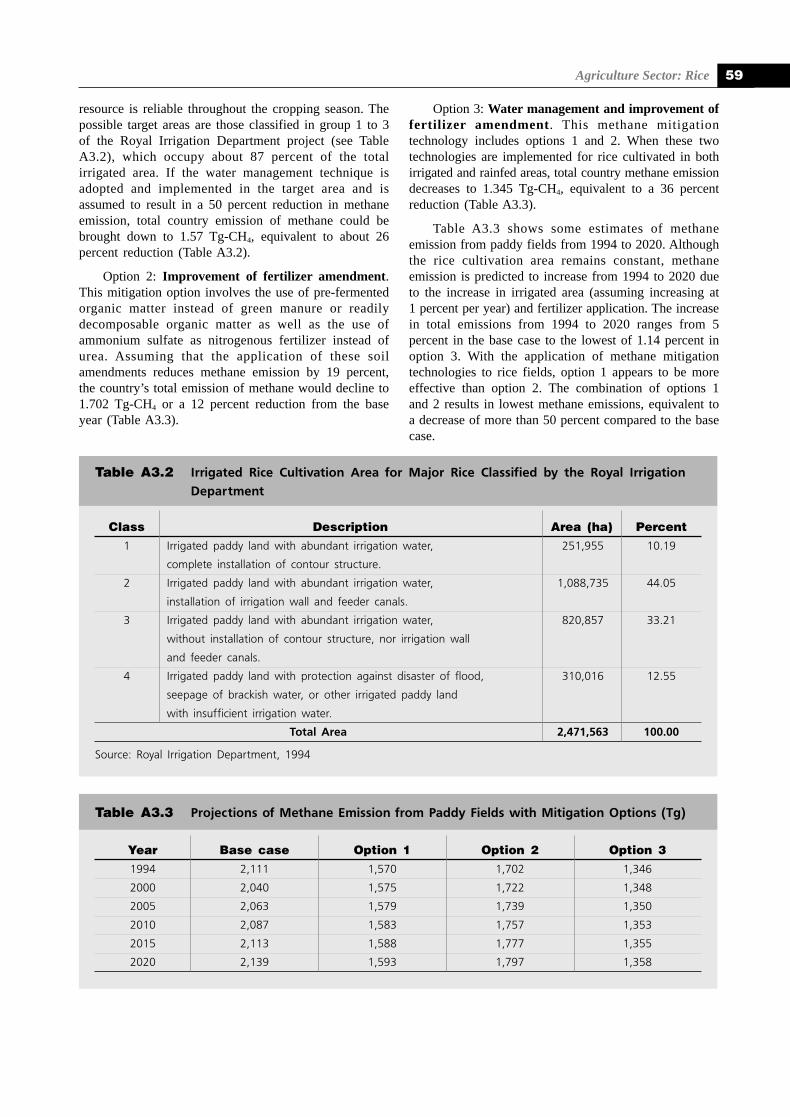
Agriculture Sector: Rice 59
Year Base case Option 1 Option 2 Option 3
1994 2,111 1,570 1,702 1,346
2000 2,040 1,575 1,722 1,348
2005 2,063 1,579 1,739 1,350
2010 2,087 1,583 1,757 1,353
2015 2,113 1,588 1,777 1,355
2020 2,139 1,593 1,797 1,358
Table A3.3 Projections of Methane Emission from Paddy Fields with Mitigation Options (Tg)
Class Description Area (ha) Percent
1 Irrigated paddy land with abundant irrigation water, 251,955 10.19
complete installation of contour structure.
2 Irrigated paddy land with abundant irrigation water, 1,088,735 44.05
installation of irrigation wall and feeder canals.
3 Irrigated paddy land with abundant irrigation water, 820,857 33.21
without installation of contour structure, nor irrigation wall
and feeder canals.
4 Irrigated paddy land with protection against disaster of flood, 310,016 12.55
seepage of brackish water, or other irrigated paddy land
with insufficient irrigation water.
Total Area 2,471,563 100.00
Source: Royal Irrigation Department, 1994
Table A3.2 Irrigated Rice Cultivation Area for Major Rice Classified by the Royal IrrigationDepartment
resource is reliable throughout the cropping season. Thepossible target areas are those classified in group 1 to 3of the Royal Irrigation Department project (see TableA3.2), which occupy about 87 percent of the totalirrigated area. If the water management technique isadopted and implemented in the target area and isassumed to result in a 50 percent reduction in methaneemission, total country emission of methane could bebrought down to 1.57 Tg-CH4, equivalent to about 26percent reduction (Table A3.2).
Option 2: Improvement of fertilizer amendment.This mitigation option involves the use of pre-fermentedorganic matter instead of green manure or readilydecomposable organic matter as well as the use ofammonium sulfate as nitrogenous fertilizer instead ofurea. Assuming that the application of these soilamendments reduces methane emission by 19 percent,the country’s total emission of methane would decline to1.702 Tg-CH4 or a 12 percent reduction from the baseyear (Table A3.3).
Option 3: Water management and improvement offertilizer amendment. This methane mitigationtechnology includes options 1 and 2. When these twotechnologies are implemented for rice cultivated in bothirrigated and rainfed areas, total country methane emissiondecreases to 1.345 Tg-CH4, equivalent to a 36 percentreduction (Table A3.3).
Table A3.3 shows some estimates of methaneemission from paddy fields from 1994 to 2020. Althoughthe rice cultivation area remains constant, methaneemission is predicted to increase from 1994 to 2020 dueto the increase in irrigated area (assuming increasing at1 percent per year) and fertilizer application. The increasein total emissions from 1994 to 2020 ranges from 5percent in the base case to the lowest of 1.14 percent inoption 3. With the application of methane mitigationtechnologies to rice fields, option 1 appears to be moreeffective than option 2. The combination of options 1and 2 results in lowest methane emissions, equivalent toa decrease of more than 50 percent compared to the basecase.

4C H A P T E R
b y P r a v e e V i j c h u l a t a
● Introduction
● Methodology
● Data
● Results
AGRICULTURE SECTOR:LIVESTOCK
Thailand’s National Greenhouse Gas Inventory 199462
Thailand’s National Greenhouse Gas Inventory 1994
4.1 INTRODUCTIONAnimal production is essential to the diet as well as
the economy of the Thai population. In 1990, totalproduction from livestock and poultry alone in the countrywas estimated at 64,450 million baht, representing about22 percent of total agricultural farm-gate value (Officeof Agricultural Economics, 1993). From the 5th to 7th
National Economic and Social Development Plans, theanimal production sector grew progressively at the rateof about 9 percent per annum (Division of AgriculturalResearch, 1995). Owing to the increased production offeed grains, the availability of crop residues and feedrelated industrial wastes, it is believed that the animalindustry will continue to grow at an accelerating pace.Increasing world market demand for agricultural productswill further stimulate the growth of the animal industryin Thailand.
Adverse environmental effects from animalproduction activities are well recognized. Of recentconcern are greenhouse gas emissions, particularlymethane and nitrous oxide, from livestock farmingenterprises. Methane gas is produced from entericfermentation of feed and from animal feces while nitrousoxide is produced from manure management. Since thecontribution of livestock production towards GHGemissions in Thailand is still largely unknown, theobjective of this study is to evaluate the situation.
Emissions of methane from enteric fermentation isestimated from dairy cattle, non-dairy cattle and buffaloand from the manure of ruminants as well as swine andpoultry. In addition, nitrous oxide emissions are estimatedfrom various manure management systems. The base yearestimate for GHG emissions from animal productionactivities in this study is 1994 and follows the estimationtechniques described by IPCC (1996).
The inventory of the animal population comes fromthe annual statistical reports of the Department ofLivestock Development (1997). The estimation ofmethane gas production follows the procedures outlinedby IPCC (1996). Two approaches are used: Tier 1 isrecommended for GHG production estimation fromanimals which exist in small numbers, while Tier 2 isrecommended for animals existing in large numbers.
Mitigation strategies of the livestock sector arediscussed in the Appendix.
4.2 METHODOLOGYRationale
The primary GHG emissions from livestock aremethane and nitrous oxide. Methane derives from feeddigestive processes, mainly in ruminants, and from animalmanure, while nitrous oxide derives from animal wastemanagement. Enteric fermentation in herbivores producesmethane as a by-product of the digestive process bywhich carbohydrates are broken down by micro-organismsinto simple molecules for absorption into the bloodstream. Both ruminant animals (e.g. cattle, buffalo) andsome non-ruminant animals (e.g. pigs) produce methane,but ruminants are the largest source.
Methane and nitrous oxide emissions from themanagement of livestock manure occur as a result of itsdecomposition under anaerobic conditions. Theseconditions often occur when a large number of animalsare managed in a confined area, e.g., dairy farms, beeffeedlots, swine and poultry farms.
The amount of GHG produced from both sourcesdepends upon various factors including animal speciesand body size, quantity and quality of feed digested, leveland type of animal produces and environmentalconditions. The estimation of methane gas emissions,therefore, has to take all these influencing factors intoconsideration.
Measurement of the enteric methane emitted can beconducted directly through the use of a face mask orrespiratory chamber. However, both require animalinvolvement as well as special facilities andinstrumentation. The alternative method is to indirectlycalculate the amount of gas produced through the use ofemission factors, which estimate the amount of energyintake that is converted into methane. Conversion factorscan be used to estimate the amount of methane producedfrom animal manures. Similarly, emission factors are usedto estimate the amount of nitrous oxide released fromvarious manure management systems.
Assumptions
1. All dairy cattle are stall-fed, while non-dairycattle and buffalo are allowed to graze in the openfield. The feeds for all ruminants are assumed toattain 60 percent digestibility with 8 percentmanure ash content.
2. All cattle are not used as draft animal, whilemature female and male buffalo are assumed towork for 0.55 and 1.37 hours per day, respectively(IPCC, 1996).
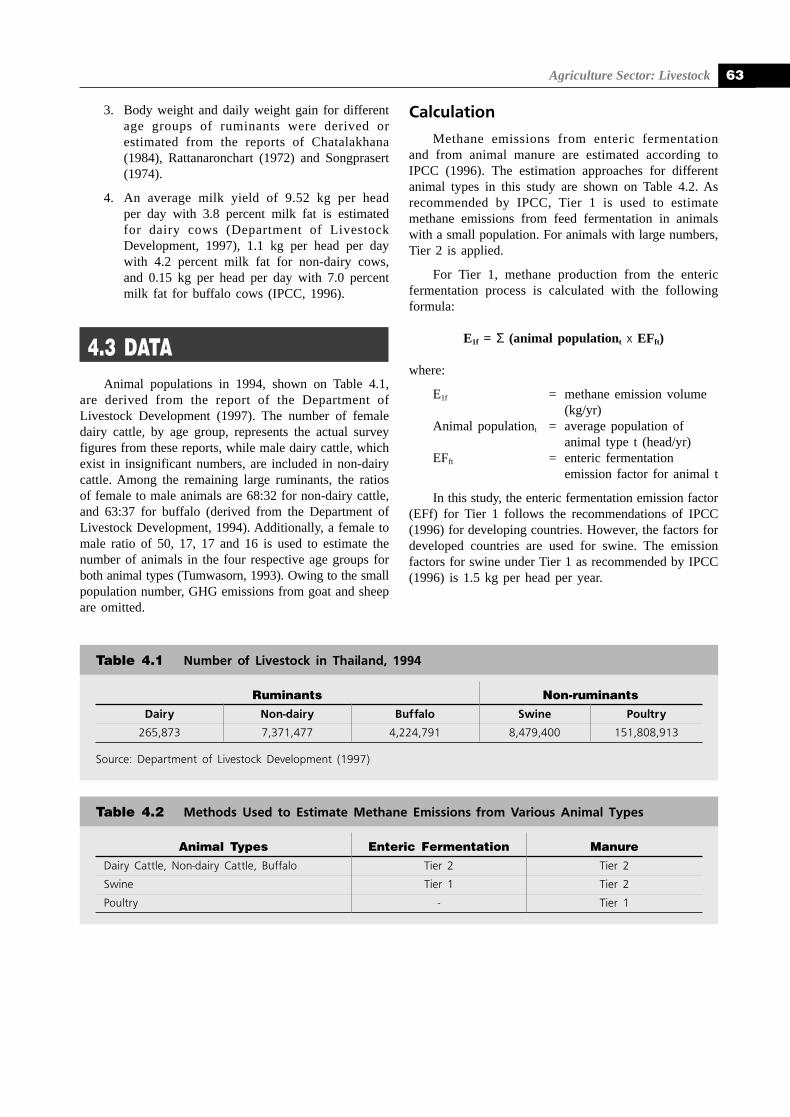
Agriculture Sector: Livestock 63
3. Body weight and daily weight gain for differentage groups of ruminants were derived orestimated from the reports of Chatalakhana(1984), Rattanaronchart (1972) and Songprasert(1974).
4. An average milk yield of 9.52 kg per headper day with 3.8 percent milk fat is estimatedfor dairy cows (Department of LivestockDevelopment, 1997), 1.1 kg per head per daywith 4.2 percent milk fat for non-dairy cows,and 0.15 kg per head per day with 7.0 percentmilk fat for buffalo cows (IPCC, 1996).
4.3 DATAAnimal populations in 1994, shown on Table 4.1,
are derived from the report of the Department ofLivestock Development (1997). The number of femaledairy cattle, by age group, represents the actual surveyfigures from these reports, while male dairy cattle, whichexist in insignificant numbers, are included in non-dairycattle. Among the remaining large ruminants, the ratiosof female to male animals are 68:32 for non-dairy cattle,and 63:37 for buffalo (derived from the Department ofLivestock Development, 1994). Additionally, a female tomale ratio of 50, 17, 17 and 16 is used to estimate thenumber of animals in the four respective age groups forboth animal types (Tumwasorn, 1993). Owing to the smallpopulation number, GHG emissions from goat and sheepare omitted.
Calculation
Methane emissions from enteric fermentationand from animal manure are estimated according toIPCC (1996). The estimation approaches for differentanimal types in this study are shown on Table 4.2. Asrecommended by IPCC, Tier 1 is used to estimatemethane emissions from feed fermentation in animalswith a small population. For animals with large numbers,Tier 2 is applied.
For Tier 1, methane production from the entericfermentation process is calculated with the followingformula:
E1f = Σ (animal populationt x EFft)
where:
E1f = methane emission volume(kg/yr)
Animal populationt = average population ofanimal type t (head/yr)
EFft = enteric fermentationemission factor for animal t
In this study, the enteric fermentation emission factor(EFf) for Tier 1 follows the recommendations of IPCC(1996) for developing countries. However, the factors fordeveloped countries are used for swine. The emissionfactors for swine under Tier 1 as recommended by IPCC(1996) is 1.5 kg per head per year.
Ruminants Non-ruminants
Dairy Non-dairy Buffalo Swine Poultry
265,873 7,371,477 4,224,791 8,479,400 151,808,913
Source: Department of Livestock Development (1997)
Table 4.1 Number of Livestock in Thailand, 1994
Animal Types Enteric Fermentation Manure
Dairy Cattle, Non-dairy Cattle, Buffalo Tier 2 Tier 2
Swine Tier 1 Tier 2
Poultry - Tier 1
Table 4.2 Methods Used to Estimate Methane Emissions from Various Animal Types
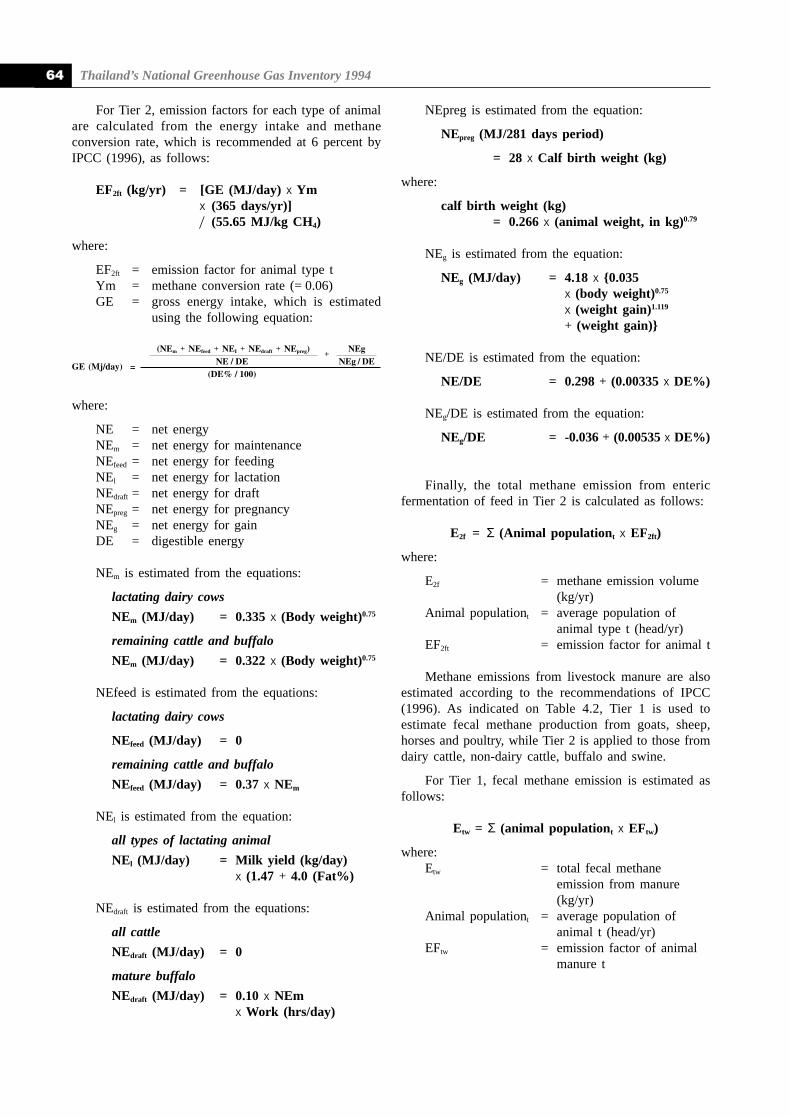
Thailand’s National Greenhouse Gas Inventory 199464
For Tier 2, emission factors for each type of animalare calculated from the energy intake and methaneconversion rate, which is recommended at 6 percent byIPCC (1996), as follows:
EF2ft (kg/yr) = [GE (MJ/day) x Ymx (365 days/yr)]/ (55.65 MJ/kg CH4)
where:
EF2ft = emission factor for animal type tYm = methane conversion rate (= 0.06)GE = gross energy intake, which is estimated
using the following equation:
where:
NE = net energyNEm = net energy for maintenanceNEfeed = net energy for feedingNEl = net energy for lactationNEdraft = net energy for draftNEpreg = net energy for pregnancyNEg = net energy for gainDE = digestible energy
NEm is estimated from the equations:
lactating dairy cows
NEm (MJ/day) = 0.335 x (Body weight)0.75
remaining cattle and buffalo
NEm (MJ/day) = 0.322 x (Body weight)0.75
NEfeed is estimated from the equations:
lactating dairy cows
NEfeed (MJ/day) = 0
remaining cattle and buffalo
NEfeed (MJ/day) = 0.37 x NEm
NEl is estimated from the equation:
all types of lactating animal
NEl (MJ/day) = Milk yield (kg/day)x (1.47 + 4.0 (Fat%)
NEdraft is estimated from the equations:
all cattle
NEdraft (MJ/day) = 0
mature buffalo
NEdraft (MJ/day) = 0.10 x NEmx Work (hrs/day)
NEpreg is estimated from the equation:
NEpreg (MJ/281 days period)
= 28 x Calf birth weight (kg)
where:
calf birth weight (kg)= 0.266 x (animal weight, in kg)0.79
NEg is estimated from the equation:
NEg (MJ/day) = 4.18 x {0.035x (body weight)0.75
x (weight gain)1.119
+ (weight gain)}
NE/DE is estimated from the equation:
NE/DE = 0.298 + (0.00335 x DE%)
NEg/DE is estimated from the equation:
NEg/DE = -0.036 + (0.00535 x DE%)
Finally, the total methane emission from entericfermentation of feed in Tier 2 is calculated as follows:
E2f = Σ (Animal populationt x EF2ft)
where:
E2f = methane emission volume(kg/yr)
Animal populationt = average population ofanimal type t (head/yr)
EF2ft = emission factor for animal t
Methane emissions from livestock manure are alsoestimated according to the recommendations of IPCC(1996). As indicated on Table 4.2, Tier 1 is used toestimate fecal methane production from goats, sheep,horses and poultry, while Tier 2 is applied to those fromdairy cattle, non-dairy cattle, buffalo and swine.
For Tier 1, fecal methane emission is estimated asfollows:
Etw = Σ (animal populationt x EFtw)
where:Etw = total fecal methane
emission from manure(kg/yr)
Animal populationt = average population ofanimal t (head/yr)
EFtw = emission factor of animalmanure t
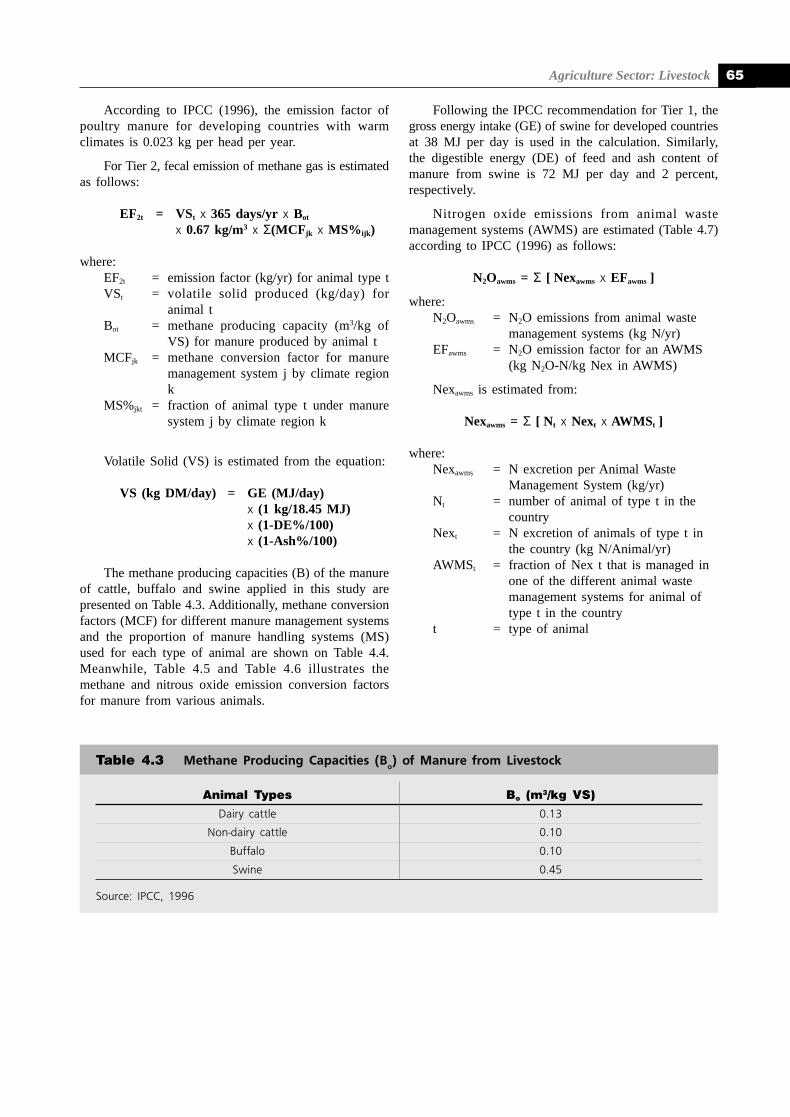
Agriculture Sector: Livestock 65
According to IPCC (1996), the emission factor ofpoultry manure for developing countries with warmclimates is 0.023 kg per head per year.
For Tier 2, fecal emission of methane gas is estimatedas follows:
EF2t = VSt x 365 days/yr x Bot
x 0.67 kg/m3 x Σ(MCFjk x MS%ijk)
where:EF2t = emission factor (kg/yr) for animal type tVSt = volatile solid produced (kg/day) for
animal tBot = methane producing capacity (m3/kg of
VS) for manure produced by animal tMCFjk = methane conversion factor for manure
management system j by climate regionk
MS%jkt = fraction of animal type t under manuresystem j by climate region k
Volatile Solid (VS) is estimated from the equation:
VS (kg DM/day) = GE (MJ/day)x (1 kg/18.45 MJ)x (1-DE%/100)x (1-Ash%/100)
The methane producing capacities (B) of the manureof cattle, buffalo and swine applied in this study arepresented on Table 4.3. Additionally, methane conversionfactors (MCF) for different manure management systemsand the proportion of manure handling systems (MS)used for each type of animal are shown on Table 4.4.Meanwhile, Table 4.5 and Table 4.6 illustrates themethane and nitrous oxide emission conversion factorsfor manure from various animals.
Following the IPCC recommendation for Tier 1, thegross energy intake (GE) of swine for developed countriesat 38 MJ per day is used in the calculation. Similarly,the digestible energy (DE) of feed and ash content ofmanure from swine is 72 MJ per day and 2 percent,respectively.
Nitrogen oxide emissions from animal wastemanagement systems (AWMS) are estimated (Table 4.7)according to IPCC (1996) as follows:
N2Oawms = Σ [ Nexawms x EFawms ]
where:N2Oawms = N2O emissions from animal waste
management systems (kg N/yr)EFawms = N2O emission factor for an AWMS
(kg N2O-N/kg Nex in AWMS)
Nexawms is estimated from:
Nexawms = Σ [ Nt x Next x AWMSt ]
where:Nexawms = N excretion per Animal Waste
Management System (kg/yr)Nt = number of animal of type t in the
countryNext = N excretion of animals of type t in
the country (kg N/Animal/yr)AWMSt = fraction of Nex t that is managed in
one of the different animal wastemanagement systems for animal oftype t in the country
t = type of animal
Animal Types Bo (m3/kg VS)
Dairy cattle 0.13
Non-dairy cattle 0.10
Buffalo 0.10
Swine 0.45
Source: IPCC, 1996
Table 4.3 Methane Producing Capacities (Bo) of Manure from Livestock
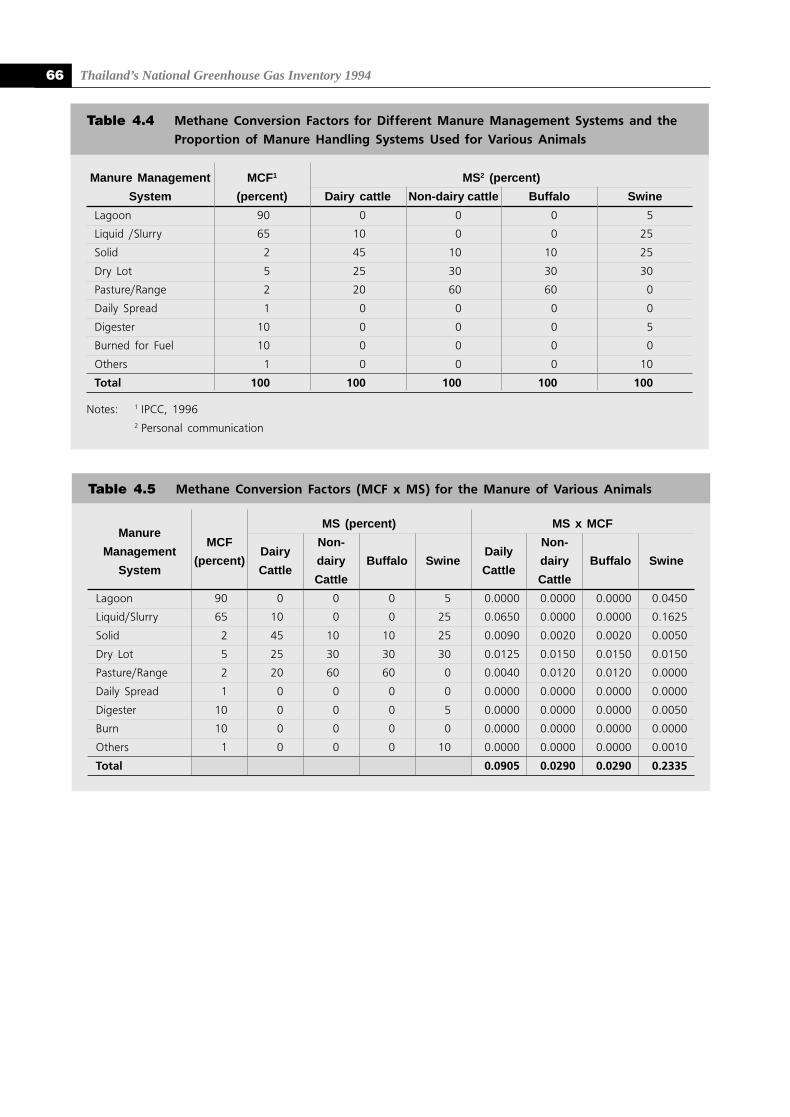
Thailand’s National Greenhouse Gas Inventory 199466
Table 4.5 Methane Conversion Factors (MCF x MS) for the Manure of Various Animals
Manure Management MCF1 MS2 (percent)
System (percent) Dairy cattle Non-dairy cattle Buffalo Swine
Lagoon 90 0 0 0 5
Liquid /Slurry 65 10 0 0 25
Solid 2 45 10 10 25
Dry Lot 5 25 30 30 30
Pasture/Range 2 20 60 60 0
Daily Spread 1 0 0 0 0
Digester 10 0 0 0 5
Burned for Fuel 10 0 0 0 0
Others 1 0 0 0 10
Total 100 100 100 100 100
Notes: 1 IPCC, 19962 Personal communication
Table 4.4 Methane Conversion Factors for Different Manure Management Systems and theProportion of Manure Handling Systems Used for Various Animals
ManureMS (percent) MS x MCF
ManagementMCF
DairyNon-
DailyNon-
System(percent)
Cattledairy Buffalo Swine
Cattledairy Buffalo Swine
Cattle Cattle
Lagoon 90 0 0 0 5 0.0000 0.0000 0.0000 0.0450
Liquid/Slurry 65 10 0 0 25 0.0650 0.0000 0.0000 0.1625
Solid 2 45 10 10 25 0.0090 0.0020 0.0020 0.0050
Dry Lot 5 25 30 30 30 0.0125 0.0150 0.0150 0.0150
Pasture/Range 2 20 60 60 0 0.0040 0.0120 0.0120 0.0000
Daily Spread 1 0 0 0 0 0.0000 0.0000 0.0000 0.0000
Digester 10 0 0 0 5 0.0000 0.0000 0.0000 0.0050
Burn 10 0 0 0 0 0.0000 0.0000 0.0000 0.0000
Others 1 0 0 0 10 0.0000 0.0000 0.0000 0.0010
Total 0.0905 0.0290 0.0290 0.2335
Agriculture Sector: Livestock 67
4.4 RESULTSThe population of major economic animals in
Thailand in 1994 was 265,873 for dairy cattle; 7,371,477for non-dairy cattle; 4,224,791 for buffalo; 8,479,400 forswine; and 151,808,913 for poultry. The population ofnon-dairy cattle and buffalo was much greater than otherruminants. Although relatively small in number, however,the population of dairy cattle in the country has beenincreasing at a rapid pace. According to the Division ofAgricultural Research (1995), the population of dairycattle increased at the rate of about 22 percent per annumduring the 6th National Economic and Social DevelopmentPlan (1988-1991).
Estimates of methane production from the microbialdigestion of feed from all livestock during the base year,1994, are shown on Table 4.8. Dairy cattle, non-dairycattle, buffalo and swine produced an estimated 17.897
349.163, 249.748 and 12.719 Gg of methane, respectively,from the enteric fermentation of digested feed. Totalmethane emissions from the microbial fermentation offeed from all animal types in 1994 was 629.526 Gg.
During the same year, an additional 2.658, 13.555,9.716 and 109.948 Gg of methane and 0.454, 9.270, 5.311and 2.516 Gg of nitrous oxide were found to be releasedfrom the management of wastes produced by the fourmajor economic animals, respectively. Altogether, 125.813Gg of methane and 19.192 Gg of nitrous oxide wereemitted from the manure of all livestock. By type ofanimals, non-dairy cattle and buffalo were found toproduce about 95.1 percent of total methane emissionsfrom enteric fermentation (Figure 4.1) and 81.2 percentof nitrous oxide emissions from the manure managementsystems (Figure 4.2), while the swine population wasresponsible for about 87.4 percent of the methaneemissions from all livestock manure (Figure 4.3).
N excretion (kg/yr)Nexawms
Animals Next Lagoon Liquid Solid Dry Lot Pasture Daily Digester Burn Others(N kg/yr)
spread
Dairy cattle 60 0 1,595,238 7,178,571 3,988,095 3,190,476 0 0 0 0 15,952,380
Non-dairy cattle 40 0 0 29,485,908 88,457,724 176,915,448 0 0 0 0 294,859,080
Buffalo 40 0 0 16,899,164 50,697,492 101,394,984 0 0 0 0 168,991,640
Swine 16 6,783,520 33,917,600 33,917,600 40,701,120 0 0 6,783,520 0 13,567,040 135,670,400
Poultry 0.6 910,854 1,821,707 0 0 40,077,553 0 910,854 0 47,364,381 91,085,348
Table 4.7 Estimated Nitrogen Excretion from Animals (Next) and Waste Management (Nex
awms)
ManureEF
Animal (percent)
Management(kg N2O)
Dairy Non-dairyBuffalo1 Swine1 Poultry2
System Cattle1 Cattle1
Lagoon 0.001 0 0 0 5 1
Liquid/Slurry 0.001 10 0 0 25 2
Solid 0.02 45 10 10 25 0
Dry Lot 0.02 25 30 30 30 0
Pasture/Range 0.02 20 60 60 0 44
Daily Spread 0.0 0 0 0 0 0
Digester 0.0 0 0 0 5 1
Burn 0.0 0 0 0 0 0
Others 0.005 0 0 0 10 52
Notes: 1 Personal communication2 IPCC, 1996
Table 4.6 Nitrous Oxide Emission Factors (EF) and Percentage of Dif ferent ManureManagement Systems used for Various Animals
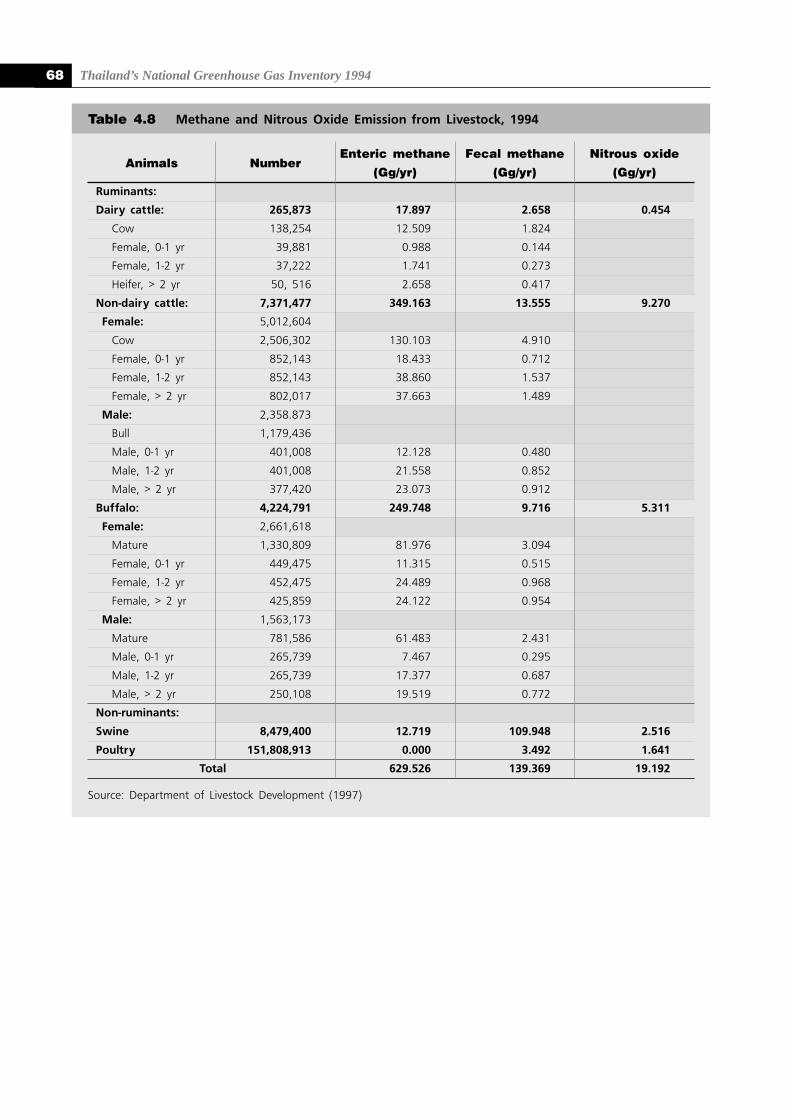
Thailand’s National Greenhouse Gas Inventory 199468
Table 4.8 Methane and Nitrous Oxide Emission from Livestock, 1994
Animals NumberEnteric methane Fecal methane Nitrous oxide
(Gg/yr) (Gg/yr) (Gg/yr)
Ruminants:
Dairy cattle: 265,873 17.897 2.658 0.454
Cow 138,254 12.509 1.824
Female, 0-1 yr 39,881 0.988 0.144
Female, 1-2 yr 37,222 1.741 0.273
Heifer, > 2 yr 50, 516 2.658 0.417
Non-dairy cattle: 7,371,477 349.163 13.555 9.270
Female: 5,012,604
Cow 2,506,302 130.103 4.910
Female, 0-1 yr 852,143 18.433 0.712
Female, 1-2 yr 852,143 38.860 1.537
Female, > 2 yr 802,017 37.663 1.489
Male: 2,358.873
Bull 1,179,436
Male, 0-1 yr 401,008 12.128 0.480
Male, 1-2 yr 401,008 21.558 0.852
Male, > 2 yr 377,420 23.073 0.912
Buffalo: 4,224,791 249.748 9.716 5.311
Female: 2,661,618
Mature 1,330,809 81.976 3.094
Female, 0-1 yr 449,475 11.315 0.515
Female, 1-2 yr 452,475 24.489 0.968
Female, > 2 yr 425,859 24.122 0.954
Male: 1,563,173
Mature 781,586 61.483 2.431
Male, 0-1 yr 265,739 7.467 0.295
Male, 1-2 yr 265,739 17.377 0.687
Male, > 2 yr 250,108 19.519 0.772
Non-ruminants:
Swine 8,479,400 12.719 109.948 2.516
Poultry 151,808,913 0.000 3.492 1.641
Total 629.526 139.369 19.192
Source: Department of Livestock Development (1997)
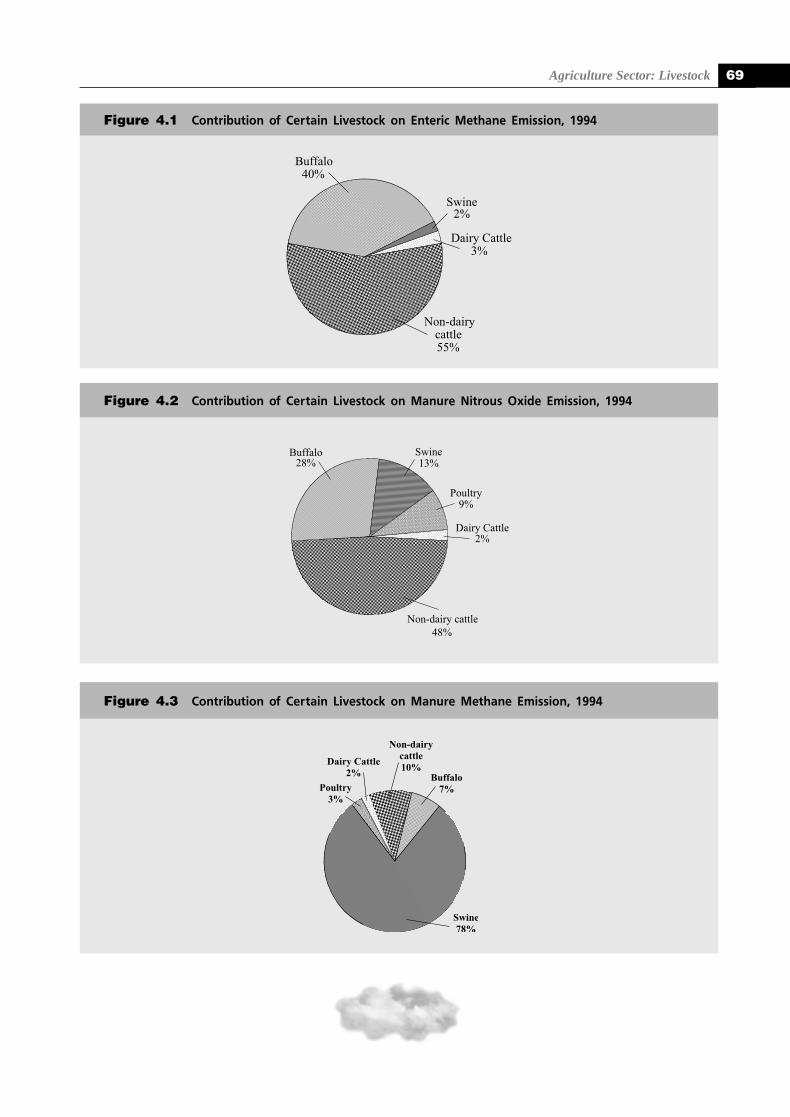
Agriculture Sector: Livestock 69
Figure 4.1 Contribution of Certain Livestock on Enteric Methane Emission, 1994
Figure 4.2 Contribution of Certain Livestock on Manure Nitrous Oxide Emission, 1994
Figure 4.3 Contribution of Certain Livestock on Manure Methane Emission, 1994
Thailand’s National Greenhouse Gas Inventory 199470
REFERENCES:
Chantalakhana, C., 1984. Beef cattle and buffalo breedingin Thailand. In Copland, J.W., ed. Proceeding ofInternational Workshop on Evaluation of LargeRuminants for the Tropics, Australian Center forInternational Agricultural Research (ACIAR) SeriesNo. 5, Canberra, Australia. pp. 29-36.
Department of Livestock Development, 1997. YearlyStatistic Reports. Ministry of Agriculture andCooperatives, Bangkok, Thailand. 166 pp.
Dinius, D.A., M.E. Simson and P.B. Marsh. 1976. Effectof monensin fed with forage on degestion and theruminal ecosystem of streers. J.Anim.Sci. 42:229
Division of Agricultural Research, 1995. LivestockDevelopment Policy for the 8th National Economicand Social Development Plan 1997-1921. Office ofthe Agricultural Economics, Ministry of Agricultureand Cooperatives. Agricultural Economics No. 83/1995. Bangkok, Thailand. 67 pp. (in Thai).
Intergovernmental Panel on Climate Changes, 1996.Greenhouse Gas Inventory Reference Manual.Meteorological Centre, London, UK. 364 pp.
Mc Dowell L.R. 1997. Minerals for Grazing Ruminantsin Tropical Regions. University of Florida.Gainesville, Florida. 81 pp.
Office of Agricultural Economics, 1993. AgriculturalStatistics of Thailand : Crop Year 1991-1992.Agricultural Statistics No. 441, Ministry ofAgriculture and Co-operatives, Bangkok, Thailand.271 pp.
Rattanaronchart, S., 1972. Live and carcass traits and theirrelationship in Thai cattle and buffalo. M.S. Thesis,Department of Animal Science, Kasetsart University,Bangkok, Thailand. 59 pp. (in Thai).
Songprasert, J., 1974. Characteristics and PredictionEquations of Cattle and Buffalo Weights andMeasurements in Different Seasons. M.S. Thesis,Department of Animal Science, Kasetsart University,Bangkok, Thailand.
Thornton., J.H., F.N. Owens, R.P. Lemanager and R.Tolusek. 1976. Monensin and ruminal methaneproduction. J.Anim. Sci. 43:336
Tumwasorn, S., 1993. Evaluation of Beef Cattle Projectsfor Farmers; Solutions to the Problems of LowProductivity Cattle. Kasetsart University Research &Development Institute, Kasetsart University. 40 pp.(in Thai).
Agriculture Sector: Livestock 71
Strategies forGHG Emission Mitigationfrom Livestock
Anticipated Trends in GHG Emissionsfrom Livestock
Parallel to the growth in numbers of most livestock,methane and nitrous oxide emissions from animals inThailand are expected to increase. Based on the historicaltrend, it was projected that Methane and nitrous oxideemissions would increase from 687 and 19 Gg in 1994to 691 and 22 Gg in 2020, with the slight drops in 2000.Unless the composition of the animal population changes,it is anticipated that non-dairy cattle and buffalo wouldcontinue to account for most of enteric methane andnitrous oxide from manure, while swine production wouldbe responsible for most of the methane released from alllivestock manure. To be effective, emission reductionstrategies must therefore be targeted at these specificgroups of animals.
Strategies to Reduce Methane Emissionsfrom Enteric Fermentation
Most ruminants in Thailand are raised under asystem of smallholding. Under this system, the animalsare generally provided with minimum input. Insufficientnutrient intake as well as nutrient imbalance lead toinsufficient rumen fermentation.
The reports of McDowell (1997) show thatimproving the nutrient intake of ruminants could havebeneficial impacts on the animals. For example, 37percent improvement in calving percentage were observedwhen Thai village cattle received only mineralsupplements. Therefore, an improvement in feedutilization efficiency could be considered as a means toreduce GHG emissions, particularly from large ruminants.
To achieve this objective, the following nationalfeeding improvement plans for ruminants arerecommended:
1. Mineral supplements to meet the minimumlocal requirements of animals should be formulated andprovided for use by the farmers.
2. Supplementing poor quality roughage with urea-molasses, legumes and/or low-cost agricultural by-products should be encouraged wherever and whenevereconomically and socially feasible.
3. Chemical treatment of low quality roughage,particularly with urea solution should be employed
wherever possible. The treatment technique has beensuccessfully utilized to improve the digestibility and toincrease the non-protein nitrogen content of fibrous feeds.
4. Wider use of pasture and forage conservationfor dry season feeding, particularly in the case of dairycattle, should be promoted.
With a proper nationwide extension program, itis anticipated that the digestibility of feeds for variousruminants will gradually increase to about 65 percent orover by the year 2020. Higher feed utilization efficiencywill eventually reduce enteric methane emission throughimproved rumen fermentation and, at the same time,lower the volume of fecal excretion in the animals.According to IPCC (1996), a 5 percent improvement inthe digestibility of feed for ruminants could eventuallylead to a 10 percent reduction in enteric methaneemission. At this level of feed digestibility improvement,a further decline of 22 percent in fecal methane could beobserved, as fecal outputs from the animals are reduced.
Another approach to mitigating methaneproduction from rumen fermentation involves the use ofionophore, particularly monensic acid, in ruminants. Whenused as an additive in feed, monensin is reported toprovide a general increase in annual productivity. Theionophore enhances the molar proportion of propionicacid and, thereby, causes a consequent reduction inmethane production in the rumen. Studies by Dinius,et al. (1976) and Thornton, et al. (1976) showed a declineof 40.5 percent and 16.6 percent in methane production,respectively. The use of monensin in enteric methaneemission mitigation will be cost effective through itsenhancing effect towards the animal’s feed conversionefficiency. Table A4.1 illustrates the feed digestibilityimprovement target from 1995 to 2020 through the useof ionophore as a feed additive for large ruminantanimals.
Strategies to Reduce Fecal MethaneEmissions
Since over 85 percent of fecal methane in 1994were from swine, emphasis must be given to improvingthe waste management system that is currently in place.Zoning regulations for swine farming, particularly thosefor small and medium-sized farms, should be introduced.These areas should be furnished with central wastewatertreatment facilities. Similar wastewater treatment systemsshould be enforced for large scale swine productionoperation elsewhere in the country. Wherever possible,the methane gas produced must be harvested as fuel forheating, electricity or other energy purposes. The schedulefor manure management modification from swineproduction activities is illustrated on Table A4.2.
APPENDIX
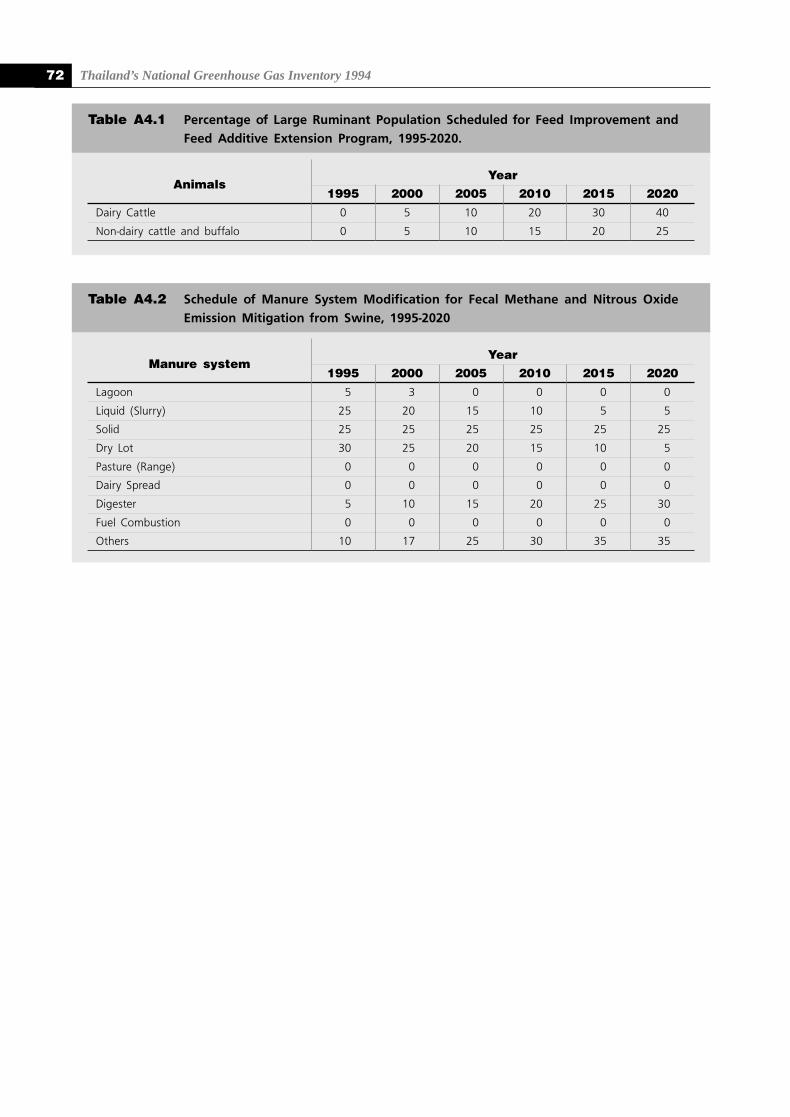
Thailand’s National Greenhouse Gas Inventory 199472
Manure systemYear
1995 2000 2005 2010 2015 2020
Lagoon 5 3 0 0 0 0
Liquid (Slurry) 25 20 15 10 5 5
Solid 25 25 25 25 25 25
Dry Lot 30 25 20 15 10 5
Pasture (Range) 0 0 0 0 0 0
Dairy Spread 0 0 0 0 0 0
Digester 5 10 15 20 25 30
Fuel Combustion 0 0 0 0 0 0
Others 10 17 25 30 35 35
Table A4.2 Schedule of Manure System Modification for Fecal Methane and Nitrous OxideEmission Mitigation from Swine, 1995-2020
AnimalsYear
1995 2000 2005 2010 2015 2020
Dairy Cattle 0 5 10 20 30 40
Non-dairy cattle and buffalo 0 5 10 15 20 25
Table A4.1 Percentage of Large Ruminant Population Scheduled for Feed Improvement andFeed Additive Extension Program, 1995-2020.
5C H A P T E R
b y P i m p a n J e r m s a w a t d i p o n g
● Introduction
● Methodology
● Data
● Results
AGRICULTURE SECTOR:AGRICULTURAL SOILS
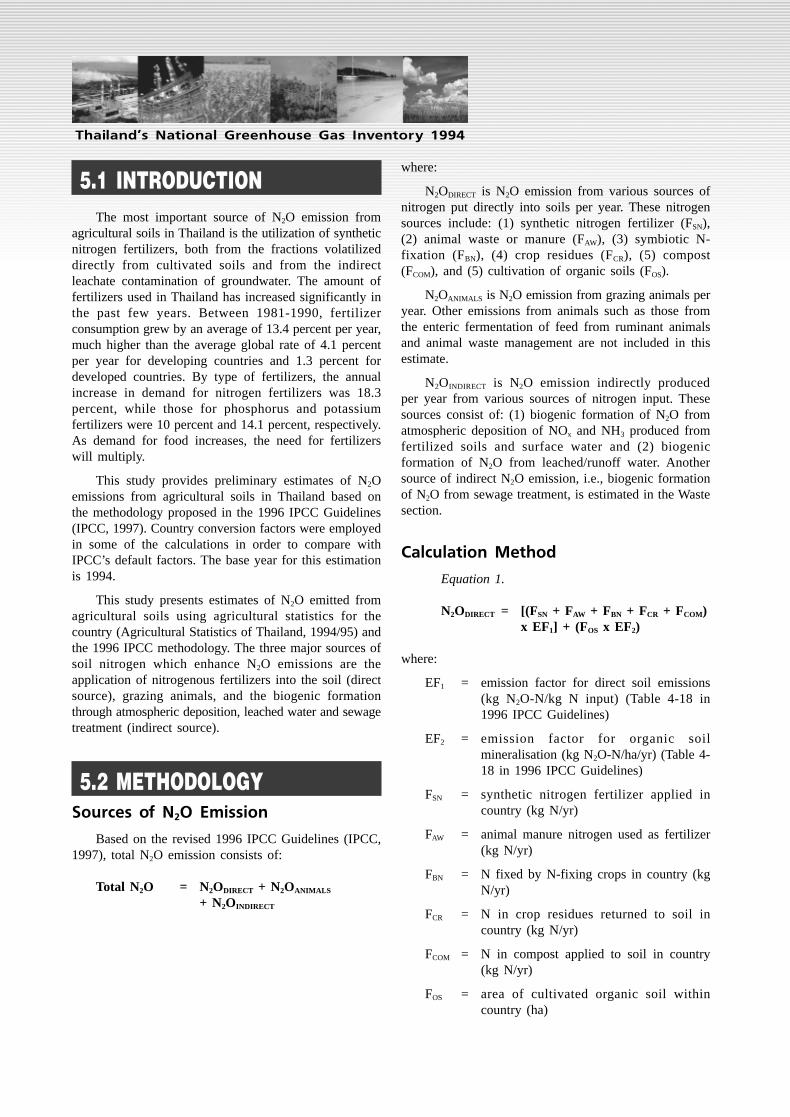
Thailand’s National Greenhouse Gas Inventory 199474
Thailand’s National Greenhouse Gas Inventory 1994
5.1 INTRODUCTIONThe most important source of N2O emission from
agricultural soils in Thailand is the utilization of syntheticnitrogen fertilizers, both from the fractions volatilizeddirectly from cultivated soils and from the indirectleachate contamination of groundwater. The amount offertilizers used in Thailand has increased significantly inthe past few years. Between 1981-1990, fertilizerconsumption grew by an average of 13.4 percent per year,much higher than the average global rate of 4.1 percentper year for developing countries and 1.3 percent fordeveloped countries. By type of fertilizers, the annualincrease in demand for nitrogen fertilizers was 18.3percent, while those for phosphorus and potassiumfertilizers were 10 percent and 14.1 percent, respectively.As demand for food increases, the need for fertilizerswill multiply.
This study provides preliminary estimates of N2Oemissions from agricultural soils in Thailand based onthe methodology proposed in the 1996 IPCC Guidelines(IPCC, 1997). Country conversion factors were employedin some of the calculations in order to compare withIPCC’s default factors. The base year for this estimationis 1994.
This study presents estimates of N2O emitted fromagricultural soils using agricultural statistics for thecountry (Agricultural Statistics of Thailand, 1994/95) andthe 1996 IPCC methodology. The three major sources ofsoil nitrogen which enhance N2O emissions are theapplication of nitrogenous fertilizers into the soil (directsource), grazing animals, and the biogenic formationthrough atmospheric deposition, leached water and sewagetreatment (indirect source).
5.2 METHODOLOGYSources of N2O Emission
Based on the revised 1996 IPCC Guidelines (IPCC,1997), total N2O emission consists of:
Total N2O = N2ODIRECT + N2OANIMALS
+ N2OINDIRECT
where:
N2ODIRECT is N2O emission from various sources ofnitrogen put directly into soils per year. These nitrogensources include: (1) synthetic nitrogen fertilizer (FSN),(2) animal waste or manure (FAW), (3) symbiotic N-fixation (FBN), (4) crop residues (FCR), (5) compost(FCOM), and (5) cultivation of organic soils (FOS).
N2OANIMALS is N2O emission from grazing animals peryear. Other emissions from animals such as those fromthe enteric fermentation of feed from ruminant animalsand animal waste management are not included in thisestimate.
N2OINDIRECT is N2O emission indirectly producedper year from various sources of nitrogen input. Thesesources consist of: (1) biogenic formation of N2O fromatmospheric deposition of NOx and NH3 produced fromfertilized soils and surface water and (2) biogenicformation of N2O from leached/runoff water. Anothersource of indirect N2O emission, i.e., biogenic formationof N2O from sewage treatment, is estimated in the Wastesection.
Calculation Method
Equation 1.
N2ODIRECT = [(FSN + FAW + FBN + FCR + FCOM)x EF1] + (FOS x EF2)
where:
EF1 = emission factor for direct soil emissions(kg N2O-N/kg N input) (Table 4-18 in1996 IPCC Guidelines)
EF2 = emission factor for organic soilmineralisation (kg N2O-N/ha/yr) (Table 4-18 in 1996 IPCC Guidelines)
FSN = synthetic nitrogen fertilizer applied incountry (kg N/yr)
FAW = animal manure nitrogen used as fertilizer(kg N/yr)
FBN = N fixed by N-fixing crops in country (kgN/yr)
FCR = N in crop residues returned to soil incountry (kg N/yr)
FCOM = N in compost applied to soil in country(kg N/yr)
FOS = area of cultivated organic soil withincountry (ha)
Agriculture Sector: Agricultural Soils 75
Equation 2.
N2OANIMALS = Σ [N(T) x Nex(T)
x FracGRAZ(T) x EF3]
where:
N(T) = animal numbers of type T in thecountry
Nex(T) = N excretion of animal of type T inthe country (kg N/animal/yr) (Table4-20 in 1996 IPCC Guidelines)
FracGRAZ(T) = fraction of Nex(T) that is released inone of the different grazing animalof type T in the country (Table 4-21in 1996 IPCC Guidelines)
EF3 = N2O emission factor for animalwaste excreted in pastures (0.02 kgN2O-N/kg of Nex)
Equation 3.
N2OINDIRECT = N2O(G) + N2O(L)
where:
N2O(G) = N2O emission from atmosphericdeposition of NOx and NH3
N2O(L) = N2O emission from nitrogen leachingand runoff
5.3 DATASynthetic Fertilizer
Nitrogen fertilizer consumption in 1994 varied bycrop types. Rice production utilized about 43 percent ofthe country’s total consumption, while other crops eachaccounted for about 17-20 percent. Nitrous oxide releasedfrom rice cultivation in Thailand was assumed to beminimal because fertilizer was normally applied toirrigated areas which are under continuous flooding.Nitrous oxide emission from paddy fields only occursduring drainage period. Hence, only nitrogen fertilizersused for other crops were the main sources of nitrousoxide emissions. The fraction of nitrogen fertilizer thatis volatilized as NH3 and NOx, equivalent to 0.1 kg NH3-N+NOx-N/kg of synthetic fertilizer applied, was accountedfor in the loss of soil N (IPCC, 1997).
The contributions of nitrogen compounds fromsynthetic fertilizer application are presented on Table 5.1.The fraction of nitrogen that enters into the soil (FSN)and which is lost as NH3 and NOx during the applicationof nitrogenous fertilizers is estimated at 348,715 and38,746 tonnes in 1994, respectively.
Animal Waste or Manure
Organic nitrogen fertilizer applied to soils fromanimal manure was quantified based on animal population(see Table 5.2), and waste management. The nitrogenexcretion (Nex) for each type of animal was determinedusing the IPCC default values given on Table 4-20 ofthe 1996 IPCC Guidelines (IPCC,1997) for all type ofmanure management system excluding pasture/range andpercentages of different manure management system usedfor various animals presented in Table 4.7 in the livestocksector in Chapter 4 above. These amounts were then
NFERTFSN
Synthetic nitrogen N fertilizer Loss as NH3+NOx Net soil N inputfertilizer application application (tonnes/yr)
(tonnes/yr)(tonnes/yr)
Field crops 116,291 11,629 104,662
Fruit trees 135,571 13,557 122,014
Vegetables & Ornamental Plants 135,600 13,560 122,040
Total 387,462 38,746 348,715
Table 5.1 Nitrogen Produced From Synthetic Nitrogen Fertilizer Application, 1994
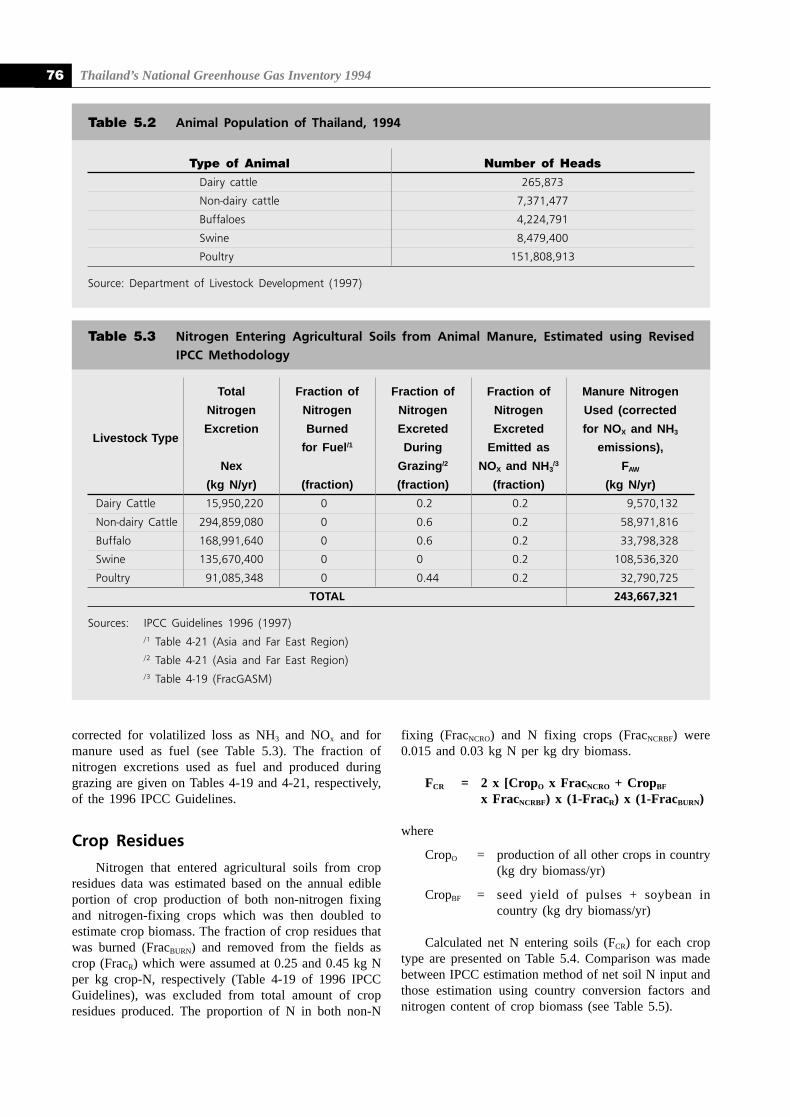
Thailand’s National Greenhouse Gas Inventory 199476
corrected for volatilized loss as NH3 and NOx and formanure used as fuel (see Table 5.3). The fraction ofnitrogen excretions used as fuel and produced duringgrazing are given on Tables 4-19 and 4-21, respectively,of the 1996 IPCC Guidelines.
Crop Residues
Nitrogen that entered agricultural soils from cropresidues data was estimated based on the annual edibleportion of crop production of both non-nitrogen fixingand nitrogen-fixing crops which was then doubled toestimate crop biomass. The fraction of crop residues thatwas burned (FracBURN) and removed from the fields ascrop (FracR) which were assumed at 0.25 and 0.45 kg Nper kg crop-N, respectively (Table 4-19 of 1996 IPCCGuidelines), was excluded from total amount of cropresidues produced. The proportion of N in both non-N
fixing (FracNCRO) and N fixing crops (FracNCRBF) were0.015 and 0.03 kg N per kg dry biomass.
FCR = 2 x [CropO x FracNCRO + CropBF
x FracNCRBF) x (1-FracR) x (1-FracBURN)
where
CropO = production of all other crops in country(kg dry biomass/yr)
CropBF = seed yield of pulses + soybean incountry (kg dry biomass/yr)
Calculated net N entering soils (FCR) for each croptype are presented on Table 5.4. Comparison was madebetween IPCC estimation method of net soil N input andthose estimation using country conversion factors andnitrogen content of crop biomass (see Table 5.5).
Total Fraction of Fraction of Fraction of Manure Nitrogen
Nitrogen Nitrogen Nitrogen Nitrogen Used (corrected
Livestock TypeExcretion Burned Excreted Excreted for NOX and NH3
for Fuel/1 During Emitted as emissions),
Nex Grazing/2 NOX and NH3/3 FAW
(kg N/yr) (fraction) (fraction) (fraction) (kg N/yr)
Dairy Cattle 15,950,220 0 0.2 0.2 9,570,132
Non-dairy Cattle 294,859,080 0 0.6 0.2 58,971,816
Buffalo 168,991,640 0 0.6 0.2 33,798,328
Swine 135,670,400 0 0 0.2 108,536,320
Poultry 91,085,348 0 0.44 0.2 32,790,725
TOTAL 243,667,321
Sources: IPCC Guidelines 1996 (1997)/1 Table 4-21 (Asia and Far East Region)/2 Table 4-21 (Asia and Far East Region)/3 Table 4-19 (FracGASM)
Table 5.3 Nitrogen Entering Agricultural Soils from Animal Manure, Estimated using RevisedIPCC Methodology
Type of Animal Number of Heads
Dairy cattle 265,873
Non-dairy cattle 7,371,477
Buffaloes 4,224,791
Swine 8,479,400
Poultry 151,808,913
Source: Department of Livestock Development (1997)
Table 5.2 Animal Population of Thailand, 1994
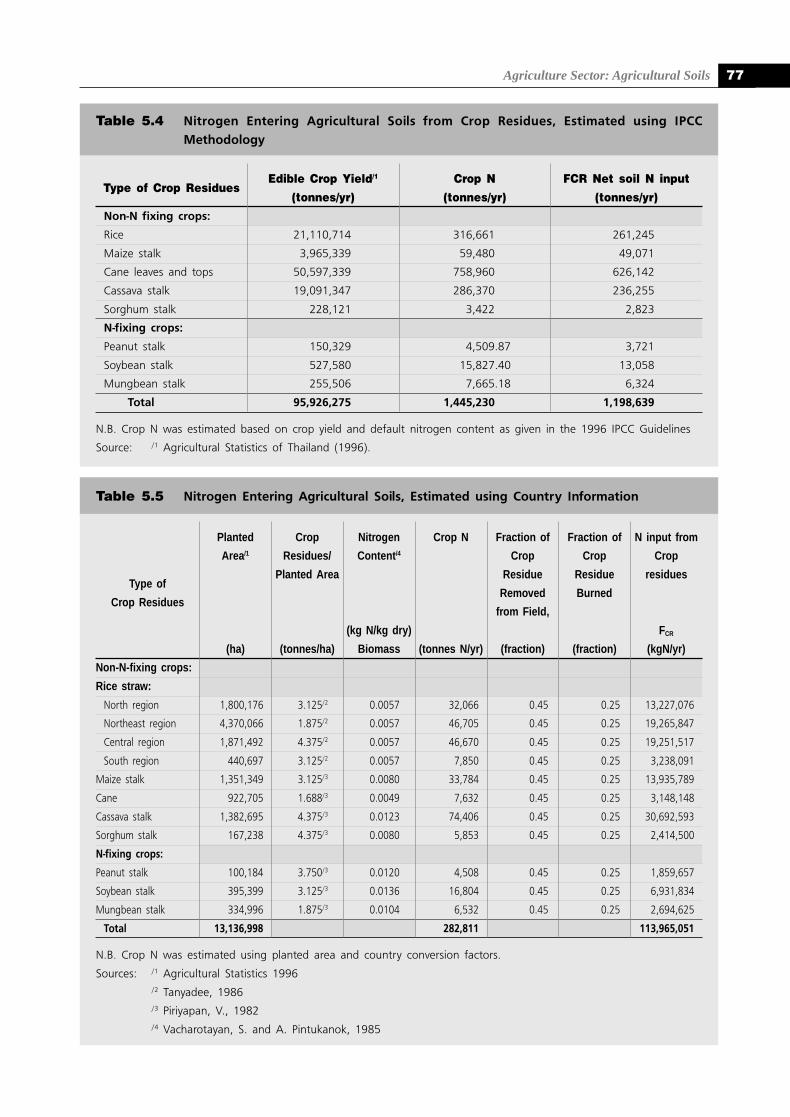
Agriculture Sector: Agricultural Soils 77
Table 5.5 Nitrogen Entering Agricultural Soils, Estimated using Country Information
Table 5.4 Nitrogen Entering Agricultural Soils from Crop Residues, Estimated using IPCCMethodology
Type of Crop ResiduesEdible Crop Yield/1 Crop N FCR Net soil N input
(tonnes/yr) (tonnes/yr) (tonnes/yr)Non-N fixing crops:
Rice 21,110,714 316,661 261,245
Maize stalk 3,965,339 59,480 49,071
Cane leaves and tops 50,597,339 758,960 626,142
Cassava stalk 19,091,347 286,370 236,255
Sorghum stalk 228,121 3,422 2,823
N-fixing crops:
Peanut stalk 150,329 4,509.87 3,721
Soybean stalk 527,580 15,827.40 13,058
Mungbean stalk 255,506 7,665.18 6,324
Total 95,926,275 1,445,230 1,198,639
N.B. Crop N was estimated based on crop yield and default nitrogen content as given in the 1996 IPCC Guidelines
Source: /1 Agricultural Statistics of Thailand (1996).
Planted Crop Nitrogen Crop N Fraction of Fraction of N input from
Area/1 Residues/ Content/4 Crop Crop Crop
Type ofPlanted Area Residue Residue residues
Crop ResiduesRemoved Burned
from Field,
(kg N/kg dry) FCR
(ha) (tonnes/ha) Biomass (tonnes N/yr) (fraction) (fraction) (kgN/yr)
Non-N-fixing crops:
Rice straw:
North region 1,800,176 3.125/2 0.0057 32,066 0.45 0.25 13,227,076
Northeast region 4,370,066 1.875/2 0.0057 46,705 0.45 0.25 19,265,847
Central region 1,871,492 4.375/2 0.0057 46,670 0.45 0.25 19,251,517
South region 440,697 3.125/2 0.0057 7,850 0.45 0.25 3,238,091
Maize stalk 1,351,349 3.125/3 0.0080 33,784 0.45 0.25 13,935,789
Cane 922,705 1.688/3 0.0049 7,632 0.45 0.25 3,148,148
Cassava stalk 1,382,695 4.375/3 0.0123 74,406 0.45 0.25 30,692,593
Sorghum stalk 167,238 4.375/3 0.0080 5,853 0.45 0.25 2,414,500
N-fixing crops:
Peanut stalk 100,184 3.750/3 0.0120 4,508 0.45 0.25 1,859,657
Soybean stalk 395,399 3.125/3 0.0136 16,804 0.45 0.25 6,931,834
Mungbean stalk 334,996 1.875/3 0.0104 6,532 0.45 0.25 2,694,625
Total 13,136,998 282,811 113,965,051
N.B. Crop N was estimated using planted area and country conversion factors.
Sources: /1 Agricultural Statistics 1996/2 Tanyadee, 1986/3 Piriyapan, V., 1982/4 Vacharotayan, S. and A. Pintukanok, 1985
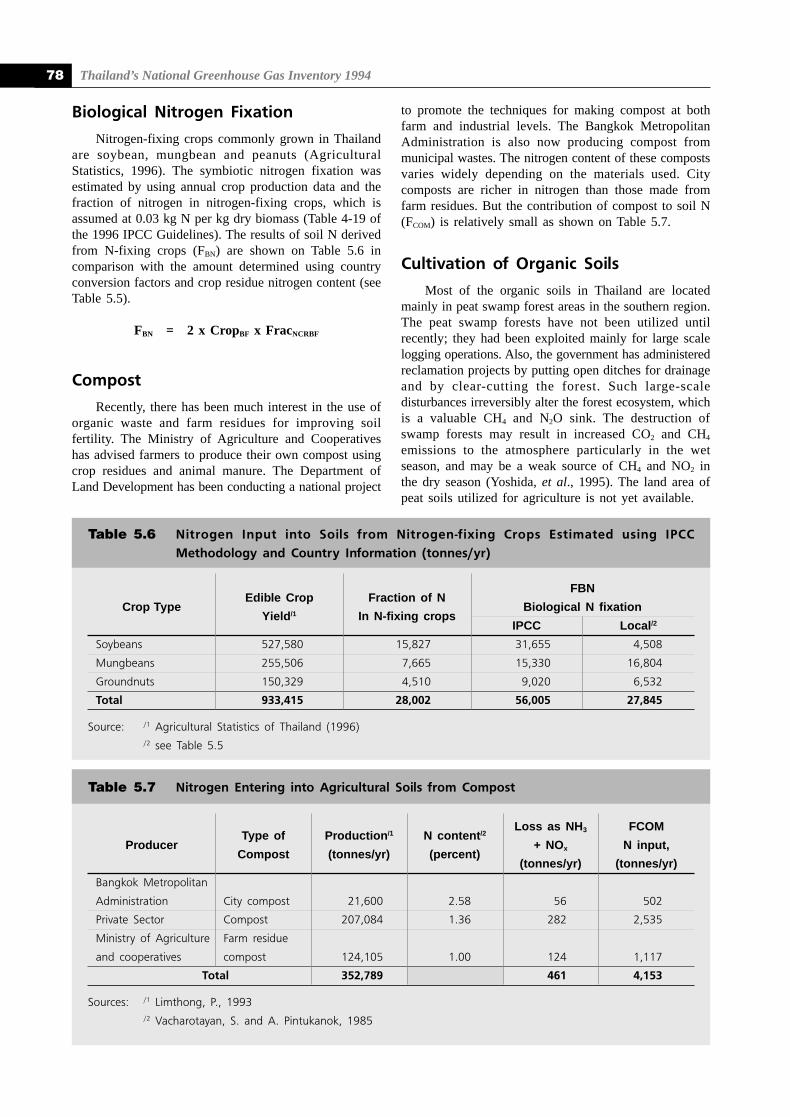
Thailand’s National Greenhouse Gas Inventory 199478
Biological Nitrogen Fixation
Nitrogen-fixing crops commonly grown in Thailandare soybean, mungbean and peanuts (AgriculturalStatistics, 1996). The symbiotic nitrogen fixation wasestimated by using annual crop production data and thefraction of nitrogen in nitrogen-fixing crops, which isassumed at 0.03 kg N per kg dry biomass (Table 4-19 ofthe 1996 IPCC Guidelines). The results of soil N derivedfrom N-fixing crops (FBN) are shown on Table 5.6 incomparison with the amount determined using countryconversion factors and crop residue nitrogen content (seeTable 5.5).
FBN = 2 x CropBF x FracNCRBF
Compost
Recently, there has been much interest in the use oforganic waste and farm residues for improving soilfertility. The Ministry of Agriculture and Cooperativeshas advised farmers to produce their own compost usingcrop residues and animal manure. The Department ofLand Development has been conducting a national project
to promote the techniques for making compost at bothfarm and industrial levels. The Bangkok MetropolitanAdministration is also now producing compost frommunicipal wastes. The nitrogen content of these compostsvaries widely depending on the materials used. Citycomposts are richer in nitrogen than those made fromfarm residues. But the contribution of compost to soil N(FCOM) is relatively small as shown on Table 5.7.
Cultivation of Organic Soils
Most of the organic soils in Thailand are locatedmainly in peat swamp forest areas in the southern region.The peat swamp forests have not been utilized untilrecently; they had been exploited mainly for large scalelogging operations. Also, the government has administeredreclamation projects by putting open ditches for drainageand by clear-cutting the forest. Such large-scaledisturbances irreversibly alter the forest ecosystem, whichis a valuable CH4 and N2O sink. The destruction ofswamp forests may result in increased CO2 and CH4
emissions to the atmosphere particularly in the wetseason, and may be a weak source of CH4 and NO2 inthe dry season (Yoshida, et al., 1995). The land area ofpeat soils utilized for agriculture is not yet available.
Table 5.7 Nitrogen Entering into Agricultural Soils from Compost
Edible Crop Fraction of NFBN
Crop TypeYield/1 In N-fixing crops
Biological N fixation
IPCC Local/2
Soybeans 527,580 15,827 31,655 4,508
Mungbeans 255,506 7,665 15,330 16,804
Groundnuts 150,329 4,510 9,020 6,532
Total 933,415 28,002 56,005 27,845
Source: /1 Agricultural Statistics of Thailand (1996)/2 see Table 5.5
Table 5.6 Nitrogen Input into Soils from Nitrogen-fixing Crops Estimated using IPCCMethodology and Country Information (tonnes/yr)
Type of Production/1 N content/2Loss as NH3 FCOM
ProducerCompost (tonnes/yr) (percent)
+ NOx N input,
(tonnes/yr) (tonnes/yr)
Bangkok Metropolitan
Administration City compost 21,600 2.58 56 502
Private Sector Compost 207,084 1.36 282 2,535
Ministry of Agriculture Farm residue
and cooperatives compost 124,105 1.00 124 1,117
Total 352,789 461 4,153
Sources: /1 Limthong, P., 1993/2 Vacharotayan, S. and A. Pintukanok, 1985
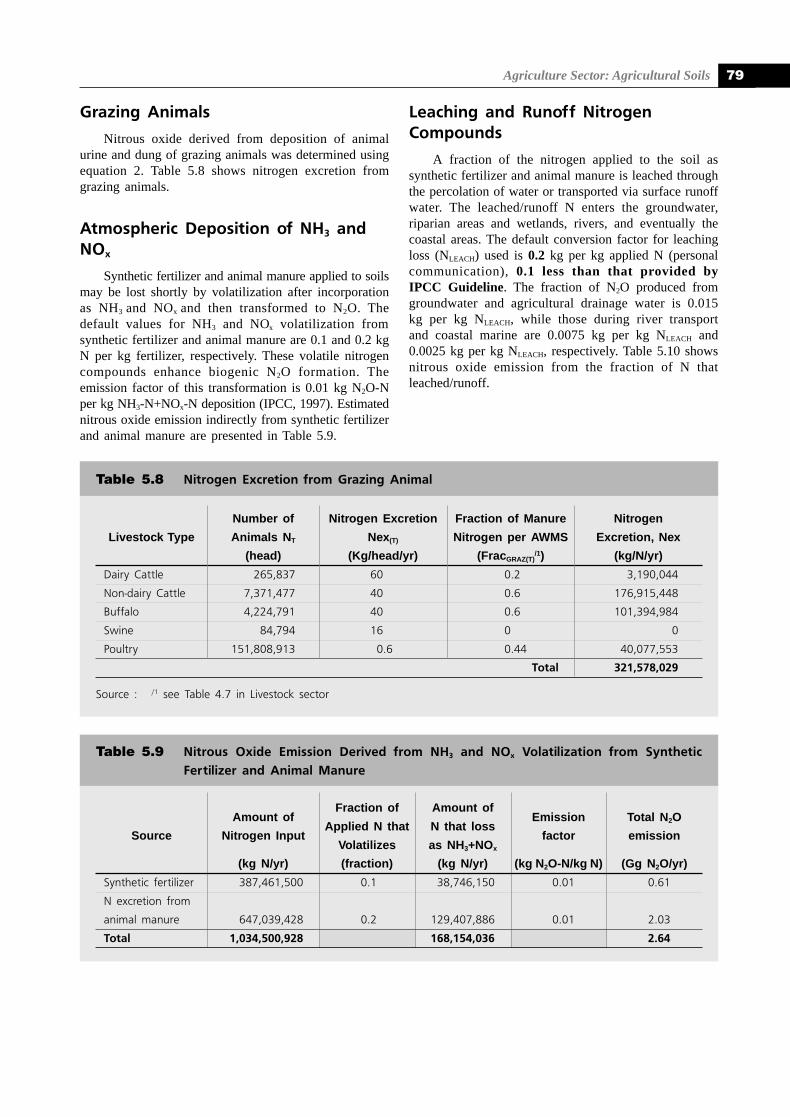
Agriculture Sector: Agricultural Soils 79
Grazing Animals
Nitrous oxide derived from deposition of animalurine and dung of grazing animals was determined usingequation 2. Table 5.8 shows nitrogen excretion fromgrazing animals.
Atmospheric Deposition of NH3 andNOx
Synthetic fertilizer and animal manure applied to soilsmay be lost shortly by volatilization after incorporationas NH3 and NOx and then transformed to N2O. Thedefault values for NH3 and NOx volatilization fromsynthetic fertilizer and animal manure are 0.1 and 0.2 kgN per kg fertilizer, respectively. These volatile nitrogencompounds enhance biogenic N2O formation. Theemission factor of this transformation is 0.01 kg N2O-Nper kg NH3-N+NOx-N deposition (IPCC, 1997). Estimatednitrous oxide emission indirectly from synthetic fertilizerand animal manure are presented in Table 5.9.
Table 5.9 Nitrous Oxide Emission Derived from NH3 and NOx Volatilization from SyntheticFertilizer and Animal Manure
Number of Nitrogen Excretion Fraction of Manure Nitrogen
Livestock Type Animals NT Nex(T) Nitrogen per AWMS Excretion, Nex
(head) (Kg/head/yr) (FracGRAZ(T)/1) (kg/N/yr)
Dairy Cattle 265,837 60 0.2 3,190,044
Non-dairy Cattle 7,371,477 40 0.6 176,915,448
Buffalo 4,224,791 40 0.6 101,394,984
Swine 84,794 16 0 0
Poultry 151,808,913 0.6 0.44 40,077,553
Total 321,578,029
Source : /1 see Table 4.7 in Livestock sector
Table 5.8 Nitrogen Excretion from Grazing Animal
Leaching and Runoff NitrogenCompounds
A fraction of the nitrogen applied to the soil assynthetic fertilizer and animal manure is leached throughthe percolation of water or transported via surface runoffwater. The leached/runoff N enters the groundwater,riparian areas and wetlands, rivers, and eventually thecoastal areas. The default conversion factor for leachingloss (NLEACH) used is 0.2 kg per kg applied N (personalcommunication), 0.1 less than that provided byIPCC Guideline. The fraction of N2O produced fromgroundwater and agricultural drainage water is 0.015kg per kg NLEACH, while those during river transportand coastal marine are 0.0075 kg per kg NLEACH and0.0025 kg per kg NLEACH, respectively. Table 5.10 showsnitrous oxide emission from the fraction of N thatleached/runoff.
Amount ofFraction of Amount of
Emission Total N2O
Source Nitrogen InputApplied N that N that loss
factor emissionVolatilizes as NH3+NOx
(kg N/yr) (fraction) (kg N/yr) (kg N2O-N/kg N) (Gg N2O/yr)
Synthetic fertilizer 387,461,500 0.1 38,746,150 0.01 0.61
N excretion from
animal manure 647,039,428 0.2 129,407,886 0.01 2.03
Total 1,034,500,928 168,154,036 2.64
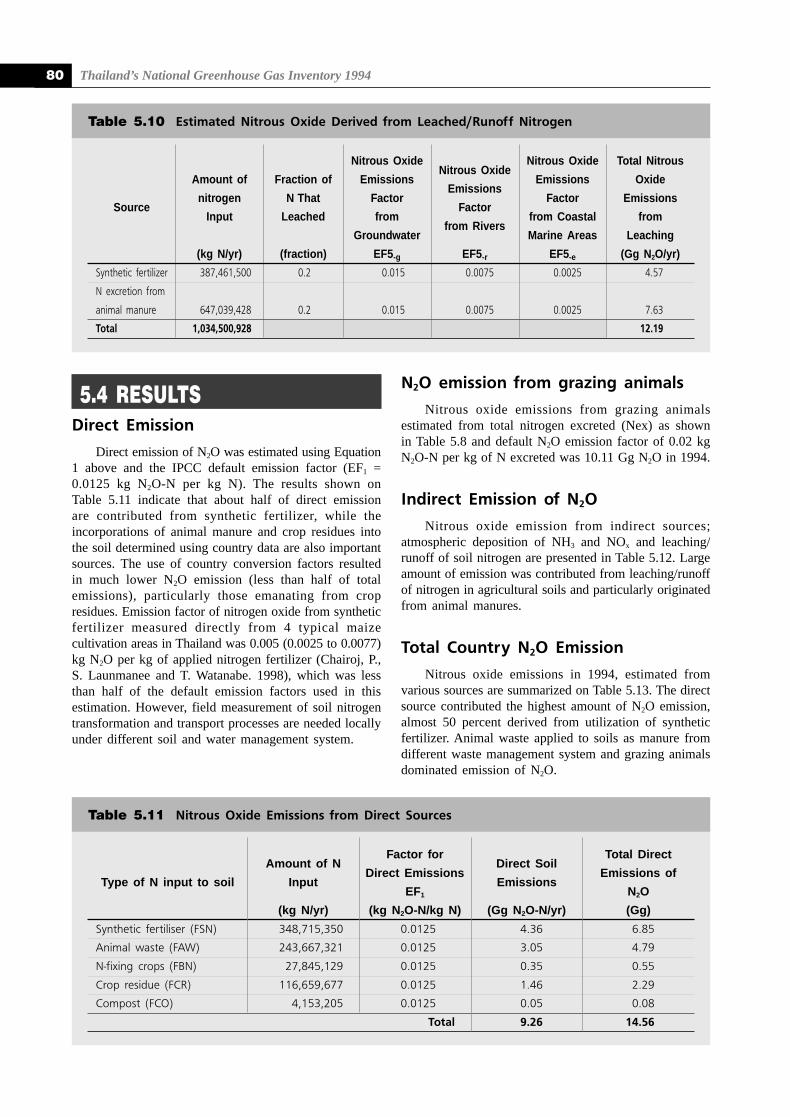
Thailand’s National Greenhouse Gas Inventory 199480
5.4 RESULTSDirect Emission
Direct emission of N2O was estimated using Equation1 above and the IPCC default emission factor (EF1 =0.0125 kg N2O-N per kg N). The results shown onTable 5.11 indicate that about half of direct emissionare contributed from synthetic fertilizer, while theincorporations of animal manure and crop residues intothe soil determined using country data are also importantsources. The use of country conversion factors resultedin much lower N2O emission (less than half of totalemissions), particularly those emanating from cropresidues. Emission factor of nitrogen oxide from syntheticfertilizer measured directly from 4 typical maizecultivation areas in Thailand was 0.005 (0.0025 to 0.0077)kg N2O per kg of applied nitrogen fertilizer (Chairoj, P.,S. Launmanee and T. Watanabe. 1998), which was lessthan half of the default emission factors used in thisestimation. However, field measurement of soil nitrogentransformation and transport processes are needed locallyunder different soil and water management system.
N2O emission from grazing animals
Nitrous oxide emissions from grazing animalsestimated from total nitrogen excreted (Nex) as shownin Table 5.8 and default N2O emission factor of 0.02 kgN2O-N per kg of N excreted was 10.11 Gg N2O in 1994.
Indirect Emission of N2O
Nitrous oxide emission from indirect sources;atmospheric deposition of NH3 and NOx and leaching/runoff of soil nitrogen are presented in Table 5.12. Largeamount of emission was contributed from leaching/runoffof nitrogen in agricultural soils and particularly originatedfrom animal manures.
Total Country N2O Emission
Nitrous oxide emissions in 1994, estimated fromvarious sources are summarized on Table 5.13. The directsource contributed the highest amount of N2O emission,almost 50 percent derived from utilization of syntheticfertilizer. Animal waste applied to soils as manure fromdifferent waste management system and grazing animalsdominated emission of N2O.
Amount of NFactor for
Direct SoilTotal Direct
Type of N input to soil InputDirect Emissions
EmissionsEmissions of
EF1 N2O
(kg N/yr) (kg N2O-N/kg N) (Gg N2O-N/yr) (Gg)
Synthetic fertiliser (FSN) 348,715,350 0.0125 4.36 6.85
Animal waste (FAW) 243,667,321 0.0125 3.05 4.79
N-fixing crops (FBN) 27,845,129 0.0125 0.35 0.55
Crop residue (FCR) 116,659,677 0.0125 1.46 2.29
Compost (FCO) 4,153,205 0.0125 0.05 0.08
Total 9.26 14.56
Table 5.11 Nitrous Oxide Emissions from Direct Sources
Table 5.10 Estimated Nitrous Oxide Derived from Leached/Runoff Nitrogen
Nitrous OxideNitrous Oxide
Nitrous Oxide Total Nitrous
Amount of Fraction of EmissionsEmissions
Emissions Oxide
Sourcenitrogen N That Factor
FactorFactor Emissions
Input Leached fromfrom Rivers
from Coastal from
Groundwater Marine Areas Leaching
(kg N/yr) (fraction) EF5-g EF5-r EF5-e (Gg N2O/yr)
Synthetic fertilizer 387,461,500 0.2 0.015 0.0075 0.0025 4.57
N excretion from
animal manure 647,039,428 0.2 0.015 0.0075 0.0025 7.63
Total 1,034,500,928 12.19
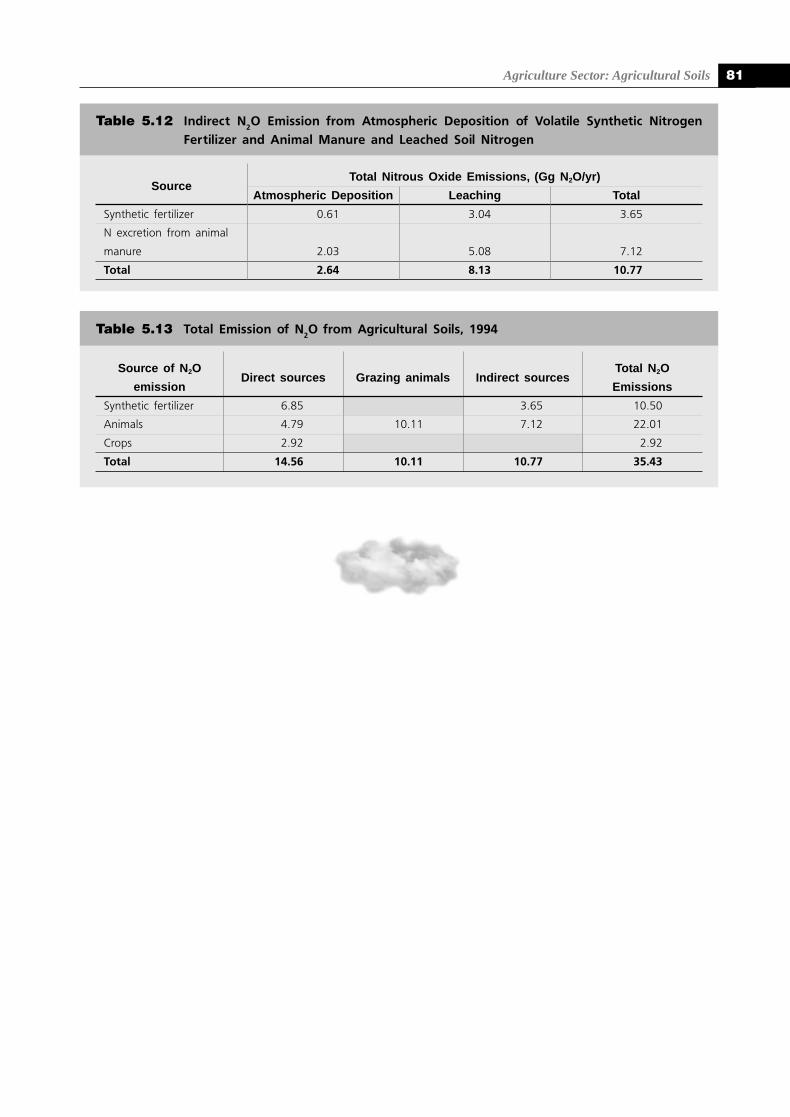
Agriculture Sector: Agricultural Soils 81
SourceTotal Nitrous Oxide Emissions, (Gg N2O/yr)
Atmospheric Deposition Leaching Total
Synthetic fertilizer 0.61 3.04 3.65
N excretion from animal
manure 2.03 5.08 7.12
Total 2.64 8.13 10.77
Table 5.12 Indirect N2O Emission from Atmospheric Deposition of Volatile Synthetic Nitrogen
Fertilizer and Animal Manure and Leached Soil Nitrogen
Table 5.13 Total Emission of N2O from Agricultural Soils, 1994
Source of N2ODirect sources Grazing animals Indirect sources
Total N2O
emission Emissions
Synthetic fertilizer 6.85 3.65 10.50
Animals 4.79 10.11 7.12 22.01
Crops 2.92 2.92
Total 14.56 10.11 10.77 35.43
Thailand’s National Greenhouse Gas Inventory 199482
Agricultural Statistics, 1996. Agricultural Statistics ofThailand Crop Year 1994/1995. Ministry ofAgriculture and Cooperatives. Bangkok, Thailand.
Chairoj, P., S. Launmanee and T. Watanabe. 1998. Nitrousoxide emission from upland soils. Thai Journal ofSoils and Fertilizers. 20:136-146. (in Thai)
Department of Livestock Development, 1996. YearlyStatistic Reports. Ministry of Agriculture andCooperatives. Bangkok, Thailand. 166 pp.
IPCC, 1997. Intergovernmental Panel on Climate ChangeGuidelines for National Greenhouse Gas Inventories,Chapter 4. Agriculture: Nitrous oxide fromagricultural soils and manure management. OECD.Paris, France.
Yoshida, Naohiro, P. Vijarnsorn, S. Ueda, A. Sigimoto,T. Yoshioga, and E. Wada. 1995. Radiatively activegases in tropical swamp forest and wetland soils. II:Dynamics and framework with emphais on swampforest in Narathiwat, Thailand in A Tropical SwampForest Ecosystem and Its Greenhouse Gas Emission.Nodai Research Institute, Tokyo University ofAgriculture. March, 1995.
Tanyadee, P. 1986. The Study and Analysis of theCompost Industry Status in Thailand. Soil andWater Conservation Division, Land DevelopmentDepartment. Bangkok: 71 (in Thai).
Piriyapan, V. 1982. Agricultural Residue Utilization. Inthe National Workshop on Agricultural and Agro-Industrial Residue Utilization, Phetchaburi, Thailand.December 13-18, 1982: V-1-4. (in Thai).
Vacharotayan, S. and A. Pintukanok. 1985. Agriculturaland agroindustrial residues in Thailand. pp. 222-228.In S. Vacharotayan and T. Yoshida (eds). Utilizationof Organic Waste Materials in Agriculture withReference of NRCT-JSPS Cooperative Research inThailand, Tokyo.
Wasananukul, P., S. Janrungroueng, P. Thanyadee and P.Deeraksa. 1994. Animal Manure in Soil Improvmentby Organic Matter Incorporation. Department ofLand Development. Ministry of Agriculture andCooperatives. (in Thai).
REFERENCES:
6C H A P T E R
FORESTRY SECTOR
b y L a d a w a n P u a n g c h i t
● Introduction
● Methodology
● Data
● Results
Thailand’s National Greenhouse Gas Inventory 199484
Thailand’s National Greenhouse Gas Inventory 1994
6.1 INTRODUCTIONForests act as both sink and source of carbon dioxide
(CO2). They act as sinks by withdrawing CO2 from theatmosphere through the process of photosynthesis and bystoring it in its woody biomass. Woody biomass can storecarbon in plant tissue for periods of up to 200 years ormore (Openshaw, 1996). On the other hand, CO2 isproduced when forested land is converted into other landuses, thereby exacerbating the rise in atmospheric carbondioxide.
More than half of carbon stored in forests is lost tothe atmosphere within the period of a year. Uncertaintiesin the estimates of carbon fluxes due to changes intropical land use can arise from: the rate of change offorest areas, the use of converted forest land, and thebiomass density of forests (Brown, et al., 1991). Anattempt to improve the precision of the estimation wasproposed at the Intergovernmental Panel on ClimateChange (IPCC) meeting in Sao Paulo in 1990. The IPCCresolved to do this by creating a network of localscientists in tropical countries and by using a commonframework to estimate the emissions and uptake of carbonfor each country (Graca, et al., 1990).
The present study applies the methodology developedby IPCC to estimate carbon emission and sequestrationfrom forests and land use changes in Thailand by using1994 as a base year. The first carbon flux inventory wasdone in 1996 by using 1990 as a base year. In order tomake the estimates more accurate and updated to localforest situations, modifications and specific assumptionshave been made. The IPCC recommended default valueswere used when local data for the country wereunavailable.
The present study estimates CO2 emissions andsequestration primarily from activities related to forestry,i.e., the utilization of woody biomass and change inforested area. The procedure also accounts for theinfluence of past land use changes upon the contemporaryCO2 flux. Natural, undisturbed forests are considered tobe in equilibrium, and are considered to be neither asource or sink of carbon. The fate and amount ofsubterraneous biomass is currently ignored in thecalculation. The present study involves:
1. CO2 emissions that result from the harvesting,deforestation and utilization of woody biomass;
2. CO2 sequestration by reforestation, tree plantingand the natural regeneration of abandoned land;and
3. Emissions of non-CO2 trace gases such asmethane (CH4), carbon monoxide (CO), nitrousoxide (N2O) and nitrogen oxide (NOx) frombiomass combustion.
Definitions
The following terms are commonly referred to in thisreport:
Biomass. The weight of living or dead organic matterin a tree, stand or forest above and belowground, in units such as living or dead weight,wet or dry weight, ash-free weight, etc.
Carbon sequestration. A process that involves thewithdrawal of CO2 from the atmosphere andits storage in plant biomass.
Dry matter (dm). Biomass that has dried to an ovendry state, which means that all loose waterhas been driven off, but the water that is partof the carbohydrate molecule and variousvolatile compounds still remain.
Degraded forest. Forests or grasslands that havebeen overutilised or poorly managedhistorically, and may have reduced biomassdensities.
Organization of the Study
The IPCC Guidelines for calculating GHG emissionsfrom land use change and forestry organize the estimationinto four main categories, as follows:
Changes in forest and other woody biomassstocks. These include emission and sequestration ofcarbon through the following activities:
● Uptake of carbon from the growth of trees throughreforestation and afforestation
● Emission of carbon from logging, commercialforest product industries and informal fuelwoodgathering
Forest conversion. This includes carbon emissionfrom deforestation or conversion of forested area intoother land uses through the following activities:
● Burning of aboveground biomass on site
● Burning of aboveground biomass utilized off site
● Remaining aboveground biomass left to decay
Abandonment of managed land. This refers to theuptake of carbon from the natural regeneration offorests in previously abandoned land and degradedforest areas where growth of trees is still expected.
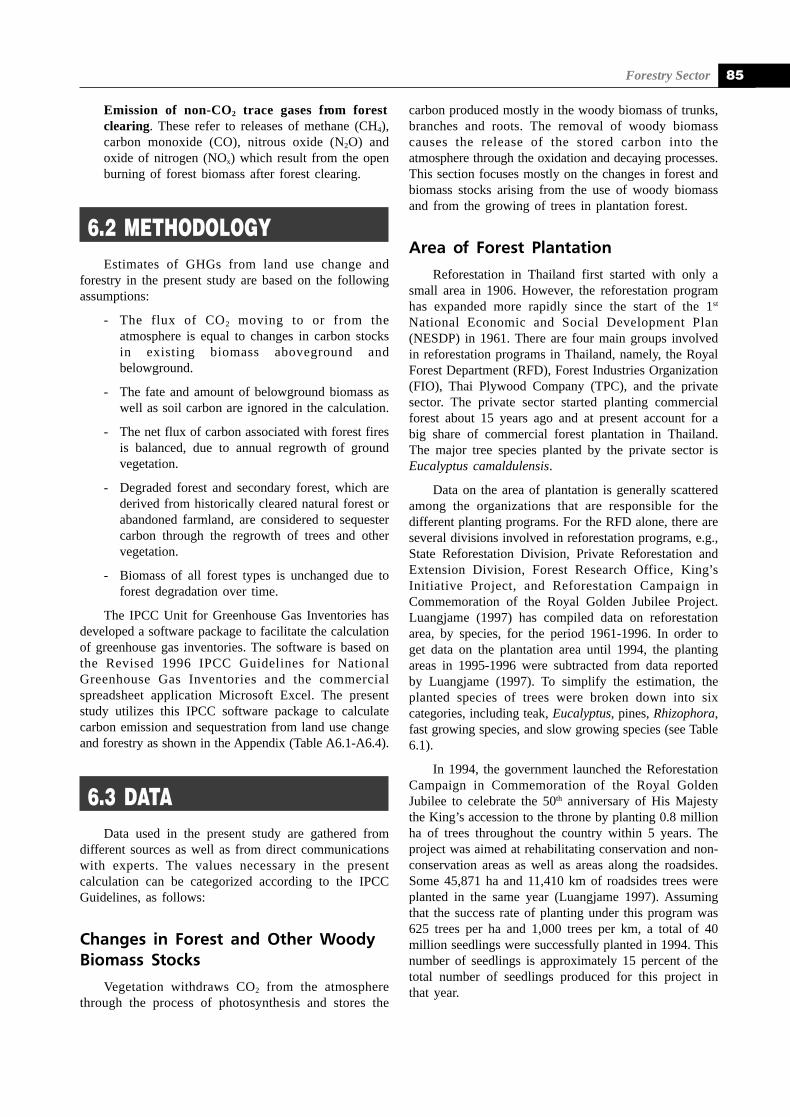
Forestry Sector 85
Emission of non-CO2 trace gases from forestclearing. These refer to releases of methane (CH4),carbon monoxide (CO), nitrous oxide (N2O) andoxide of nitrogen (NOx) which result from the openburning of forest biomass after forest clearing.
6.2 METHODOLOGYEstimates of GHGs from land use change and
forestry in the present study are based on the followingassumptions:
- The flux of CO2 moving to or from theatmosphere is equal to changes in carbon stocksin existing biomass aboveground andbelowground.
- The fate and amount of belowground biomass aswell as soil carbon are ignored in the calculation.
- The net flux of carbon associated with forest firesis balanced, due to annual regrowth of groundvegetation.
- Degraded forest and secondary forest, which arederived from historically cleared natural forest orabandoned farmland, are considered to sequestercarbon through the regrowth of trees and othervegetation.
- Biomass of all forest types is unchanged due toforest degradation over time.
The IPCC Unit for Greenhouse Gas Inventories hasdeveloped a software package to facilitate the calculationof greenhouse gas inventories. The software is based onthe Revised 1996 IPCC Guidelines for NationalGreenhouse Gas Inventories and the commercialspreadsheet application Microsoft Excel. The presentstudy utilizes this IPCC software package to calculatecarbon emission and sequestration from land use changeand forestry as shown in the Appendix (Table A6.1-A6.4).
6.3 DATAData used in the present study are gathered from
different sources as well as from direct communicationswith experts. The values necessary in the presentcalculation can be categorized according to the IPCCGuidelines, as follows:
Changes in Forest and Other WoodyBiomass Stocks
Vegetation withdraws CO2 from the atmospherethrough the process of photosynthesis and stores the
carbon produced mostly in the woody biomass of trunks,branches and roots. The removal of woody biomasscauses the release of the stored carbon into theatmosphere through the oxidation and decaying processes.This section focuses mostly on the changes in forest andbiomass stocks arising from the use of woody biomassand from the growing of trees in plantation forest.
Area of Forest Plantation
Reforestation in Thailand first started with only asmall area in 1906. However, the reforestation programhas expanded more rapidly since the start of the 1st
National Economic and Social Development Plan(NESDP) in 1961. There are four main groups involvedin reforestation programs in Thailand, namely, the RoyalForest Department (RFD), Forest Industries Organization(FIO), Thai Plywood Company (TPC), and the privatesector. The private sector started planting commercialforest about 15 years ago and at present account for abig share of commercial forest plantation in Thailand.The major tree species planted by the private sector isEucalyptus camaldulensis.
Data on the area of plantation is generally scatteredamong the organizations that are responsible for thedifferent planting programs. For the RFD alone, there areseveral divisions involved in reforestation programs, e.g.,State Reforestation Division, Private Reforestation andExtension Division, Forest Research Office, King’sInitiative Project, and Reforestation Campaign inCommemoration of the Royal Golden Jubilee Project.Luangjame (1997) has compiled data on reforestationarea, by species, for the period 1961-1996. In order toget data on the plantation area until 1994, the plantingareas in 1995-1996 were subtracted from data reportedby Luangjame (1997). To simplify the estimation, theplanted species of trees were broken down into sixcategories, including teak, Eucalyptus, pines, Rhizophora,fast growing species, and slow growing species (see Table6.1).
In 1994, the government launched the ReforestationCampaign in Commemoration of the Royal GoldenJubilee to celebrate the 50th anniversary of His Majestythe King’s accession to the throne by planting 0.8 millionha of trees throughout the country within 5 years. Theproject was aimed at rehabilitating conservation and non-conservation areas as well as areas along the roadsides.Some 45,871 ha and 11,410 km of roadsides trees wereplanted in the same year (Luangjame 1997). Assumingthat the success rate of planting under this program was625 trees per ha and 1,000 trees per km, a total of 40million seedlings were successfully planted in 1994. Thisnumber of seedlings is approximately 15 percent of thetotal number of seedlings produced for this project inthat year.
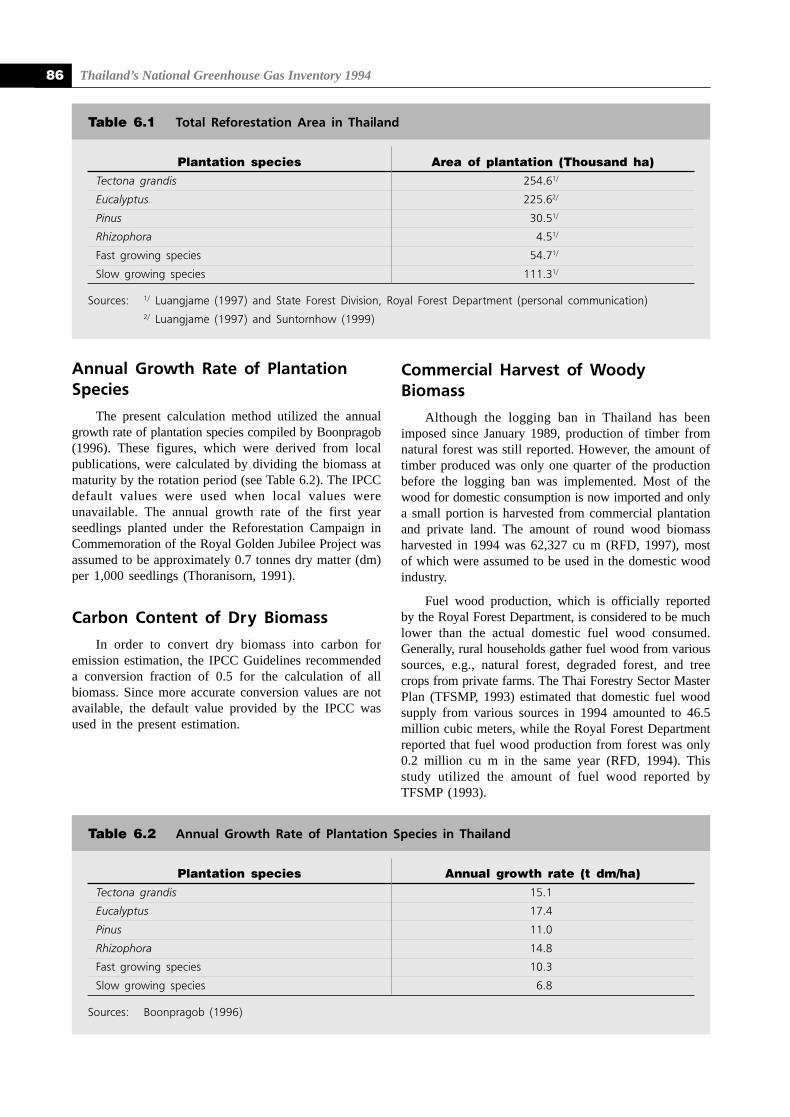
Thailand’s National Greenhouse Gas Inventory 199486
Annual Growth Rate of PlantationSpecies
The present calculation method utilized the annualgrowth rate of plantation species compiled by Boonpragob(1996). These figures, which were derived from localpublications, were calculated by dividing the biomass atmaturity by the rotation period (see Table 6.2). The IPCCdefault values were used when local values wereunavailable. The annual growth rate of the first yearseedlings planted under the Reforestation Campaign inCommemoration of the Royal Golden Jubilee Project wasassumed to be approximately 0.7 tonnes dry matter (dm)per 1,000 seedlings (Thoranisorn, 1991).
Carbon Content of Dry Biomass
In order to convert dry biomass into carbon foremission estimation, the IPCC Guidelines recommendeda conversion fraction of 0.5 for the calculation of allbiomass. Since more accurate conversion values are notavailable, the default value provided by the IPCC wasused in the present estimation.
Commercial Harvest of WoodyBiomass
Although the logging ban in Thailand has beenimposed since January 1989, production of timber fromnatural forest was still reported. However, the amount oftimber produced was only one quarter of the productionbefore the logging ban was implemented. Most of thewood for domestic consumption is now imported and onlya small portion is harvested from commercial plantationand private land. The amount of round wood biomassharvested in 1994 was 62,327 cu m (RFD, 1997), mostof which were assumed to be used in the domestic woodindustry.
Fuel wood production, which is officially reportedby the Royal Forest Department, is considered to be muchlower than the actual domestic fuel wood consumed.Generally, rural households gather fuel wood from varioussources, e.g., natural forest, degraded forest, and treecrops from private farms. The Thai Forestry Sector MasterPlan (TFSMP, 1993) estimated that domestic fuel woodsupply from various sources in 1994 amounted to 46.5million cubic meters, while the Royal Forest Departmentreported that fuel wood production from forest was only0.2 million cu m in the same year (RFD, 1994). Thisstudy utilized the amount of fuel wood reported byTFSMP (1993).
Plantation species Annual growth rate (t dm/ha)
Tectona grandis 15.1
Eucalyptus 17.4
Pinus 11.0
Rhizophora 14.8
Fast growing species 10.3
Slow growing species 6.8
Sources: Boonpragob (1996)
Table 6.2 Annual Growth Rate of Plantation Species in Thailand
Plantation species Area of plantation (Thousand ha)Tectona grandis 254.61/
Eucalyptus 225.62/
Pinus 30.51/
Rhizophora 4.51/
Fast growing species 54.71/
Slow growing species 111.31/
Sources: 1/ Luangjame (1997) and State Forest Division, Royal Forest Department (personal communication)2/ Luangjame (1997) and Suntornhow (1999)
Table 6.1 Total Reforestation Area in Thailand
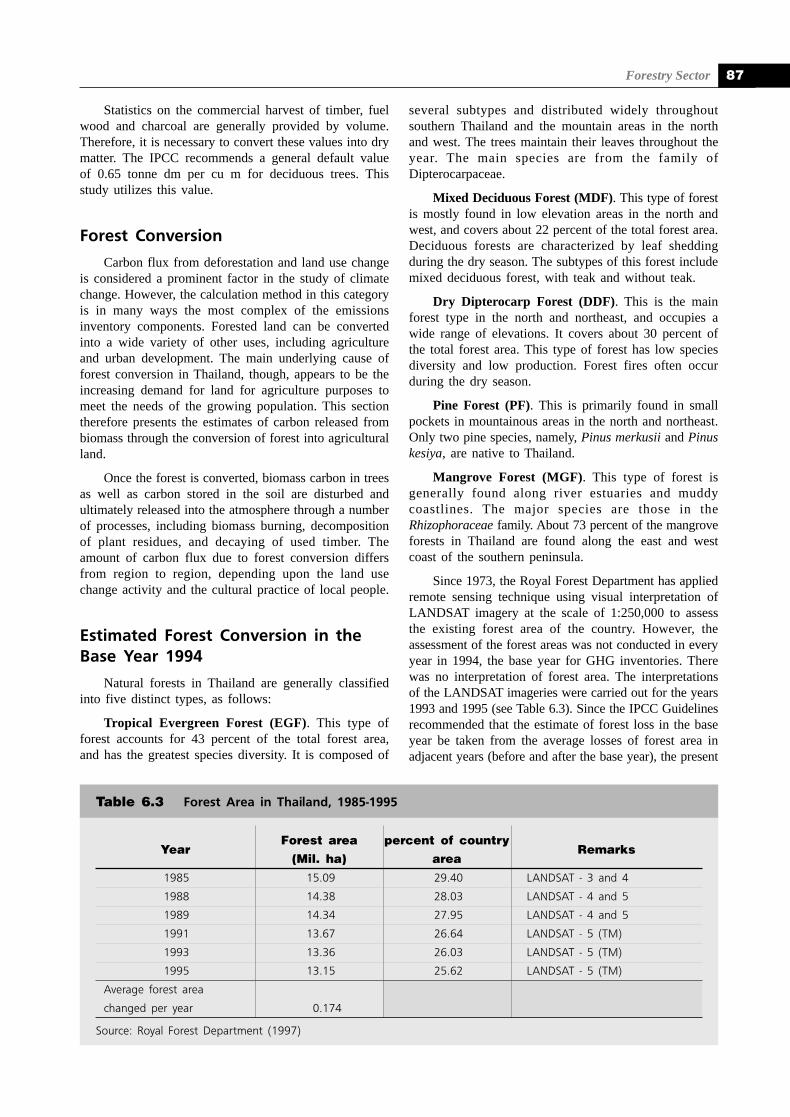
Forestry Sector 87
Statistics on the commercial harvest of timber, fuelwood and charcoal are generally provided by volume.Therefore, it is necessary to convert these values into drymatter. The IPCC recommends a general default valueof 0.65 tonne dm per cu m for deciduous trees. Thisstudy utilizes this value.
Forest Conversion
Carbon flux from deforestation and land use changeis considered a prominent factor in the study of climatechange. However, the calculation method in this categoryis in many ways the most complex of the emissionsinventory components. Forested land can be convertedinto a wide variety of other uses, including agricultureand urban development. The main underlying cause offorest conversion in Thailand, though, appears to be theincreasing demand for land for agriculture purposes tomeet the needs of the growing population. This sectiontherefore presents the estimates of carbon released frombiomass through the conversion of forest into agriculturalland.
Once the forest is converted, biomass carbon in treesas well as carbon stored in the soil are disturbed andultimately released into the atmosphere through a numberof processes, including biomass burning, decompositionof plant residues, and decaying of used timber. Theamount of carbon flux due to forest conversion differsfrom region to region, depending upon the land usechange activity and the cultural practice of local people.
Estimated Forest Conversion in theBase Year 1994
Natural forests in Thailand are generally classifiedinto five distinct types, as follows:
Tropical Evergreen Forest (EGF). This type offorest accounts for 43 percent of the total forest area,and has the greatest species diversity. It is composed of
several subtypes and distributed widely throughoutsouthern Thailand and the mountain areas in the northand west. The trees maintain their leaves throughout theyear. The main species are from the family ofDipterocarpaceae.
Mixed Deciduous Forest (MDF). This type of forestis mostly found in low elevation areas in the north andwest, and covers about 22 percent of the total forest area.Deciduous forests are characterized by leaf sheddingduring the dry season. The subtypes of this forest includemixed deciduous forest, with teak and without teak.
Dry Dipterocarp Forest (DDF). This is the mainforest type in the north and northeast, and occupies awide range of elevations. It covers about 30 percent ofthe total forest area. This type of forest has low speciesdiversity and low production. Forest fires often occurduring the dry season.
Pine Forest (PF). This is primarily found in smallpockets in mountainous areas in the north and northeast.Only two pine species, namely, Pinus merkusii and Pinuskesiya, are native to Thailand.
Mangrove Forest (MGF). This type of forest isgenerally found along river estuaries and muddycoastlines. The major species are those in theRhizophoraceae family. About 73 percent of the mangroveforests in Thailand are found along the east and westcoast of the southern peninsula.
Since 1973, the Royal Forest Department has appliedremote sensing technique using visual interpretation ofLANDSAT imagery at the scale of 1:250,000 to assessthe existing forest area of the country. However, theassessment of the forest areas was not conducted in everyyear in 1994, the base year for GHG inventories. Therewas no interpretation of forest area. The interpretationsof the LANDSAT imageries were carried out for the years1993 and 1995 (see Table 6.3). Since the IPCC Guidelinesrecommended that the estimate of forest loss in the baseyear be taken from the average losses of forest area inadjacent years (before and after the base year), the present
Table 6.3 Forest Area in Thailand, 1985-1995
YearForest area percent of country
Remarks(Mil. ha) area
1985 15.09 29.40 LANDSAT - 3 and 4
1988 14.38 28.03 LANDSAT - 4 and 5
1989 14.34 27.95 LANDSAT - 4 and 5
1991 13.67 26.64 LANDSAT - 5 (TM)
1993 13.36 26.03 LANDSAT - 5 (TM)
1995 13.15 25.62 LANDSAT - 5 (TM)
Average forest area
changed per year 0.174
Source: Royal Forest Department (1997)
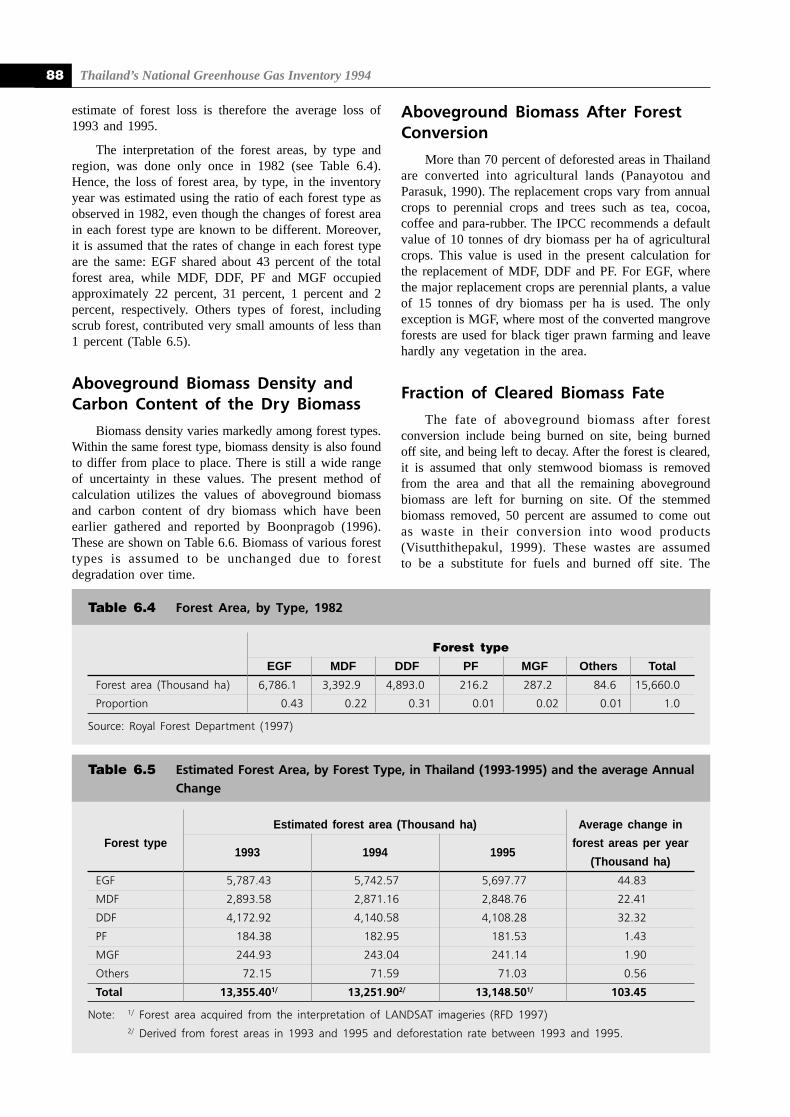
Thailand’s National Greenhouse Gas Inventory 199488
estimate of forest loss is therefore the average loss of1993 and 1995.
The interpretation of the forest areas, by type andregion, was done only once in 1982 (see Table 6.4).Hence, the loss of forest area, by type, in the inventoryyear was estimated using the ratio of each forest type asobserved in 1982, even though the changes of forest areain each forest type are known to be different. Moreover,it is assumed that the rates of change in each forest typeare the same: EGF shared about 43 percent of the totalforest area, while MDF, DDF, PF and MGF occupiedapproximately 22 percent, 31 percent, 1 percent and 2percent, respectively. Others types of forest, includingscrub forest, contributed very small amounts of less than1 percent (Table 6.5).
Aboveground Biomass Density andCarbon Content of the Dry Biomass
Biomass density varies markedly among forest types.Within the same forest type, biomass density is also foundto differ from place to place. There is still a wide rangeof uncertainty in these values. The present method ofcalculation utilizes the values of aboveground biomassand carbon content of dry biomass which have beenearlier gathered and reported by Boonpragob (1996).These are shown on Table 6.6. Biomass of various foresttypes is assumed to be unchanged due to forestdegradation over time.
Aboveground Biomass After ForestConversion
More than 70 percent of deforested areas in Thailandare converted into agricultural lands (Panayotou andParasuk, 1990). The replacement crops vary from annualcrops to perennial crops and trees such as tea, cocoa,coffee and para-rubber. The IPCC recommends a defaultvalue of 10 tonnes of dry biomass per ha of agriculturalcrops. This value is used in the present calculation forthe replacement of MDF, DDF and PF. For EGF, wherethe major replacement crops are perennial plants, a valueof 15 tonnes of dry biomass per ha is used. The onlyexception is MGF, where most of the converted mangroveforests are used for black tiger prawn farming and leavehardly any vegetation in the area.
Fraction of Cleared Biomass Fate
The fate of aboveground biomass after forestconversion include being burned on site, being burnedoff site, and being left to decay. After the forest is cleared,it is assumed that only stemwood biomass is removedfrom the area and that all the remaining abovegroundbiomass are left for burning on site. Of the stemmedbiomass removed, 50 percent are assumed to come outas waste in their conversion into wood products(Visutthithepakul, 1999). These wastes are assumedto be a substitute for fuels and burned off site. The
Estimated forest area (Thousand ha) Average change in
Forest type1993 1994 1995
forest areas per year
(Thousand ha)
EGF 5,787.43 5,742.57 5,697.77 44.83
MDF 2,893.58 2,871.16 2,848.76 22.41
DDF 4,172.92 4,140.58 4,108.28 32.32
PF 184.38 182.95 181.53 1.43
MGF 244.93 243.04 241.14 1.90
Others 72.15 71.59 71.03 0.56
Total 13,355.401/ 13,251.902/ 13,148.501/ 103.45
Note: 1/ Forest area acquired from the interpretation of LANDSAT imageries (RFD 1997)2/ Derived from forest areas in 1993 and 1995 and deforestation rate between 1993 and 1995.
Table 6.5 Estimated Forest Area, by Forest Type, in Thailand (1993-1995) and the average AnnualChange
Forest type
EGF MDF DDF PF MGF Others Total
Forest area (Thousand ha) 6,786.1 3,392.9 4,893.0 216.2 287.2 84.6 15,660.0
Proportion 0.43 0.22 0.31 0.01 0.02 0.01 1.0
Source: Royal Forest Department (1997)
Table 6.4 Forest Area, by Type, 1982
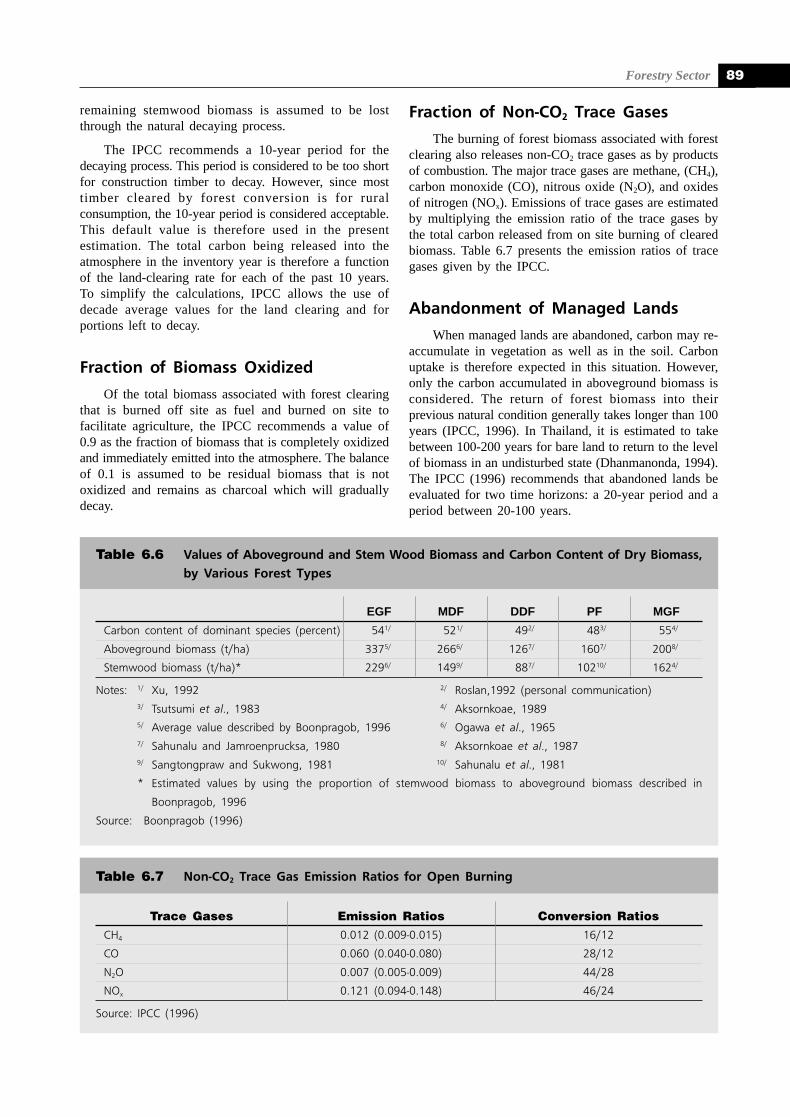
Forestry Sector 89
remaining stemwood biomass is assumed to be lostthrough the natural decaying process.
The IPCC recommends a 10-year period for thedecaying process. This period is considered to be too shortfor construction timber to decay. However, since mosttimber cleared by forest conversion is for ruralconsumption, the 10-year period is considered acceptable.This default value is therefore used in the presentestimation. The total carbon being released into theatmosphere in the inventory year is therefore a functionof the land-clearing rate for each of the past 10 years.To simplify the calculations, IPCC allows the use ofdecade average values for the land clearing and forportions left to decay.
Fraction of Biomass Oxidized
Of the total biomass associated with forest clearingthat is burned off site as fuel and burned on site tofacilitate agriculture, the IPCC recommends a value of0.9 as the fraction of biomass that is completely oxidizedand immediately emitted into the atmosphere. The balanceof 0.1 is assumed to be residual biomass that is notoxidized and remains as charcoal which will graduallydecay.
Fraction of Non-CO2 Trace Gases
The burning of forest biomass associated with forestclearing also releases non-CO2 trace gases as by productsof combustion. The major trace gases are methane, (CH4),carbon monoxide (CO), nitrous oxide (N2O), and oxidesof nitrogen (NOx). Emissions of trace gases are estimatedby multiplying the emission ratio of the trace gases bythe total carbon released from on site burning of clearedbiomass. Table 6.7 presents the emission ratios of tracegases given by the IPCC.
Abandonment of Managed Lands
When managed lands are abandoned, carbon may re-accumulate in vegetation as well as in the soil. Carbonuptake is therefore expected in this situation. However,only the carbon accumulated in aboveground biomass isconsidered. The return of forest biomass into theirprevious natural condition generally takes longer than 100years (IPCC, 1996). In Thailand, it is estimated to takebetween 100-200 years for bare land to return to the levelof biomass in an undisturbed state (Dhanmanonda, 1994).The IPCC (1996) recommends that abandoned lands beevaluated for two time horizons: a 20-year period and aperiod between 20-100 years.
EGF MDF DDF PF MGF
Carbon content of dominant species (percent) 541/ 521/ 492/ 483/ 554/
Aboveground biomass (t/ha) 3375/ 2666/ 1267/ 1607/ 2008/
Stemwood biomass (t/ha)* 2296/ 1499/ 887/ 10210/ 1624/
Notes: 1/ Xu, 1992 2/ Roslan,1992 (personal communication)3/ Tsutsumi et al., 1983 4/ Aksornkoae, 19895/ Average value described by Boonpragob, 1996 6/ Ogawa et al., 19657/ Sahunalu and Jamroenprucksa, 1980 8/ Aksornkoae et al., 19879/ Sangtongpraw and Sukwong, 1981 10/ Sahunalu et al., 1981
* Estimated values by using the proportion of stemwood biomass to aboveground biomass described in
Boonpragob, 1996
Source: Boonpragob (1996)
Table 6.6 Values of Aboveground and Stem Wood Biomass and Carbon Content of Dry Biomass,by Various Forest Types
Trace Gases Emission Ratios Conversion RatiosCH4 0.012 (0.009-0.015) 16/12
CO 0.060 (0.040-0.080) 28/12
N2O 0.007 (0.005-0.009) 44/28
NOx 0.121 (0.094-0.148) 46/24
Source: IPCC (1996)
Table 6.7 Non-CO2 Trace Gas Emission Ratios for Open Burning
Thailand’s National Greenhouse Gas Inventory 199490
Areas Abandoned
It is difficult to estimate the area of abandoned landin Thailand. This is partly due to the lack of inventorydata on land utilization in the past. In order to retrievedata on abandoned land with vegetation regrowth, thepresent study assumed that forest areas, excludingNational Parks, Forest Parks, Wildlife Sanctuaries andNon- Hunting Areas are in generally poor condition andcontinue to experience growth in vegetation. These areaswere assumed to be disturbed by human activities morethan 20 years ago. The area of forest with naturalregrowth was estimated to be 5.9 million ha in 1994(RFD, 1997). Idle lands, which are defined as areas thatcannot grow any crops, including paddy, were estimatedto be 0.5 million ha and were assumed to be abandonedfor less than 20 years.
Annual Growth Rate of NaturalRegeneration
The time scale for natural regeneration is generallymuch longer than any human being could follow. It istherefore difficult to estimate biomass accumulation fromregrowth of natural vegetation. Dhanmanonda (1994)studied the process and rate of revegetation of drydipterocarp and hill evergreen forests in Thailand, andestimated the turnover time to be between 100-200 years.Biomass accumulation was found to be rather slow inthe beginning. This is inconsistent with data provided bythe IPCC, which assumes rapid forest growth rate in thefirst twenty years (7 tonne dm per ha) and a slower rateof growth of 0.5 tonne dm per ha between 20-100 years.
In the present study, the growth of forest is basedon the forest growth curve built by Dhanmanonda (1994).From the scheme of forest growth cycle, it is assumedthe forest regrows to 20 percent of undisturbed forestbiomass during the first twenty years and reaches abiomass density of 80 percent of undisturbed forestbiomass in 100 years. Table 6.8 presents the estimatedbiomass of various forest types in each time period. Alinear trend in the regrowth of aboveground biomass isassumed in the estimation.
6.4 RESULTSTotal Carbon Emission
The total carbon emission from forest for the baseyear 1994 is estimated at 27,157 Gg of carbon (Gg-C)or 99,577 Gg of carbon dioxide (Gg-CO2). Of these,10,958 Gg-C or 40,181 Gg-CO2 were due to woodutilization, particularly fuelwood consumption, which tookalmost the entire share in this category. The remaining
15,843 Gg-C or 58,089 Gg-CO2 arose from forestconversion activities, which include the natural decayingprocess from past land use activities (see Table 6.9).
Total Carbon Sequestration
The total carbon sequestered as a result of thegrowing of forest tree plantations, the natural regrowthof degraded forests, and the regeneration of abandonedlands is 10,664 Gg-C or 39,102 Gg-CO2 (see Table 6.9).Although the annual growth rate of naturally regrowingvegetation is lower than for forest tree plantations, theamount sequestered is still high due to the larger areacovered by forests that are degraded or in poor condition.However, carbon sequestration from natural regrowth indegraded forests and forest tree plantations is expectedto be in opposite direction in the future.
Total Net Emission
Since the total emission exceeds total sequestration,land use changes and forestry sector activities contributenet carbon emissions to the atmosphere (see Table 6.9).In 1994, the net carbon emission from forest totaled16,493 Gg-C or 60,476 Gg-CO2.
Table 6.10 presents a comparison of net carbonemission from Thai forests in 1990 and 1994. The resultsshow that the net carbon dioxide contribution from theforestry sector decreased. This could be partly due to theexpansion of forest plantations and a decrease indeforestation area. The Thai government has placed mucheffort to increase forest areas in the country. In spite ofthis, emissions from fuelwood consumption were foundto almost double in 1994. In order to reduce or to keepemissions of carbon dioxide from the forestry sectorsteady, fuelwood consumption must be restrained.
Non-CO2 Trace Gases
Non-CO2 trace gases that are emitted from the openburning of aboveground biomass after forest conversionare considered small compared to emissions of carbondioxide. In 1994, the emissions of methane, (CH4), carbonmonoxide (CO), nitrous oxide (N2O), and oxides ofnitrogen (NOx) were estimated at 59.57, 521.21, 0.41 and14.80 Gg, respectively, as shown in Table 6.11.
Compared to those in 1990, emissions of all non-CO2 trace gases increased in 1994 (see Table 6.11).Although the amounts of trace gases are relatively smallcompared to carbon dioxide, their increasing trenddemands more serious consideration and additionalresearch.
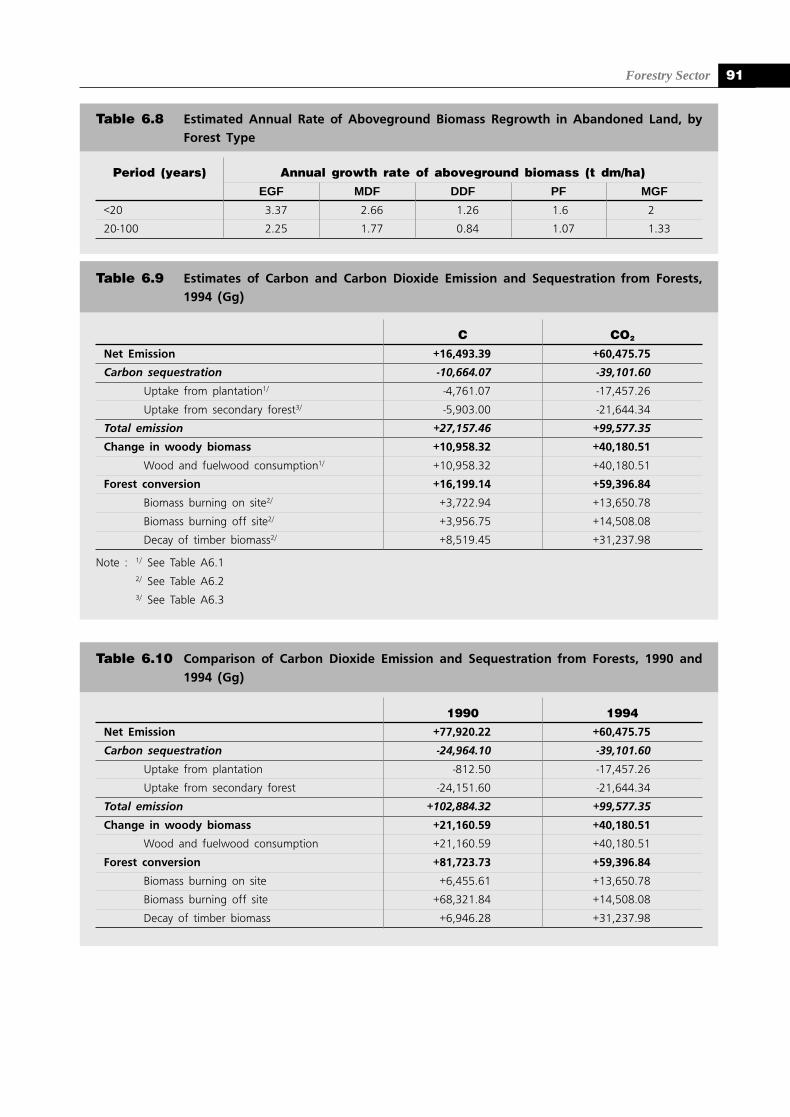
Forestry Sector 91
Period (years) Annual growth rate of aboveground biomass (t dm/ha)
EGF MDF DDF PF MGF
<20 3.37 2.66 1.26 1.6 2
20-100 2.25 1.77 0.84 1.07 1.33
C CO2
Net Emission +16,493.39 +60,475.75
Carbon sequestration -10,664.07 -39,101.60
Uptake from plantation1/ -4,761.07 -17,457.26
Uptake from secondary forest3/ -5,903.00 -21,644.34
Total emission +27,157.46 +99,577.35
Change in woody biomass +10,958.32 +40,180.51
Wood and fuelwood consumption1/ +10,958.32 +40,180.51
Forest conversion +16,199.14 +59,396.84
Biomass burning on site2/ +3,722.94 +13,650.78
Biomass burning off site2/ +3,956.75 +14,508.08
Decay of timber biomass2/ +8,519.45 +31,237.98
Note : 1/ See Table A6.12/ See Table A6.23/ See Table A6.3
Table 6.9 Estimates of Carbon and Carbon Dioxide Emission and Sequestration from Forests,1994 (Gg)
Table 6.8 Estimated Annual Rate of Aboveground Biomass Regrowth in Abandoned Land, byForest Type
1990 1994Net Emission +77,920.22 +60,475.75
Carbon sequestration -24,964.10 -39,101.60
Uptake from plantation -812.50 -17,457.26
Uptake from secondary forest -24,151.60 -21,644.34
Total emission +102,884.32 +99,577.35
Change in woody biomass +21,160.59 +40,180.51
Wood and fuelwood consumption +21,160.59 +40,180.51
Forest conversion +81,723.73 +59,396.84
Biomass burning on site +6,455.61 +13,650.78
Biomass burning off site +68,321.84 +14,508.08
Decay of timber biomass +6,946.28 +31,237.98
Table 6.10 Comparison of Carbon Dioxide Emission and Sequestration from Forests, 1990 and1994 (Gg)
Thailand’s National Greenhouse Gas Inventory 199492
Trace gases 1990 1994CH4 28.170 59.57
CO 246.486 521.21
N2O 0.194 0.41
NOx 7.000 14.80
Table 6.11 Comparison of Non-CO2 Trace Gases Emission from Forest Clearing, 1990 and 1994(Gg)
In summary the present study estimates GHGemission and sequestration due to land use change andforestry activities, following the most recent IPCCGuidelines (IPCC, 1996). However, several uncertaintiesremain unresolved, including the rate of change in forestareas by each forest type, the use of land after forestconversion, biomass density, and the fate of biomass afterdeforestation as well as the amounts of soil carbon andunderground biomass.
The net carbon emission from the forestry sector forthe base year 1994 is 16,493 Gg-C or 60,476 Gg-CO2.This amount is only 70 percent of the net emission fromthe forestry sector in 1990. Although there was adeclining trend in net carbon emissions from the forestrysector due to the expansion of forest plantation areas andreduced deforestation, the Thai government shouldcontinue to intensify its reforestation program. At thesame time, it should implement measures to protect andpromote the sustainable use of natural forests. These willshow Thailand’s willingness to safeguard the national,regional and global environment.
Forestry Sector 93
Boonpragob, K. 1996. Land use change and forestry.Draft Final Report: Thailand’s National GreenhouseGas Inventory, 1990. Office of Environmental Policyand Planning. 7-1 - 7-19.
Brown, S., A.J.R. Ghlespie and A.E. Lugo. 1991. Biomassof tropical forests of south and southeast Asia.Canadian Journal of Forestry Research. 21: 111-117.
Dhanmanonda, P. 1994. The forest growth cycle invarious forest types. Thailand Journal of Forestry.13: 68-80.
Graca, M.G.G., A. Ketoff, W.R.L. Makundi,M.E.M.Helene, J. Ribot, J. Romm and J. Sathaye.1990. Tropical forestry and global climate change:Background and Agenda for An InternationalResearch Network. LBL Report No. 35256.
Intergovernmental Panel on Climate Change (IPCC).1996. IPCC Guidelines for National Greenhouse GasInventories: Reference Manual. Chapter 5: Land UseChange and Forestry.
Luangjame, J. 1997. Forest rehabilitation status inThailand. Paper presented on the FORSPA-FRIMExpert Group Meeting on çRehabilitation of TropicalForests in Asia and the Pacific Regioné. Primula ParkRoyal Hotel, Kuala Terengganu, Malaysia. 16 p.(mimeograph)
Openshaw, K. 1996. Global warming and the role oftrees: Thailand a case study. FORTROP’96: TropicalForestry in the 21st Century. Faculty of Forestry,Kasetsart University. Bangkok. pp. 385-397.
REFERENCES:
Panayotou, T. and C. Parasuk. 1990. Land and Forest:Protecting Demand and Managing Encroachment.Research Report No. 1. In the 1990 TDRI Year-EndConference, December 1990. Thailand DevelopmentResearch Institute (TDRI), Bangkok.
Royal Forest Department (RFD). 1997. Forestry Statisticsof Thailand 1997. Information Office. Royal ForestDepartment. 149. p.
Sangtongpraw, S. and S. Sukwong. 1981. Economicassessment of forest resources in the SERS,Amphoe Pakthongchai, Nakhon-Ratchasima Province.Department of Forest Biology, Faculty of Forestry,Kasetsart University. Technical Paper No. 13. 38 p.
Suntornhow, P. 1999. Supply of Eucalyptus in Thailandand financial analysis of the reforestation in 1997.M.Sc. Thesis, Kasetsart University, Bangkok.
Thailand’s Forestry Sector Master Plan (TFSMP).1993. Thai Forestry Sector Master Plan, Volume 6.Subsectoral Plan for Production and Utilization.Royal Forest Department, Bangkok.
Thoranisorn, S. 1991. Yield analysis of some commercialtrees in Thailand. Ph.D. Thesis. 201 p.
Vissutthithepakul, S. 1999. Lumbering. Royal ForestDepartment. 47 p. (in Thai)
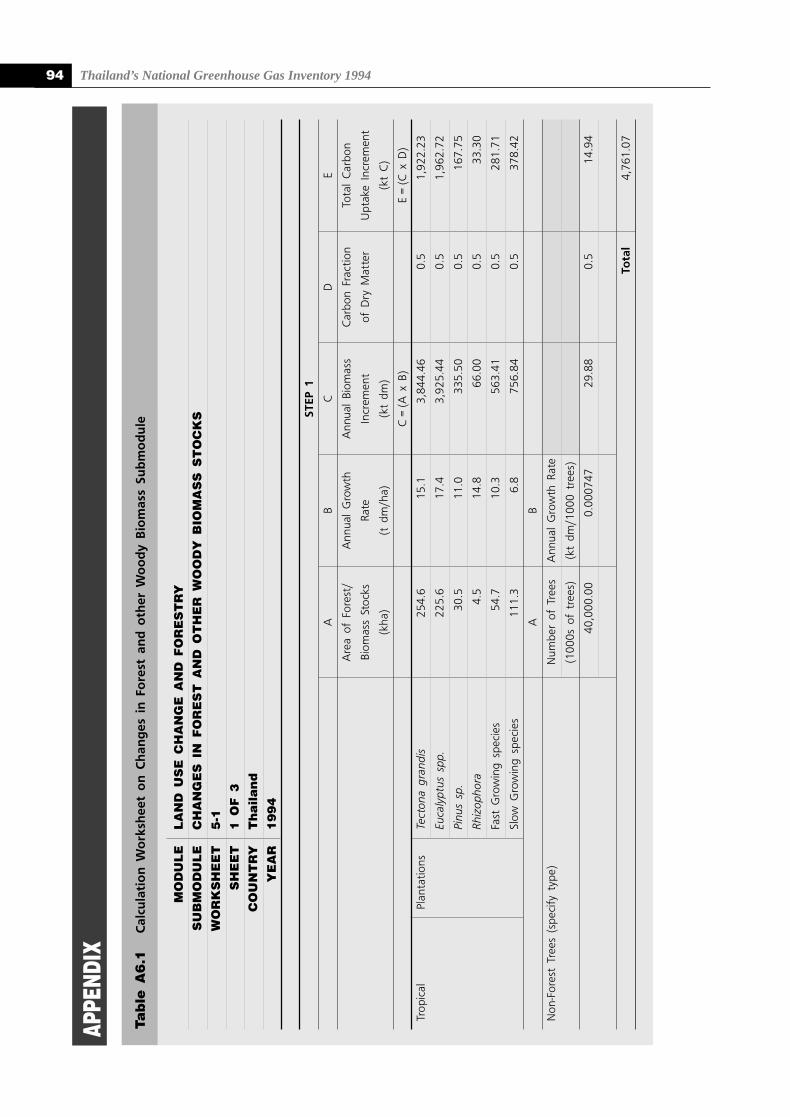
Thailand’s National Greenhouse Gas Inventory 199494AP
PEND
IX
Tab
le A
6.1
Cal
cula
tio
n W
ork
shee
t o
n C
han
ges
in
Fo
rest
an
d o
ther
Wo
od
y B
iom
ass
Sub
mo
du
le
MO
DU
LE
LA
ND
US
E C
HA
NG
E A
ND
FO
RE
ST
RY
SU
BM
OD
UL
EC
HA
NG
ES
IN
FO
RE
ST
AN
D O
TH
ER
WO
OD
Y B
IOM
AS
S S
TO
CK
S
WO
RK
SH
EE
T5
-1
SH
EE
T1
OF
3C
OU
NT
RY
Th
aila
nd
YE
AR
19
94
STEP
1
AB
CD
E
Are
a of
For
est/
Ann
ual
Gro
wth
Ann
ual
Biom
ass
Car
bon
Frac
tion
Tota
l C
arbo
n
Biom
ass
Stoc
ksRa
teIn
crem
ent
of D
ry M
atte
rU
ptak
e In
crem
ent
(kha
)(t
dm
/ha)
(kt
dm)
(kt
C)
C=
(A x
B)
E=
(C x
D)
Trop
ical
Plan
tatio
nsTe
cton
a gr
andi
s25
4.6
15.1
3,84
4.46
0.5
1,92
2.23
Euca
lypt
us s
pp.
225.
617
.43,
925.
440.
51,
962.
72
Pinu
s sp
.30
.511
.033
5.50
0.5
167.
75
Rhiz
opho
ra4.
514
.866
.00
0.5
33.3
0
Fast
Gro
win
g sp
ecie
s54
.710
.356
3.41
0.5
281.
71
Slow
Gro
win
g sp
ecie
s11
1.3
6.8
756.
840.
537
8.42
AB
Non
-For
est
Tree
s (s
peci
fy t
ype)
Num
ber
of T
rees
Ann
ual
Gro
wth
Rat
e
(100
0s o
f tr
ees)
(kt
dm/1
000
tree
s)
40,0
00.0
00.
0007
4729
.88
0.5
14.9
4
Tota
l4,
761.
07
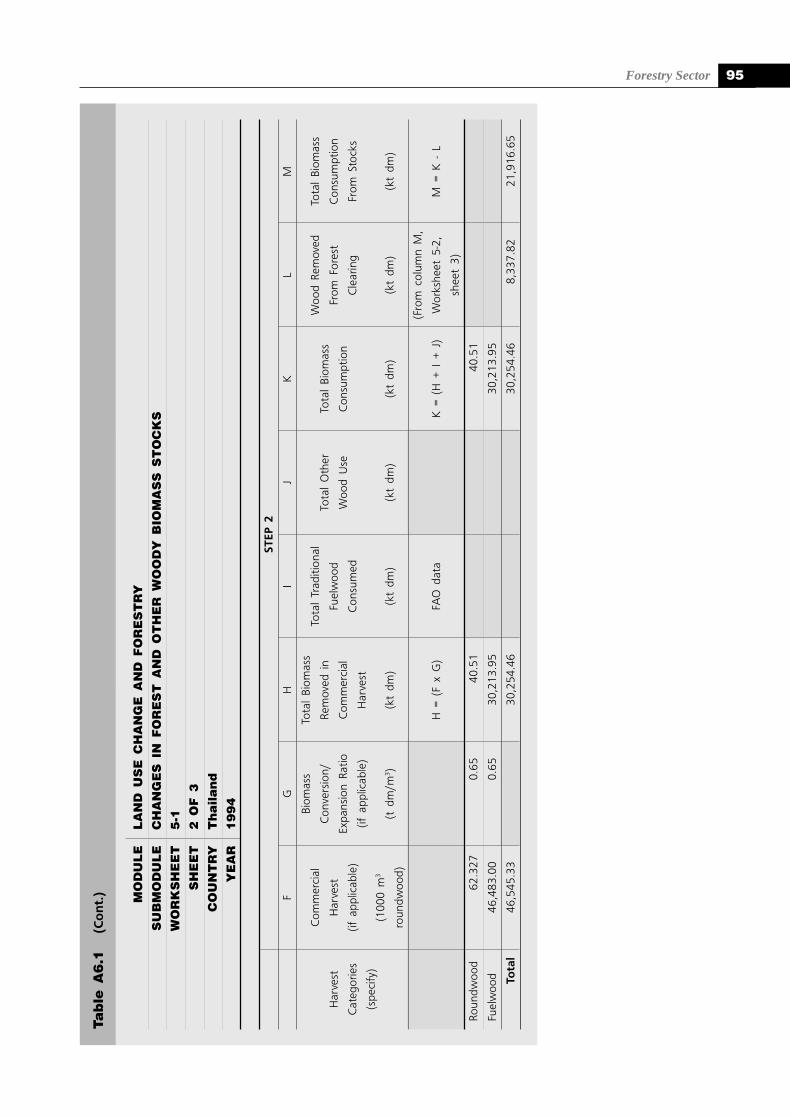
Forestry Sector 95
Tab
le A
6.1
(Co
nt.
) MO
DU
LE
LA
ND
US
E C
HA
NG
E A
ND
FO
RE
ST
RY
SU
BM
OD
UL
EC
HA
NG
ES
IN
FO
RE
ST
AN
D O
TH
ER
WO
OD
Y B
IOM
AS
S S
TO
CK
SW
OR
KS
HE
ET
5-1
SH
EE
T2
OF
3
CO
UN
TR
YT
ha
ila
nd
YE
AR
19
94
STEP
2
FG
HI
JK
LM
Com
mer
cial
Biom
ass
Tota
l Bi
omas
sTo
tal
Trad
ition
alW
ood
Rem
oved
Tota
l Bi
omas
s
Har
vest
Har
vest
Con
vers
ion/
Rem
oved
in
Fuel
woo
dTo
tal
Oth
erTo
tal
Biom
ass
From
For
est
Con
sum
ptio
n
Cat
egor
ies
(if a
pplic
able
)Ex
pans
ion
Ratio
Com
mer
cial
Con
sum
edW
ood
Use
Con
sum
ptio
nC
lear
ing
From
Sto
cks
(spe
cify
)(if
app
licab
le)
Har
vest
(100
0 m
3
(t d
m/m
3 )(k
t dm
)(k
t dm
)(k
t dm
)(k
t dm
)(k
t dm
)(k
t dm
)ro
undw
ood)
(Fro
m c
olum
n M
,
H =
(F
x G
)FA
O d
ata
K =
(H
+ I
+ J
)W
orks
heet
5-2
,M
= K
- L
shee
t 3)
Roun
dwoo
d62
.327
0.65
40.5
140
.51
Fuel
woo
d46
,483
.00
0.65
30,2
13.9
530
,213
.95
Tota
l46
,545
.33
30,2
54.4
630
,254
.46
8,33
7.82
21,9
16.6
5
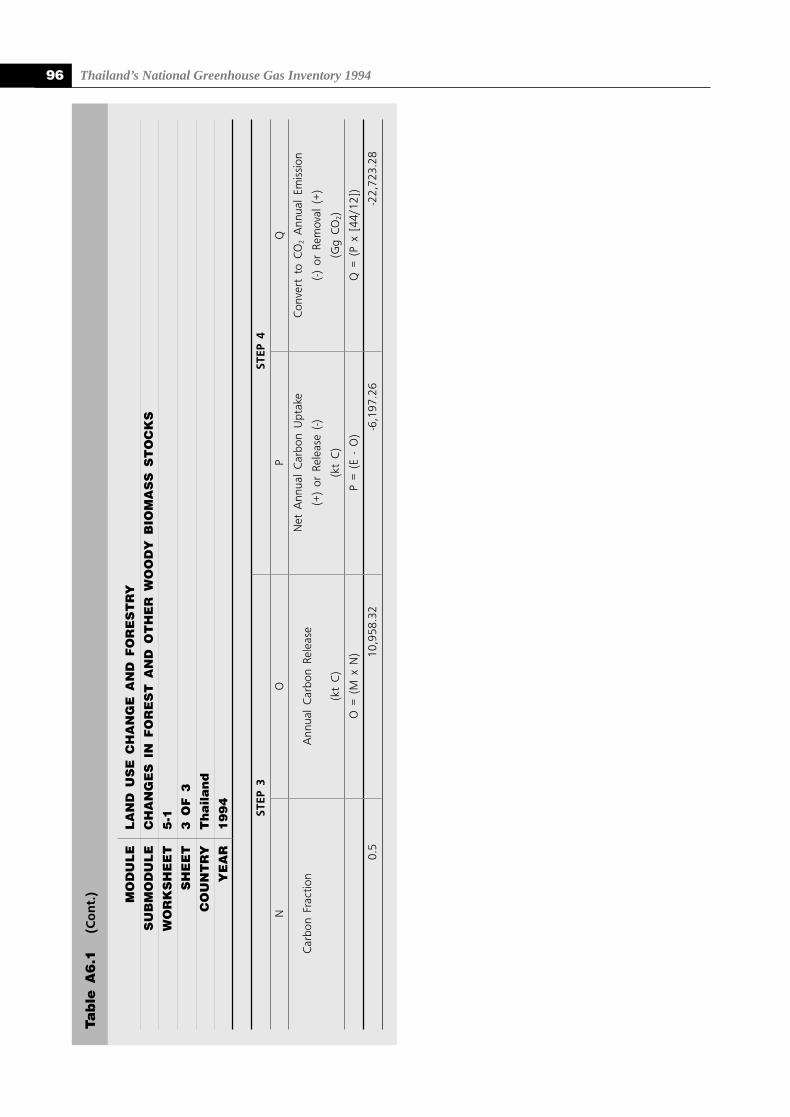
Thailand’s National Greenhouse Gas Inventory 199496
MO
DU
LE
LA
ND
US
E C
HA
NG
E A
ND
FO
RE
ST
RY
SU
BM
OD
UL
EC
HA
NG
ES
IN
FO
RE
ST
AN
D O
TH
ER
WO
OD
Y B
IOM
AS
S S
TO
CK
S
WO
RK
SH
EE
T5
-1S
HE
ET
3 O
F 3
CO
UN
TR
YT
ha
ila
nd
YE
AR
19
94
STEP
3ST
EP 4
NO
PQ
Car
bon
Frac
tion
Ann
ual
Car
bon
Rele
ase
Net
Ann
ual
Car
bon
Upt
ake
Con
vert
to
CO
2 A
nnua
l Em
issi
on
(+)
or R
elea
se (
-)(-)
or
Rem
oval
(+)
(kt
C)
(kt
C)
(Gg
CO
2)
O =
(M
x N
)P
= (E
- O
)Q
= (
P x
[44/
12])
0.5
10,9
58.3
2-6
,197
.26
-22,
723.
28
Tab
le A
6.1
(Co
nt.
)
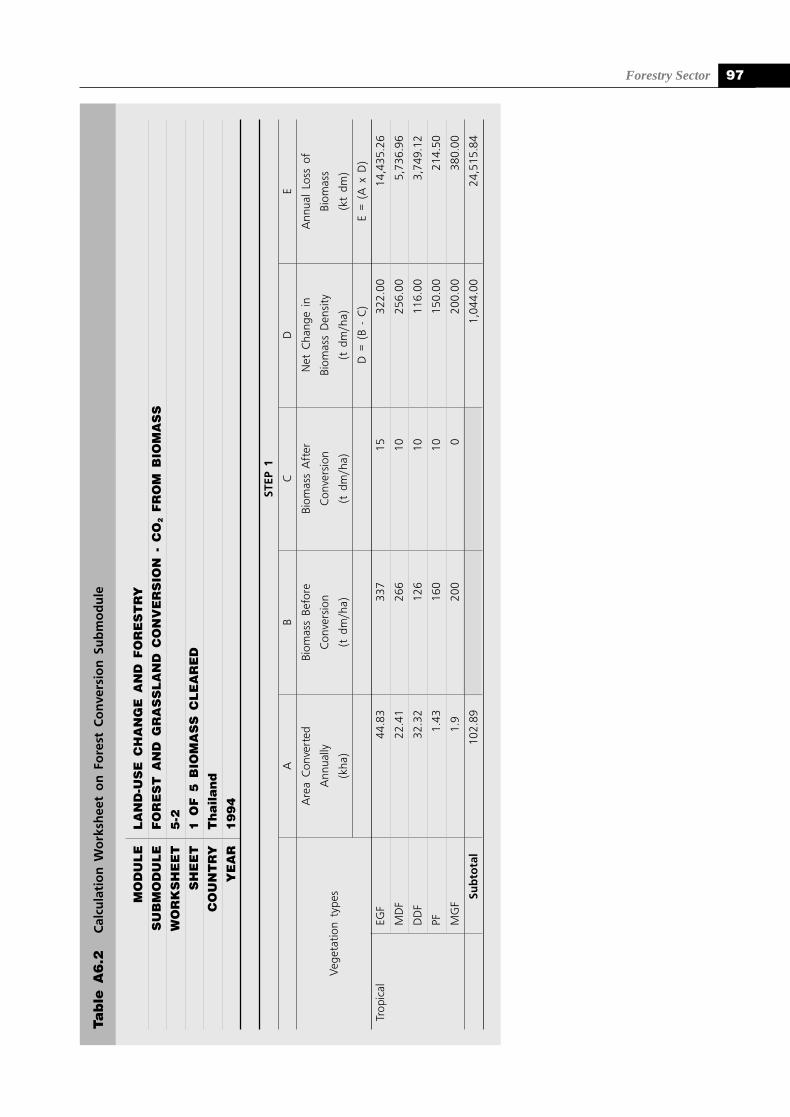
Forestry Sector 97
Tab
le A
6.2
Cal
cula
tio
n W
ork
shee
t o
n F
ore
st C
on
vers
ion
Su
bm
od
ule
MO
DU
LE
LA
ND
-US
E C
HA
NG
E A
ND
FO
RE
ST
RY
SU
BM
OD
UL
EF
OR
ES
T A
ND
GR
AS
SL
AN
D C
ON
VE
RS
ION
- C
O2 F
RO
M B
IOM
AS
S
WO
RK
SH
EE
T5
-2
SH
EE
T1
OF
5 B
IOM
AS
S C
LE
AR
ED
CO
UN
TR
YT
ha
ila
nd
YE
AR
19
94
STEP
1
AB
CD
E
Are
a C
onve
rted
Biom
ass
Befo
reBi
omas
s A
fter
Net
Cha
nge
inA
nnua
l Lo
ss o
f
Veg
etat
ion
type
sA
nnua
llyC
onve
rsio
nC
onve
rsio
nBi
omas
s D
ensi
tyBi
omas
s
(kha
)(t
dm
/ha)
(t d
m/h
a)(t
dm
/ha)
(kt
dm)
D =
(B
- C
)E
= (A
x D
)
Trop
ical
EGF
44.8
333
715
322.
0014
,435
.26
MD
F22
.41
266
1025
6.00
5,73
6.96
DD
F32
.32
126
1011
6.00
3,74
9.12
PF1.
4316
010
150.
0021
4.50
MG
F1.
920
00
200.
0038
0.00
Sub
tota
l10
2.89
1,04
4.00
24,5
15.8
4
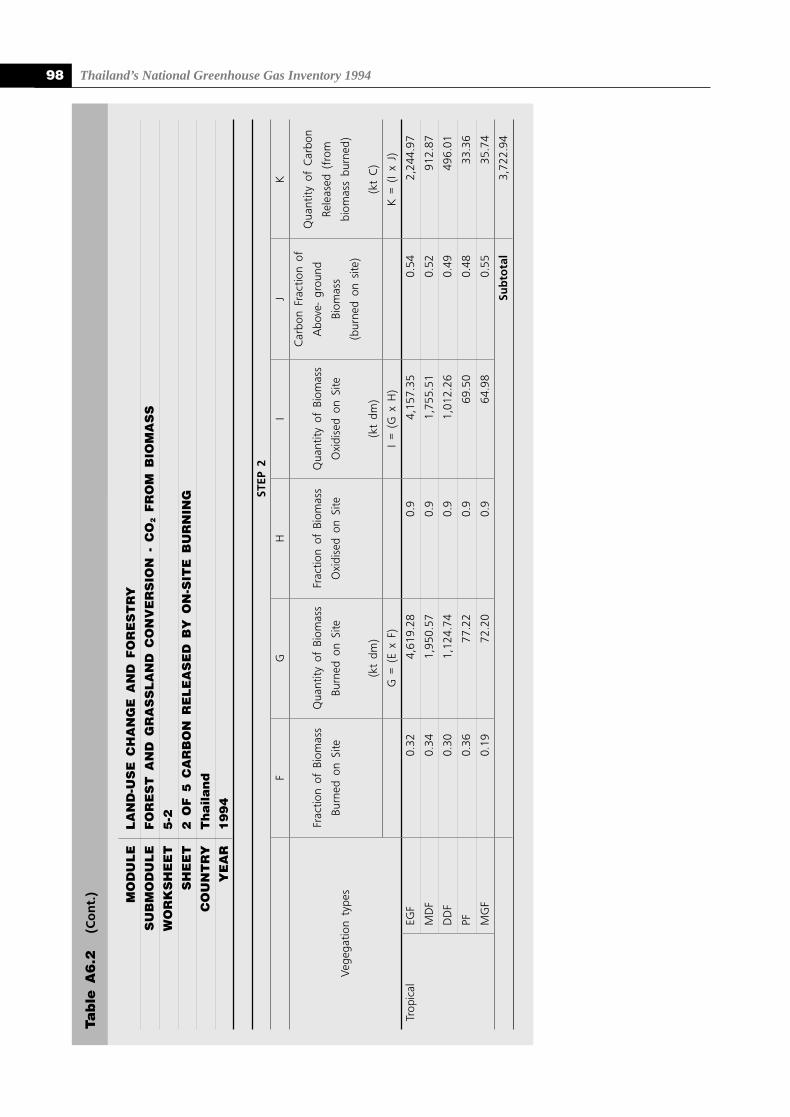
Thailand’s National Greenhouse Gas Inventory 199498
MO
DU
LE
LA
ND
-US
E C
HA
NG
E A
ND
FO
RE
ST
RY
SU
BM
OD
UL
EF
OR
ES
T A
ND
GR
AS
SL
AN
D C
ON
VE
RS
ION
- C
O2 F
RO
M B
IOM
AS
SW
OR
KS
HE
ET
5-2
SH
EE
T2
OF
5 C
AR
BO
N R
EL
EA
SE
D B
Y O
N-S
ITE
BU
RN
ING
CO
UN
TR
YT
ha
ila
nd
YE
AR
19
94
STEP
2
FG
HI
JK
Car
bon
Frac
tion
ofQ
uant
ity o
f C
arbo
nFr
actio
n of
Bio
mas
sQ
uant
ity o
f Bi
omas
sFr
actio
n of
Bio
mas
sQ
uant
ity o
f Bi
omas
sA
bove
- gr
ound
Rele
ased
(fr
om
Vege
gatio
n ty
pes
Burn
ed o
n Si
teBu
rned
on
Site
Oxi
dise
d on
Site
Oxi
dise
d on
Site
Biom
ass
biom
ass
burn
ed)
(bur
ned
on s
ite)
(kt
dm)
(kt
dm)
(kt
C)
G =
(E
x F)
I =
(G x
H)
K =
(I
x J)
Trop
ical
EGF
0.32
4,61
9.28
0.9
4,15
7.35
0.54
2,24
4.97
MD
F0.
341,
950.
570.
91,
755.
510.
5291
2.87
DD
F0.
301,
124.
740.
91,
012.
260.
4949
6.01
PF0.
3677
.22
0.9
69.5
00.
4833
.36
MG
F0.
1972
.20
0.9
64.9
80.
5535
.74
Sub
tota
l3,
722.
94
Tab
le A
6.2
(Co
nt.
)
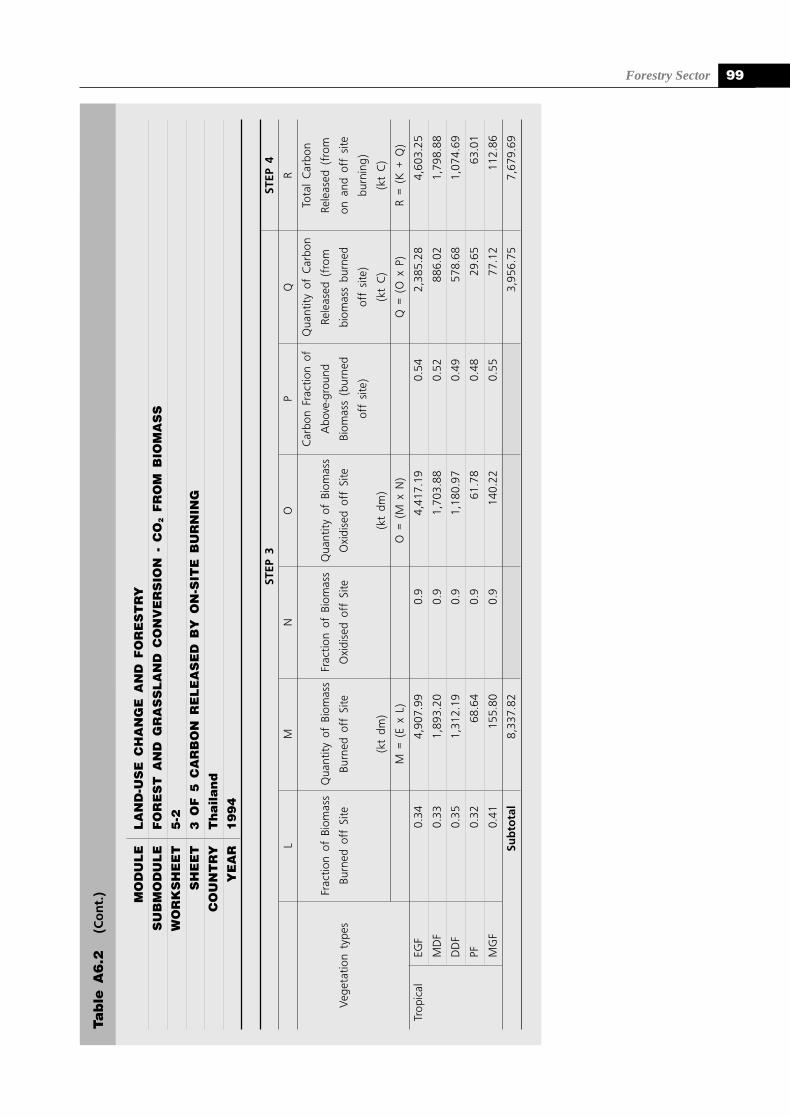
Forestry Sector 99
Tab
le A
6.2
(Co
nt.
) MO
DU
LE
LA
ND
-US
E C
HA
NG
E A
ND
FO
RE
ST
RY
SU
BM
OD
UL
EF
OR
ES
T A
ND
GR
AS
SL
AN
D C
ON
VE
RS
ION
- C
O2 F
RO
M B
IOM
AS
SW
OR
KS
HE
ET
5-2
SH
EE
T3
OF
5 C
AR
BO
N R
EL
EA
SE
D B
Y O
N-S
ITE
BU
RN
ING
CO
UN
TR
YT
ha
ila
nd
YE
AR
19
94
STEP
3ST
EP 4
LM
NO
PQ
R
Car
bon
Frac
tion
ofQ
uant
ity o
f C
arbo
nTo
tal
Car
bon
Frac
tion
of B
iom
ass
Qua
ntity
of
Biom
ass
Frac
tion
of B
iom
ass
Qua
ntity
of
Biom
ass
Abo
ve-g
roun
dRe
leas
ed (
from
Rele
ased
(fr
om
Veg
etat
ion
type
sBu
rned
off
Site
Burn
ed o
ff S
iteO
xidi
sed
off
Site
Oxi
dise
d of
f Si
teBi
omas
s (b
urne
dbi
omas
s bu
rned
on a
nd o
ff s
ite
off
site
)of
f si
te)
burn
ing)
(kt
dm)
(kt
dm)
(kt
C)
(kt
C)
M =
(E
x L)
O =
(M
x N
)Q
= (
O x
P)
R =
(K +
Q)
Trop
ical
EGF
0.34
4,90
7.99
0.9
4,41
7.19
0.54
2,38
5.28
4,60
3.25
MD
F0.
331,
893.
200.
91,
703.
880.
5288
6.02
1,79
8.88
DD
F0.
351,
312.
190.
91,
180.
970.
4957
8.68
1,07
4.69
PF0.
3268
.64
0.9
61.7
80.
4829
.65
63.0
1
MG
F0.
4115
5.80
0.9
140.
220.
5577
.12
112.
86
Sub
tota
l8,
337.
823,
956.
757,
679.
69
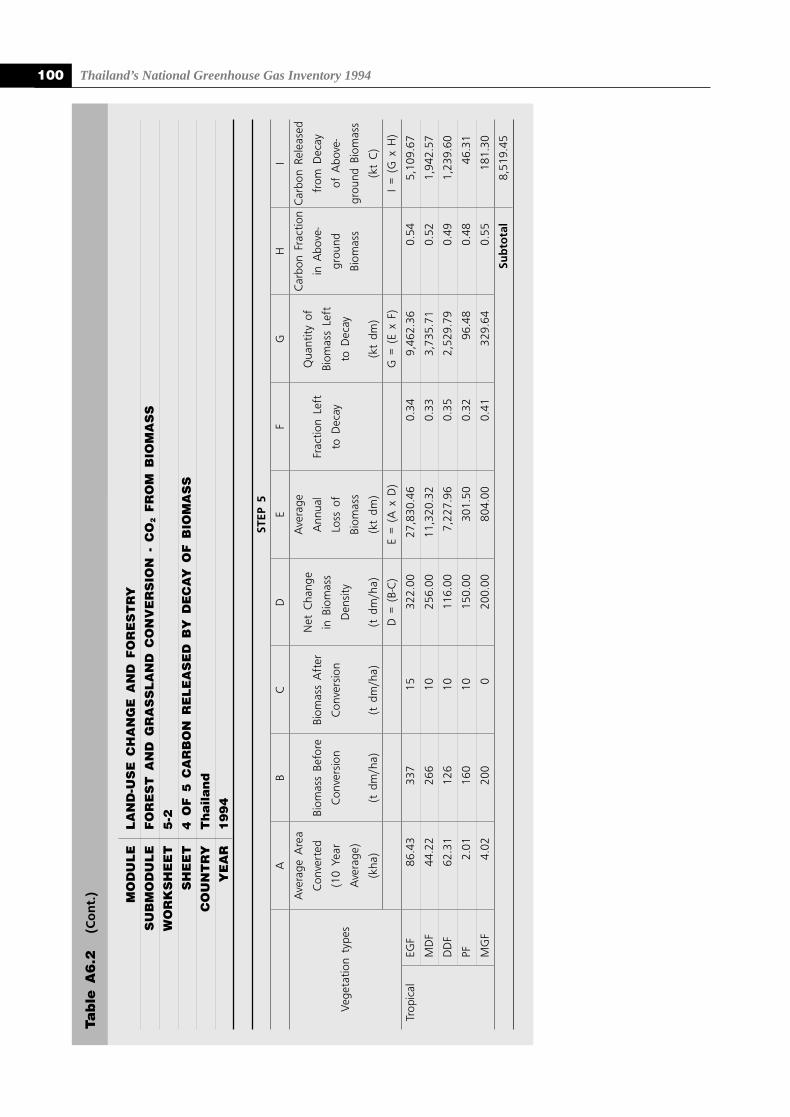
Thailand’s National Greenhouse Gas Inventory 1994100
MO
DU
LE
LA
ND
-US
E C
HA
NG
E A
ND
FO
RE
ST
RY
SU
BM
OD
UL
EF
OR
ES
T A
ND
GR
AS
SL
AN
D C
ON
VE
RS
ION
- C
O2 F
RO
M B
IOM
AS
SW
OR
KS
HE
ET
5-2
SH
EE
T4
OF
5 C
AR
BO
N R
EL
EA
SE
D B
Y D
EC
AY
OF
BIO
MA
SS
CO
UN
TR
YT
ha
ila
nd
YE
AR
19
94
STEP
5
AB
CD
EF
GH
I
Ave
rage
Are
aN
et C
hang
eA
vera
geQ
uant
ity o
fC
arbo
n Fr
actio
nC
arbo
n Re
leas
ed
Con
vert
edBi
omas
s Be
fore
Biom
ass
Aft
erin
Bio
mas
sA
nnua
lFr
actio
n Le
ftBi
omas
s Le
ftin
Abo
ve-
from
Dec
ay
Veg
etat
ion
type
s(1
0 Ye
arC
onve
rsio
nC
onve
rsio
nD
ensi
tyLo
ss o
fto
Dec
ayto
Dec
aygr
ound
of A
bove
-
Ave
rage
)Bi
omas
sBi
omas
sgr
ound
Bio
mas
s
(kha
)(t
dm
/ha)
(t d
m/h
a)(t
dm
/ha)
(kt
dm)
(kt
dm)
(kt
C)
D =
(B-
C)
E =
(A x
D)
G =
(E
x F)
I =
(G x
H)
Trop
ical
EGF
86.4
333
715
322.
0027
,830
.46
0.34
9,46
2.36
0.54
5,10
9.67
MD
F44
.22
266
1025
6.00
11,3
20.3
20.
333,
735.
710.
521,
942.
57
DD
F62
.31
126
1011
6.00
7,22
7.96
0.35
2,52
9.79
0.49
1,23
9.60
PF2.
0116
010
150.
0030
1.50
0.32
96.4
80.
4846
.31
MG
F4.
0220
00
200.
0080
4.00
0.41
329.
640.
5518
1.30
Sub
tota
l8,
519.
45
Tab
le A
6.2
(Co
nt.
)
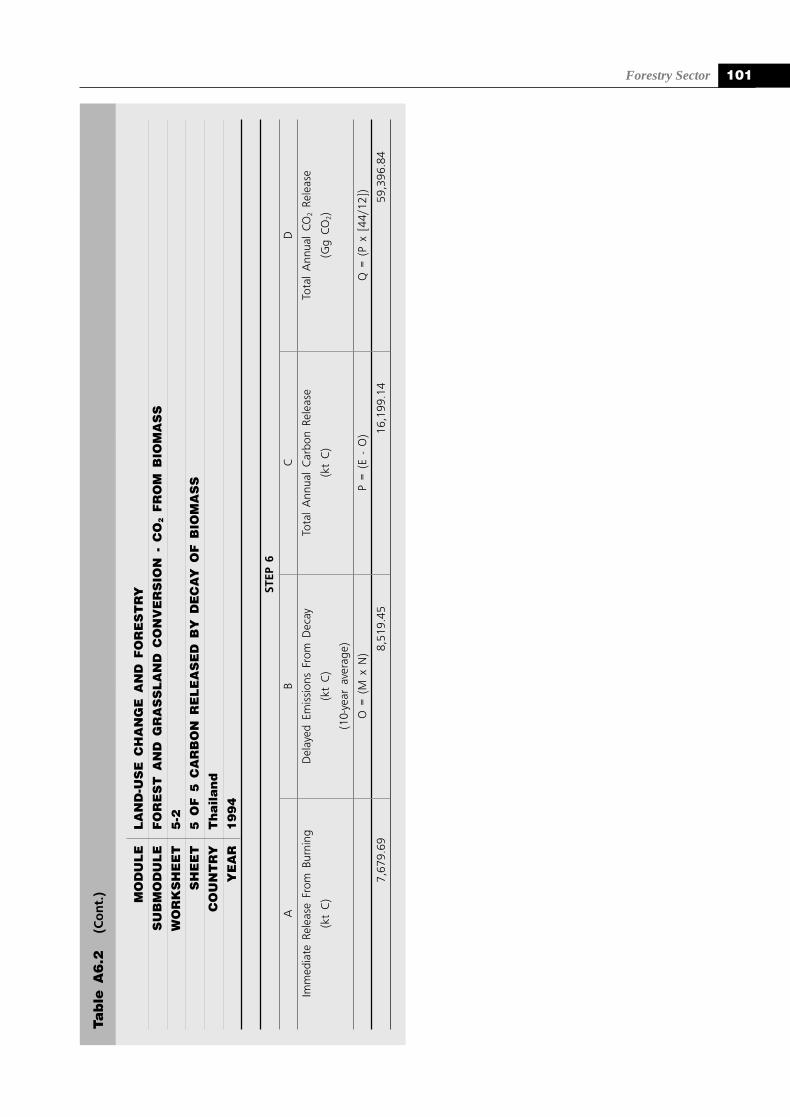
Forestry Sector 101
MO
DU
LE
LA
ND
-US
E C
HA
NG
E A
ND
FO
RE
ST
RY
SU
BM
OD
UL
EF
OR
ES
T A
ND
GR
AS
SL
AN
D C
ON
VE
RS
ION
- C
O2 F
RO
M B
IOM
AS
S
WO
RK
SH
EE
T5
-2S
HE
ET
5 O
F 5
CA
RB
ON
RE
LE
AS
ED
BY
DE
CA
Y O
F B
IOM
AS
S
CO
UN
TR
YT
ha
ila
nd
YE
AR
19
94
STEP
6
AB
CD
Imm
edia
te R
elea
se F
rom
Bur
ning
Del
ayed
Em
issi
ons
From
Dec
ayTo
tal
Ann
ual
Car
bon
Rele
ase
Tota
l A
nnua
l CO
2 Re
leas
e
(kt
C)
(kt
C)
(kt
C)
(Gg
CO
2)
(10-
year
ave
rage
)
O =
(M
x N
)P
= (E
- O
)Q
= (
P x
[44/
12])
7,67
9.69
8,51
9.45
16,1
99.1
459
,396
.84
Tab
le A
6.2
(Co
nt.
)
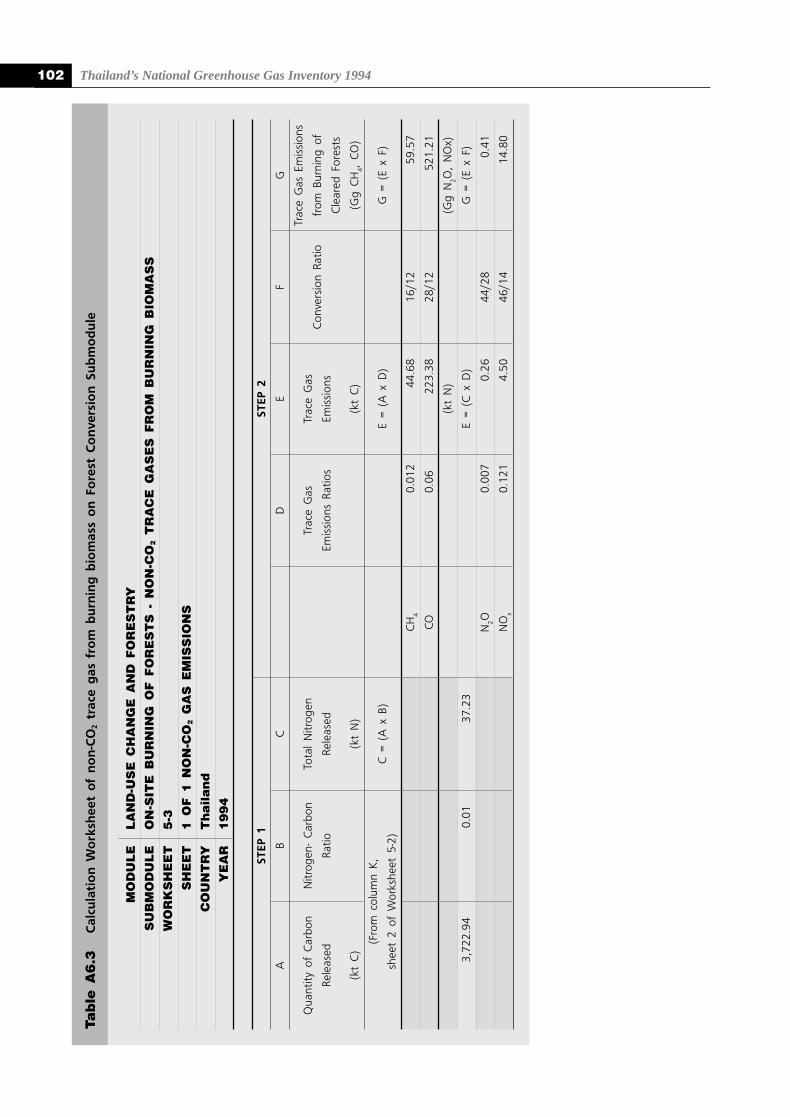
Thailand’s National Greenhouse Gas Inventory 1994102Ta
ble
A6
.3C
alcu
lati
on
Wo
rksh
eet
of
no
n-C
O2
trac
e g
as f
rom
bu
rnin
g b
iom
ass
on
Fo
rest
Co
nve
rsio
n S
ub
mo
du
le
MO
DU
LE
LA
ND
-US
E C
HA
NG
E A
ND
FO
RE
ST
RY
SU
BM
OD
UL
EO
N-S
ITE
BU
RN
ING
OF
FO
RE
ST
S -
NO
N-C
O2 T
RA
CE
GA
SE
S F
RO
M B
UR
NIN
G B
IOM
AS
SW
OR
KS
HE
ET
5-3
SH
EE
T1
OF
1 N
ON
-CO
2 G
AS
EM
ISS
ION
S
CO
UN
TR
YT
ha
ila
nd
YE
AR
19
94
STEP
1ST
EP 2
AB
CD
EF
G
Qua
ntity
of
Car
bon
Nitr
ogen
- C
arbo
nTo
tal
Nitr
ogen
Trac
e G
asTr
ace
Gas
Trac
e G
as E
mis
sion
s
Rele
ased
Ratio
Rele
ased
Emis
sion
s Ra
tios
Emis
sion
sC
onve
rsio
n Ra
tiofr
om B
urni
ng o
f
Cle
ared
For
ests
(kt
C)
(kt
N)
(kt
C)
(Gg
CH
4, C
O)
(Fro
m c
olum
n K
,C
= (
A x
B)
E =
(A x
D)
G =
(E
x F)
shee
t 2
of W
orks
heet
5-2
)
CH
40.
012
44.6
816
/12
59.5
7
CO0.
0622
3.38
28/1
252
1.21
(kt
N)
(Gg
N2O
, N
Ox)
3,72
2.94
0.01
37.2
3E
= (C
x D
)G
= (
E x
F)
N2O
0.00
70.
2644
/28
0.41
NO
x0.
121
4.50
46/1
414
.80
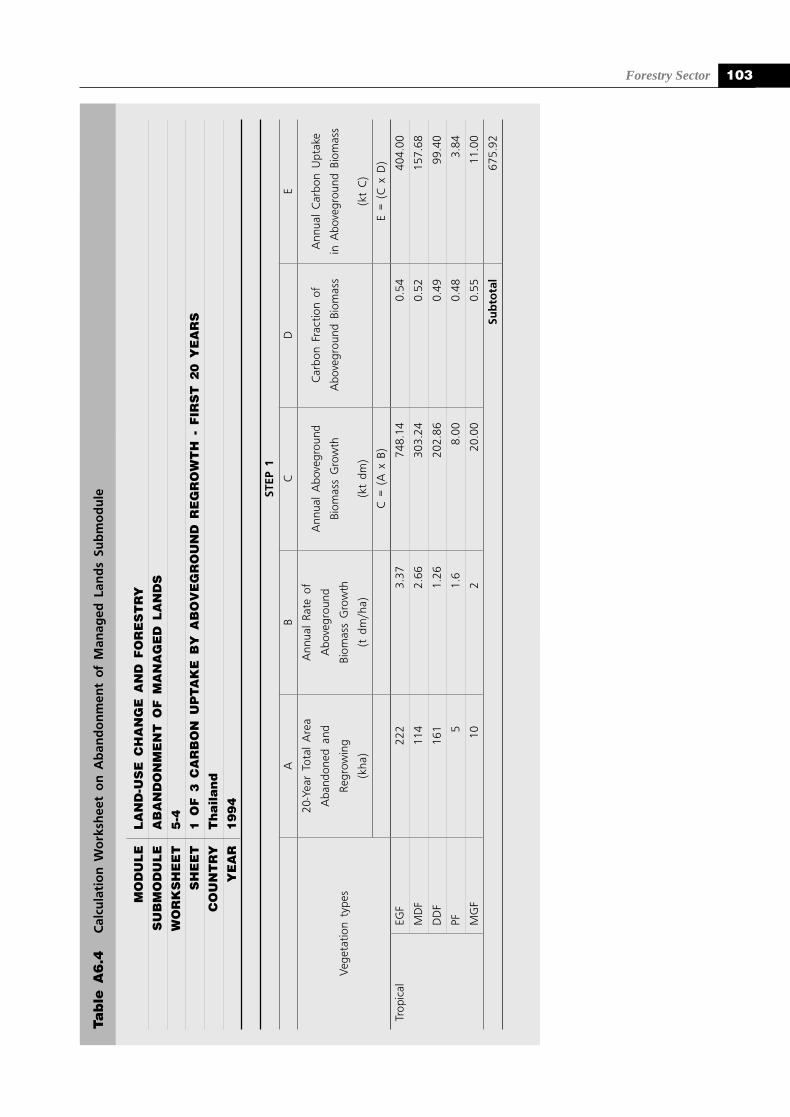
Forestry Sector 103
MO
DU
LE
LA
ND
-US
E C
HA
NG
E A
ND
FO
RE
ST
RY
SU
BM
OD
UL
EA
BA
ND
ON
ME
NT
OF
MA
NA
GE
D L
AN
DS
WO
RK
SH
EE
T5
-4S
HE
ET
1 O
F 3
CA
RB
ON
UP
TA
KE
BY
AB
OV
EG
RO
UN
D R
EG
RO
WT
H -
FIR
ST
20
YE
AR
S
CO
UN
TR
YT
ha
ila
nd
YE
AR
19
94
STEP
1
AB
CD
E
20-Y
ear
Tota
l A
rea
Ann
ual
Rate
of
Ann
ual
Abo
vegr
ound
Car
bon
Frac
tion
ofA
nnua
l C
arbo
n U
ptak
eA
band
oned
and
Abo
vegr
ound
Biom
ass
Gro
wth
Abo
vegr
ound
Bio
mas
sin
Abo
vegr
ound
Bio
mas
sV
eget
atio
n ty
pes
Regr
owin
gBi
omas
s G
row
th
(kha
)(t
dm
/ha)
(kt
dm)
(kt
C)
C =
(A
x B
)E
= (C
x D
)
Trop
ical
EGF
222
3.37
748.
140.
5440
4.00
MD
F11
42.
6630
3.24
0.52
157.
68
DD
F16
11.
2620
2.86
0.49
99.4
0
PF5
1.6
8.00
0.48
3.84
MG
F10
220
.00
0.55
11.0
0
Sub
tota
l67
5.92
Tab
le A
6.4
Cal
cula
tio
n W
ork
shee
t o
n A
ban
do
nm
ent
of
Man
aged
Lan
ds
Sub
mo
du
le
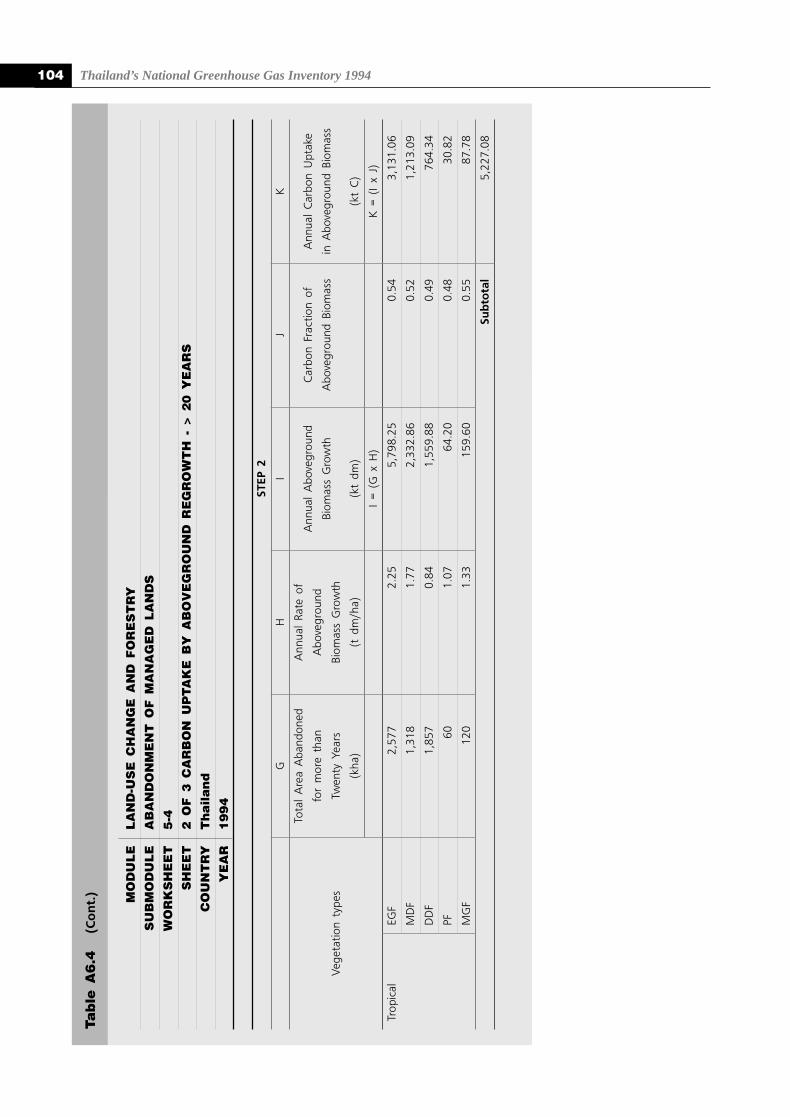
Thailand’s National Greenhouse Gas Inventory 1994104
MO
DU
LE
LA
ND
-US
E C
HA
NG
E A
ND
FO
RE
ST
RY
SU
BM
OD
UL
EA
BA
ND
ON
ME
NT
OF
MA
NA
GE
D L
AN
DS
WO
RK
SH
EE
T5
-4S
HE
ET
2 O
F 3
CA
RB
ON
UP
TA
KE
BY
AB
OV
EG
RO
UN
D R
EG
RO
WT
H -
> 2
0 Y
EA
RS
CO
UN
TR
YT
ha
ila
nd
YE
AR
19
94
STEP
2
GH
IJ
K
Tota
l A
rea
Aba
ndon
edA
nnua
l Ra
te o
fA
nnua
l A
bove
grou
ndC
arbo
n Fr
actio
n of
Ann
ual
Car
bon
Upt
ake
for
mor
e th
anA
bove
grou
ndBi
omas
s G
row
thA
bove
grou
nd B
iom
ass
in A
bove
grou
nd B
iom
ass
Veg
etat
ion
type
sTw
enty
Yea
rsBi
omas
s G
row
th
(kha
)(t
dm
/ha)
(kt
dm)
(kt
C)
I =
(G x
H)
K =
(I
x J)
Trop
ical
EGF
2,57
72.
255,
798.
250.
543,
131.
06
MD
F1,
318
1.77
2,33
2.86
0.52
1,21
3.09
DD
F1,
857
0.84
1,55
9.88
0.49
764.
34
PF60
1.07
64.2
00.
4830
.82
MG
F12
01.
3315
9.60
0.55
87.7
8
Sub
tota
l5,
227.
08
Tab
le A
6.4
(Co
nt.
)
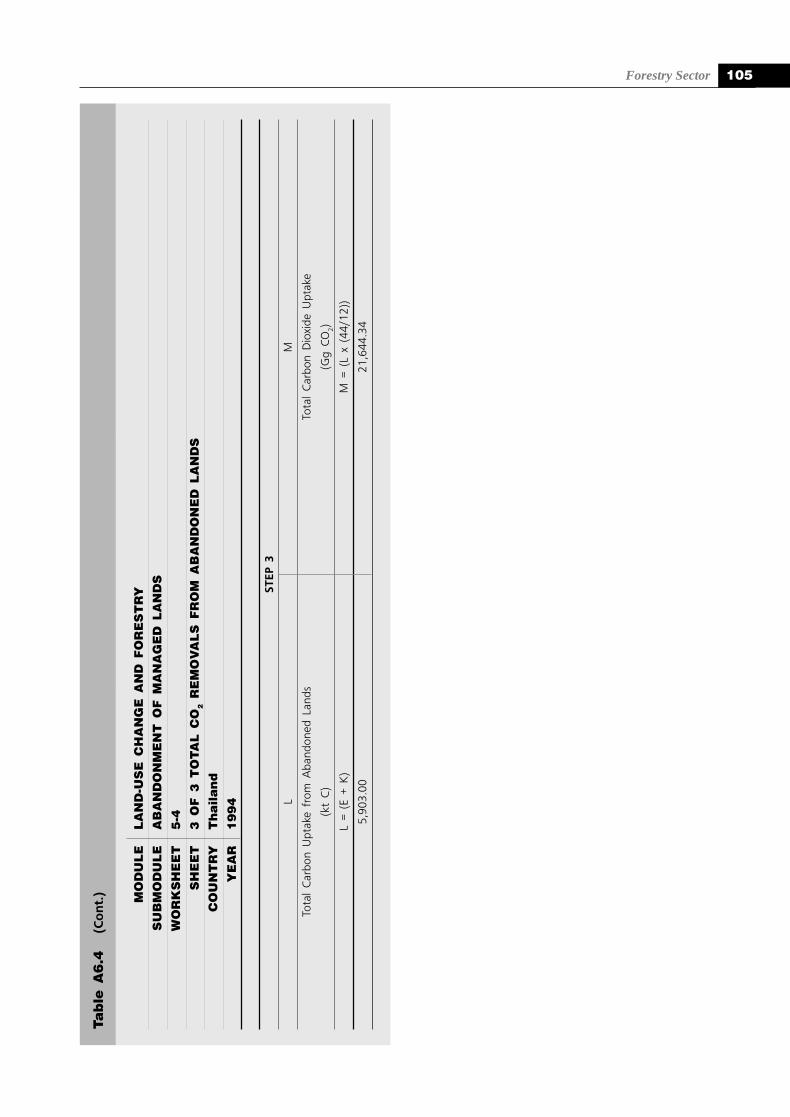
Forestry Sector 105
MO
DU
LE
LA
ND
-US
E C
HA
NG
E A
ND
FO
RE
ST
RY
SU
BM
OD
UL
EA
BA
ND
ON
ME
NT
OF
MA
NA
GE
D L
AN
DS
WO
RK
SH
EE
T5
-4
SH
EE
T3
OF
3 T
OTA
L C
O2 R
EM
OV
AL
S F
RO
M A
BA
ND
ON
ED
LA
ND
SC
OU
NT
RY
Th
aila
nd
YE
AR
19
94
STEP
3
LM
Tota
l C
arbo
n U
ptak
e fr
om A
band
oned
Lan
dsTo
tal
Car
bon
Dio
xide
Upt
ake
(kt
C)
(Gg
CO
2)
L =
(E +
K)
M =
(L
x (4
4/12
))
5,90
3.00
21,6
44.3
4
Tab
le A
6.4
(Co
nt.
)

7C H A P T E R
WASTE SECTOR
b y S i r i n t o r n t h e p T o w p r a y o o n
● Introduction
● Methodology
● Data
● Results
Thailand’s National Greenhouse Gas Inventory 1994108
Thailand’s National Greenhouse Gas Inventory 1994
7.1 INTRODUCTIONThe emission of greenhouse gases from the waste
sector, comprising mostly methane, is produced via theanaerobic digestion of organic matter. The amounts ofmethane emitted depend mainly on the anaerobic activitiesand physical characteristic of waste. Greenhouse gasesfrom this sector come from two main sources: (1) landdisposal of solid waste; and (2) wastewater handling.
This study also discussed the possible policies andmeasures for mitigation options. The results are shownin the Appendix.
7.2 METHODOLOGYLand Disposal of Solid Waste
In 1997, a group of researchers led by the ThailandEnvironment Institute (1996) prepared a nationalinventory of greenhouse gases for the year 1990 accordingto the 1995 IPCC guidelines (IPCC,1995). Emissionsfrom the waste sector were included in the report.
Total methane emissions from solid waste disposalon land was estimated at 76.509 thousand tonnes orGigagrams (Gg) for the year 1990. Since it was the firsttime that emissions from the waste sector were estimated,the IPCC default methodology using the theoretical gasyield was used. This method was based on a mass balanceapproach and did not incorporate any time factors intothe methodology.
The default theoretical gas yield methodology wasrevised by the IPCC (1996) to improve its accuracy. Thiswas done by introducing methane correction factors ordefault values to consider four different types ofsolid waste disposal sites (SWDS), namely: (1) managed,(2) unmanaged-deep (>5m waste), (3) unmanaged-shallow(<5m waste), and (4) uncategorized site. However, thebasis for this methodology was still the mass balanceapproach where the amount of wastes generated frommunicipalities is taken into account.
In Thailand, more than half of the population stilllives in rural areas where adequate waste managementsystems are not being implemented. Even in some urbancommunities, municipality waste collection systems areunavailable. Therefore, the amount of wastes generatedwas estimated using the number of population, less therural population. This is one of the major uncertaintiesin estimating the amount of solid wastes for land disposalderived from waste collection.
The calculation is based on the following equation:
Landfill
Methane emissions from landfill (Gg/yr)= Total MSW (Gg/yr)
x Fraction MSW landfilledx Fraction DOC in MSWx Fraction actual DOC dissimulatedx 0.55 g-C as CH4/gC as biogasx Conversion ratio (16/12)– recovered CH4 (Gg/yr)
Open Dumping
Methane emissions from open dumping (Gg/yr)= Total MSW (Gg/yr)
x Fraction MSW opendumpedx Fraction DOC in MSWx Fraction actual DOC dissimulatedx 0.275 g-C as CH4/gC as biogasx Conversion ratio (16/12)– recovered CH4 (Gg/yr)
where:
Total Municipal Solid Waste (MSW)= population x waste generation rate
DOC = degradable organic carbon
To account for the time factor in emissions, thetheoretical first order decay methodology (FODmethod) was developed by the IPCC. This methodacknowledges the fact that emissions of methane occurover long periods of time rather than instantaneously. TheIPCC has recommended its use for countries withavailable data.
Unfortunately, representative data on SWDS for 1990could not be obtained due to lack of proper data collectionand local management system. The Pollution ControlDepartment only began to establish country data on MSWtreatment sites in municipalities and sanitary districts in1994 (Pollution Control Department, 1994). The namesof the municipalities covered are shown on Table A7.1in Appendix.
In order to estimate more accurately the inventoryof methane gas emissions from land disposal in thevarious SWDS, where data for 1994 were available, theFOD model was used.
The equation used for calculation is as follows:
Equation 1.
Total methane emission = Σ Qn
Waste Sector 109
where:
Q = total amount of methane gas generated incurrent year (cu m/yr)
n = SWDS in the country
Equation 2.
Q = LoR(e+kc – e-kt)
where:
Lo = methane generation potential of waste(cu m/tonne)
R = average annual waste acceptance rateduring active life (tonne/year)
k = decay constant for the rate of methanegeneration (per year)
c = time since SWDS closure (years)
t = time since SWDS opened (years)
Wastewater Handling
Domestic Wastewater
Emissions of greenhouse gases from domesticwastewater in Thailand were first reported in a studysubmitted by the Thailand Environment Institute (1996)to the Office of Environmental Policy and Planning in1996. Methane emissions amounting to 2.279 Gg inthe year 1990 were estimated using the 1995 IPCCmethodology which was based on the number ofpopulation and wastewater generation rate.
The latest estimates, using the revised methodologyof IPCC 1996, present a more accurate picture and areeasier to calculate. The estimates of methane fromdomestic wastewater handling were therefore calculatedfollowing the revised method of IPCC 1996.
The equations used are as follows:
Equation 1.
TOWdom = P x Ddom x (1-DSdom)
where:
TOWdom = total domestic organic wastewater (kg-BOD/yr)
P = population (thousand persons)
Ddom = domestic degradable component (kg-BOD/yr)
DSdom = fraction of domestic degradable organiccomponent removed as sludge
Equation 2.
TOSdom = P x Ddom x DSdom
where:
TOSdom = total domestic organic sludge(kg-BOD/yr)
Equation 3.
EFi = Boi x Σ (WSix x MCFx)
where:
EFI = emission factor (kg-CH4/kg-DC) forwastewater type i
DC = Degradable carbon
Boi = maximum methane producing capacity(kg-CH4/kg-DC) for wastewater type i
WSix = fraction of wastewater type i treatedusing wastewater handling system x
MCFx = methane conversion factors of eachwastewater system
Equation 4.
EFj = Boj x Σ (SSjy x MCFy)
where:
EFj = emission factor (kg-CH4/kg-DC) forsludge type j
Boj = maximum methane producing capacity(kg-CH4/kg-DC) for sludge type j
SSjy = fraction of sludge type j treated usingwastewater handling system y
MCFy = methane conversion factors of eachwastewater system
Equation 5.
WM = Σ (TOWi x EFi – MRi)
where:
WM = total methane emission from wastewaterin kg-CH4
TOWi = total organic wastewater type i in kg-DC/yr.
EFi = emission factor for wastewater type i inkg-CH4/kg-DC
MRi = total amount of methane recovered
Equation 6.
SM = Σ (TOSj x EFj – MRj)
where:
SM = total methane emission from sludge inkg-CH4
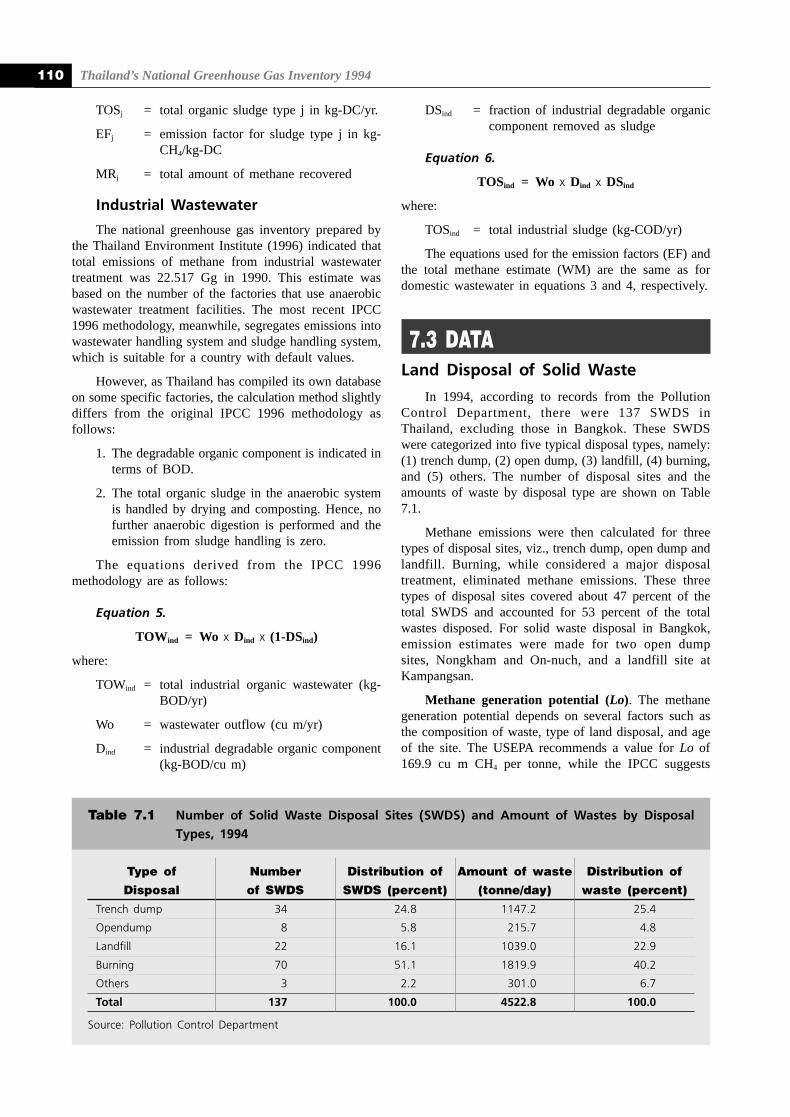
Thailand’s National Greenhouse Gas Inventory 1994110
TOSj = total organic sludge type j in kg-DC/yr.
EFj = emission factor for sludge type j in kg-CH4/kg-DC
MRj = total amount of methane recovered
Industrial Wastewater
The national greenhouse gas inventory prepared bythe Thailand Environment Institute (1996) indicated thattotal emissions of methane from industrial wastewatertreatment was 22.517 Gg in 1990. This estimate wasbased on the number of the factories that use anaerobicwastewater treatment facilities. The most recent IPCC1996 methodology, meanwhile, segregates emissions intowastewater handling system and sludge handling system,which is suitable for a country with default values.
However, as Thailand has compiled its own databaseon some specific factories, the calculation method slightlydiffers from the original IPCC 1996 methodology asfollows:
1. The degradable organic component is indicated interms of BOD.
2. The total organic sludge in the anaerobic systemis handled by drying and composting. Hence, nofurther anaerobic digestion is performed and theemission from sludge handling is zero.
The equations derived from the IPCC 1996methodology are as follows:
Equation 5.
TOWind = Wo x Dind x (1-DSind)
where:
TOWind = total industrial organic wastewater (kg-BOD/yr)
Wo = wastewater outflow (cu m/yr)
Dind = industrial degradable organic component(kg-BOD/cu m)
DSind = fraction of industrial degradable organiccomponent removed as sludge
Equation 6.
TOSind = Wo x Dind x DSind
where:
TOSind = total industrial sludge (kg-COD/yr)
The equations used for the emission factors (EF) andthe total methane estimate (WM) are the same as fordomestic wastewater in equations 3 and 4, respectively.
7.3 DATALand Disposal of Solid Waste
In 1994, according to records from the PollutionControl Department, there were 137 SWDS inThailand, excluding those in Bangkok. These SWDSwere categorized into five typical disposal types, namely:(1) trench dump, (2) open dump, (3) landfill, (4) burning,and (5) others. The number of disposal sites and theamounts of waste by disposal type are shown on Table7.1.
Methane emissions were then calculated for threetypes of disposal sites, viz., trench dump, open dump andlandfill. Burning, while considered a major disposaltreatment, eliminated methane emissions. These threetypes of disposal sites covered about 47 percent of thetotal SWDS and accounted for 53 percent of the totalwastes disposed. For solid waste disposal in Bangkok,emission estimates were made for two open dumpsites, Nongkham and On-nuch, and a landfill site atKampangsan.
Methane generation potential (Lo). The methanegeneration potential depends on several factors such asthe composition of waste, type of land disposal, and ageof the site. The USEPA recommends a value for Lo of169.9 cu m CH4 per tonne, while the IPCC suggests
Type of Number Distribution of Amount of waste Distribution of
Disposal of SWDS SWDS (percent) (tonne/day) waste (percent)
Trench dump 34 24.8 1147.2 25.4
Opendump 8 5.8 215.7 4.8
Landfill 22 16.1 1039.0 22.9
Burning 70 51.1 1819.9 40.2
Others 3 2.2 301.0 6.7
Total 137 100.0 4522.8 100.0
Source: Pollution Control Department
Table 7.1 Number of Solid Waste Disposal Sites (SWDS) and Amount of Wastes by DisposalTypes, 1994
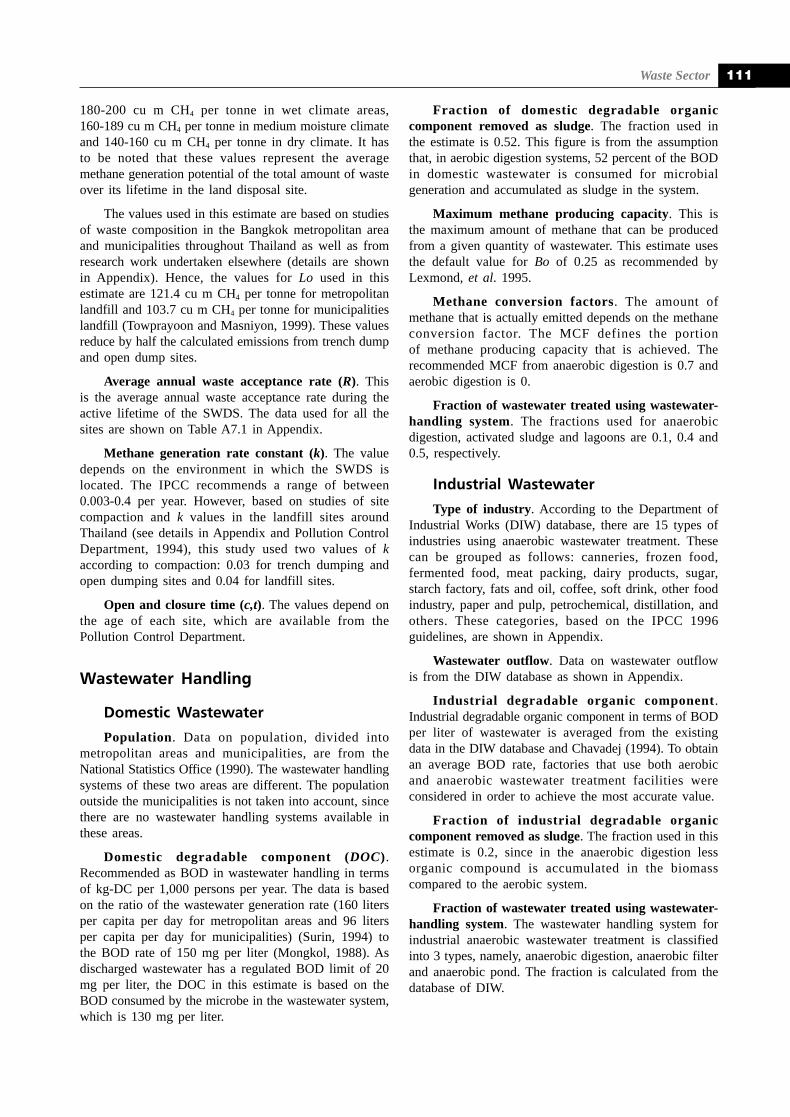
Waste Sector 111
180-200 cu m CH4 per tonne in wet climate areas,160-189 cu m CH4 per tonne in medium moisture climateand 140-160 cu m CH4 per tonne in dry climate. It hasto be noted that these values represent the averagemethane generation potential of the total amount of wasteover its lifetime in the land disposal site.
The values used in this estimate are based on studiesof waste composition in the Bangkok metropolitan areaand municipalities throughout Thailand as well as fromresearch work undertaken elsewhere (details are shownin Appendix). Hence, the values for Lo used in thisestimate are 121.4 cu m CH4 per tonne for metropolitanlandfill and 103.7 cu m CH4 per tonne for municipalitieslandfill (Towprayoon and Masniyon, 1999). These valuesreduce by half the calculated emissions from trench dumpand open dump sites.
Average annual waste acceptance rate (R). Thisis the average annual waste acceptance rate during theactive lifetime of the SWDS. The data used for all thesites are shown on Table A7.1 in Appendix.
Methane generation rate constant (k). The valuedepends on the environment in which the SWDS islocated. The IPCC recommends a range of between0.003-0.4 per year. However, based on studies of sitecompaction and k values in the landfill sites aroundThailand (see details in Appendix and Pollution ControlDepartment, 1994), this study used two values of kaccording to compaction: 0.03 for trench dumping andopen dumping sites and 0.04 for landfill sites.
Open and closure time (c,t). The values depend onthe age of each site, which are available from thePollution Control Department.
Wastewater Handling
Domestic Wastewater
Population. Data on population, divided intometropolitan areas and municipalities, are from theNational Statistics Office (1990). The wastewater handlingsystems of these two areas are different. The populationoutside the municipalities is not taken into account, sincethere are no wastewater handling systems available inthese areas.
Domestic degradable component (DOC).Recommended as BOD in wastewater handling in termsof kg-DC per 1,000 persons per year. The data is basedon the ratio of the wastewater generation rate (160 litersper capita per day for metropolitan areas and 96 litersper capita per day for municipalities) (Surin, 1994) tothe BOD rate of 150 mg per liter (Mongkol, 1988). Asdischarged wastewater has a regulated BOD limit of 20mg per liter, the DOC in this estimate is based on theBOD consumed by the microbe in the wastewater system,which is 130 mg per liter.
Fraction of domestic degradable organiccomponent removed as sludge. The fraction used inthe estimate is 0.52. This figure is from the assumptionthat, in aerobic digestion systems, 52 percent of the BODin domestic wastewater is consumed for microbialgeneration and accumulated as sludge in the system.
Maximum methane producing capacity. This isthe maximum amount of methane that can be producedfrom a given quantity of wastewater. This estimate usesthe default value for Bo of 0.25 as recommended byLexmond, et al. 1995.
Methane conversion factors. The amount ofmethane that is actually emitted depends on the methaneconversion factor. The MCF defines the portionof methane producing capacity that is achieved. Therecommended MCF from anaerobic digestion is 0.7 andaerobic digestion is 0.
Fraction of wastewater treated using wastewater-handling system. The fractions used for anaerobicdigestion, activated sludge and lagoons are 0.1, 0.4 and0.5, respectively.
Industrial Wastewater
Type of industry. According to the Department ofIndustrial Works (DIW) database, there are 15 types ofindustries using anaerobic wastewater treatment. Thesecan be grouped as follows: canneries, frozen food,fermented food, meat packing, dairy products, sugar,starch factory, fats and oil, coffee, soft drink, other foodindustry, paper and pulp, petrochemical, distillation, andothers. These categories, based on the IPCC 1996guidelines, are shown in Appendix.
Wastewater outflow. Data on wastewater outflowis from the DIW database as shown in Appendix.
Industrial degradable organic component.Industrial degradable organic component in terms of BODper liter of wastewater is averaged from the existingdata in the DIW database and Chavadej (1994). To obtainan average BOD rate, factories that use both aerobicand anaerobic wastewater treatment facilities wereconsidered in order to achieve the most accurate value.
Fraction of industrial degradable organiccomponent removed as sludge. The fraction used in thisestimate is 0.2, since in the anaerobic digestion lessorganic compound is accumulated in the biomasscompared to the aerobic system.
Fraction of wastewater treated using wastewater-handling system. The wastewater handling system forindustrial anaerobic wastewater treatment is classifiedinto 3 types, namely, anaerobic digestion, anaerobic filterand anaerobic pond. The fraction is calculated from thedatabase of DIW.
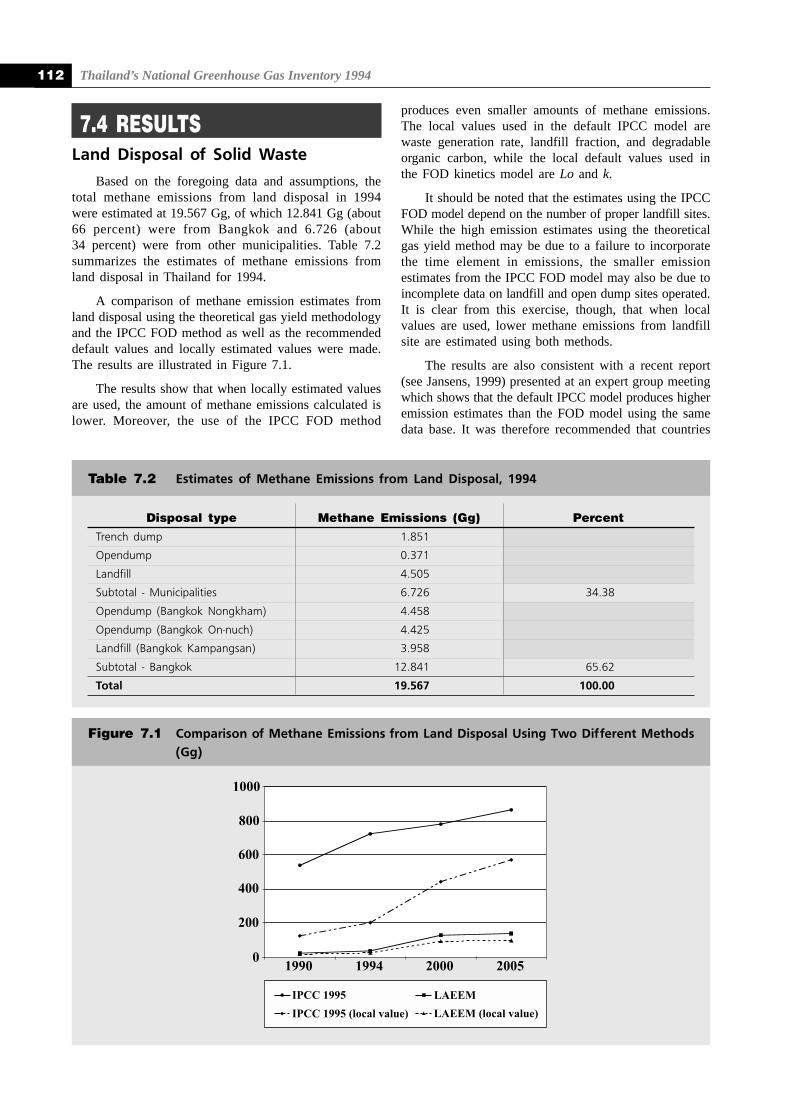
Thailand’s National Greenhouse Gas Inventory 1994112
7.4 RESULTSLand Disposal of Solid Waste
Based on the foregoing data and assumptions, thetotal methane emissions from land disposal in 1994were estimated at 19.567 Gg, of which 12.841 Gg (about66 percent) were from Bangkok and 6.726 (about34 percent) were from other municipalities. Table 7.2summarizes the estimates of methane emissions fromland disposal in Thailand for 1994.
A comparison of methane emission estimates fromland disposal using the theoretical gas yield methodologyand the IPCC FOD method as well as the recommendeddefault values and locally estimated values were made.The results are illustrated in Figure 7.1.
The results show that when locally estimated valuesare used, the amount of methane emissions calculated islower. Moreover, the use of the IPCC FOD method
Table 7.2 Estimates of Methane Emissions from Land Disposal, 1994
Figure 7.1 Comparison of Methane Emissions from Land Disposal Using Two Dif ferent Methods(Gg)
produces even smaller amounts of methane emissions.The local values used in the default IPCC model arewaste generation rate, landfill fraction, and degradableorganic carbon, while the local default values used inthe FOD kinetics model are Lo and k.
It should be noted that the estimates using the IPCCFOD model depend on the number of proper landfill sites.While the high emission estimates using the theoreticalgas yield method may be due to a failure to incorporatethe time element in emissions, the smaller emissionestimates from the IPCC FOD model may also be due toincomplete data on landfill and open dump sites operated.It is clear from this exercise, though, that when localvalues are used, lower methane emissions from landfillsite are estimated using both methods.
The results are also consistent with a recent report(see Jansens, 1999) presented at an expert group meetingwhich shows that the default IPCC model produces higheremission estimates than the FOD model using the samedata base. It was therefore recommended that countries
Disposal type Methane Emissions (Gg) Percent
Trench dump 1.851
Opendump 0.371
Landfill 4.505
Subtotal - Municipalities 6.726 34.38
Opendump (Bangkok Nongkham) 4.458
Opendump (Bangkok On-nuch) 4.425
Landfill (Bangkok Kampangsan) 3.958
Subtotal - Bangkok 12.841 65.62
Total 19.567 100.00
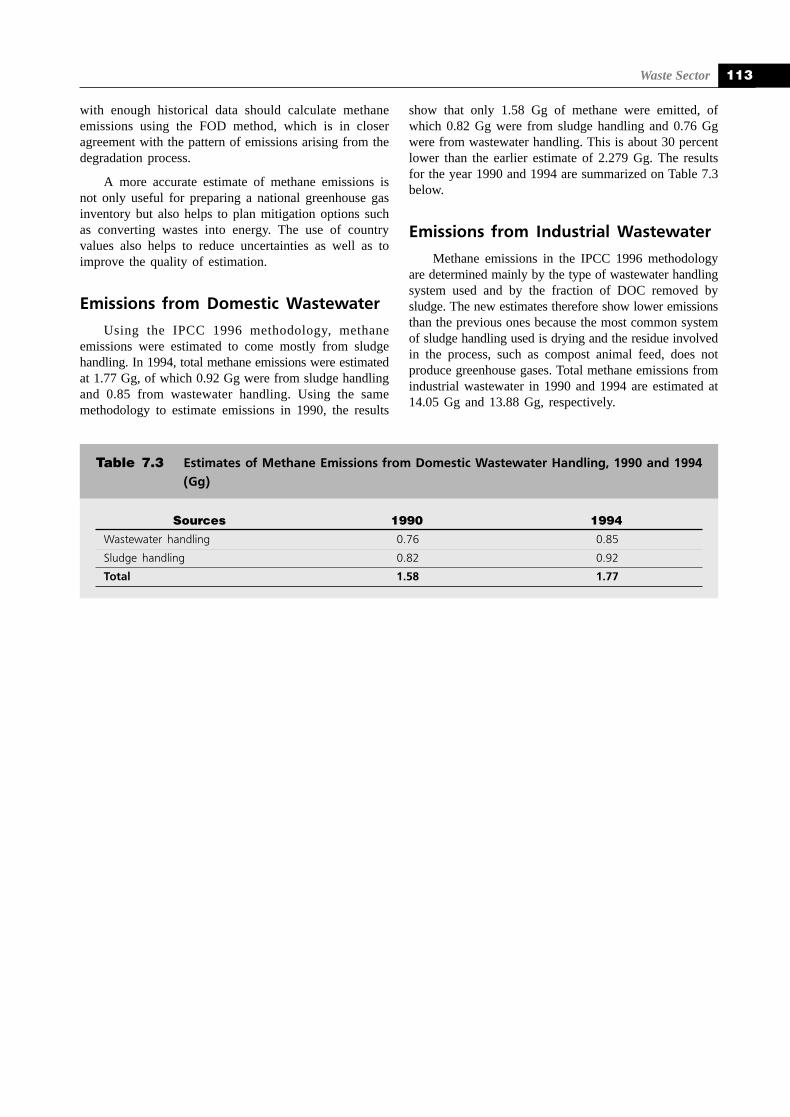
Waste Sector 113
with enough historical data should calculate methaneemissions using the FOD method, which is in closeragreement with the pattern of emissions arising from thedegradation process.
A more accurate estimate of methane emissions isnot only useful for preparing a national greenhouse gasinventory but also helps to plan mitigation options suchas converting wastes into energy. The use of countryvalues also helps to reduce uncertainties as well as toimprove the quality of estimation.
Emissions from Domestic Wastewater
Using the IPCC 1996 methodology, methaneemissions were estimated to come mostly from sludgehandling. In 1994, total methane emissions were estimatedat 1.77 Gg, of which 0.92 Gg were from sludge handlingand 0.85 from wastewater handling. Using the samemethodology to estimate emissions in 1990, the results
show that only 1.58 Gg of methane were emitted, ofwhich 0.82 Gg were from sludge handling and 0.76 Ggwere from wastewater handling. This is about 30 percentlower than the earlier estimate of 2.279 Gg. The resultsfor the year 1990 and 1994 are summarized on Table 7.3below.
Emissions from Industrial Wastewater
Methane emissions in the IPCC 1996 methodologyare determined mainly by the type of wastewater handlingsystem used and by the fraction of DOC removed bysludge. The new estimates therefore show lower emissionsthan the previous ones because the most common systemof sludge handling used is drying and the residue involvedin the process, such as compost animal feed, does notproduce greenhouse gases. Total methane emissions fromindustrial wastewater in 1990 and 1994 are estimated at14.05 Gg and 13.88 Gg, respectively.
Sources 1990 1994Wastewater handling 0.76 0.85
Sludge handling 0.82 0.92
Total 1.58 1.77
Table 7.3 Estimates of Methane Emissions from Domestic Wastewater Handling, 1990 and 1994(Gg)
Thailand’s National Greenhouse Gas Inventory 1994114
Mongkol, D. 1988. Design of Domestic WatewaterTreatment. Paper from The Third Training onDomestic Wastewater Treatment, KasetsartUniversity.
IPCC. 1995. Greenhouse Gas Inventory ReferenceManual. IPCC Guideline for National GHGInventory.
IPCC. 1996. Greenhouse Gas Inventory ReferenceManual. IPCC Revised Guideline for NationalGHG Inventory.
Jensen,J. 1999. Methane Emission from Solid WasteDisposal. Back ground paper in Expert GroupMeeting on Good Practice in Inventory Preparationfor Emission from Waste 27-29 July 1999 Sao PauloBrazil.
National Statistic of Population. 1990. Annual Report.Office of Prime Minister.
Surin,P. 1994. Design of Building Wastewater TreatmentScience and Technology (Thai version).
Pollution Control Department. 1994. Internal data.unpublished.
Thailand Environment Institute. 1996. Annual Conference“Linking Local Solution to Global Needs: Thailand’sEnvironment Agenda in the 21 Century” ClimateChange-Local Solution for global Problems.
Towprayoon, S. and Masniyon, M. 1999. Calculation ofMethane Emission from Landfill Using CountryDefault Value. Proceeding of Inter-RegionalSymposium on Sustainable Development (ISSD)18-20 May, Kanchanaburi, Thailand.
USEPA, ADB and UN-ESCAP. 1996. Landfill Gas- to-Energy Training Workshop for Asia and Pacific.Bangkok, November 18-19, 1996.
REFERENCES:
st
Waste Sector 115
Policies and Measuresfor Waste Sector
Policies and Measures
Land Disposal
One of the options for reducing methane emissionsfrom land disposal is to turn methane gas into energythrough electricity generation. And since 1995, the Thaigovernment has promoted electricity generation by theprivate sector through the Small Power Plant (SPP) andIntermediate Power Plant (IPP) production schemes.
Electricity generation from landfills is one of thepotential SPP projects in the country. However, to beeconomic, the site should be large enough and a solidwaste management plan has to be implementedsystematically. One should choose an appropriate site forlandfill operations that can effectively recover energyfrom the changeable waste composition to benefit fromelectricity generation. Presently, the existing landfill sitesscattered throughout the country are relatively small andcannot recover energy effectively. Thus the appropriatelandfill site in the future should be large enough togenerate electricity on a commercial basis.
To accumulate large amounts of wastes, the landfillsite should have a broad service area. The recommendedstrategy is to design a large and effective landfill site ineach region or service area in order to collect wastes fromthe main provinces and their vicinity. The operations ofthe landfill site, including waste collection, could be runprivately. The site would benefit more when located closeto an industrial estate where they could sell electricitydirectly.
Using the USEPA’s EPLUS model (USEPA, ADBand UN-ESCAP, 1996), the potentials for electricitygeneration from wastes in selected sites (Figure A7.1)throughout the country were estimated. The estimatesassumed the development of landfill sites over a periodof 15 years (1998-2013) and the construction of waste-to-energy projects over a 10-year period in each site. Theamounts of electricity produced in seven recommendedsite locations and their corresponding service areas areshown on Table A7.1. Total electricity generation capacitythroughout the country is about 75 megawatts (MW),excluding the electric generation potential fromBangkok’s municipal solid wastes.
Wastewater Handling
Domestic Wastewater
In making forecasts of methane emissions fromdomestic wastewater handling, it is important to note thatseveral central wastewater treatment plants are plannedfor establishment in various cities throughout the country.However, all of them focus on aerobic treatment. Theamount of domestic wastewater also depends highly onpopulation growth. Thus, the assumed growth rate inpopulation of 1.4 percent annually has importantimplications on the amount of emissions. The forecastsof methane emissions from 1990-2010 are shown onTable A7.2 below.
In order to reduce methane emissions from domesticwastewater handling, two major policies should be takeninto account:
1. Management Policy. The present managementsystem for domestic wastewater in eachmunicipality is not done in a proper manner.Moreover, there are no treatment plants in manymunicipalities, while some municipalities usepublic lagoons as stabilization and aerobic ponds.In Bangkok, four treatment plants are currentlybeing constructed to accept all wastewaterdischarges from the metropolitan area. Everymunicipality should plan to set up a standardwastewater treatment plant in their local area.Large housing estates or clusters of residentialareas where discharged wastewater can be possiblypooled together should establish their owntreatment plant and treatment system. Onlystandard effluents can be discharged to the localreservoir.
2. Technology Policy. There are two promisingsystems to treat domestic wastewater-aerobicsystem where large amounts of sludge areproduced and anaerobic system where methane isemitted. The choice of which system to developdepends on a number of factors, includingwastewater characteristics and properties, watervolume, organic loading, budget, etc. If the aerobicsystem is chosen, one should take intoconsideration the amount of sludge produced andthe immobilized microbes such as RotatingBiological Contractor (RBC). On the other hand,if the anaerobic system is selected, one shouldproperly treat the sludge in order to reduce GHGemissions. Sludge composting or co-disposal withMSW in the methane recovery site arerecommended. When the anaerobic system is usedto treat domestic wastewater, it should beequipped with energy recovery devices for heator electricity generation. The limitation is that theplant should be large enough to be attractive forenterprise or private operation.
APPENDIX
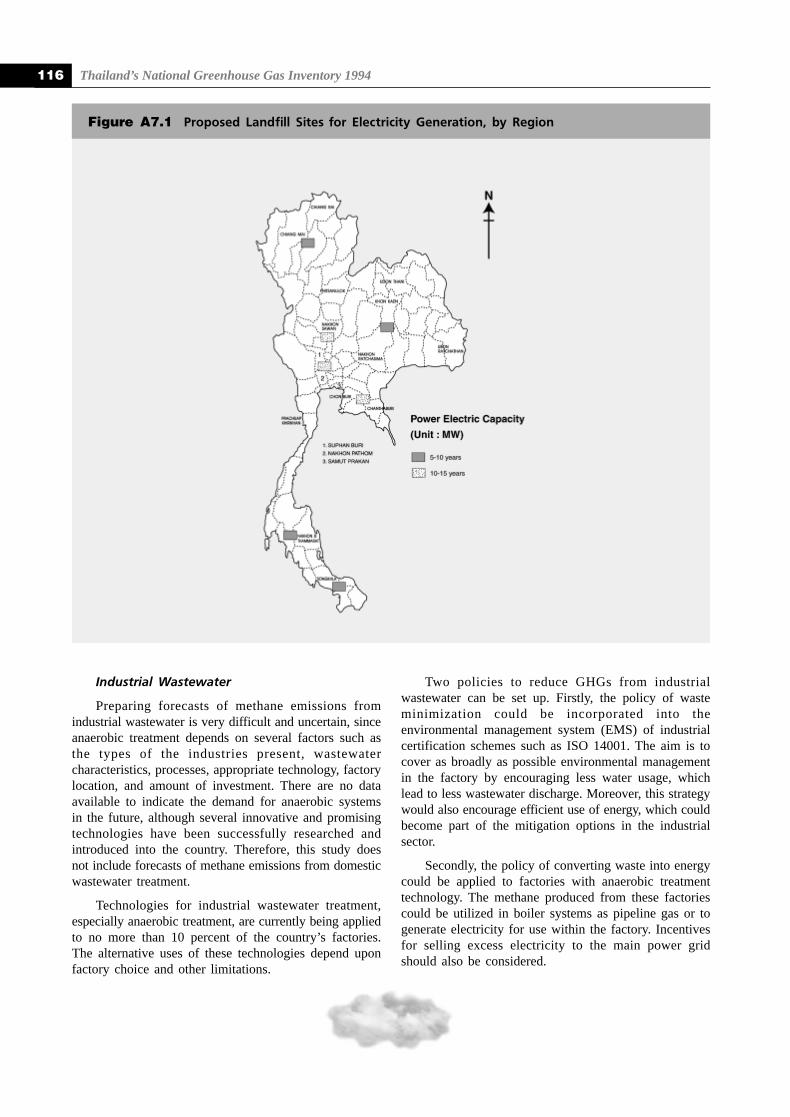
Thailand’s National Greenhouse Gas Inventory 1994116
Figure A7.1 Proposed Landfill Sites for Electricity Generation, by Region
Industrial Wastewater
Preparing forecasts of methane emissions fromindustrial wastewater is very difficult and uncertain, sinceanaerobic treatment depends on several factors such asthe types of the industries present, wastewatercharacteristics, processes, appropriate technology, factorylocation, and amount of investment. There are no dataavailable to indicate the demand for anaerobic systemsin the future, although several innovative and promisingtechnologies have been successfully researched andintroduced into the country. Therefore, this study doesnot include forecasts of methane emissions from domesticwastewater treatment.
Technologies for industrial wastewater treatment,especially anaerobic treatment, are currently being appliedto no more than 10 percent of the country’s factories.The alternative uses of these technologies depend uponfactory choice and other limitations.
Two policies to reduce GHGs from industrialwastewater can be set up. Firstly, the policy of wasteminimization could be incorporated into theenvironmental management system (EMS) of industrialcertification schemes such as ISO 14001. The aim is tocover as broadly as possible environmental managementin the factory by encouraging less water usage, whichlead to less wastewater discharge. Moreover, this strategywould also encourage efficient use of energy, which couldbecome part of the mitigation options in the industrialsector.
Secondly, the policy of converting waste into energycould be applied to factories with anaerobic treatmenttechnology. The methane produced from these factoriescould be utilized in boiler systems as pipeline gas or togenerate electricity for use within the factory. Incentivesfor selling excess electricity to the main power gridshould also be considered.
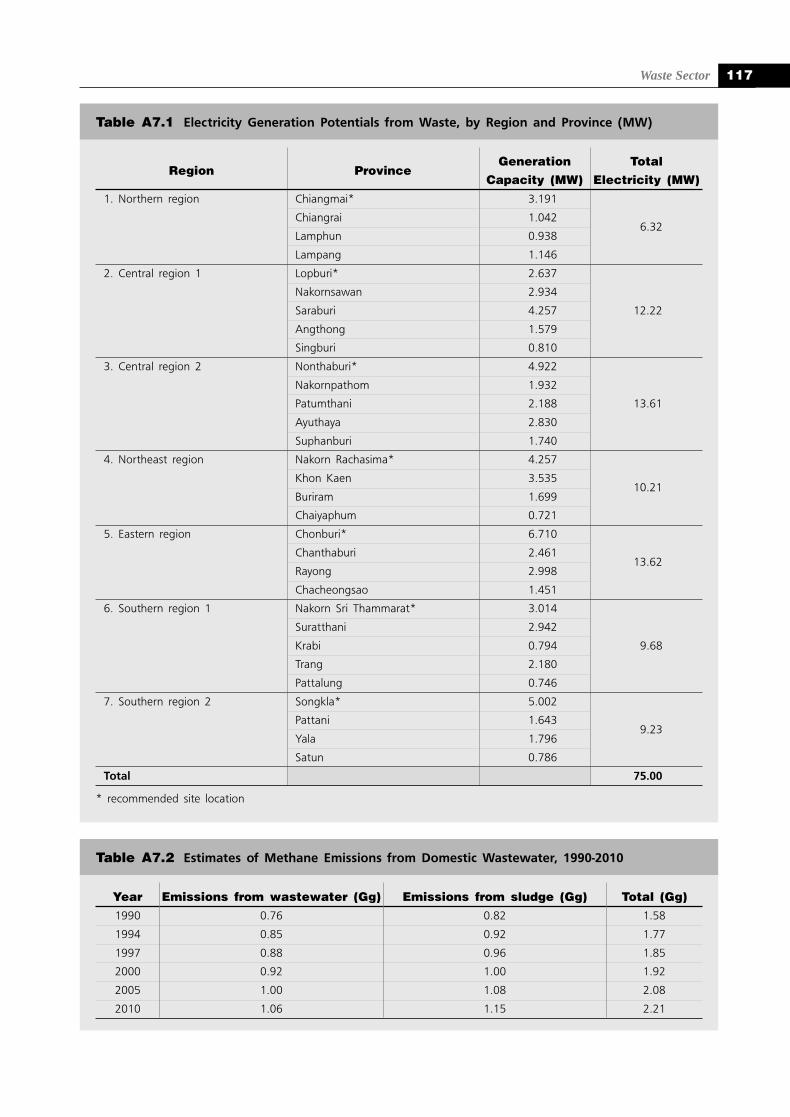
Waste Sector 117
Year Emissions from wastewater (Gg) Emissions from sludge (Gg) Total (Gg)1990 0.76 0.82 1.58
1994 0.85 0.92 1.77
1997 0.88 0.96 1.85
2000 0.92 1.00 1.92
2005 1.00 1.08 2.08
2010 1.06 1.15 2.21
Table A7.2 Estimates of Methane Emissions from Domestic Wastewater, 1990-2010
Table A7.1 Electricity Generation Potentials from Waste, by Region and Province (MW)
Region ProvinceGeneration Total
Capacity (MW) Electricity (MW)
1. Northern region Chiangmai* 3.191
Chiangrai 1.0426.32
Lamphun 0.938
Lampang 1.146
2. Central region 1 Lopburi* 2.637
Nakornsawan 2.934
Saraburi 4.257 12.22
Angthong 1.579
Singburi 0.810
3. Central region 2 Nonthaburi* 4.922
Nakornpathom 1.932
Patumthani 2.188 13.61
Ayuthaya 2.830
Suphanburi 1.740
4. Northeast region Nakorn Rachasima* 4.257
Khon Kaen 3.53510.21
Buriram 1.699
Chaiyaphum 0.721
5. Eastern region Chonburi* 6.710
Chanthaburi 2.46113.62
Rayong 2.998
Chacheongsao 1.451
6. Southern region 1 Nakorn Sri Thammarat* 3.014
Suratthani 2.942
Krabi 0.794 9.68
Trang 2.180
Pattalung 0.746
7. Southern region 2 Songkla* 5.002
Pattani 1.6439.23
Yala 1.796
Satun 0.786
Total 75.00
* recommended site location
Thailand’s National Greenhouse Gas Inventory 1994118
THAILAND’S CLIMATE CHANGE COMMITTEE
1. Permanent Secretary, Ministry of Science, Technology and Environment (Chairman)
2. Representative of Ministry of Agriculture and Cooperatives
3. Representative of Ministry of Interior
4. Representative of Ministry of Industry
5. Representative of Ministry of Transport and Communications
6. Representative of Ministry of Public Health
7. Representative of Office of National Economic and Social Development Board
8. Representative of National Energy Policy Office
9. Representative of Office of the Council of State
10. Director General, Department Treaties and Legal Affairs
11. Director General, Department of International Organizations
12. Director General, Department of Technical and Economic Cooperation
13. Director General, The Meteorological Department
14. Director General, Pollution Control Department
15. Director General, Department of Environmental Quality Promotion
16. Director General, Department of Energy Development and Promotion
17. Secretary General, Office of Environmental Policy and Planning
18. Representative of Bangkok Metropolitan Administration
19. Representative of Chulabhorn Research Institute
20. Representative of The Federation of Thai Industries
21. Representative of Thai Chamber of Commerce
22. President, Thailand Environment Institute
23. Director, Energy Research Institute, Chulalongkorn University
24. Mr. Suphavit Piampongsant
25. Professor Dr. Prida Wibulsawas
26. Deputy Secretary General, Office of Environmental Policy and Planning (Secretary)
27. Director, International Environmental Affairs Division, Office of Environmental Policy and Planning(Assistant secretary)
28. Director, Air Quality and Noise Management Division, Pollution Control Department, (Assistantsecretary)