Greenhouse Gas Inventory 2014 Reporting Year
25
Prepared by Jerome Conraud, ing., Energy Manager Facilities Management & Ancillary Services – Utilities & Energy Management Greenhouse Gas Inventory 2014 Reporting Year 2015-11-26
Transcript of Greenhouse Gas Inventory 2014 Reporting Year

Prepared by Jerome Conraud, ing., Energy Manager
Facilities Management & Ancillary Services – Utilities & Energy Management
Greenhouse Gas Inventory 2014 Reporting Year 2015-11-26


i
McGill University – 2014 Greenhouse Gas Emissions Inventory
Greenhouse Emissions per Activity
Scope Activity Activity
Level
GHG Emissions (t CO2e)
Scope 1 Direct Emissions
Stationary combustion
Natural gas 18,593,062 m³ 35,141 59%
Propane 14,494 L 25 < 0.1%
Heating oil 104,106 L 285 0.5%
Diesel 45,252 L 126 0.2%
Gasoline 546 L 1 < 0.1%
Refrigerants[1] 124 kg 162 0.3%
McGill-owned fleet of vehicles
Diesel 12,426 L 37 0.1%
Gasoline 86,201 L 203 0.3%
Ethanol 120 L 0 < 0.1%
Agriculture
Livestock 8,175 heads 5,848 10%
Fertilizers 33 tonnes 67 0.1%
Sub Total – Scope 1 Emissions 41,896 71%
Scope 2 Indirect Emissions
Purchased energy
Electricity[2] 182,317,239 kWh 441 0.7%
Steam 10,053,500 lb 912 1.5%
Sub Total – Scope 2 Emissions 1,353 2%
Scope 3 Other Emissions
Commuting
Faculty & staff 10,755 ppl. 4,130 7%
Students 30,082 ppl. 2,181 4%
Directly-financed air travel[3] 74,798,212 km-pssngr. 9,028 15%
Solid waste
Domestic 2,798 tonnes - 59 -0.1%
CRD 5,155 tonnes 171 0.3%
Hazardous 142 tonnes -250 -0.4%
Water supply & treatment 2,243,612 m³ 489 0.8%
Third-party fleet[6] 66,114 L 199 0.3%
Sub Total – Scope 3 Emissions 15,888 27%
Total Downtown, Macdonald, Bellairs, and Gault (Scope 1, 2, and 3[7]) 59,137 100% Table 1 - Greenhouse Inventory per Activity, Reporting Year 2014

ii
Equivalent in Emissions from Cars and Carbon Sequestered by Tree Seedlings
Scope Emissions (t CO2 e)
Equivalent in cars [6] (annual emissions)
Acres of forest [7]
1 41,896 8,800 34,300
2 1,353 300 1,100
3 15,888 3,300 13,000
Total 59,137 12,400 48,400 Table 2 - Greenhouse Gas Emissions per Scope and Comparables
Notes:
[1] Refrigerants for building HVAC systems only.
[2] Data for purchased electricity comes from the 2013-2014 report to the MESRS.
[3] Data includes travels for students on university business; data does not include study abroad travels.
[4] Data for the Macdonald Shuttle.
[5] Scope 3 emissions limited to those emissions listed in this table and only the Downtown and
Macdonald campuses.
[6] Equivalent in annual emissions from passenger vehicles from US EPA’s Greenhouse Gas Equivalencies
Calculator.
[7] Equivalent amount of CO2 captured by acres of forest, from US EPA’s Greenhouse Gas Equivalencies
Calculator.

iii
Contents Executive Summary ....................................................................................................................................... 1
Reductions Since 1990 .................................................................................................................................. 1
System Boundary .......................................................................................................................................... 2
Academic Units ......................................................................................................................................... 2
Self-Funded Units ...................................................................................................................................... 2
External Entities ........................................................................................................................................ 2
Methodology ................................................................................................................................................. 3
Existing Reporting Schemes ...................................................................................................................... 3
Data Collection .......................................................................................................................................... 3
Emission Factors ....................................................................................................................................... 5
Limitations ................................................................................................................................................ 7
Data ............................................................................................................................................................... 9
Emissions per Activity ............................................................................................................................... 9
Greenhouse Gas Equivalencies ............................................................................................................... 10
Appendix A – Emission Factors ................................................................................................................... 12
Appendix B – Greenhouse Gas Emissions per Fuel ..................................................................................... 17

1
Executive Summary McGill University manages a stock of buildings of over 600,000 m2 which are on average fifty years of age
and older. A leader in education and research, McGill is characterized by very research-intensive activities,
a travelling population, and high energy intensity.
In 2014 McGill emitted 59,137 tonnes of CO2e. This is the equivalent emissions from 12,400 cars in one
year. This is also 16 times the annual carbon sequestration potential of McGill’s forests (Gault Nature
Reserve and Morgan Arboretum). Table 3 shows the relative change in greenhouse gas emissions
between 2013 and 2014. The main differences are due to: a decrease in agricultural activities, an increase
in steam consumption in the Ludmer Building, changes in emission factors used to calculate emissions for
water supply & treatment and for electricity consumption at the Bellairs Research Institute in Barbados,
as well as the inclusion of activities previously left out of the inventory. Also since January 2015, McGill
has been paying emission rights for stationary combustion to the Québec cap and trade system which
represent more than $500,000 per year.
Scope 2014 Emissions
(t CO2 e) 2013 Emissions
(t CO2 e) Change
(%)
1 41,896 42,966 -2%
2 1,353 798 +70%
3 15,888 18,317 -13%
Total 59,137 62,080 -5% Table 3 - Change in Emissions between 2013 and 2014
Reductions Since 1990 2013 was McGill’s first attempt at capturing as many emission sources as possible such as livestock and
manure management, domestic waste disposal or travel emissions. However, emissions related to space
heating and electricity usage on campus have been accounted for decades and are now 25% below 1990
levels, as illustrated in Table 4. Energy conservation projects (-26% in energy use per square foot) and a
migration toward cleaner energy sources (-29% in emissions per unit of energy) are the main factors
accounting for the change, in spite of campus growth (+44% square feet). Just for FY13-14, McGill’s efforts
have had the equivalent impact of taking 2,500 cars off the road or protecting 9,800 acres of forest land,
i.e. 3 times the area of McGill’s forests. The University is now setting itself ever more ambitious targets
with the upcoming 2016-2020 Energy Management Plan and other Vision 2020 actions under
development.
Emissions 1990 FY13-14 Change
Absolute (t CO2e)
49,400 37,415 -25%
Per area (t CO2e/m²)
90 47 -48%
Per unit of energy (t CO2e/GJ)
38 28 -29%
Table 4 - Changes in Emissions between 1990 and FY13-14

2
System Boundary This inventory covers, as much as possible, all assets owned by McGill University including:
- McGill’s main downtown and Macdonald Campuses, both located on the Island of Montreal, QC;
- The Gault Nature Reserve located in Mont-Saint-Hilaire, QC;
- And the Bellairs Research Institute located in Holetown, Barbados.
The University comprises different entities broken down into two categories: academic units and self-
funded units.
Academic Units
Academic units include:
- All the faculties, schools and research centres;
- Libraries;
- All other administrative units including University Services.
Self-Funded Units
Self-funded units are thus called because they are not funded by le Ministère de l’Enseignement supérieur
et de la Recherche du Québec and should, therefore, be self-sufficient. These units include:
- Student unions (the SSMU, the PGSS, MCSS, MACES);
- Student Services;
- Student Housing and Hospitality Services;
- Faculty Clubs;
- Athletics (McGill Athletics and Macdonald Campus Athletics);
- Macdonald Campus Housing;
- Ancillary Services (the Bookstore);
- The Montreal Neurological Institute (which co-manages the Neuro with the McGill University
Health Centre).
External Entities
McGill supplies energy in part or in whole to several buildings owned or used by external entities (see list
below). The emissions from these external entities are excluded from McGill’s inventory.
- McGill University Health Centre (which co-owns the Neuro);
- The Canadian Aviation Heritage Centre.

3
Methodology The intent of McGill is to give as thorough as possible an account of its impact on climate change, and
therefore, the report includes all scope 1 and scope 2 emissions, as well as some scope 3 emissions1.
Emission accounting is based on the “emission factor” method except for emissions related to staff and
student commuting.
Existing Reporting Schemes
The University must report on most scope 1 emissions and some scope 2 emissions to the following
reporting schemes:
- Mandatory reporting to Natural Resources Canada’s National Greenhouse Gas Inventory: scope
1 emissions from stationary combustion, organization-owned vehicles, and refrigerants regulated
by the Kyoto Protocol.
- Mandatory reporting to Québec’s cap and trade system (SPEDE managed by the MDDELCC2
within the frame of the Western Climate Initiative): scope 1 emissions from stationary
combustion, organization-owned vehicles, and refrigerants regulated by the Kyoto Protocol.
- Mandatory reporting to the City of Montreal’s airborne contaminant inventory: scope 1
emissions from stationary combustion.
- Voluntary reporting to AASHE3 STARS: all scopes, all activities.
- Mandatory reporting to Québec’s MESR4: energy use, scope 1 emissions from stationary
combustion and scope 2 emissions from purchased energy.
Data Collection
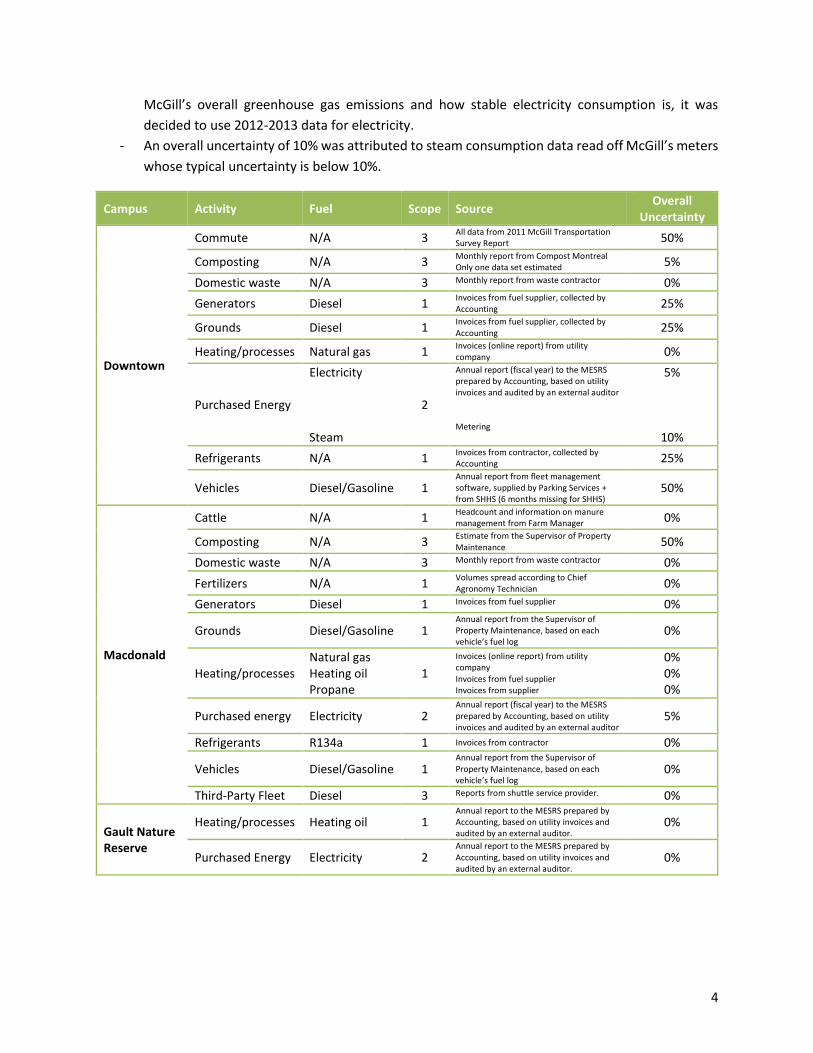
The table below lists the sources for all the data used in this report as well as the overall uncertainty
associated with each set of data. Note that uncertainty of 0% means that the data set is 100% reliable
and backed-up with invoices; a 100% uncertainty means there is no estimate whatsoever for the activity.
Data is broken down into activities, fuels, and emission scopes. Notes on overall uncertainty of data:
- An overall uncertainty of 50% was attributed to any data set coming from a survey or an estimate
made by a professional.
- An overall uncertainty of 25% was attributed to data sets backed up with invoices made available
by Accounting on the premise that Accounting staff might miss some invoices.
- An overall uncertainty of 5% was attributed to electricity as the data available is for fiscal year
2012-2013 whereas this report is for calendar year 2013. Given the low impact of electricity on
1 Please refer to the Greenhouse Gas Protocol for a definition of emission scopes. 2 Le Ministère du Développement durable, de l’Environnement et de la Lutte contre les changements climatiques 3 The Association for the Advancement of Sustainability in Higher Education 4 Le Ministère de l’Enseignement supérieur et de la Recherche du Québec
4
McGill’s overall greenhouse gas emissions and how stable electricity consumption is, it was
decided to use 2012-2013 data for electricity.
- An overall uncertainty of 10% was attributed to steam consumption data read off McGill’s meters
whose typical uncertainty is below 10%.
Campus Activity Fuel Scope Source Overall
Uncertainty
Downtown
Commute N/A 3 All data from 2011 McGill Transportation Survey Report 50%
Composting N/A 3 Monthly report from Compost Montreal Only one data set estimated 5%
Domestic waste N/A 3 Monthly report from waste contractor 0%
Generators Diesel 1 Invoices from fuel supplier, collected by Accounting 25%
Grounds Diesel 1 Invoices from fuel supplier, collected by Accounting 25%
Heating/processes Natural gas 1 Invoices (online report) from utility company 0%
Purchased Energy
Electricity Steam
2
Annual report (fiscal year) to the MESRS prepared by Accounting, based on utility invoices and audited by an external auditor Metering
5%
10%
Refrigerants N/A 1 Invoices from contractor, collected by Accounting 25%
Vehicles Diesel/Gasoline 1 Annual report from fleet management software, supplied by Parking Services + from SHHS (6 months missing for SHHS)
50%
Macdonald
Cattle N/A 1 Headcount and information on manure management from Farm Manager 0%
Composting N/A 3 Estimate from the Supervisor of Property Maintenance 50%
Domestic waste N/A 3 Monthly report from waste contractor 0%
Fertilizers N/A 1 Volumes spread according to Chief Agronomy Technician 0%
Generators Diesel 1 Invoices from fuel supplier 0%
Grounds Diesel/Gasoline 1 Annual report from the Supervisor of Property Maintenance, based on each vehicle’s fuel log
0%
Heating/processes Natural gas Heating oil Propane
1
Invoices (online report) from utility company Invoices from fuel supplier Invoices from supplier
0% 0% 0%
Purchased energy Electricity 2 Annual report (fiscal year) to the MESRS prepared by Accounting, based on utility invoices and audited by an external auditor
5%
Refrigerants R134a 1 Invoices from contractor 0%
Vehicles Diesel/Gasoline 1 Annual report from the Supervisor of Property Maintenance, based on each vehicle’s fuel log
0%
Third-Party Fleet Diesel 3 Reports from shuttle service provider. 0%
Gault Nature Reserve
Heating/processes Heating oil 1 Annual report to the MESRS prepared by Accounting, based on utility invoices and audited by an external auditor.
0%
Purchased Energy Electricity 2 Annual report to the MESRS prepared by Accounting, based on utility invoices and audited by an external auditor.
0%

5
Campus Activity Fuel Scope Source Overall
Uncertainty
Bellairs Research Institute
Purchased Energy
Electricity 2
Annual report to the MESRS prepared by Accounting, based on utility invoices and audited by an external auditor. 0%
University
Air Travel Kerosene 3 Report from McGill’s Travel Helpdesk based on re-imbursement requests 25%
CRD waste N/A 3 Estimate from Architect, Design Services 50%
Hazardous Waste
N/A 3 Annual report (fiscal year) from Hazardous Waste Management. Only the largest items are included..
50%
Water N/A 3 Surveys water-consuming equipment on the Downtown and Macdonald campuses 50%
Table 5 - Data Sources and Uncertainty
Emission Factors
Emission factors used in this report come from the following main organizations: Le Ministère du
Développement durable, de l’Environnement et de la Lutte contre les changements climatiques du Québec
(MDDELCC), the Intergovernmental Panel on Climate Change (IPCC), the US Environmental Protection
Agency (US EPA), Natural Resources Canada (NRCan), the Ministry of Environment of British Columbia,
the Government of Barbados, and McGill. For a detailed list of emission factors with their units, refer to
Appendix A – Emission Factors. The tables below list the sources of the main emission factors used for
the 2014 inventory.
Fuel Organization Source Specifics
Diesel (Stationary Combustion)
MDDELCC
LRQ Q-2, r. 15, Tableau 1-3, Diesel
Propane LRQ Q-2, r. 15, Tableau 1-3, Propane - Autres secteurs
Heating Oil #2 LRQ Q-2, r. 15, Tableau 1-3, Mazout léger - Foresterie, construction et secteurs commerciaux et institutionnels
Natural Gas LRQ Q-2, r. 15, Tableau 1-4 & Tableau 1-7, Secteurs résidentiels etc.
Gasoline (Transportation) LRQ Q-2, r. 15, Tableau 27-1, Véhicule à essence
Diesel (Transportation) LRQ Q-2, r. 15, Tableau 27-1, Véhicule au diesel
Table 6 - Emission Factor Source, Fossil Fuels
Fuel Organization Source Specifics
Refrigerant R134a MDDELCC LRQ Q-2, r. 15, Annexe A.1, HFC-134a
Refrigerant R22 IPCC IPCC 4th Assessment Report, Table 2.14
Table 7 - Emission Factors Source, Refrigerants

6
Fuel Organization Source Specifics
Fertilizer 46-0-0
US EPA Emissions Factors & AP 42, Compilation of Air Pollutant Emission Factors, Ch. 14.1 Fertilizer 27-0-0
Fertilizer 3-16-20
Fertilizer 28-26-0
Livestock (Dairy Cows)
NRCan National Inventory Report 1990-2010, Annex 3
Livestock (Dairy Heifers)
Livestock (Calves)
Livestock (Market Hogs)
Livestock (Meat Chickens)
Livestock (Laying Hens)
Table 8 - Emission Factor Source, Agriculture
Fuel Organization Source Specifics
Electricity, Québec NRCan National Inventory Report 1990-2010, Annex 13, Table A13-6
Electricity, Barbados Barbados Govt Sustainable Energy Framework for Barbados, Final Report Vol 1, Jun 2010. From Table 2-24 in 2008
Steam McGill Calculated, assuming Royal Victoria Hospital steam distribution comparable to McGill's.
Table 9 - Emission Factor Source, Purchased Energy
Fuel Organization Source Specifics
Air Travel (Long Haul)
Environment BC 2013 BC Best Practices Methodology for Quantifying GHG Emissions, Table 11
Air Travel (Medium Haul)
Air Travel (Short Haul)
Commuting (Faculty & Staff) McGill
2011 McGill Transportation Survey Report, Data Extrapolated to Whole Year for Downtown Campus
Commuting (Students)
Table 10 - Emission Factor Source, Travels
Fuel Organization Source Specifics
Water (Supply)
McGill Fall 2014 ENVR 401 student project. Emission factors calculated from information gather from the City of Montreal, the City of Sainte-Anne-de-Bellevue, and Montreal Wastewater Treatment Plant. Water
(Treatment)
Table 11 - Emission Factor Source, Water Supply & Treatment

7
Fuel Organization Source Specifics
Domestic Waste Landfill
US EPA
Warm Reduction Model Emission Factor for Municipal Solid Waste, Landfill, US National Average
Domestic Waste Recycling, Glass - Metal – Plastic
Warm Reduction Model Emission Factor for Mixed Recyclables, Landfilling – US National Average & Recycling
Domestic Waste Recycling, Paper – Cardboard
Warm Reduction Model Emission Factor for Mixed Papers (Mainly from Offices), Landfilling – US National Average & Recycling
Domestic Waste Composting
Warm Reduction Model Emission Factor for Mixed Organics, Landfilling – US National Average & Recycling
CRD Waste Landfill
Warm Reduction Model Emission Factor for Concrete, Landfilling – US National Average
CRD Waste Recycling
Warm Reduction Model Emission Factor for Concrete, Landfilling – US National Average & Recycling
Hazardous Waste E-waste
Warm Reduction Model Emission Factor for Personal Computers, Recycling
Hazardous Waste Scrap Metal
Warm Reduction Model Emission Factor for Mixed Metals, Recycling
Hazardous Waste Decayed Radioactivity
Warm Reduction Model Emission Factor for Municipal Solid Waste, Landfill, US National Average
Hazardous Waste Biomedical, Non Anatomical NRCan
US EPA
Travel Emission Factor from US EPA Emission Factors for Greenhouse Gas Inventories, Table 8, Medium- to Heavy-Duty Vehicles (in tCO2e/short ton-mi) Combustion Emission Factors from NRCan Waste GHG Calculator assuming a mix of 90% mixed plastics, 9% mixed paper and 1% mixed glass, distance to landfill set to 0 km, no recovery from fumes.
Hazardous Waste Biomedical, Anatomical
Travel Emission Factor from US EPA Emission Factors for Greenhouse Gas Inventories, Table 8, Medium- to Heavy-Duty Vehicles (in tCO2e/short ton-mi) Combustion Emission Factors from NRCan Waste GHG Calculator assuming organic waste to be equivalent to “food scrap”, distance to landfill set to 0km, no recovery from fumes.
Table 12 - Emission Factor and Source, Solid Waste
Limitations
US average emission factors were used for waste management because factors are not available yet for
the Greater Montreal Area. An Applied Student Research has been proposed to students enrolled in
ENVR-401 this fall with the goal to determine emission factors that would better represent the context of
the Greater Montreal and McGill.
Last year’s report used UK’s DEFRA emission factors for water supply and treatment as no other factor
were available for North America. In Fall 2014, a group of students enrolled in ENVR401 calculated specific
factors for the Montreal downtown and Macdonald campuses. These factors are used in this year’s report
and are much lower than DEFRA’s.
No emission factor is applicable to the disposal of most type of hazardous waste (e.g. fluorescent tubes,
alkaline batteries, etc.) A project will be proposed for students to investigate emissions factors based on
annual activity reports from Hazardous Waste Management.
Additionally, the following activities are known to be missing from the 2013 inventory:

8
Activity Category Scope Unit Plan
Travel, university sport teams
Directly-financed air travel, rail travel
3 McGill Athletics and Macdonald Athletics
Seek cooperation of Athletics
Rail travel Directly-financed, rail travel
3 All units
Procurements working on better reporting from travel management company
Car rentals Directly-financed, car rentals
3 All units Seek cooperation of the Travel Desk
Business trips with staff vehicles
Directly-financed travel, personal vehicles
3 All units Seek cooperation of the Travel Desk
Refrigerants, arenas
Refrigerants 1 Building Operations, McGill Athletics, and Macdonald Athletics
Seek cooperation of Building Operations
Various (refrigerants, commute, waste, vehicles, etc.)
Various 1,3 Gault Nature Reserve and Bellairs Research Institute
N/A. Negligible amounts.
Table 13- Missing Data

9
Data Refer to Appendix B – Greenhouse Gas Emissions per for a full list of activities, activity levels, and
emissions. The table below shows the emissions for all units and all campuses for calendar year 2013.
Emissions per Activity
Scope Activity Activity
Level
GHG Emissions (t CO2e)
Scope 1 Direct Emissions
Stationary combustion
Natural gas 18,593,062 m³ 35,141 59%
Propane 14,494 L 25 < 0.1%
Heating oil 104,106 L 285 0.5%
Diesel 45,252 L 126 0.2%
Gasoline 546 L 1 < 0.1%
Refrigerants[1] 124 kg 162 0.3%
McGill-owned fleet of vehicles
Diesel 12,426 L 37 0.1%
Gasoline 86,201 L 203 0.3%
Ethanol 120 L 0 < 0.1%
Agriculture
Livestock 8,175 heads 5,848 10%
Fertilizers 33 tonnes 67 0.1%
Sub Total – Scope 1 Emissions 41,896 71%
Scope 2 Indirect Emissions
Purchased energy
Electricity[2] 182,317,239 kWh 441 0.7%
Steam 10,053,500 lb 912 1.5%
Sub Total – Scope 2 Emissions 1,353 2%
Scope 3 Other Emissions
Commuting
Faculty & staff 10,755 ppl. 4,130 7%
Students 30,082 ppl. 2,181 4%
Directly-financed air travel[3] 74,798,212 km-pssngr. 9,028 15%
Solid waste
Domestic 2,798 tonnes - 59 -0.1%
CRD 5,155 tonnes 171 0.3%
Hazardous 142 tonnes -250 -0.4%
Water supply & treatment 2,243,612 m³ 489 0.8%
Third-party fleet[6] 66,114 L 199 0.3%
Sub Total – Scope 3 Emissions 15,888 27%
Total Downtown, Macdonald, Bellairs, and Gault (Scope 1, 2, and 3[7]) 59,137 100% Table 14 - Greenhouse Gas Emissions per Activity and Scope, 2013 Reporting Year

10
Greenhouse Gas Equivalencies
Scope Emissions (t CO2 e)
Equivalent in cars [6] (annual emissions)
Acres of forest [7]
1 41,896 8,800 34,300
2 1,353 300 1,100
3 15,888 3,300 13,000
Total 59,137 12,400 48,400 Table 15 - Greenhouse Gas Equivalencies
Notes:
[1] Refrigerants for building HVAC systems only.
[2] Data for purchased electricity comes from the 2013-2014 report to the MESRS.
[3] Data includes travels for students on university business; data does not include study abroad travels.
[4] Data for the Macdonald Shuttle.
[5] Scope 3 emissions limited to those emissions listed in this table and only the Downtown and
Macdonald campuses.
[6] Equivalent in annual emissions from passenger vehicles from US EPA’s Greenhouse Gas Equivalencies
Calculator.
[7] Equivalent amount of CO2 captured by acres of forest, from US EPA’s Greenhouse Gas Equivalencies
Calculator.

11
A-12
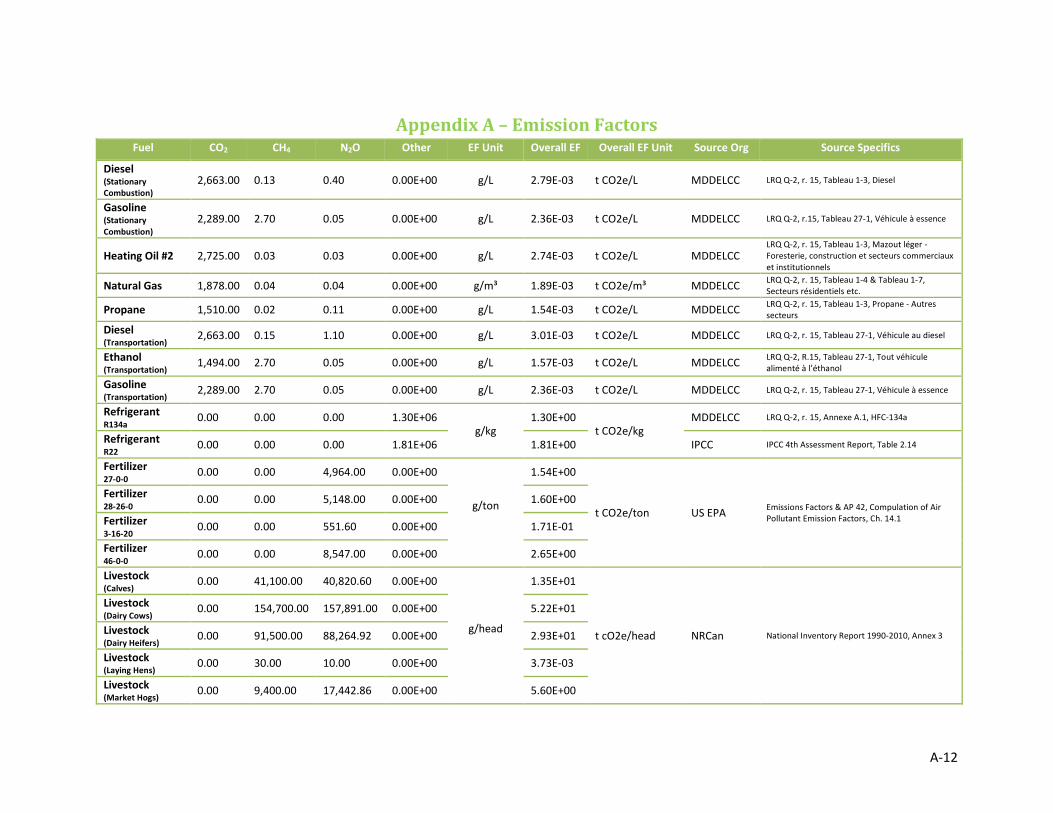
Appendix A – Emission Factors Fuel CO2 CH4 N2O Other EF Unit Overall EF Overall EF Unit Source Org Source Specifics
Diesel (Stationary Combustion)
2,663.00 0.13 0.40 0.00E+00 g/L 2.79E-03 t CO2e/L MDDELCC LRQ Q-2, r. 15, Tableau 1-3, Diesel
Gasoline (Stationary Combustion)
2,289.00 2.70 0.05 0.00E+00 g/L 2.36E-03 t CO2e/L MDDELCC LRQ Q-2, r.15, Tableau 27-1, Véhicule à essence
Heating Oil #2 2,725.00 0.03 0.03 0.00E+00 g/L 2.74E-03 t CO2e/L MDDELCC LRQ Q-2, r. 15, Tableau 1-3, Mazout léger - Foresterie, construction et secteurs commerciaux et institutionnels
Natural Gas 1,878.00 0.04 0.04 0.00E+00 g/m³ 1.89E-03 t CO2e/m³ MDDELCC LRQ Q-2, r. 15, Tableau 1-4 & Tableau 1-7, Secteurs résidentiels etc.
Propane 1,510.00 0.02 0.11 0.00E+00 g/L 1.54E-03 t CO2e/L MDDELCC LRQ Q-2, r. 15, Tableau 1-3, Propane - Autres secteurs
Diesel (Transportation)
2,663.00 0.15 1.10 0.00E+00 g/L 3.01E-03 t CO2e/L MDDELCC LRQ Q-2, r. 15, Tableau 27-1, Véhicule au diesel
Ethanol (Transportation)
1,494.00 2.70 0.05 0.00E+00 g/L 1.57E-03 t CO2e/L MDDELCC LRQ Q-2, R.15, Tableau 27-1, Tout véhicule alimenté à l’éthanol
Gasoline (Transportation)
2,289.00 2.70 0.05 0.00E+00 g/L 2.36E-03 t CO2e/L MDDELCC LRQ Q-2, r. 15, Tableau 27-1, Véhicule à essence
Refrigerant R134a
0.00 0.00 0.00 1.30E+06 g/kg
1.30E+00 t CO2e/kg
MDDELCC LRQ Q-2, r. 15, Annexe A.1, HFC-134a
Refrigerant
R22 0.00 0.00 0.00 1.81E+06 1.81E+00 IPCC IPCC 4th Assessment Report, Table 2.14
Fertilizer
27-0-0 0.00 0.00 4,964.00 0.00E+00
g/ton
1.54E+00
t CO2e/ton US EPA Emissions Factors & AP 42, Compulation of Air Pollutant Emission Factors, Ch. 14.1
Fertilizer 28-26-0
0.00 0.00 5,148.00 0.00E+00 1.60E+00
Fertilizer 3-16-20
0.00 0.00 551.60 0.00E+00 1.71E-01
Fertilizer 46-0-0
0.00 0.00 8,547.00 0.00E+00 2.65E+00
Livestock (Calves)
0.00 41,100.00 40,820.60 0.00E+00
g/head
1.35E+01
t cO2e/head NRCan National Inventory Report 1990-2010, Annex 3
Livestock (Dairy Cows)
0.00 154,700.00 157,891.00 0.00E+00 5.22E+01
Livestock (Dairy Heifers)
0.00 91,500.00 88,264.92 0.00E+00 2.93E+01
Livestock (Laying Hens)
0.00 30.00 10.00 0.00E+00 3.73E-03
Livestock (Market Hogs)
0.00 9,400.00 17,442.86 0.00E+00 5.60E+00

A-13
Livestock (Meat Chickens)
0.00 30.00 10.00 0.00E+00 3.73E-03
Electricity (Québec)
2.00 0.00 0.00 0.00E+00 g/kWh 2.04E-06 t CO2e/kWh NRCan National Inventory Report 1990-2010, Annex 13, Table A13-6
Electricity (Barbados)
0.00 0.00 0.00 8.79E+02 g/kWh 8.79E-04 t CO2e/kWh Gov of Barbados
Sustainable Energy Framework for Barbados
Steam 0.00 0.00 0.00 9.07E+01 g/lb 9.07E-05 t CO2e/lb McGill Calculated, assuming Royal Victoria Hospital steam distribution comparable to McGill's.
CRD Waste (Landfill)
0.00 0.00 0.00 4.41E+04
g/ton
4.41E-02
t CO2e/ton
US EPA
Warm Reduction Model Emission Factor for Concrete, Landfilling - National Average
CRD Waste (Recycling)
0.00 0.00 0.00 -1.10E+04
-1.10E-02 Warm Reduction Model Emission Factor for Concrete, Landfilling - National Average & Recycling
Domestic Waste (Mixed
Municipal Solid Waste, Landfill)
0.00 0.00 0.00 5.29E+05 5.29E-01 Warm Reduction Model Emission Factor for Municipal Solid Waste, Landfill, National Average
Domestic Waste (Recycling, Glass - Metal - Plastic)
0.00 0.00 0.00 -3.12E+06
-3.12E+00 Warm Reduction Model Emission Factor for Mixed Recyclables, Landfilling - National Average & Recycling
Domestic Waste (Recycling, Paper - Cardboard)
0.00 0.00 0.00 -3.96E+06
-3.96E+00 Warm Reduction Model Emission Factor for Mixed Papers (Mainly from Offices), Landfilling - National Average & Recycling
Domestic Waste (Composting, Food )
0.00 0.00 0.00 -1.54E+05
-1.54E-01 Warm Reduction Model Emission Factor for Mixed Organics, Landfilling - National Average & Recycling
Domestic Waste (Composting, Yard Trimmings)
0.00 0.00 0.00 -1.32E+05
-1.32E-01 Warm Reduction Model Emission Factor for Yard Trimmings, Composting
Hazardous Waste (E-waste)
0.00 0.00 0.00 -2.77E+06
-2.77E+00 Warm Reduction Model Emission Factor for Personal Computers, Recycling
Hazardous Waste (Scrap Metal)
0.00 0.00 0.00 -4.83E+06
-4.83E+00 Warm Reduction Model Emission Factor for Mixed Metals, Recycling
Hazardous Waste (Biomedical, Non Anatomical)
0.00 0.00 0.00 4.69E+05 4.69E-01 NRCan + US EPA
NRCan Waste GHG Calculator (90% plastic, 9% paper, 1% glass, distance to landfill 0km, incineration w no heat recovery) + US EPA Emission Factors for GHG Inventories, Table 8, Medium- and Heavy-duty Trucks, distance 1,000 km
Hazardous Waste
0.00 0.00 0.00 2.53E+05 2.53E-01 NRCan Waste GHG Calculator (food scrap, distance to landfill 0km, incineration w no heat recovery) + US EPA Emission Factors for GHG

A-14
(Biomedical, Anatomical)
Inventories, Table 8, Medium- and Heavy-duty Trucks, distance 1,000 km
A-15
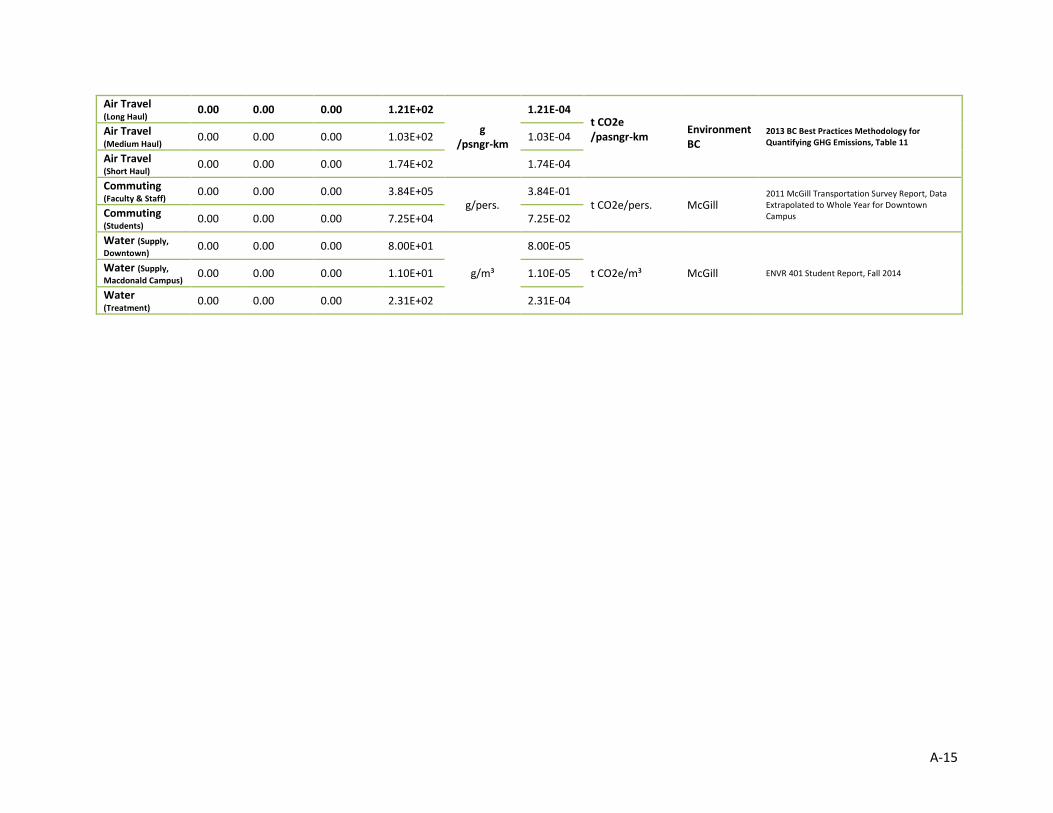
Air Travel (Long Haul)
0.00 0.00 0.00 1.21E+02
g /psngr-km
1.21E-04 t CO2e /pasngr-km
Environment BC
2013 BC Best Practices Methodology for Quantifying GHG Emissions, Table 11
Air Travel (Medium Haul)
0.00 0.00 0.00 1.03E+02 1.03E-04
Air Travel (Short Haul)
0.00 0.00 0.00 1.74E+02 1.74E-04
Commuting (Faculty & Staff)
0.00 0.00 0.00 3.84E+05 g/pers.
3.84E-01 t CO2e/pers. McGill
2011 McGill Transportation Survey Report, Data Extrapolated to Whole Year for Downtown Campus Commuting
(Students) 0.00 0.00 0.00 7.25E+04 7.25E-02
Water (Supply,
Downtown) 0.00 0.00 0.00 8.00E+01
g/m³
8.00E-05
t CO2e/m³ McGill ENVR 401 Student Report, Fall 2014 Water (Supply,
Macdonald Campus) 0.00 0.00 0.00 1.10E+01 1.10E-05
Water (Treatment)
0.00 0.00 0.00 2.31E+02 2.31E-04

A-16

B-17
Appendix B – Greenhouse Gas Emissions per Fuel
Campus Client Category Activity GHG Emissions
(t CO2e) Scope
Downtown Campus
Academic Buildings
On-Site Stationary Combustion Stationary Combustion, Natural Gas 12,232,650 m³ 23,120 1
Purchased Electricity Electricity (QC Grid) 129,770,028 kWh 265 2
Purchased Steam Steam 10,053,500 lb 912 2
Athletics On-Site Stationary Combustion Stationary Combustion, Natural Gas 1,413,804 m³ 2,672 1
Purchased Electricity Electricity (QC Grid) 8,242,079 kWh 17 2
Bookstore On-Site Stationary Combustion Stationary Combustion, Natural Gas 61,608 m³ 116 1
Purchased Electricity Electricity (QC Grid) 461,107 kWh 1 2
Faculty Club
On-Site Stationary Combustion Stationary Combustion, Natural Gas 15,547 m³ 29 1
Purchased Electricity Electricity (QC Grid) 346,590 kWh 1 2
Solid Waste Domestic Waste, Composting, Food 1 tons -0 3
MACES Purchased Electricity Electricity (QC Grid) 132,960 kWh 0 2
Student Housing & Hospitality Services
On-Site Stationary Combustion Stationary Combustion, Diesel 7,368 L 21 1
On-Site Stationary Combustion Stationary Combustion, Natural Gas 2,440,751 m³ 4,613 1
On-Site Transportation Transportation, Ethanol 120 L 0 1
On-Site Transportation Transportation, Gasoline 758 L 2 1
Purchased Electricity Electricity (QC Grid) 20,443,766 kWh 42 2
Solid Waste Domestic Waste, Composting, Food 67 tons -10 3
Solid Waste Domestic Waste, Municipal Solid Waste 309 tons 163 3
Solid Waste Domestic Waste, Recycling, Glass - Metal - Plastic 21 tons -66 3
Student Services On-Site Stationary Combustion Stationary Combustion, Natural Gas 5,953 m³ 11 1
Purchased Electricity Electricity (QC Grid) 1,199,286 kWh 2 2
The Montreal Neurological Institute On-Site Stationary Combustion Stationary Combustion, Natural Gas 137,621 m³ 260 1
Purchased Electricity Electricity (QC Grid) 3,384,100 kWh 7 2
The PGSS
On-Site Stationary Combustion Stationary Combustion, Natural Gas 43,177 m³ 82 1
Purchased Electricity Electricity (QC Grid) 244,370 kWh 0 2
Solid Waste Domestic Waste, Composting, Food 7 tons -1 3
The SSMU
On-Site Stationary Combustion Stationary Combustion, Natural Gas 238,576 m³ 451 1
Purchased Electricity Electricity (QC Grid) 1,729,476 kWh 4 2
Solid Waste Domestic Waste, Composting, Food 7 tons -1 3
All Units
On-Site Stationary Combustion Stationary Combustion, Diesel 13,606 L 38 1
On-Site Transportation Transportation, Diesel 6,279 L 19 1
On-Site Transportation Transportation, Gasoline 82,101 L 194 1
Faculty & Staff Commuting Commuting, Faculty & Staff 10,755 staff 4,130 3
Student Commuting Commuting, Students 30,082 students 2,181 3

B-18
Solid Waste Domestic Waste, Composting, Food 5 tons -1 3
Solid Waste Domestic Waste, Municipal Solid Waste 1,617 tons 855 3
Solid Waste Domestic Waste, Recycling, Glass - Metal - Plastic 330 tons -1,030 3
Water Supply & Treatment Water, Supply, Downtown 2,063,648 m³ 165 3
Water Supply & Treatment Water, Treatment 1,274,323 m³ 294 3
Macdonald Campus
Academic
On-Site Stationary Combustion Stationary Combustion, Heating Oil #2 79,956 L 219 1
On-Site Stationary Combustion Stationary Combustion, Natural Gas 1,699,661 m³ 3,212 1
On-Site Stationary Combustion Stationary Combustion, Propane 16,494 L 25 1
Agriculture Fertilizer 21-0-0 8 tons 9 1
Agriculture Fertilizer 27-0-0 5 tons 8 1
Agriculture Fertilizer 28-26-0 3 tons 5 1
Agriculture Fertilizer 46-0-0 17 tons 44 1
Agriculture Livestock, Calves 20 heads 270 1
Agriculture Livestock, Dairy Cows 75 heads 3,915 1
Agriculture Livestock, Dairy Heifers 50 heads 1,465 1
Agriculture Livestock, Laying Hens 3,200 heads 12 1
Agriculture Livestock, Market Hogs 30 heads 168 1
Agriculture Livestock, Meat Chickens 4,800 heads 18 1
Purchased Electricity Electricity (QC Grid) 144,555,520 kWh 29 2
Faculty Club (Macdonald Campus) On-Site Stationary Combustion Stationary Combustion, Natural Gas 5,700 m³ 11 1
Purchased Electricity Electricity (QC Grid) 1,200 kWh - 2
Macdonald Campus Housing On-Site Stationary Combustion Stationary Combustion, Natural Gas 6,746 m³ 13 1
Student Housing & Hospitality Services On-Site Stationary Combustion Stationary Combustion, Natural Gas 207,610 m³ 392 1
Purchased Electricity Electricity (QC Grid) 606,214 kWh 1 2
All Units
Refrigerants & Chemicals Refrigerant R134a 122 kg 159 1
Refrigerants & Chemicals Refrigerant R22 1 kg 2 1
On-Site Stationary Combustion Stationary Combustion, Diesel 24,278 L 68 1
On-Site Stationary Combustion Stationary Combustion, Gasoline 546 L 1 1
On-Site Stationary Combustion Stationary Combustion, Natural Gas 83,658 m³ 158 1
On-Site Transportation Transportation, Diesel 6,147 L 19 1
On-Site Transportation Transportation, Gasoline 3,342 L 8 1
Purchased Electricity Electricity (QC Grid) 759,955 kWh 2 2
Solid Waste Domestic Waste, Composting, Food 51 tons -8 3
Solid Waste Domestic Waste, Composting, Yard Trimmings) 11 tons -1 3
Solid Waste Domestic Waste, Municipal Solid Waste 329 tons 174 3
Solid Waste Domestic Waste, Recycling, Glass - Metal - Plastic 43 tons -134 3
Water Supply & Treatment Water, Supply, Macdonald 179,964 m³ 2 3
Water Supply & Treatment Water, Treatment 121,463 m³ 28 3
Bellairs Academic Purchased Electricity Electricity (Barbados Grid) 78,588 kWh 69 2
Academic On-Site Stationary Combustion Stationary Combustion, Heating Oil #2 24,150 L 66 1

B-19
Gault Nature Reserve
Purchased Electricity Electricity (QC Grid) 462,000 kWh 1 2
University All Units
Directly-Financed Air Travel Air Travel - Long Haul 72,322,246 passenger-km
8,751 3
Directly-Financed Air Travel Air Travel - Medium Haul 2,166,694 passenger-km
223 3
Directly-Financed Air Travel Air Travel - Short Haul 309,272 passenger-km
54 3
Solid Waste CRD Waste, Landfill 4,124 tons 182 3
Solid Waste CRD Waste, Recycling 1,031 tons -11 3
Solid Waste Hazardous Waste, Decayed Radioactivity 3 tonnes 2 3
Solid Waste Hazardous Waste, Biomedical, Anatomical 15 tonnes 4 3
Solid Waste Hazardous Waste, Biomedical, Non Anatomical 50 tonnes 23 3
Solid Waste Hazardous Waste, E-waste 41 tonnes -113 3
Solid Waste Hazardous Waste, Scrap Metal 34 tonnes -166 3
Mobile Combustion (Shuttle) Transportation, Diesel 66,114 L 199 3

B-20