Greenhouse Gas Emissions Inventory for the ... -...
19
Greenhouse Gas Emissions Inventory for the Greater Toronto and Hamilton Area Preliminary Draft for Review | December 2017 Please direct questions or comments to: Jimmy Lu, GHG Quantification Manager, The Atmospheric Fund | [email protected]
Transcript of Greenhouse Gas Emissions Inventory for the ... -...

Greenhouse Gas Emissions Inventory for the Greater Toronto and Hamilton Area
Preliminary Draft for Review | December 2017
Please direct questions or comments to:
Jimmy Lu, GHG Quantification Manager, The Atmospheric Fund | [email protected]
The Atmospheric Fund: Greenhouse Gas Emissions Inventory for the GTHA 1
Table of Contents
Introduction ................................................................................................................................ 2
Methodology .............................................................................................................................. 2
Buildings ................................................................................................................................. 2
Transportation ........................................................................................................................ 3
Waste ..................................................................................................................................... 3
Agriculture .............................................................................................................................. 4
Industrial ................................................................................................................................. 4
Results ....................................................................................................................................... 5
Regional Inventory Findings and Observations ....................................................................... 6
Emissions by Sector. .......................................................................................................... 6
Emissions by Municipality ................................................................................................... 6
Municipal Emissions by Sector ............................................................................................ 7
Municipal Emissions per Capita .......................................................................................... 8
Buildings ................................................................................................................................. 9
Provincial and National Comparisons ....................................................................................11
Future Projections .................................................................................................................12
Implications ...............................................................................................................................14
Conclusion ................................................................................................................................15
Works Cited ..............................................................................................................................17

The Atmospheric Fund: Greenhouse Gas Emissions Inventory for the GTHA 2
Introduction This preliminary inventory report provides information concerning greenhouse gas emissions in
the Greater Toronto and Hamilton Area. It is currently being reviewed by local stakeholders to
stimulate discussion and refine the report findings as needed. We welcome your comments or
feedback on this report. Please contact Jimmy Lu, GHG Quantification Manager, at [email protected].
The Greater Toronto and Hamilton Area (GTHA) is an interconnected metropolis of seven
million residents representing 51 percent of Ontario's population. It is also a region of significant
economic activity accounting for 57 percent of Ontario’s GDP (Statistics Canada, 2013). The
greenhouse gas (GHG) emissions of the region are considerable, forming approximately 29
percent of Ontario's overall GHG emissions. Major sources across the region include buildings,
transportation, industry, and waste management, although their relative importance varies
substantially among the numerous municipalities within the GTHA.
In order to understand and create strategies to reduce emissions throughout the region, TAF
has created an emissions inventory that captures the climate impacts of the region as a whole,
while comparing and contrasting contributions of different cities. We believe that creating and
sustaining a collective understanding of the GTHA’s emissions landscape will accelerate the
identification, prioritization and deployment of the solutions needed to meet our climate change
goals. This report will describe the methodology, data sources, and findings of the 2015 Greater
Toronto and Hamilton Area Greenhouse Gas Emissions Inventory. TAF intends to update this
inventory on a regular basis, creating a dynamic picture of regional emissions over time.
Methodology The GHG inventory for the GTHA presented in this report is for the year 2015 and separates the
emissions into five sectors: buildings, transportation, waste, agriculture, and industrial. The
inventory is further separated into six geographical areas; two municipalities (Toronto and
Hamilton) and four regional municipalities (Peel, York, Durham, and Halton).
In general, TAF has followed the guidelines in the Global Protocol for Community-Scale
Greenhouse Gas Emissions Inventories and attempted to use as many primary sources of data
as possible (ICLEI, WRI, C40, 2014). The inventory includes scope 1 and 2 emissions. In cases
where specific municipal level data was not available TAF has interpolated values from
provincial or federal data or extrapolated data from other local municipalities. This document will
briefly describe the methodology used to create this inventory and each section will list the
potential sources which were missed due to inadequate data. A more detailed methodology will
be made available with the final version of this report.
Buildings
The two main sources of emissions from buildings in the GTHA are natural gas and electricity
consumption. These sources are typically referred to as “Stationary Energy” but we refer to
them as “Buildings” to make the concept more relatable. Natural gas consumption data was

The Atmospheric Fund: Greenhouse Gas Emissions Inventory for the GTHA 3
obtained from Enbridge1, Union Gas, and the Region of Durham’s emissions inventory.
Electricity data was obtained from the Ontario Energy Board’s (OEB) Reporting and Record
Keeping Requirements (RRR), and local distribution companies (LDC). The RRR reports
electricity distribution by LDC with some LDCs providing electricity to more than one region. The
electricity consumption for some small municipalities in some regions were interpolated based
on a strong correlation between historic population and consumption values for the GTHA.
Electricity consumption could include sources which aren’t associated with buildings such as EV
charging, street lighting, or transit operations. Those sources were not disaggregated because
information is not consistently available across all regions.
Transportation
Transportation emissions are calculated from fuel sales data from Kent Group Limited. Both
gasoline and diesel fuel sales were provided. Kent Group Limited’s coverage is about 99% of
public gas stations in the GTHA. Because Ontario’s renewable fuel standard requires at least
5% of fuel sold to be from a renewable source it was assumed 5% of fuel sales were ethanol
and the appropriate emissions factor was applied. Fuel sales occurring in each municipality
were allocated to that municipality’s emissions inventory. TAF took this approach for simplicity
despite it being reasonable to attribute the emissions to the municipality in which the fuel is
consumed.
The fuel sales data may not account for railway, marine, or local aviation emissions. Freight
emissions where trailers fuel up at unsupervised stations are also not accounted for.
Waste
The methane commitment approach was used to calculate emissions from waste, meaning that
the estimated lifetime emissions of waste disposed in a given year is attributed entirely to that
year even though the emissions will occur over many years (ICLEI, WRI, C40, 2014).
Residential waste tonnage data was obtained from Resource Productivity and Recovery
Ontario. Residential waste composition data was obtained from the City of Toronto and
assumed to represent the GTHA.
Non-residential waste tonnage was assumed to be proportional to the residential tonnage based
on the ratio between residential and non-residential waste disposed of as reported for Ontario
by Statistics Canada (Statistics Canada, 2014). The non-residential waste composition was
provided by Torrie Smith Associates and Kelleher Environmental as supplemental data to their
report on Greenhouse Gas Emissions and the Ontario Waste Management Industry (Kelleher,
Christina, & Torrie, 2015).
Wastewater emissions are assumed to be zero since the methane in digester gas is biogenic
and either used to offset natural gas required by the plant for heating or processes or is flared. A
1 A request for natural gas data for Peel Region is currently being fulfilled by Enbridge and will be
included in the final report. The current value used is an estimate based on historic correlations of natural gas use with population in the GTHA.

The Atmospheric Fund: Greenhouse Gas Emissions Inventory for the GTHA 4
credit is not calculated for the digester gas used to offset natural gas use because the avoided
natural gas use is already excluded from the natural gas consumption values.
Agriculture
Agricultural emissions were estimated by proportioning Ontario’s agricultural emissions in
Canada’s NIR based on StatsCan’s agricultural census. Livestock emissions were proportioned
based on the head count of cattle and emissions from manure management and agriculture
soils were proportioned based on area of farm land.
Emissions from land use change or forestry activities were not calculated due to lack of data.
Industrial
Industrial emissions were taken from Ontario’s 2015 GHG emissions reporting by large emitters
(>25,000 tCO2eq/year) (Government of Ontario, 2017). It was assumed the emissions from
power generating facilities were already included in the electricity grid emissions and combined
heat and power (CHP) plants’ emissions were captured by the natural gas consumption data so
those two sources were excluded. By excluding these two sectors most of the remaining
emissions should be from industrial processes however, some electricity and natural gas
emissions may be double counted as the large emitter’s data reporting does not disaggregate
the sources of emissions.
The Atmospheric Fund: Greenhouse Gas Emissions Inventory for the GTHA 5
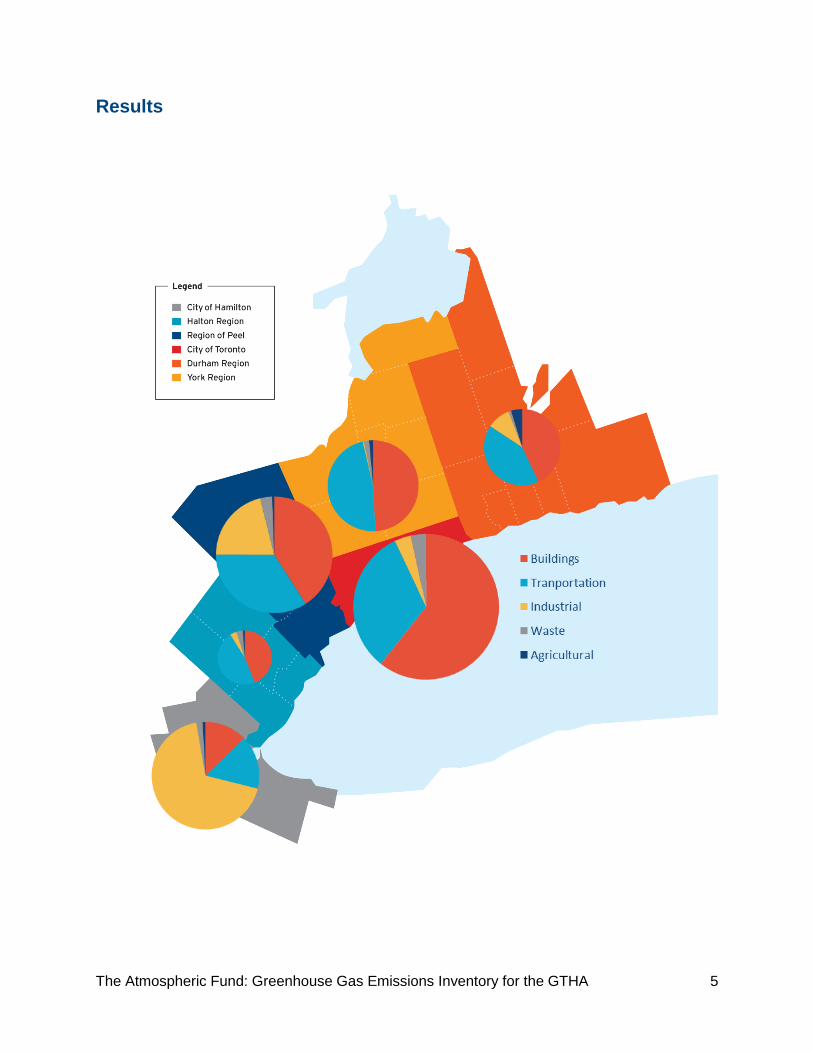
Results

The Atmospheric Fund: Greenhouse Gas Emissions Inventory for the GTHA 6
Regional Inventory Findings and Observations
Emissions by Sector
Overall, the GTHA’s emissions come primarily from buildings (44%), and transportation (34%).
The third largest emissions source is from industrial processes (19%). Waste and agricultural
emissions are relatively minor at 3% and 1%, respectively (figure 1). The results reinforce the
importance of the buildings and transportation sectors’ emissions. Industrial process emissions
are also significant, although their prominence is highly variable across different municipalities.
Figure 1 – Proportion of GTHA GHG Emissions by Sector
Emissions by Municipality
Figure 2 shows Toronto contributes the largest portion of the GTHA’s emissions (31%) as the
largest city. Peel Region is the second largest emissions contributor (23%) and Hamilton is the
GTHA’s third largest source (17%). York, Durham, and Halton Regions contribute 14%, 9%, and
6% of the GTHA’s emissions, respectively.
Buildings, 44%
Tranportation, 34%
Industrial, 19%
Waste, 3% Agricultural, 1%

The Atmospheric Fund: Greenhouse Gas Emissions Inventory for the GTHA 7
Figure 2 - Proportion of GTHA Emissions by Municipality
Municipal Emissions by Sector
While the major sources of emissions are consistent across all of the city-regions, the relative
importance of the sources varies considerably. For example, Toronto’s emissions are notably
dominated by the buildings sector (60%), whereas Hamilton’s emissions are dominated by
industrial activity (68%) (figure 3). Peel Region has the second highest emissions from industrial
activity after Hamilton. The Regions of York and Halton have the highest proportion of their
emissions from transportation at 47%. Durham Region has a markedly higher share of
agricultural emissions (5%) than the rest of the GTHA (1%).
Toronto, 31%
Peel region, 23%
Hamilton, 17%
York region, 14%
Durham region, 9%
Halton region, 6%

The Atmospheric Fund: Greenhouse Gas Emissions Inventory for the GTHA 8
Figure 3 - GHG Emissions by Sector and Municipality
Municipal Emissions per Capita
Hamilton has the highest per capita emissions in the GTHA due to significant industrial sector
emissions. Toronto, Halton Region, and York Region have noticeably lower than average
emissions per capita.
Figure 4 - Municipal Emissions per Capita
If the industrial emissions are excluded then Hamilton has the lowest emissions per capita, with
Toronto and Halton also having lower emissions per capita than the regional average (figure 5).
0
2,000,000
4,000,000
6,000,000
8,000,000
10,000,000
12,000,000
14,000,000
16,000,000
Toronto Peel region Hamilton York region Durham region Halton region
Buildings Tranportation Industrial Waste Agricultural
0
2
4
6
8
10
12
14
16
Toronto Peel region Hamilton York region Durham region Halton region Tota
l Em
issi
on
s (t
CO
2eq
pe
r C
apit
a)
Total Average

The Atmospheric Fund: Greenhouse Gas Emissions Inventory for the GTHA 9
The emissions per capita (excluding the industrial sector) range from 4.8 to 6.2 tCO2eq, a 29%
difference between the lowest and highest municipalities.
Figure 5 - GHG Emissions per Capita by Sector excluding Industrial Sector by Municipality
Buildings
It can be seen in figure 6 that buildings emissions in the GTHA are predominantly from natural
gas (87%), which is mainly used for space and water heating. Electricity emissions have seen a
decline since the phase out of coal-fired power generation in Ontario.
Figure 6 – Proportion of GTHA Building Emissions by Energy Type
0
1
2
3
4
5
6
7
Toronto Peel region York region Durham region Hamilton Halton region
Tota
l Em
issi
on
s e
xclu
din
g In
du
stri
al
(tC
O2e
q p
er
Cap
ita
Buildings Tranportation Waste Agricultural GTHA Average
Natural Gas 87%
Electricity 13%

The Atmospheric Fund: Greenhouse Gas Emissions Inventory for the GTHA 10
Hamilton and Halton Region have lower than GTHA average per capita emissions from natural
gas which factors into their overall lower than average per capita emissions (figure 7).
Hamilton’s natural gas emissions per capita is almost half of that of Toronto’s.
Figure 7 - Natural Gas Emissions per Capita by Municipality
Toronto has lower transportation emissions per capita than the GTHA average, while the
regional municipalities have higher than average transportation emissions per capita.
Figure 8 - Transportation Emissions per Capita by Municipality
Transportation emissions per capita in the GTHA have a strong negative correlation with
population density (the higher the density, the lower the emissions) (Statistics Canada, 2016)
(figure 9). While it is important to consider the role of confounding factors such as urban form,
transportation infrastructure, and local income levels that may also affect transportation
emissions, given the current analysis, the relationship between population density and
transportation emissions per capita is quite clear.
0.0
0.5
1.0
1.5
2.0
2.5
3.0
Toronto Peel region York region Durham region Hamilton Halton region
Nat
ura
l Gas
Em
issi
on
s (t
CO
2eq
p
er
Cap
ita)
GTHA Average
0.0
0.5
1.0
1.5
2.0
2.5
3.0
Toronto Peel region York region Durham region Hamilton Halton region
Tran
spo
rtat
ion
Em
issi
on
s (t
CO
2eq
pe
r C
apit
a)
GTHA Average

The Atmospheric Fund: Greenhouse Gas Emissions Inventory for the GTHA 11
Figure 9 - Population Density and Transportation Emissions per Capita
Durham region has the highest agricultural emissions and agricultural emissions per capita in
the GTHA although this sector is still a relatively low quantity of emissions.
Figure 10 - Agricultural Emissions per Capita by Municipality
Provincial and National Comparisons
The GTHA comprises 51% of Ontario’s population, generating 29% of Ontario’s total emissions
and 37.6% of Ontario’s emissions in the sectors examined in this GHG Inventory (Environment
and Climate Change Canada, 2017). The GTHA generates 6.6% of Canada’s total emissions
despite being 19% of the population and generating 21% of the GDP. However, a significant
amount of Canada’s GHG emissions are generated by sectors not included in municipal
emissions inventories, such as aviation, and thus municipal inventories aren’t fully comparable
in the Canadian context.
In comparison to other large municipalities across Canada, the GTHA is the largest emitter by
far. However, on a per capita basis the GTHA fares reasonably well. Comparisons are difficult
since many cities do not have updated emissions inventories and also use different
methodologies.
Toronto
Peel region
Hamilton
York region Durham region
Halton region
y = -0.0002x + 2.8 R² = 0.94
0.0
0.5
1.0
1.5
2.0
2.5
3.0
0 500 1,000 1,500 2,000 2,500 3,000 3,500 4,000 4,500 5,000
Tran
spo
rtat
ion
Em
issi
on
s p
er
Cap
ita
(tC
O2e
q/p
ers
on
)
Persons per km2
0.00
0.10
0.20
0.30
Toronto Peel region York region Durham region Hamilton Halton region
Agr
icu
ltu
ral
Emis
sio
ns
(tC
O2e
q p
er
Cap
ita)
GTHA Average

The Atmospheric Fund: Greenhouse Gas Emissions Inventory for the GTHA 12
Figure 11 - Total Emissions and Emissions per Capita by Canadian Municipality
Future Projections
The GTHA’s population is projected to increase by just over 3 million people (41.3%) between
2016 and 2041, creating significant impacts on the emissions of the region (Ministry of Finance,
2017). By using Ontario population projections, potential future emissions scenarios can be
broadly estimated. If we multiply emissions per capita by population projections in all sectors
except agricultural and industrial (which were assumed to remain constant for simplicity) we
could estimate the future proportion of emissions from each region. This would not be the
expected scenario but does demonstrate what might happen given no progress. Figure 12
demonstrates that Toronto’s emissions would grow by about 5 MtCO2eq by 2041 based on
estimated population growth. In figure 13, Peel, York, and Halton’s proportions of GTHA
emissions are estimated to grow while Hamilton’s shrinks and Toronto and Durham Regions
remain constant. Figure 14 shows the reduction of per capita emissions required to achieve a
50%2 reduction in total emissions by 2041. GTHA-wide per capita emissions need to be reduced
from 6.9 tCO2 per capita to 2.3 tCO2eq per capita by 2041 in order to see a 50% reduction in
total emissions.
2 This value was chosen based on the typical target of 80% reductions by 2050 compared to a 1990
baseline.
0
4
8
12
16
20
0 5
10 15 20 25 30 35 40 45 50
Emis
sio
ns
Pe
r C
apit
a (t
CO
2e
q/p
ers
on
)
Tota
l GH
G E
mis
sio
ns
(MtC
O2e
q)
Annual Emissions (MtCO2eq) Emissions Per Capita (tCO2eq/person)

The Atmospheric Fund: Greenhouse Gas Emissions Inventory for the GTHA 13
Figure 12 - Projected Total Emissions based on 2015 Per Capita Emissions by Municipality
Figure 13 - Percentage of GTHA Emissions in the Years 2015 and 2041
0
5,000,000
10,000,000
15,000,000
20,000,000
25,000,000
Toronto Peel region Hamilton York region Durham region Halton region
Tota
l Em
issi
on
s (t
CO
2e
q)
2015 Emissions 2041 Emissions
0%
5%
10%
15%
20%
25%
30%
35%
Toronto Peel region Hamilton York region Durham region Halton region
Percentage of GTHA Emissions (2015) Percentage of GTHA Emissions (2041)

The Atmospheric Fund: Greenhouse Gas Emissions Inventory for the GTHA 14
Figure 14 - 2015 Emissions per Capita Compared to 2041 Emissions per Capita with a 50% Reduction in Total Emissions
Implications The results from the regional inventory reinforce both existing knowledge as well as provide new
information to guide tactics for emissions reductions.
Buildings and transportation have long been known to be the two most significant sources of
emissions and this remains true. Significant thought, resources, and focus should remain
dedicated towards emissions reductions in these two areas.
Building emissions mainly come from the use of natural gas which is a much cheaper fuel per
unit of energy than electricity in Ontario. If deep reductions in the buildings sector are to be
realized they either need to focus on significantly reducing energy use for heating and hot water
and/or converting to cleaner fuels such as electricity or renewable natural gas.
Regarding opportunities for reducing transportation related GHG emissions, it is much cheaper
and lower emissions to power vehicles by electricity than gasoline (Plug 'N Drive, 2017).
Electrification of transportation is therefore a key priority for emission reductions across the
region. However, when considering electrification of both the buildings and transportation
sectors, careful planning is required to ensure the additional loads do not result in a significantly
higher electricity emissions factor. Based on the correlation between residential density and
transportation emissions, increasing density, building complete communities and improving
transit infrastructure can also lead to transportation emissions reduction at least on a per capita
basis. The provincial Greenbelt Plan and Growth Plan support this notion of increased density,
complete communities and building transit infrastructure (Government of Ontario, 2017;
Government of Ontario, 2017).
0
2
4
6
8
10
12
14
16
Toronto Peel region Hamilton York region Durham region Halton region
Emis
sio
ns
pe
r C
apit
a (t
CO
2eq
pe
r C
apit
a)
2015 Per Capita Emissions Per Capita Emissions to Achieve 50% reduction by 2041

The Atmospheric Fund: Greenhouse Gas Emissions Inventory for the GTHA 15
Industrial emissions are the third largest sector of emissions in the GTHA and are highly
concentrated in a few facilities. Therefore, targeted reduction strategies could be an effective
approach. Notably, Hamilton and Peel house industrial facilities which generate 88% of the
GTHA’s industrial emissions. The provincial cap and trade program should provide a growing
incentive for these industrial emitters to reduce emissions; however, there may also be potential
for targeted programs and partnerships with all levels of government to accelerate reductions in
industrial emissions.
Durham Region has the most agricultural emissions in the GTHA but agricultural emissions
remain a relatively small portion of total emissions. Harnessing the methane from agricultural
sources and using it to offset natural gas use may have significant potential to reduce
emissions. While the local emissions are relatively insignificant, a more in depth look at the
consumption emissions3 may provide data on how to reduce emissions associated with food
production and consumption.
When excluding the industrial sector, Hamilton and Toronto have the lowest emissions per
capita out of the municipalities in the GTHA. This seems to be the case since Hamilton has the
lowest building emissions per capita in the region and Toronto has the lowest transportation
emissions per capita. Further investigation into the contributing factors needs to be undertaken
so their applicability across the region and beyond can be assessed.
When comparing emissions per capita across major cities in Canada it can be seen that cities in
provinces with coal fired power plants (Calgary, Edmonton, and Halifax) have significantly
higher GHG emissions than those without. Some cities do not break down their emissions into
sectors or consistent sectors so further comparison on different metrics is difficult without
access to this type of data.
Conclusion By using a consistent methodology and by having the same year of data the 2015 GHG
Inventory for the GTHA has provided numerous insights into the region’s GHG emissions
previously not possible. The key takeaways are:
Buildings and transportation are the largest sources of emissions across the GTHA
Outside the City of Toronto, increasing population density, combined with sound urban
planning and investment in transit infrastructure, is critical to reducing transportation
emissions.
The entire region is growing very quickly, and achieving deep decarbonization in the
context of rapid growth will require major reductions in per capita emissions.
The industrial sector is a promising area to explore targeted emissions reduction
strategies;
3 The inventory undertaken by TAF is production-based. A consumption-based inventory is more complex
and considers the emissions from products and services used or expended within the jurisdiction (such as food consumed locally, but not necessarily produced locally).

The Atmospheric Fund: Greenhouse Gas Emissions Inventory for the GTHA 16
While the GTHA is a significant contributor to provincial and national GHG emissions, it
has below average emissions per capita compared to other major Canadian cities;
The benefits of the inventory can be increased by annual maintenance, increasing data
granularity, and applying temporal analysis lens in future research projects.
Overall, the analysis in this report helps provide a defined picture of the GTHA’s emissions
which are significant, varied, and poised for additional reductions.

The Atmospheric Fund: Greenhouse Gas Emissions Inventory for the GTHA 17
Works Cited Dodman, D. (2009, 4 2). URBAN DENSITY AND CLIMATE CHANGE. Retrieved 11 3, 2017,
from United Nations Climate Change Learning Partnership:
https://www.uncclearn.org/sites/default/files/inventory/unfpa14.pdf
Environment and Climate Change Canada. (2017). National Inventory Submissions 2017.
Retrieved 10 2017, from United Nations Framework Convention on Climate Change:
http://unfccc.int/national_reports/annex_i_ghg_inventories/national_inventories_submissi
ons/items/10116.php
Gately, C. K., Hutyra, L. R., & Wing, I. S. (2015, 3 13). Cities, traffic, and CO2: A multidecadal
assessment of trends, drivers, and scaling relationships. Retrieved 11 3, 2017, from
Proceedings of the National Academy of Sciences of the United States of America:
http://www.pnas.org/content/112/16/4999.abstract
Government of Ontario. (2017). Greenbelt Plan (2017). Retrieved 2017, from Ontario Ministry of
Municipal Affairs and Housing: http://www.mah.gov.on.ca/Page13783.aspx
Government of Ontario. (2017). Greenhouse gas emissions reporting by facility. Retrieved 2017,
from Ontario: https://www.ontario.ca/data/greenhouse-gas-emissions-reporting-facility
Government of Ontario. (2017). Growth Plan for the Greater Golden Horseshoe. Retrieved
2017, from Munistry of Municipal Affairs:
https://www.placestogrow.ca/index.php?option=com_content&task=view&id=9
ICLEI, WRI, C40. (2014, December 8). The Global Protocol for Community-Scale Greenhouse
Gas Emissions Inventories (GPC). Retrieved 2016, from ICLEI - Local Governments for
Sustainability: http://www.iclei.org/activities/agendas/low-carbon-city/gpc.html
Kelleher, M., Christina, S., & Torrie, R. (2015, November). Greenhouse Gas Emissions and the
Ontario Waste Management Industry. Retrieved 2017, from Ontario Waste Management
Association: http://www.owma.org/articles/greenhouse-gas-emissions-and-the-ontario-
waste-management-industry
Ministry of Finance. (2017). Ontario Population Projections Update, 2016–2041. Retrieved
2017, from Ontario Ministry of Finance:
https://www.fin.gov.on.ca/en/economy/demographics/projections/table4.html
Plug 'N Drive. (2017). Benefits of Driving Electric. Retrieved 2017, from Plug 'N Drive:
http://plugndrive.ca/benefits-driving-electric
Statistics Canada. (2013). Gross domestic product (GDP) at basic prices, by census
metropolitan area (CMA). Retrieved 10 31, 2017, from Statistics Canada:
http://www5.statcan.gc.ca/cansim/a26?lang=eng&retrLang=eng&id=3810036&&pattern=
&stByVal=1&p1=1&p2=31&tabMode=dataTable&csid=

The Atmospheric Fund: Greenhouse Gas Emissions Inventory for the GTHA 18
Statistics Canada. (2014). Disposal of waste, by source, Canada, provinces and territories.
Retrieved 2017, from Statistics Canada:
http://www5.statcan.gc.ca/cansim/a26?lang=eng&id=1530041
Statistics Canada. (2015). Households and the environment survey, primary heating system,
Canada, provinces and census metropolitan areas (CMA). Retrieved 2017, from
Statistics Canada:
http://www5.statcan.gc.ca/cansim/a26?lang=eng&retrLang=eng&id=1530145&&pattern=
&stByVal=1&p1=1&p2=31&tabMode=dataTable&csid=
Statistics Canada. (2016). Population and Dwelling Count Highlight Tables, 2016 Census.
Retrieved 10 25, 2017, from Statistics Canada: http://www12.statcan.gc.ca/census-
recensement/2016/dp-pd/hlt-fst/pd-pl/Table.cfm?Lang=Eng&T=301&S=3&O=D