Greenhouse Gas Analysis Information by the Japan...
22
Greenhouse Gas Analysis Information Greenhouse Gas Analysis Information by the Japan Meteorological Agency by the Japan Meteorological Agency Takashi MAKI, Takashi MAKI, M. Ikegami, T. Fujita, T. M. Ikegami, T. Fujita, T. Hirahara Hirahara , K. Mori and Y. , K. Mori and Y. Tsutsumi Tsutsumi Japan Meteorological Agency Japan Meteorological Agency TransCom workshop Utrecht, The Netherlands 2-5 June, 2008
Transcript of Greenhouse Gas Analysis Information by the Japan...

Greenhouse Gas Analysis Information Greenhouse Gas Analysis Information by the Japan Meteorological Agencyby the Japan Meteorological Agency
Takashi MAKI,Takashi MAKI, M. Ikegami, T. Fujita, T. M. Ikegami, T. Fujita, T. HiraharaHirahara, K. Mori and Y. , K. Mori and Y. TsutsumiTsutsumi
Japan Meteorological AgencyJapan Meteorological Agency
TransCom workshop Utrecht, The Netherlands 2-5 June, 2008

OutlineOutline
11..BackgroundBackground22..Analysis method and dataAnalysis method and data33..Summary and resultsSummary and results44..Another topicAnother topic ((Transport modelTransport model developmentdevelopment))
TransCom workshop Utrecht, The Netherlands 2-5 June, 2008

BackgroundBackground
It was recommended in the strategy that observational data shoulIt was recommended in the strategy that observational data should d be integrated according to the International Global Atmospheric be integrated according to the International Global Atmospheric Chemistry Observations (IGACO) themeChemistry Observations (IGACO) theme..
TransCom workshop Utrecht, The Netherlands 2-5 June, 2008

Greenhouse Gas Analysis InformationGreenhouse Gas Analysis Information
JMA has a plan to provide this information regularly from 2009. JMA has a plan to provide this information regularly from 2009. TransCom workshop Utrecht, The Netherlands 2-5 June, 2008
Pre-subtracted tracer
predetermined tracer
Transport results
Transport results
CDTM
JRA-25
Observational Data
Inverse model
Products

Main features of the informationMain features of the information
TransCom workshop Utrecht, The Netherlands 2-5 June, 2008
We provide this basic information via web page, internet (ftp) and JMA’s regular publications.
# This product is provided as JMA’s product (not WDCGG’sproduct) for the present.
Provided Information CO2 concentrations, CO2 fluxes
Target user Scientist, policymaker and public
Time resolution monthly
Horizontal resolution 2.5 degree, 22 regions
Vertical resolution Surface (for the present)
Frequency Once a year

Main specification of analysis methodMain specification of analysis method
TransCom workshop Utrecht, The Netherlands 2-5 June, 2008
3 years for all tracers (pre-subtracted and predetermined)Tracer transport calculation
Turbulent, cumulus convection and shallow convectionVertical diffusionSemi-Lagrangian (horizontal) and box scheme (vertical)Transport schemeJRA-25 (1980–2004, Onogi et al., 2007) and JCDAS (2005–present) Meteorology32 layers (surface to 10 hPa)Vertical resolution2.5 degree x 2.5 degree (global)Horizontal resolution
Offline transport model (JMA-CDTM, Sasaki et al)Transport Model
Calculate from mismatch between observation and smoothed observationGive a large uncertainty at lack of observational data.
Data uncertaintyObservational data are selected by inversion (Maki et al., 2005)Data selection Standard gas scale (We adopt only sites traceable to the WMO scale)Site selectionRaw data submitted to WDCGG (NOAA/ESRL, JMA and other agency)Observational dataSame as TransCom 3 (Baker et al., 2006)Predetermined flux uncertainty
0 Predetermined flux for each region
Fossil fuel burning (CDIAC), Vegetation (CASA) and Ocean (Takahashi)Pre-subtracted tracer22 regions (same as TransCom 3)Horizontal resolution 1 monthTime resolutionFrom 1985 to 2007Analysis periodBayesian synthesis inversion (Baker et al., 2006)Analysis method

Observational dataObservational data1. We use monthly mean CO2 concentrations submitted 1. We use monthly mean CO2 concentrations submitted
to WDCGG (World Data Centre for Greenhouse to WDCGG (World Data Centre for Greenhouse Gases). Gases).
2. We select only sites in which the 2. We select only sites in which the standard gas scalestandard gas scale is is traceable to the traceable to the WMOWMO standard scale.standard scale.
3. We create a uniform data set by filling up lacking data 3. We create a uniform data set by filling up lacking data by interpolation or extrapolation (WMO, 2000), by interpolation or extrapolation (WMO, 2000), together with uncertainties calculated from standard together with uncertainties calculated from standard deviations of observational data.deviations of observational data.
4. For periods of no observation, we fill the gaps with the 4. For periods of no observation, we fill the gaps with the smoothed estimates smoothed estimates but give a large uncertaintybut give a large uncertainty for for ease in rejecting it from analysis.ease in rejecting it from analysis.
TransCom workshop Utrecht, The Netherlands 2-5 June, 2008
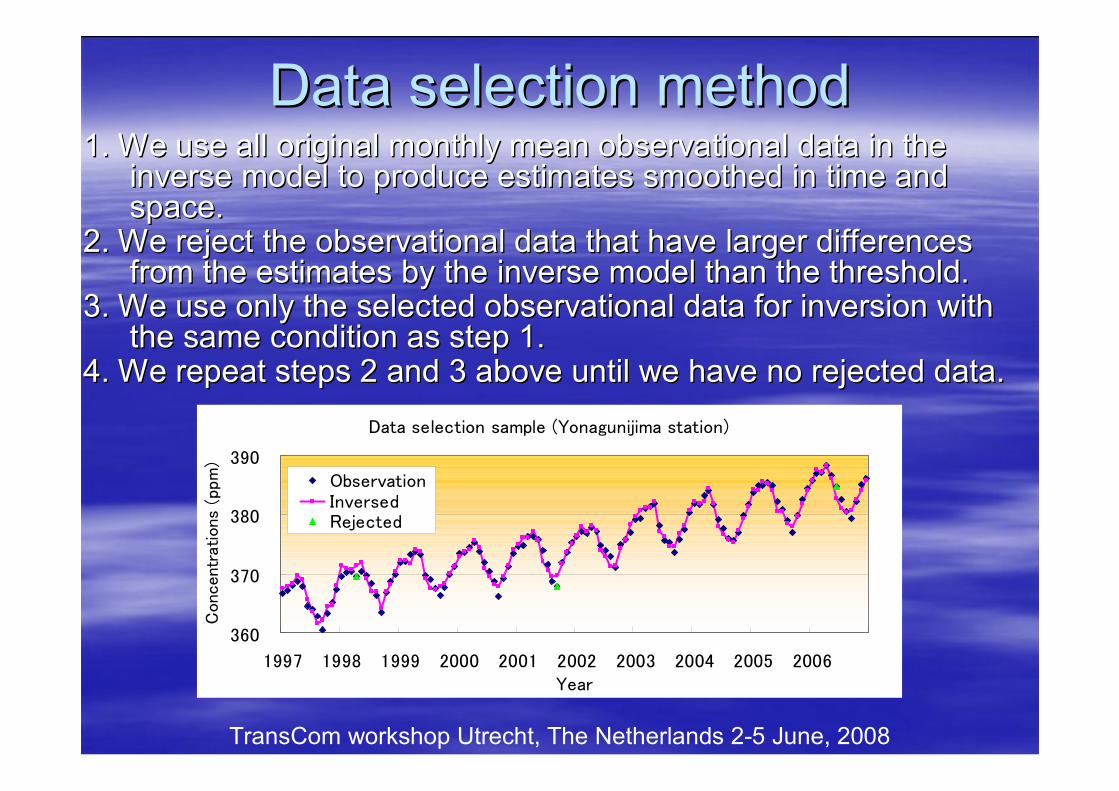
Data selection methodData selection method1. We use all original monthly mean observational data in the 1. We use all original monthly mean observational data in the
inverse model to produce estimates smoothed in time and inverse model to produce estimates smoothed in time and space.space.
2. We reject the observational data that have larger differences2. We reject the observational data that have larger differencesfrom the estimates by the inverse model than the threshold.from the estimates by the inverse model than the threshold.
3. We use only the selected observational data for inversion wit3. We use only the selected observational data for inversion with h the same condition as step 1.the same condition as step 1.
4. We repeat steps 2 and 3 above until we have no rejected data.4. We repeat steps 2 and 3 above until we have no rejected data.
TransCom workshop Utrecht, The Netherlands 2-5 June, 2008
Data selection sample (Yonagunijima station)
360
370
380
390
1997 1998 1999 2000 2001 2002 2003 2004 2005 2006Year
Concentr
ations
(ppm
)
ObservationInversedRejected

Observational dataObservational data
TransCom workshop Utrecht, The Netherlands 2-5 June, 2008
Present (NOAA/ESRL + JMA)Present (NOAA/ESRL + JMA) Early 2009 (planned)Early 2009 (planned)
Observational data availability rate from 1990 to 2006
# We make use of JMA ship observational data for our analysis. Available sites
0
20
40
60
80
100
120
1985 1987 1989 1991 1993 1995 1997 1999 2001 2003 2005
Year
num
ber
of s
ites
Present
Planned

Sample productSample product
TransCom workshop Utrecht, The Netherlands 2-5 June, 2008
Surface CO2 Surface CO2 concentrationsconcentrations
Global Carbon Global Carbon flux variabilityflux variability
Global Carbon Flux Variability
-3
-2
-1
0
1
2
3
1985 1987 1989 1991 1993 1995 1997 1999 2001 2003 2005
Year
GtC
/yr
Total Land
Total Ocean

Summary (1Summary (1stst part)part)JMA has a plan to provide Greenhouse Gas Analysis JMA has a plan to provide Greenhouse Gas Analysis
information from early 2009.information from early 2009.The information consists of monthly mean CO2 The information consists of monthly mean CO2
concentrations and CO2 fluxes from 1985 to 2007.concentrations and CO2 fluxes from 1985 to 2007.We make use of timeWe make use of time--dependent inversion developed in dependent inversion developed in
TransCom 3 level 2.TransCom 3 level 2.We make use of WDCGG monthly mean observational We make use of WDCGG monthly mean observational
data. Observational data are selected by standard gas data. Observational data are selected by standard gas scale and inversion.scale and inversion.
We make use of offWe make use of off--line transport model (CDTM) with reline transport model (CDTM) with re--analysis meteorology (JRAanalysis meteorology (JRA--25).25).
TransCom workshop Utrecht, The Netherlands 2-5 June, 2008

Future plans (1Future plans (1stst part)part)This yearThis year
We have a plan to request observational data use We have a plan to request observational data use permissions to other agencies.permissions to other agencies.
After 2 or 3 yearsAfter 2 or 3 yearsWe have a plan to introduce mobile platform We have a plan to introduce mobile platform observational data (satellite and aircraft) to our analysis.observational data (satellite and aircraft) to our analysis.We have a plan to increase number of regions from 22 We have a plan to increase number of regions from 22 to 64? in our analysis.to 64? in our analysis.
FutureFutureWe have a plan to update our transport model and We have a plan to update our transport model and analysis method.analysis method.
TransCom workshop Utrecht, The Netherlands 2-5 June, 2008

Acknowledgement (1Acknowledgement (1stst part)part)We are thankful to NOAAWe are thankful to NOAA’’s ESRL for making their s ESRL for making their
observational data available to us for our products.observational data available to us for our products.This work was made possible through support from the This work was made possible through support from the
National Science Foundation (OCENational Science Foundation (OCE--9900310), the 9900310), the National Oceanic and Atmospheric Administration National Oceanic and Atmospheric Administration (NA67RJ0152, Amendment 30), the International (NA67RJ0152, Amendment 30), the International Geosphere Biosphere Geosphere Biosphere ProgrammeProgramme/Global Analysis, /Global Analysis, Interpretation, and Modeling Project, and the Global Interpretation, and Modeling Project, and the Global Carbon Project. Carbon Project.
We thank R. Law, K. Gurney, and P. J. We thank R. Law, K. Gurney, and P. J. RaynerRayner for for making the TDI model code available to us.making the TDI model code available to us.
TransCom workshop Utrecht, The Netherlands 2-5 June, 2008

Another topic (Transport Model)Another topic (Transport Model)We consider that transport model is an important part We consider that transport model is an important part
of our analysis.of our analysis.We currently use our offWe currently use our off--line model (CDTM), but we line model (CDTM), but we
know this model has some problems (thanks to know this model has some problems (thanks to TransCom Continuous and UpperTransCom Continuous and Upper--air experiment).air experiment).
We consider that a main problem of our model is that We consider that a main problem of our model is that CDTM is an offCDTM is an off--line model and it is difficult to line model and it is difficult to introduce precise vertical transport scheme.introduce precise vertical transport scheme.
We tried to combine our CDTM with our GCM (MJWe tried to combine our CDTM with our GCM (MJ--98). 98). MJMJ--98 is global spectral model developed by 98 is global spectral model developed by Meteorological Research Institute and JMA. Meteorological Research Institute and JMA.
TransCom workshop Utrecht, The Netherlands 2-5 June, 2008

GCMGCM specificationsspecifications
The main target of MJThe main target of MJ--98 is climate research.98 is climate research.TransCom workshop Utrecht, The Netherlands 2-5 June, 2008
Long wave and short waveLong wave and short waveGravity wave dragGravity wave drag
Simple Biosphere modelSimple Biosphere modelBiosphereBiosphereDeltaDelta--twotwo--stream approximationstream approximationRadiation schemeRadiation scheme
JRAJRA--25, ERA25, ERA--40, etc.40, etc.NudgingNudging
Mellor Mellor –– Yamada Level 2Yamada Level 2Turbulent schemeTurbulent scheme
ArakawaArakawa--Schbert schemeSchbert schemeCumulus convectionCumulus convectionSemiSemi--Implicit schemeImplicit schemeTime IntegrationTime IntegrationGlobal spectral modelGlobal spectral modelModel FrameModel Frame
MRIMRI--JMA98(Shibata et al., 1999) JMA98(Shibata et al., 1999) NameName

TransportTransport Model specificationsModel specifications
We compared these models using forward model run We compared these models using forward model run (fossil fuel (1995)+ biosphere (CASA)+ ocean (fossil fuel (1995)+ biosphere (CASA)+ ocean
(Takahashi) with reanalysis meteorology (JRA(Takahashi) with reanalysis meteorology (JRA--25)). 25)). TransCom workshop Utrecht, The Netherlands 2-5 June, 2008
JRAJRA--25 (Nudging)25 (Nudging)JRAJRA--2525MetMeteoeorologyrology
Turbulent, cumulusTurbulent, cumulusTurbulent, cumulusTurbulent, cumulusVertical mixingVertical mixingGCM calculationGCM calculationDiagnosed by heatingDiagnosed by heatingVertical flowVertical flow
SemiSemi--LagrangeLagrangeDifferentialDifferentialV. AdvectionV. AdvectionSemiSemi--LagrangeLagrangeSemiSemi--LagrangeLagrangeH. AdvectionH. Advection
T42(2.8 deg.) L45T42(2.8 deg.) L452.5 deg. L322.5 deg. L32ResolutionResolutionOnOn--line modelline modelOffOff--line modelline model
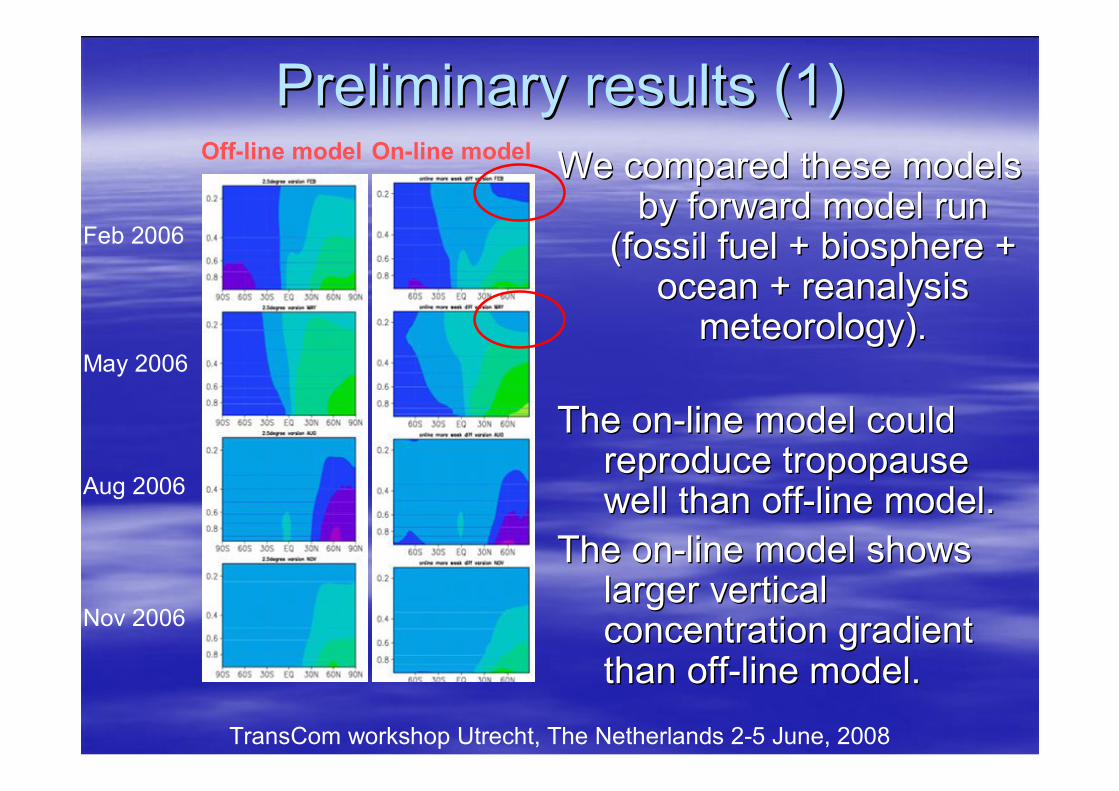
Preliminary results (1)Preliminary results (1)
The oThe onn--line model couldline model couldreprodureproduccee tropopausetropopausewell than offwell than off--line model.line model.
The onThe on--line model shows line model shows larger vertical larger vertical concentration gradient concentration gradient than offthan off--line model. line model.
TransCom workshop Utrecht, The Netherlands 2-5 June, 2008
Feb 2006
May 2006
Aug 2006
Nov 2006
Off-line model On-line model We compared these models We compared these models by forward model run by forward model run
(fossil fuel + biosphere + (fossil fuel + biosphere + ocean + reanalysis ocean + reanalysis
meteorology). meteorology).

Preliminary results (2)Preliminary results (2)
The onThe on--line model couldline model could obtain larger vertical obtain larger vertical concentration gradient than the offconcentration gradient than the off--line model line model (especially lower troposphere and lower stratosphere). (especially lower troposphere and lower stratosphere).
TransCom workshop Utrecht, The Netherlands 2-5 June, 2008
378
380
382
384
386
388
390
2006/1/1 2007/1/1 2008/1/1
500
1500
2500
3500
4500
5500
6500
7500
8500
9500
10500
11500
12500
382
384
386
388
390
392
394
2006/1/1 2007/1/1 2008/1/1
500
1500
2500
3500
4500
5500
6500
7500
8500
9500
10500
11500
12500
Monthly mean CO2 concentrations by forward run (fossil fuel + biosphere + ocean with JCDAS) near Tokyo.
Off-line model On-line model

Summary (2nd part)Summary (2nd part)We have developed an onWe have developed an on--line CDTM. The offline CDTM. The off--line line
transport model is combined with our GCM (MJtransport model is combined with our GCM (MJ--98).98).The onThe on--line model is nudged to reline model is nudged to re--analysis meteorology analysis meteorology
and could treat GCM meteorological parameters without and could treat GCM meteorological parameters without temporal and spatial interpolation.temporal and spatial interpolation.
The onThe on--line model could reproduce vertical CO2 line model could reproduce vertical CO2 concentration realistically (concentration realistically (tropoposetropopose) and show larger ) and show larger vertical concentration gradient. We consider that the onvertical concentration gradient. We consider that the on--line model has a good potential.line model has a good potential.
TransCom workshop Utrecht, The Netherlands 2-5 June, 2008

Future plans (2Future plans (2ndnd part)part)We have a plan to modify vertical mixing processes of the We have a plan to modify vertical mixing processes of the
onon--line model (line model (Cumulus convectionCumulus convection, , PBL heightPBL height).).We have a plan to validate the onWe have a plan to validate the on--line model results line model results
against several observations (continuous, flask and against several observations (continuous, flask and aircraft data).aircraft data).
We have a plan to develop higher resolution (T106 etc.) We have a plan to develop higher resolution (T106 etc.) version of the onversion of the on--line model.line model.
If the onIf the on--line model result could show better performance line model result could show better performance (reproduction of observational data etc.) than our off(reproduction of observational data etc.) than our off--line model, we adopt the online model, we adopt the on--line model as our line model as our Greenhouse Gas Analysis Information.Greenhouse Gas Analysis Information.
TransCom workshop Utrecht, The Netherlands 2-5 June, 2008

ReferencesReferencesAndres, R. J., et al., 1996: A 1 x 1 degree distribution of carbAndres, R. J., et al., 1996: A 1 x 1 degree distribution of carbon dioxide emissions from fossil fuel on dioxide emissions from fossil fuel
consumption and cement manufacture, 1950consumption and cement manufacture, 1950––1990, Global 1990, Global BiogeochemBiogeochem. Cycles, 10, 419. Cycles, 10, 419––429.429.Baker, D.F., et al., 2006: TransCom 3 inversion intercomparison:Baker, D.F., et al., 2006: TransCom 3 inversion intercomparison: Impact of transport model errors on the Impact of transport model errors on the
interannual variability of regional CO2 fluxes, 1988interannual variability of regional CO2 fluxes, 1988––2003. Global Biogeochemical Cycles, Vol. 20, No. 1.2003. Global Biogeochemical Cycles, Vol. 20, No. 1.BrenkertBrenkert, A. L. 1998: Carbon dioxide emission estimates from fossil, A. L. 1998: Carbon dioxide emission estimates from fossil--fuel burning, hydraulic cement fuel burning, hydraulic cement
production, production, TellusTellus 55B (2003), 2578.55B (2003), 2578.Conway, T.J., P.M. Lang, and K.A. Conway, T.J., P.M. Lang, and K.A. MasarieMasarie 2007: Atmospheric Carbon Dioxide Dry Air Mole Fractions from 2007: Atmospheric Carbon Dioxide Dry Air Mole Fractions from
the NOAA ESRL Carbon Cycle Cooperative Global Air Sampling Netwothe NOAA ESRL Carbon Cycle Cooperative Global Air Sampling Network, 1968rk, 1968--2006, Version: 20072006, Version: 2007--0909--19, Path: ftp://ftp.cmdl.noaa.gov/ccg/co2/flask/event/.19, Path: ftp://ftp.cmdl.noaa.gov/ccg/co2/flask/event/.
Energy Information Administration (2002), U.S. Department of EneEnergy Information Administration (2002), U.S. Department of Energy, Table H.1: World carbon dioxide rgy, Table H.1: World carbon dioxide emissions from the consumption and flaring of fossil fuels, 1980emissions from the consumption and flaring of fossil fuels, 1980––present, Int. Energy Annual., 2002.present, Int. Energy Annual., 2002.
GLOBALVIEWGLOBALVIEW--CO2, Cooperative Atmospheric Data Integration Project CO2, Cooperative Atmospheric Data Integration Project -- Carbon Dioxide, CDCarbon Dioxide, CD--ROM, NOAA ROM, NOAA CMDL, Boulder, Colorado, 2007.CMDL, Boulder, Colorado, 2007.
Gurney, K., Law, R., Gurney, K., Law, R., RaynerRayner, P., and A.S. Denning, "TransCom 3 Experimental Protocol," Depa, P., and A.S. Denning, "TransCom 3 Experimental Protocol," Department of rtment of Atmospheric Science, Colorado State University, USA, Paper No. 7Atmospheric Science, Colorado State University, USA, Paper No. 707, 2000.07, 2000.
Maki, T, K. Maki, T, K. KamideKamide, Y. , Y. TsutsumiTsutsumi, 2005: Observational Data Screening Technique using Transport M, 2005: Observational Data Screening Technique using Transport Model and odel and Inverse Model in Estimating CO2 Flux History Extended abstracts Inverse Model in Estimating CO2 Flux History Extended abstracts 7th International CO2 conference, 7th International CO2 conference, Broomfield, Broomfield, CororadoCororado, Sep. 2005., Sep. 2005.
OnogiOnogi, K., et al., 2007: The JRA, K., et al., 2007: The JRA--25 Reanalysis. J. Meteor. Soc. Japan, 85, 36925 Reanalysis. J. Meteor. Soc. Japan, 85, 369––432. 432. RandersonRanderson, J. T., et al., 1997: The contribution of terrestrial sources a, J. T., et al., 1997: The contribution of terrestrial sources and sinks to trends in the seasonal nd sinks to trends in the seasonal
cycle of atmospheric carbon dioxide. Global cycle of atmospheric carbon dioxide. Global BiogeochemBiogeochem. Cycles 11, 535. Cycles 11, 535––560.560.Sasaki. T, et al., 2003: Optimal sampling network and availabiliSasaki. T, et al., 2003: Optimal sampling network and availability of data acquired at inland sites. GLOBAL ty of data acquired at inland sites. GLOBAL
ATMOSPHERE WATCH REPORT SERIES, No. 148, 77ATMOSPHERE WATCH REPORT SERIES, No. 148, 77––79.79.Shibata, K., H. Yoshimura, M. Shibata, K., H. Yoshimura, M. OhizumiOhizumi, M. , M. HosakaHosaka and M. and M. SugiSugi, 1999: A simulation of troposphere, , 1999: A simulation of troposphere,
stratosphere and mesosphere with MRI/JMA98 GCM. Papers in Meteorstratosphere and mesosphere with MRI/JMA98 GCM. Papers in Meteorology and Geophysics., 50, 15ology and Geophysics., 50, 15--53. 53. Stephens, B., et al., 2007: Weak northern and strong tropical laStephens, B., et al., 2007: Weak northern and strong tropical land carbon uptake from vertical profiles of nd carbon uptake from vertical profiles of
atmospheric CO2. Science, 316, 1732atmospheric CO2. Science, 316, 1732––1735.1735.Takahashi, T., et al., 1999: Net seaTakahashi, T., et al., 1999: Net sea--air CO2 flux over the global oceans: An improved estimate based air CO2 flux over the global oceans: An improved estimate based on the on the
seaairseaair pCO2 difference, in Proceedings of the 2nd International SympospCO2 difference, in Proceedings of the 2nd International Symposium: CO2 in the Oceans, the ium: CO2 in the Oceans, the 12th Global Environmental Tsukuba, 18 12th Global Environmental Tsukuba, 18 –– 22 January 1999, Tsukuba Center of Institutes, edited by Y. 22 January 1999, Tsukuba Center of Institutes, edited by Y. NojiriNojiri, Natl. Inst. for Environ. Stud., Environ. Agency of , Natl. Inst. for Environ. Stud., Environ. Agency of JpnJpn., Tokyo.., Tokyo.
WMO (2000), World Data Centre for Greenhouse Gases (WDCGG) Data WMO (2000), World Data Centre for Greenhouse Gases (WDCGG) Data Summary, WDCGG No.22.Summary, WDCGG No.22.
TransCom workshop Utrecht, The Netherlands 2-5 June, 2008

Thank you very much for your patience!Thank you very much for your patience!
Suggestions, questions, observational data and Suggestions, questions, observational data and model results are welcome!! model results are welcome!!
TransCom workshop Utrecht, The Netherlands 2-5 June, 2008