SCC Greenhouse Gas Assessment · SCC Greenhouse Gas Assessment ... The Greenhouse Gas Protocol and...
14
1 SCC Greenhouse Gas Assessment April 2015 – March 2016 Produced by CO2balance UK Ltd March 2017 CO2balance UK Ltd, 1 Discovery House, Cook Way, Bindon Road, Taunton, Somerset, TA2 6BJ, UK Tel: +44 (0) 1823 332233 Registered company number 4889958
Transcript of SCC Greenhouse Gas Assessment · SCC Greenhouse Gas Assessment ... The Greenhouse Gas Protocol and...
1
SCC Greenhouse Gas Assessment
April 2015 – March 2016
Produced by CO2balance UK Ltd March 2017
CO2balance UK Ltd, 1 Discovery House, Cook Way, Bindon Road, Taunton, Somerset, TA2 6BJ, UK Tel: +44 (0) 1823 332233 Registered company number 4889958
2
Greenhouse Gas Assessment – 2015/2016
Produced by
CO2balance UK Limited
Produced during October and November 2016
Version 2.2
Owner: SCC Client Contact: Claire Taylor
CO2balance Contact: Paul Chiplen
Confidentiality, copyright and reproduction
This report is the Copyright of SCC, CO2balance UK Limited and its affiliated organisations. The contents of this report may not
be reproduced in whole or in part, nor passed to any organisation or person without the specific prior written permission of
CO2balance UK Limited or SCC. CO2balance UK Limited accepts no liability whatsoever to any third party for any loss or damage
arising from any interpretation or use of the information contained in this report, or reliance on any views expressed therein.
3
Background & Methodology
This document provides the latest carbon emissions of SCC for the assessment year 2015/2016 and is based on data collated and provided by SCC.
The assessment methodology for the Greenhouse Gas Assessment follows the reporting principles and guidelines provided by the Greenhouse Gas Protocol published by the World Business Council for Sustainable Development and the World Resources Institute (WBCSD/WRI Protocol). In line with the WBCSD/WRI Protocol, CO2balance uses these procedures to undertake Greenhouse Gas Emissions Assessments.
Scoping the Greenhouse Gas Assessment When accounting for Greenhouse Gas Assessment emissions it is important to draw clear organisational boundaries. The WBCSD/WRI Greenhouse Gas Protocol sets boundaries that are consistent with the organisational boundaries used for financial reporting purposes. For the purpose of this report CO2balance defined the scopes of direct and indirect emissions based on SCC’s operational boundary. Scopes The Greenhouse Gas Protocol and the ISO 14064_1 standard define three protocols that must be used when determining emissions. These are divided into scopes.
• Scope 1 – Direct Emissions (fuel combustion, company owned vehicles)
• Scope 2 – Indirect Emissions (such as purchased electricity for own use)
• Scope 3 – Indirect Emissions (outsourced operations, business travel in vehicles not owned by the company, embodied energy in products purchased, waste disposal)
Reporting approach CO2balance’s Greenhouse Gas Emissions Assessment is based on the application of relevant conversion factors (i.e. amount of CO2 produced per unit of fuel consumed). The approach is considered the most pragmatic, since the quantity of key greenhouse gases produced in most combustion and manufacturing processes is well understood. CO2balance is guided by the precautionary principle. Where there is any doubt over activities undertaken, or where there is a choice of published figures available for calculating greenhouse gas emissions, a conservative “worst case” scenario is assumed, unless otherwise specified.
4
Executive Summary
Annual Greenhouse Gas emissions assessments for SCC have been carried out by CO2balance since 2009 to monitor the scope and source of the company’s emissions. The previous base line year from which to compare emissions was the financial year of 2009/2010; however, this has been replaced with the financial year of 2015/2016 due to a significant change in reporting practices which has made a major impact on the company’s reported carbon footprint. In previous years, emissions from electricity have been based on the UK grid emission factors; the Greenhouse Gas Protocol has issued new guidance for Scope 2 reporting (predominantly electricity consumption) which allows the use of market based reporting, to reflect the emissions from the electricity that the organisation purchased from, as opposed to the national grid average. During the reporting period of 2015/16 SCC, purchased from a green tariff for 7 months, switching to a brown tariff for the remaining 5 months. The electricity usage consumed during this reporting period increased significantly, with kWh usage rising from 20 million to 36 million. The primary cause of this growth is the addition a new data centre during the reporting period. The move to market based reporting for Scope 2 emissions shows an overall decreased in emissions despite this growth in electricity consumption. The addition of a new data centre, and change in the reporting procedure (in line with approved guidance), has resulted in SCC realigning its baseline for the year of 2015/16.
5
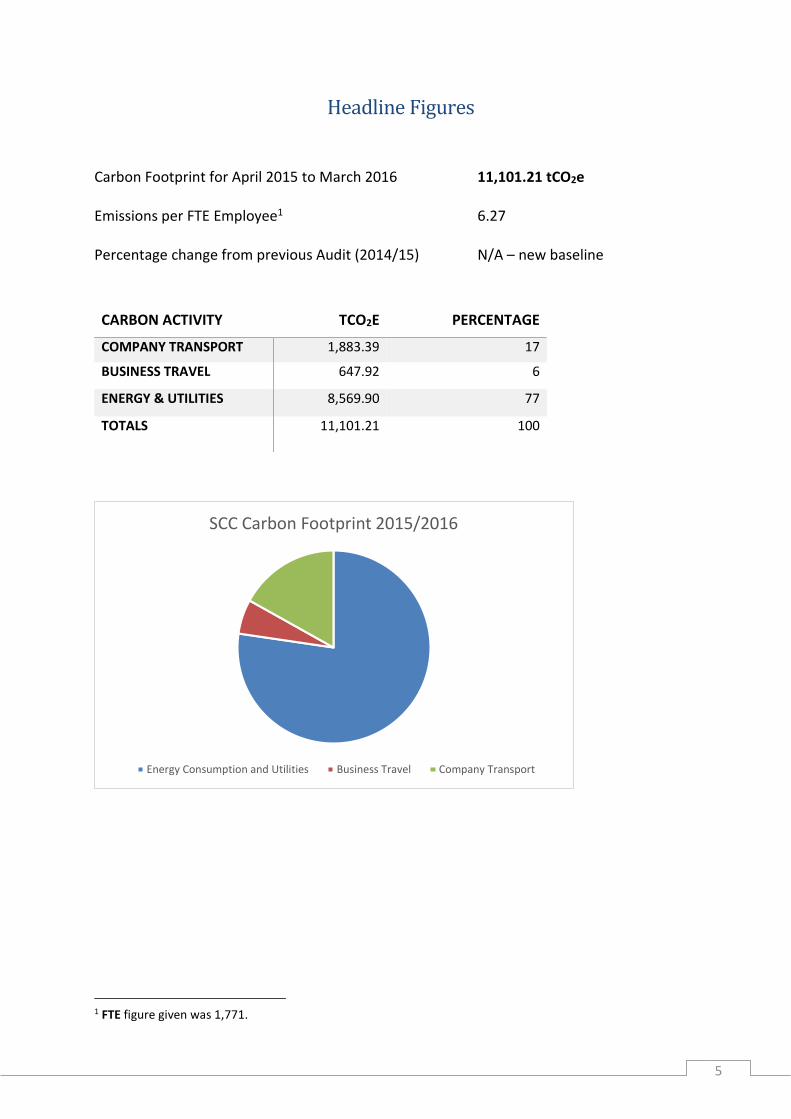
Headline Figures
Carbon Footprint for April 2015 to March 2016 11,101.21 tCO2e Emissions per FTE Employee1 6.27 Percentage change from previous Audit (2014/15) N/A – new baseline
1 FTE figure given was 1,771.
SCC Carbon Footprint 2015/2016
Energy Consumption and Utilities Business Travel Company Transport
CARBON ACTIVITY TCO2E PERCENTAGE
COMPANY TRANSPORT 1,883.39 17
BUSINESS TRAVEL 647.92 6
ENERGY & UTILITIES 8,569.90 77
TOTALS 11,101.21 100
6
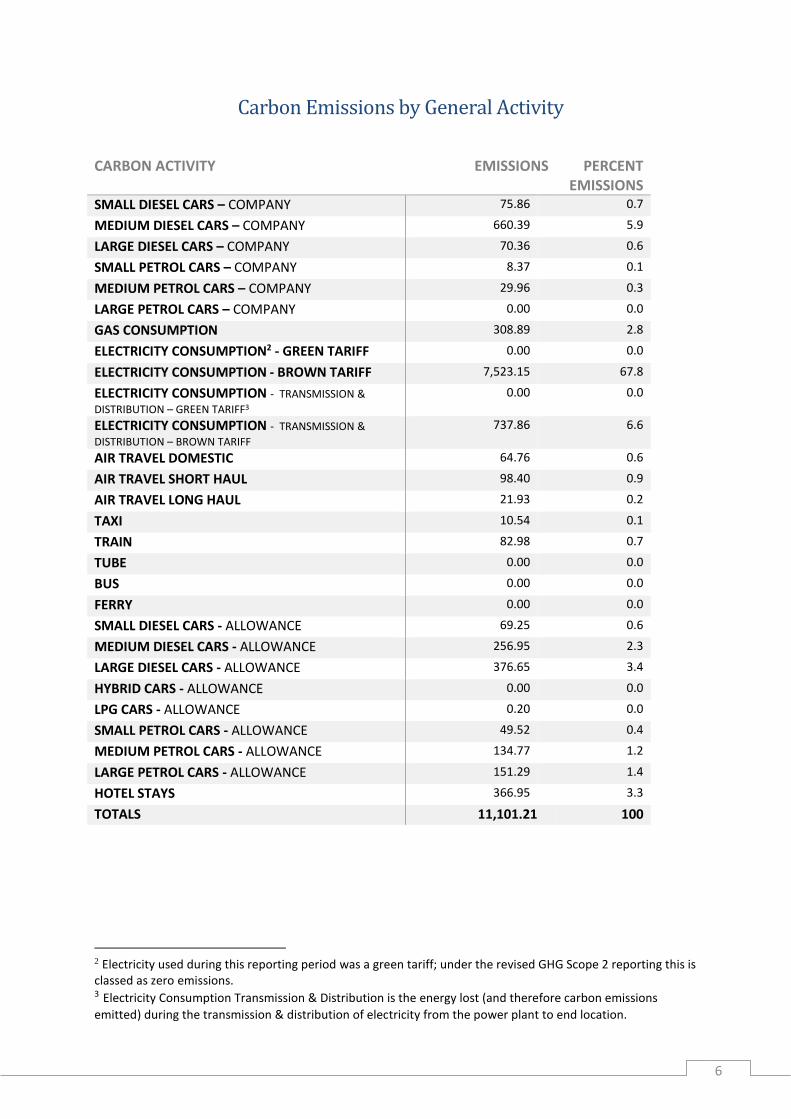
Carbon Emissions by General Activity
CARBON ACTIVITY EMISSIONS PERCENT EMISSIONS
SMALL DIESEL CARS – COMPANY 75.86 0.7
MEDIUM DIESEL CARS – COMPANY 660.39 5.9
LARGE DIESEL CARS – COMPANY 70.36 0.6
SMALL PETROL CARS – COMPANY 8.37 0.1
MEDIUM PETROL CARS – COMPANY 29.96 0.3
LARGE PETROL CARS – COMPANY 0.00 0.0
GAS CONSUMPTION 308.89 2.8
ELECTRICITY CONSUMPTION2 - GREEN TARIFF 0.00 0.0
ELECTRICITY CONSUMPTION - BROWN TARIFF 7,523.15 67.8
ELECTRICITY CONSUMPTION - TRANSMISSION &
DISTRIBUTION – GREEN TARIFF3 0.00 0.0
ELECTRICITY CONSUMPTION - TRANSMISSION &
DISTRIBUTION – BROWN TARIFF 737.86 6.6
AIR TRAVEL DOMESTIC 64.76 0.6
AIR TRAVEL SHORT HAUL 98.40 0.9
AIR TRAVEL LONG HAUL 21.93 0.2
TAXI 10.54 0.1
TRAIN 82.98 0.7
TUBE 0.00 0.0
BUS 0.00 0.0
FERRY 0.00 0.0
SMALL DIESEL CARS - ALLOWANCE 69.25 0.6
MEDIUM DIESEL CARS - ALLOWANCE 256.95 2.3
LARGE DIESEL CARS - ALLOWANCE 376.65 3.4
HYBRID CARS - ALLOWANCE 0.00 0.0
LPG CARS - ALLOWANCE 0.20 0.0
SMALL PETROL CARS - ALLOWANCE 49.52 0.4
MEDIUM PETROL CARS - ALLOWANCE 134.77 1.2
LARGE PETROL CARS - ALLOWANCE 151.29 1.4
HOTEL STAYS 366.95 3.3
TOTALS 11,101.21 100
2 Electricity used during this reporting period was a green tariff; under the revised GHG Scope 2 reporting this is classed as zero emissions. 3 Electricity Consumption Transmission & Distribution is the energy lost (and therefore carbon emissions
emitted) during the transmission & distribution of electricity from the power plant to end location.
7
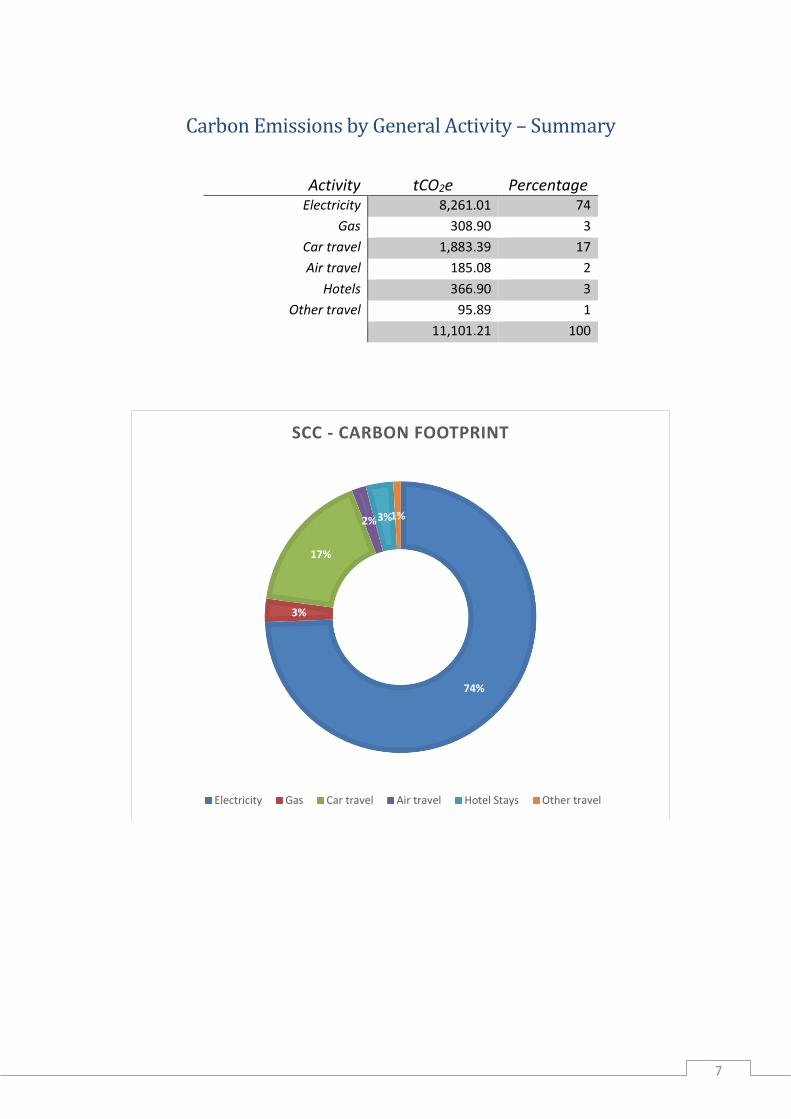
Carbon Emissions by General Activity – Summary
Activity tCO2e Percentage Electricity 8,261.01 74
Gas 308.90 3
Car travel 1,883.39 17
Air travel 185.08 2
Hotels 366.90 3
Other travel 95.89 1
11,101.21 100
74%
3%
17%
2%3%1%
SCC - CARBON FOOTPRINT
Electricity Gas Car travel Air travel Hotel Stays Other travel
8
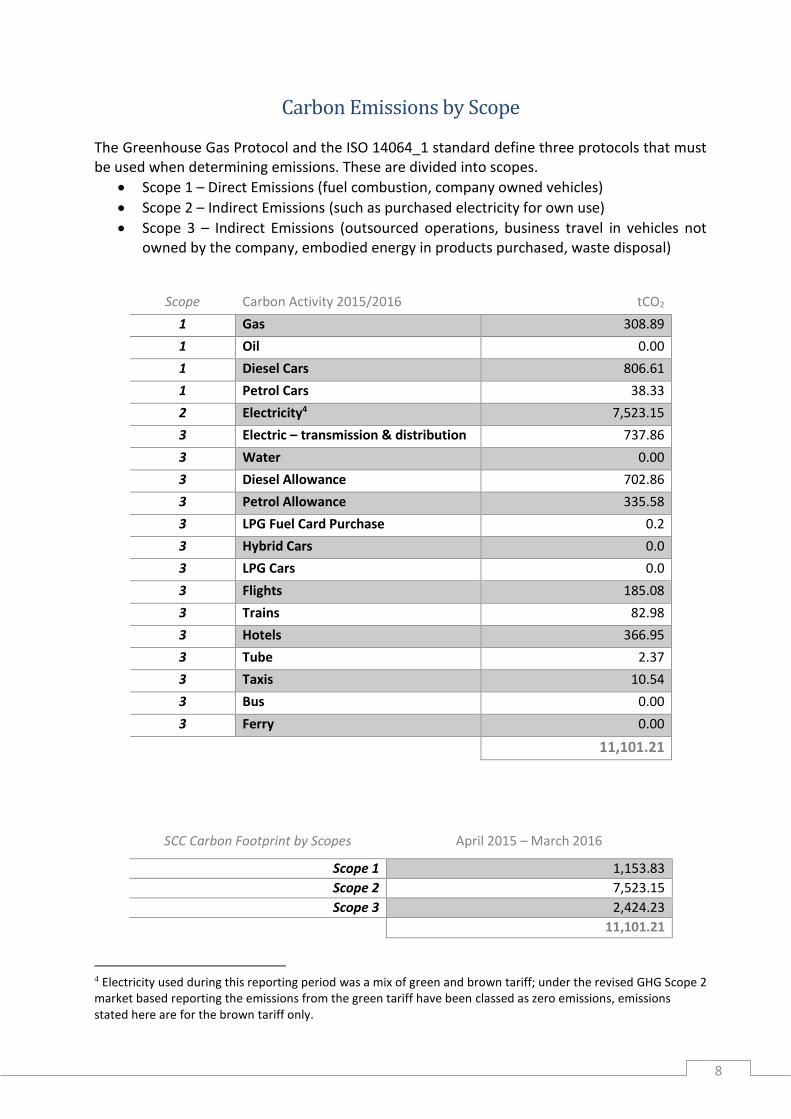
Carbon Emissions by Scope
The Greenhouse Gas Protocol and the ISO 14064_1 standard define three protocols that must be used when determining emissions. These are divided into scopes.
• Scope 1 – Direct Emissions (fuel combustion, company owned vehicles)
• Scope 2 – Indirect Emissions (such as purchased electricity for own use)
• Scope 3 – Indirect Emissions (outsourced operations, business travel in vehicles not owned by the company, embodied energy in products purchased, waste disposal)
Scope Carbon Activity 2015/2016 tCO2
1 Gas 308.89
1 Oil 0.00
1 Diesel Cars 806.61
1 Petrol Cars 38.33
2 Electricity4 7,523.15
3 Electric – transmission & distribution 737.86
3 Water 0.00
3 Diesel Allowance 702.86
3 Petrol Allowance 335.58
3 LPG Fuel Card Purchase 0.2
3 Hybrid Cars 0.0
3 LPG Cars 0.0
3 Flights 185.08
3 Trains 82.98
3 Hotels 366.95
3 Tube 2.37
3 Taxis 10.54
3 Bus 0.00
3 Ferry 0.00
Total Emissions 11,101.21
SCC Carbon Footprint by Scopes April 2015 – March 2016
Scope 1 1,153.83
Scope 2 7,523.15
Scope 3 2,424.23
Total Emissions 11,101.21
4 Electricity used during this reporting period was a mix of green and brown tariff; under the revised GHG Scope 2 market based reporting the emissions from the green tariff have been classed as zero emissions, emissions stated here are for the brown tariff only.
9
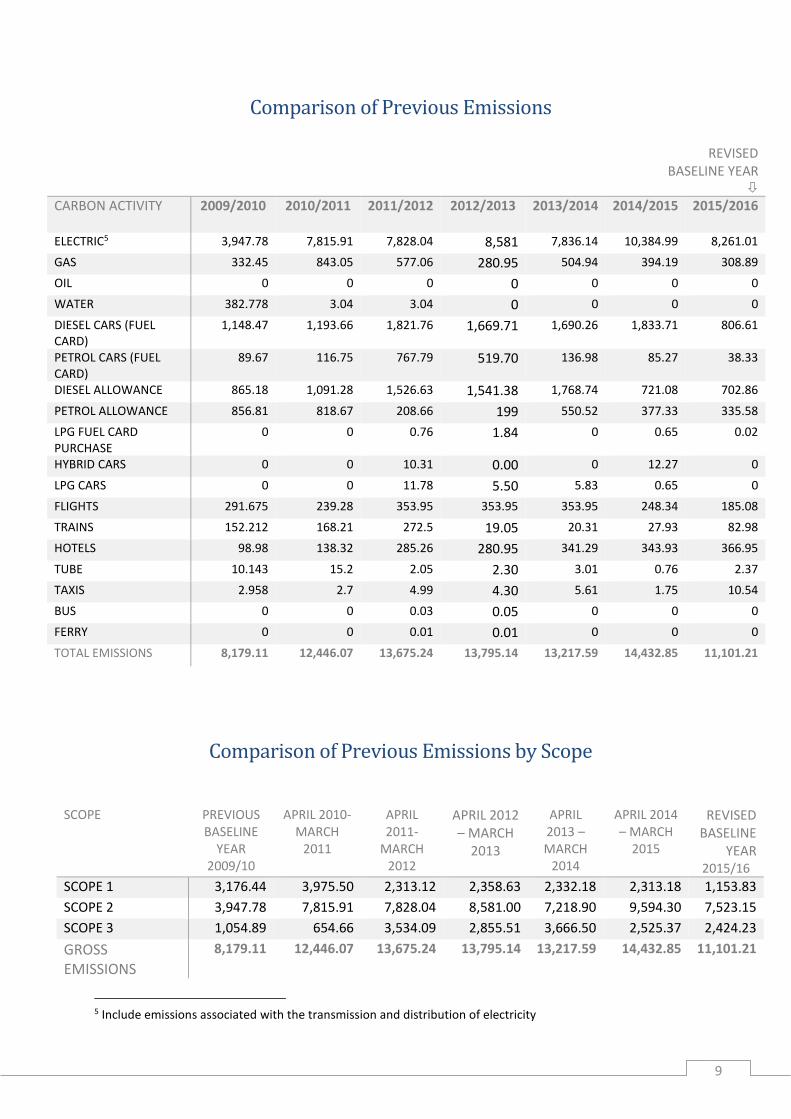
Comparison of Previous Emissions
REVISED BASELINE YEAR
CARBON ACTIVITY 2009/2010 2010/2011 2011/2012 2012/2013 2013/2014 2014/2015 2015/2016
ELECTRIC5 3,947.78 7,815.91 7,828.04 8,581 7,836.14 10,384.99 8,261.01
GAS 332.45 843.05 577.06 280.95 504.94 394.19 308.89
OIL 0 0 0 0 0 0 0
WATER 382.778 3.04 3.04 0 0 0 0
DIESEL CARS (FUEL CARD)
1,148.47 1,193.66 1,821.76 1,669.71 1,690.26 1,833.71 806.61
PETROL CARS (FUEL CARD)
89.67 116.75 767.79 519.70 136.98 85.27 38.33
DIESEL ALLOWANCE 865.18 1,091.28 1,526.63 1,541.38 1,768.74 721.08 702.86
PETROL ALLOWANCE 856.81 818.67 208.66 199 550.52 377.33 335.58
LPG FUEL CARD PURCHASE
0 0 0.76 1.84 0 0.65 0.02
HYBRID CARS 0 0 10.31 0.00 0 12.27 0
LPG CARS 0 0 11.78 5.50 5.83 0.65 0
FLIGHTS 291.675 239.28 353.95 353.95 353.95 248.34 185.08
TRAINS 152.212 168.21 272.5 19.05 20.31 27.93 82.98
HOTELS 98.98 138.32 285.26 280.95 341.29 343.93 366.95
TUBE 10.143 15.2 2.05 2.30 3.01 0.76 2.37
TAXIS 2.958 2.7 4.99 4.30 5.61 1.75 10.54
BUS 0 0 0.03 0.05 0 0 0
FERRY 0 0 0.01 0.01 0 0 0
TOTAL EMISSIONS 8,179.11 12,446.07 13,675.24 13,795.14 13,217.59 14,432.85 11,101.21
Comparison of Previous Emissions by Scope
SCOPE PREVIOUS
BASELINE YEAR
2009/10
APRIL 2010- MARCH
2011
APRIL 2011-
MARCH 2012
APRIL 2012 – MARCH
2013
APRIL 2013 – MARCH
2014
APRIL 2014 – MARCH
2015
REVISED BASELINE
YEAR 2015/16
SCOPE 1 3,176.44 3,975.50 2,313.12 2,358.63 2,332.18 2,313.18 1,153.83
SCOPE 2 3,947.78 7,815.91 7,828.04 8,581.00 7,218.90 9,594.30 7,523.15
SCOPE 3 1,054.89 654.66 3,534.09 2,855.51 3,666.50 2,525.37 2,424.23
GROSS EMISSIONS
8,179.11 12,446.07 13,675.24 13,795.14 13,217.59 14,432.85 11,101.21
5 Include emissions associated with the transmission and distribution of electricity
10
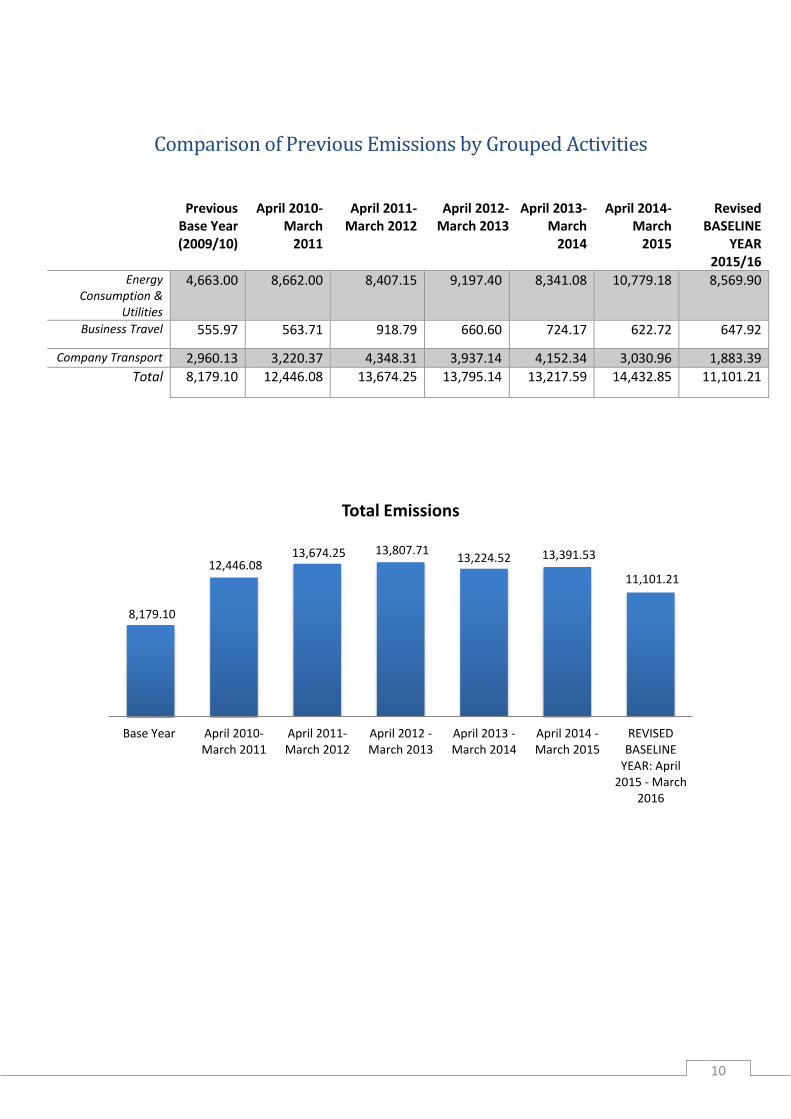
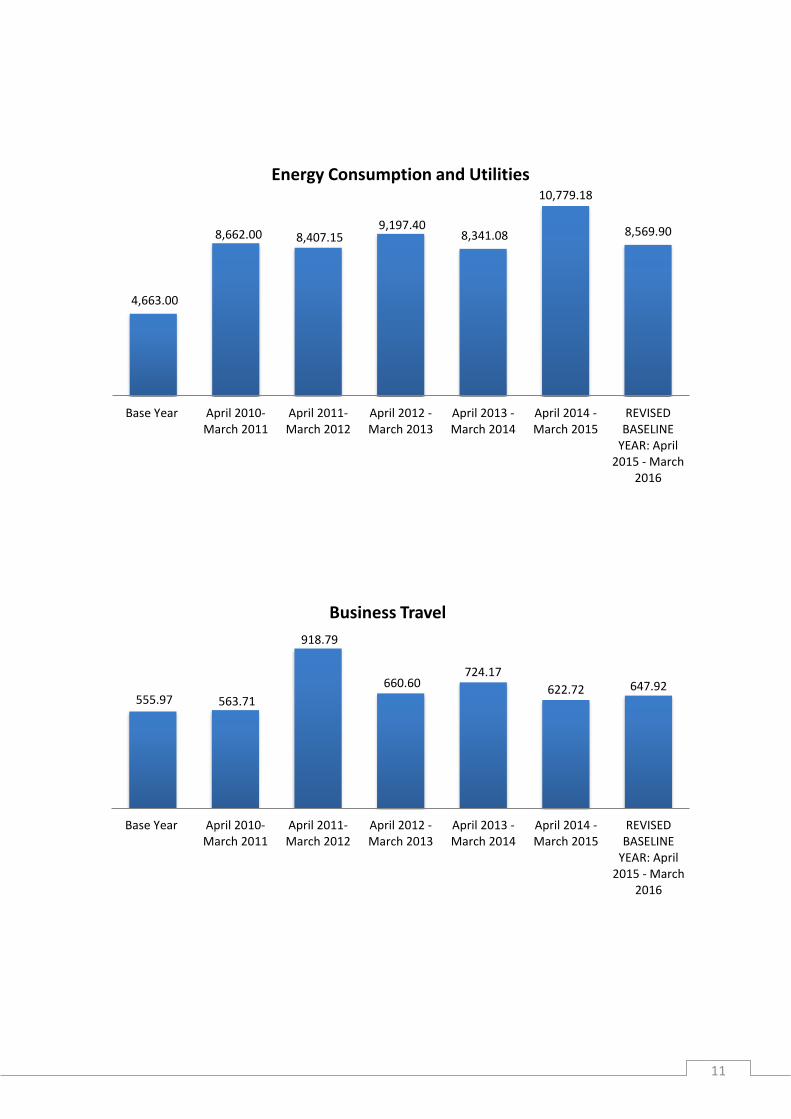
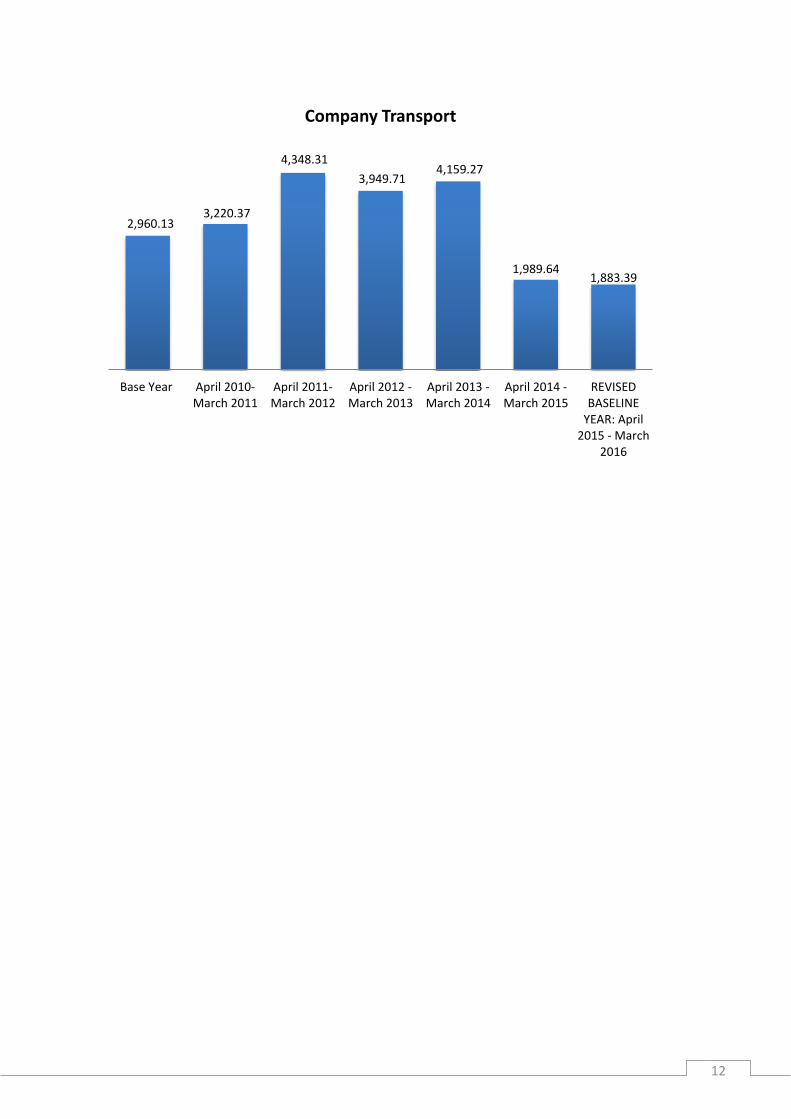
Comparison of Previous Emissions by Grouped Activities
Previous
Base Year (2009/10)
April 2010- March
2011
April 2011- March 2012
April 2012-March 2013
April 2013- March
2014
April 2014- March
2015
Revised BASELINE
YEAR 2015/16
Energy Consumption &
Utilities
4,663.00 8,662.00 8,407.15 9,197.40 8,341.08 10,779.18 8,569.90
Business Travel 555.97 563.71 918.79 660.60 724.17 622.72 647.92
Company Transport 2,960.13 3,220.37 4,348.31 3,937.14 4,152.34 3,030.96 1,883.39
Total 8,179.10 12,446.08 13,674.25 13,795.14 13,217.59 14,432.85 11,101.21
8,179.10
12,446.08 13,674.25 13,807.71
13,224.52 13,391.53
11,101.21
Base Year April 2010-March 2011
April 2011-March 2012
April 2012 -March 2013
April 2013 -March 2014
April 2014 -March 2015
REVISEDBASELINE
YEAR: April2015 - March
2016
Total Emissions
11
4,663.00
8,662.00 8,407.15 9,197.40
8,341.08
10,779.18
8,569.90
Base Year April 2010-March 2011
April 2011-March 2012
April 2012 -March 2013
April 2013 -March 2014
April 2014 -March 2015
REVISEDBASELINE
YEAR: April2015 - March
2016
Energy Consumption and Utilities
555.97 563.71
918.79
660.60 724.17
622.72 647.92
Base Year April 2010-March 2011
April 2011-March 2012
April 2012 -March 2013
April 2013 -March 2014
April 2014 -March 2015
REVISEDBASELINE
YEAR: April2015 - March
2016
Business Travel
12
2,960.13 3,220.37
4,348.31
3,949.71 4,159.27
1,989.641,883.39
Base Year April 2010-March 2011
April 2011-March 2012
April 2012 -March 2013
April 2013 -March 2014
April 2014 -March 2015
REVISEDBASELINE
YEAR: April2015 - March
2016
Company Transport
13
Net Emissions
Gross Carbon Emissions for reporting period 11,101.21 tCO2e Carbon Offset Credits 0
Total Net Emissions 11,101.21 tCO2e
Assumptions
• All data used to calculate emissions was provided by the client and was accurate.
Information that was for only a 6-month period 01/04/15 to 30/09/16 was extrapolated to
create dataset for one year (other than electricity and gas data which was a full 12-month
period).
• Scope Two emissions for electricity were based on the Greenhouse Gas Protocol’s revised
market based approach for Scope Two emissions. As such emissions were calculated
based on the actual emissions from SCC’s sourced electricity, as opposed the UK Grid
Average. The emissions from the “brown tariff” partly used during the reporting period,
which was purchased from energy company “SSE” had a reported emissions factor of 0.38
kg of CO2 per kWh6.
• Emissions for Taxis, Train, Tube, Bus and Ferry journeys were calculated based on the
number of journeys and an average distance:
o Taxis – 10 km
o Tube – 14.8 km
o Bus – 7.3 km
o Ferry 33.9 km
(Transport Statistics Great Britain 2012)
o Train – 179 km
6 Source: http://electricityinfo.org/supplier-fuel-mix/?supplier_code=scot21&y=2016

14
Contact Details
Paul Chiplen CO2balance UK Ltd 1 Discovery House, Cook Way, Bindon Road, Taunton, Somerset, TA2 6BJ
+44 (0)1823 332233 [email protected]