German National Tourist Board Incoming-Tourism · PDF fileGerman National Tourist Board...
24
Facts and Figures 2012 German National Tourist Board Incoming-Tourism Germany Edition 2013
-
Upload
nguyenlien -
Category
Documents
-
view
222 -
download
1
Transcript of German National Tourist Board Incoming-Tourism · PDF fileGerman National Tourist Board...
Facts and Figures 2012
German National Tourist Board
Incoming-Tourism GermanyEdition 2013
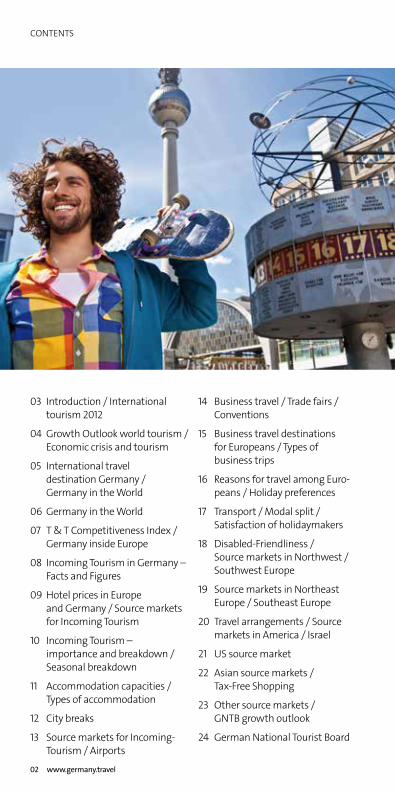
CONTENTS
02
03 Introduction / International tourism 2012
04 Growth Outlook world tourism / Economic crisis and tourism
05 International travel destination Germany / Germany in the World
06 Germany in the World
07 T & T Competitiveness Index / Germany inside Europe
08 Incoming Tourism in Germany – Facts and Figures
09 Hotel prices in Europe and Germany / Source markets for Incoming Tourism
10 Incoming Tourism – importance and breakdown / Seasonal breakdown
11 Accommodation capacities / Types of accommodation
12 City breaks
13 Source markets for Incoming-Tourism / Airports
14 Business travel / Trade fairs / Conventions
15 Business travel destinations for Europeans / Types of business trips
16 Reasons for travel among Euro-peans / Holiday preferences
17 Transport / Modal split / Satisfaction of holidaymakers
18 Disabled-Friendliness / Source markets in Northwest / Southwest Europe
19 Source markets in Northeast Europe / Southeast Europe
20 Travel arrangements / Source markets in America / Israel
21 US source market
22 Asian source markets / Tax-Free Shopping
23 Other source markets / GNTB growth outlook
24 German National Tourist Board
www.germany.travel
03
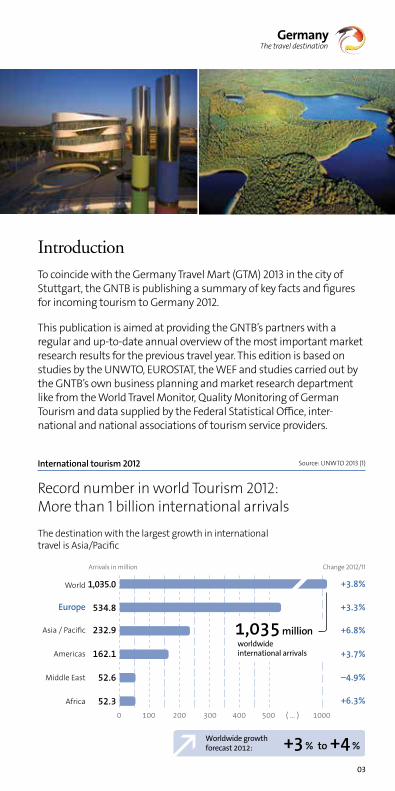
IntroductionTo coincide with the Germany Travel Mart (GTM) 2013 in the city of Stuttgart, the GNTB is publishing a summary of key facts and figures for incoming tourism to Germany 2012.
This publication is aimed at providing the GNTB’s partners with a regular and up-to-date annual overview of the most important market research results for the previous travel year. This edition is based on studies by the UNWTO, EUROSTAT, the WEF and studies carried out by the GNTB’s own business planning and market research department like from the World Travel Monitor, Quality Monitoring of German Tourism and data supplied by the Federal Statistical Office, inter-national and national associations of tourism service providers.
International tourism 2012 Source: UNWTO 2013 (1)
Record number in world Tourism 2012: More than 1 billion international arrivals
The destination with the largest growth in international travel is Asia/Pacific
Arrivals in million Change 2012/11
World 1,035.0
Europe 534.8
Asia / Pacific 232.9
Americas 162.1
Middle East 52.6
Africa 52.3
+3.8%
+3.3%
+6.8%
+3.7%
–4.9%
+6.3% ( … )
Mio.internationale Ankünfte weltweit
Worldwide growth forecast 2012:
% to + %
millionworldwide international arrivals
1,035
WORLD / EUROPE
04
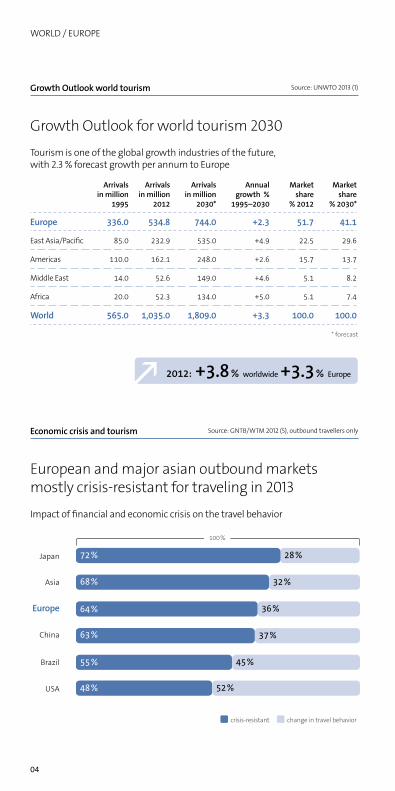
Growth Outlook world tourism Source: UNWTO 2013 (1)
Growth Outlook for world tourism 2030
Tourism is one of the global growth industries of the future, with 2.3 % forecast growth per annum to Europe
Arrivals in million
1995
Arrivals in million
2012
Arrivals in million
2030*
Annual growth %
1995–2030
Market share
% 2012
Market share
% 2030*
Europe 336.0 534.8 744.0 +2.3 51.7 41.1
East Asia/Pacific 85.0 232.9 535.0 +4.9 22.5 29.6
Americas 110.0 162.1 248.0 +2.6 15.7 13.7
Middle East 14.0 52.6 149.0 +4.6 5.1 8.2
Africa 20.0 52.3 134.0 +5.0 5.1 7.4
World 565.0 1,035.0 1,809.0 +3.3 100.0 100.0
* forecast
Economic crisis and tourism Source: GNTB/WTM 2012 (5), outbound travellers only
European and major asian outbound markets mostly crisis-resistant for traveling in 2013
Impact of financial and economic crisis on the travel behavior
Japan
Asia
Europe
China
Brazil
USA
% worldwide % Europe +3.8 +3.3
%
%
%
%
%
%
%
%
%
%
%
%
%
crisis-resistant change in travel behavior
05
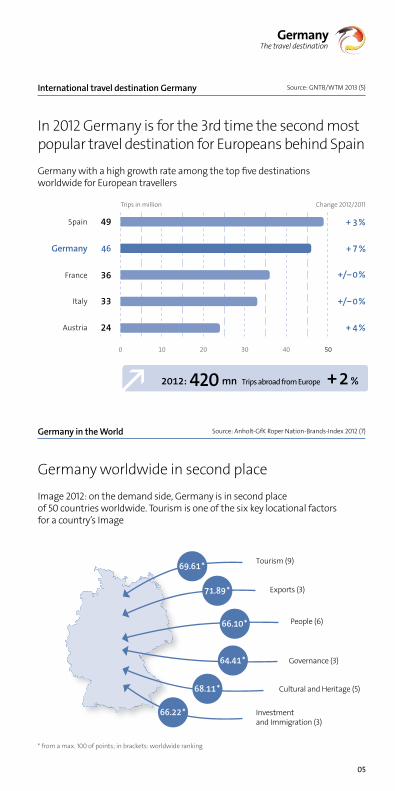
International travel destination Germany Source: GNTB/WTM 2013 (5)
In 2012 Germany is for the 3rd time the second most popular travel destination for Europeans behind Spain
Germany with a high growth rate among the top five destinations worldwide for European travellers
Trips in million Change 2012/2011
Spain 49
Germany 46
France 36
Italy 33
Austria 24
Germany in the World Source: Anholt-GfK Roper Nation-Brands-Index 2012 (7)
Germany worldwide in second place
Image 2012: on the demand side, Germany is in second place of 50 countries worldwide. Tourism is one of the six key locational factors for a country’s Image
* from a max. 100 of points; in brackets: worldwide ranking
Investment and Immigration (3)
69.61 *
71.89 *
66.10 *
64.41 *
68.11 *
66.22 *
Tourism (9)
Exports (3)
People (6)
Governance (3)
Cultural and Heritage (5)
mn Trips abroad from Europe %
+ 7 %
420
WORLD / EUROPE
06
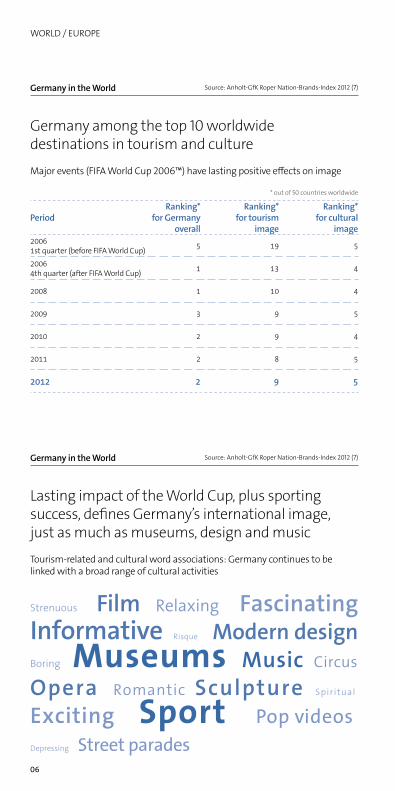
Germany in the World Source: Anholt-GfK Roper Nation-Brands-Index 2012 (7)
Germany among the top 10 worldwide destinations in tourism and culture
Major events (FIFA World Cup 2006™) have lasting positive effects on image
* out of 50 countries worldwide
PeriodRanking*
for Germany overall
Ranking* for tourism
image
Ranking* for cultural
image2006 1st quarter (before FIFA World Cup) 5 19 5
2006 4th quarter (after FIFA World Cup) 1 13 4
2008 1 10 4
2009 3 9 5
2010 2 9 4
2011 2 8 5
2012 2 9 5
Germany in the World Source: Anholt-GfK Roper Nation-Brands-Index 2012 (7)
Lasting impact of the World Cup, plus sporting success, defines Germany’s international image, just as much as museums, design and music
Tourism-related and cultural word associations: Germany continues to be linked with a broad range of cultural activities
Strenuous Film Relaxing Fascinating
Informative Risque Modern design Boring Museums Music Circus
Opera Romantic Sculpture Spiritual
Exciting Sport Pop videos Depressing Street parades
07
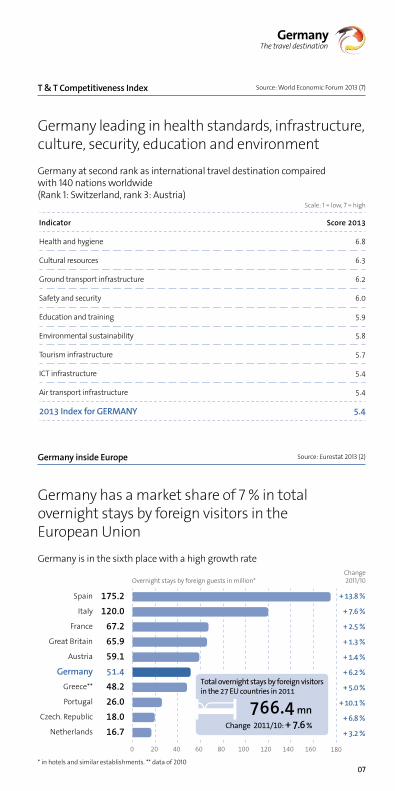
T & T Competitiveness Index Source: World Economic Forum 2013 (7)
Germany leading in health standards, infrastructure, culture, security, education and environment
Germany at second rank as international travel destination compaired with 140 nations worldwide (Rank 1: Switzerland, rank 3: Austria)
Scale: 1 = low, 7 = high
Indicator Score 2013
Health and hygiene 6.8
Cultural resources 6.3
Ground transport infrastructure 6.2
Safety and security 6.0
Education and training 5.9
Environmental sustainability 5.8
Tourism infrastructure 5.7
ICT infrastructure 5.4
Air transport infrastructure 5.4
2013 Index for GERMANY 5.4
Germany inside Europe Source: Eurostat 2013 (2)
Germany has a market share of 7 % in total overnight stays by foreign visitors in the European Union
Germany is in the sixth place with a high growth rateChange
Overnight stays by foreign guests in million* 2011/10
Spain 175.2Italy 120.0
France 67.2Great Britain 65.9
Austria 59.1Germany 51.4
Greece** 48.2Portugal 26.0
Czech. Republic 18.0Netherlands 16.7
* in hotels and similar establishments. ** data of 2010
Change 2011/10:
mn
+ 13.8 %
+ 7.6 %
+ 2.5 %
+ 1.3 %
+ 1.4 %
+ 6.2 %
+ 5.0 %
+ 10.1 %
+ 6.8 %
+ 3.2 %+ 7.6 %
766.4Total overnight stays by foreign visitors in the 27 EU countries in 2011
GERMANY
08
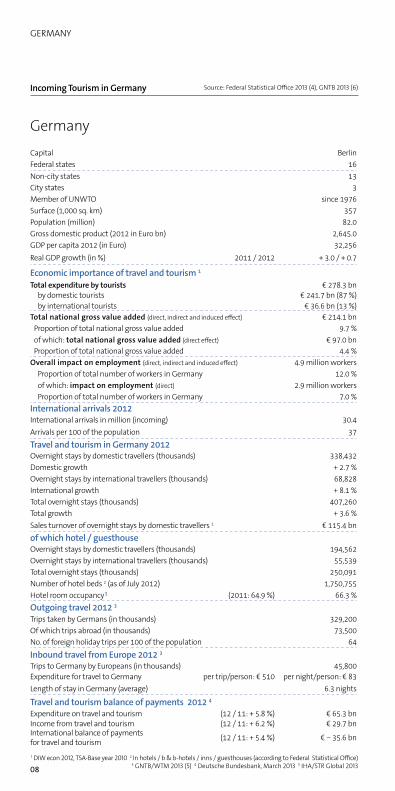
Incoming Tourism in Germany Source: Federal Statistical Office 2013 (4), GNTB 2013 (6)
GermanyCapital BerlinFederal states 16Non-city states 13City states 3Member of UNWTO since 1976Surface (1,000 sq. km) 357Population (million) 82.0Gross domestic product (2012 in Euro bn) 2,645.0GDP per capita 2012 (in Euro) 32,256Real GDP growth (in %) 2011 / 2012 + 3.0 / + 0.7
Economic importance of travel and tourism 1Total expenditure by tourists € 278.3 bn
by domestic tourists € 241.7 bn (87 %)by international tourists € 36.6 bn (13 %)
Total national gross value added (direct, indirect and induced effect) € 214.1 bnProportion of total national gross value added 9.7 %of which: total national gross value added (direct effect) € 97.0 bnProportion of total national gross value added 4.4 %
Overall impact on employment (direct, indirect and induced effect) 4.9 million workersProportion of total number of workers in Germany 12.0 %of which: impact on employment (direct) 2.9 million workersProportion of total number of workers in Germany 7.0 %
International arrivals 2012International arrivals in million (incoming) 30.4Arrivals per 100 of the population 37
Travel and tourism in Germany 2012Overnight stays by domestic travellers (thousands) 338,432Domestic growth + 2.7 %Overnight stays by international travellers (thousands) 68,828International growth + 8.1 %Total overnight stays (thousands) 407,260Total growth + 3.6 %Sales turnover of overnight stays by domestic travellers 1 € 115.4 bnof which hotel / guesthouseOvernight stays by domestic travellers (thousands) 194,562Overnight stays by international travellers (thousands) 55,539Total overnight stays (thousands) 250,091Number of hotel beds 2 (as of July 2012) 1,750,755Hotel room occupancy 5 (2011: 64.9 %) 66.3 %Outgoing travel 2012 3Trips taken by Germans (in thousands) 329,200Of which trips abroad (in thousands) 73,500No. of foreign holiday trips per 100 of the population 64
Inbound travel from Europe 2012 3Trips to Germany by Europeans (in thousands) 45,800Expenditure for travel to Germany per trip/person: € 510 per night/person: € 83Length of stay in Germany (average) 6.3 nights
Travel and tourism balance of payments 2012 4Expenditure on travel and tourism (12 / 11: + 5.8 %) € 65.3 bnIncome from travel and tourism (12 / 11: + 6.2 %) € 29.7 bnInternational balance of payments for travel and tourism (12 / 11: + 5.4 %) € − 35.6 bn
1 DIW econ 2012, TSA-Base year 2010 2 In hotels / b & b-hotels / inns / guesthouses (according to Federal Statistical Office) 3 GNTB/WTM 2013 (5) 4 Deutsche Bundesbank, March 2013 5 IHA/STR Global 2013
09
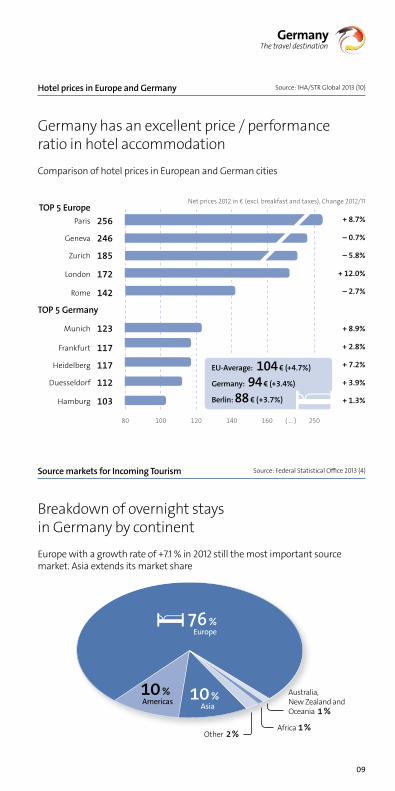
Hotel prices in Europe and Germany Source: IHA/STR Global 2013 (10)
Germany has an excellent price / performance ratio in hotel accommodation
Comparison of hotel prices in European and German cities
TOP 5 EuropeParis 256
Geneva 246
Zurich 185
London 172
Rome 142
TOP 5 Germany
Munich 123
Frankfurt 117
Heidelberg 117
Duesseldorf 112
Hamburg 103
Source markets for Incoming Tourism Source: Federal Statistical Office 2013 (4)
Breakdown of overnight stays in Germany by continent
Europe with a growth rate of +7.1 % in 2012 still the most important source market. Asia extends its market share
+ 8.7%
Net prices 2012 in € (excl. breakfast and taxes), Change 2012/11
– 5.8%
( … )
EU-Average:
Germany:
Berlin:
– 2.7%
+ 12.0%
– 0.7%
+ 8.9%
+ 7.2%
+ 1.3%
+ 3.9%
+ 2.8%
+4.7%
+3.4%
+3.7%
Africa Other
% Europe
% Americas %
Asia
Australia, New Zealand and Oceania
GERMANY
10
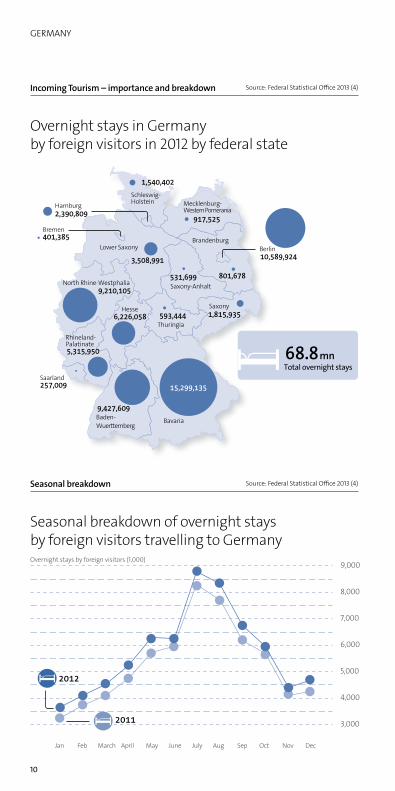
Incoming Tourism – importance and breakdown Source: Federal Statistical Office 2013 (4)
Overnight stays in Germany by foreign visitors in 2012 by federal state
Seasonal breakdown Source: Federal Statistical Office 2013 (4)
Seasonal breakdown of overnight stays by foreign visitors travelling to Germany Overnight stays by foreign visitors (1,000)
Bavaria Baden-Wuerttemberg
Rhineland-Palatinate
Saarland
Hesse
Thuringia
Saxony-Anhalt
Saxony
Brandenburg Berlin
Mecklenburg-Western Pomerania
Schleswig-HolsteinHamburg
Bremen
Lower Saxony
North Rhine-Westphalia
mnTotal overnight stays
2,390,809
68.8
1,540,402
917,525
3,508,991
531,699 801,678
1,815,935593,444
9,210,105
6,226,058
5,315,950
257,009
9,427,609
15,299,135
10,589,924
401,385
2012
2011
9,000
8,000
6,000
5,000
4,000
3,000
7,000
Jan Feb March April May June July Aug Sep Oct Nov Dec
11
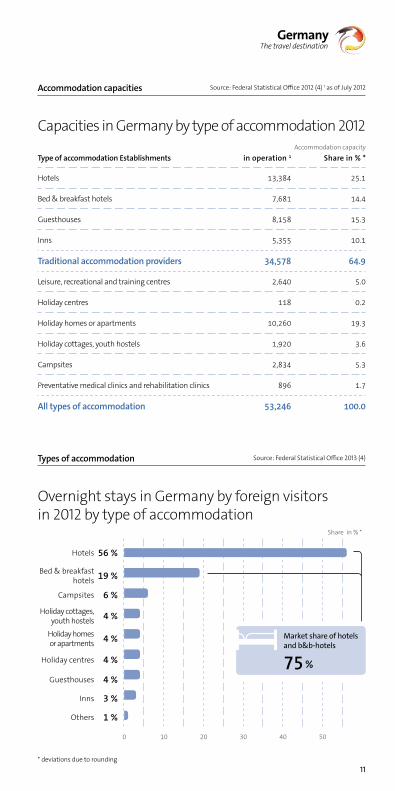
Accommodation capacities Source: Federal Statistical Office 2012 (4) 1 as of July 2012
Capacities in Germany by type of accommodation 2012Accommodation capacity
Type of accommodation Establishments in operation 1 Share in % *
Hotels 13,384 25.1
Bed & breakfast hotels 7,681 14.4
Guesthouses 8,158 15.3
Inns 5,355 10.1
Traditional accommodation providers 34,578 64.9
Leisure, recreational and training centres 2,640 5.0
Holiday centres 118 0.2
Holiday homes or apartments 10,260 19.3
Holiday cottages, youth hostels 1,920 3.6
Campsites 2,834 5.3
Preventative medical clinics and rehabilitation clinics 896 1.7
All types of accommodation 53,246 100.0
Types of accommodation Source: Federal Statistical Office 2013 (4)
Overnight stays in Germany by foreign visitors in 2012 by type of accommodation
Share in % *
Hotels 56 %
Bed & breakfast hotels 19 %
Campsites 6 %
Holiday cottages, youth hostels 4 %
Holiday homes or apartments 4 %
Holiday centres 4 %
Guesthouses 4 %
Inns 3 %
Others 1 %
* deviations due to rounding
%
Market share of hotels and b&b-hotels
GERMANY
12
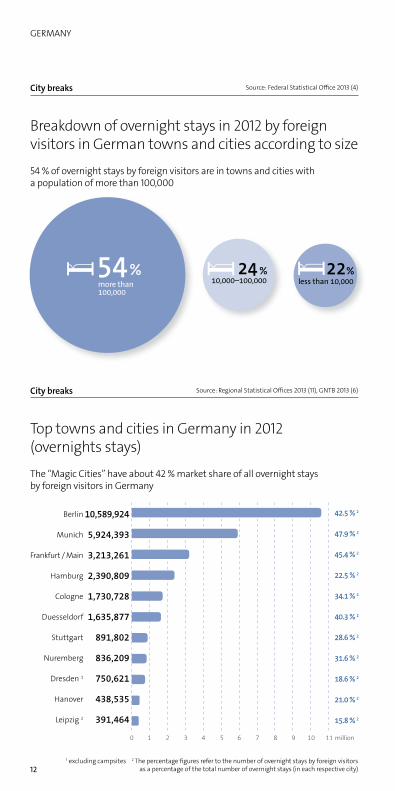
City breaks Source: Federal Statistical Office 2013 (4)
Breakdown of overnight stays in 2012 by foreign visitors in German towns and cities according to size
54 % of overnight stays by foreign visitors are in towns and cities with a population of more than 100,000
City breaks Source: Regional Statistical Offices 2013 (11), GNTB 2013 (6)
Top towns and cities in Germany in 2012 (overnights stays)
The “Magic Cities” have about 42 % market share of all overnight stays by foreign visitors in Germany
Berlin 10,589,924
Munich 5,924,393
Frankfurt / Main 3,213,261
Hamburg 2,390,809
Cologne 1,730,728
Duesseldorf 1,635,877
Stuttgart 891,802
Nuremberg 836,209
Dresden 1 750,621
Hanover 438,535
Leipzig 2 391,464
1 excluding campsites 2 The percentage figures refer to the number of overnight stays by foreign visitors as a percentage of the total number of overnight stays (in each respective city)
million
42.5 %
47.9 %
45.4 %
22.5 %
34.1 %
40.3 %
28.6 %
31.6 %
18.6 %
21.0 %
15.8 %
% % % more than 100,000
10,000–100,000 less than 10,000
13
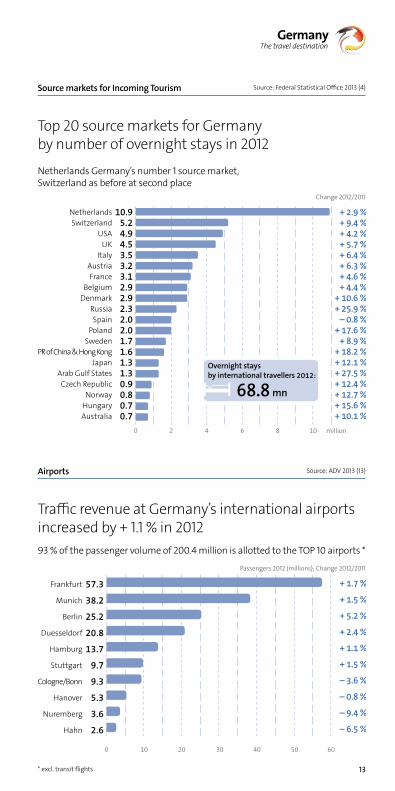
Source markets for Incoming Tourism Source: Federal Statistical Office 2013 (4)
Top 20 source markets for Germany by number of overnight stays in 2012
Netherlands Germany’s number 1 source market, Switzerland as before at second place
Change 2012/2011
Netherlands 10.9Switzerland 5.2
USA 4.9UK 4.5
Italy 3.5Austria 3.2France 3.1
Belgium 2.9Denmark 2.9
Russia 2.3Spain 2.0
Poland 2.0Sweden 1.7
PR of China & Hong Kong 1.6Japan 1.3
Arab Gulf States 1.3Czech Republic 0.9
Norway 0.8Hungary 0.7Australia 0.7
Airports Source: ADV 2013 (13)
Traffic revenue at Germany’s international airports increased by + 1.1 % in 201293 % of the passenger volume of 200.4 million is allotted to the TOP 10 airports *
Passengers 2012 (millions); Change 2012/2011
Frankfurt 57.3
Munich 38.2
Berlin 25.2
Duesseldorf 20.8
Hamburg 13.7
Stuttgart 9.7
Cologne/Bonn 9.3
Hanover 5.3
Nuremberg 3.6
Hahn 2.6
* excl. transit flights
million
mn
+ 2.9 %+ 9.4 %+ 4.2 %+ 5.7 %+ 6.4 %+ 6.3 %+ 4.6 %+ 4.4 %
+ 10.6 %+ 25.9 %
– 0.8 %+ 17.6 %
+ 8.9 %+ 18.2 %+ 12.1 %+ 27.5 %+ 12.4 %+ 12.7 %+ 15.6 %+ 10.1 %
68.8Overnight stays by international travellers 2012:
+ 1.7 %
+ 1.5 %
+ 5.2 %
+ 2.4 %
+ 1.1 %
+ 1.5 %
– 3.6 %
– 0.8 %
– 9.4 %
– 6.5 %
GERMANY
14
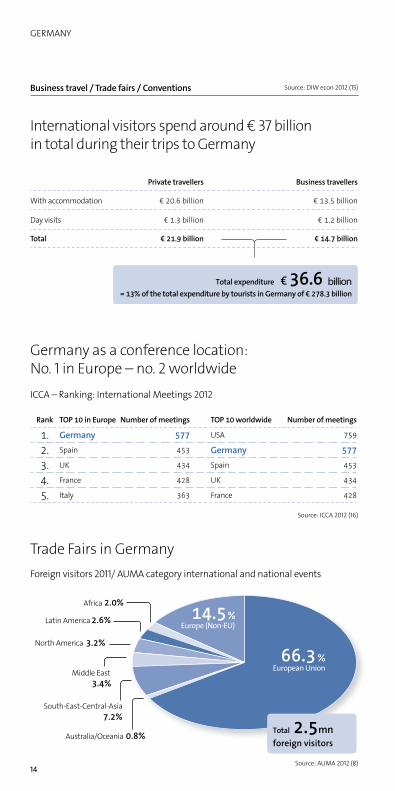
Business travel / Trade fairs / Conventions Source: DIW econ 2012 (15)
International visitors spend around € 37 billion in total during their trips to Germany
Private travellers Business travellers
With accommodation € 20.6 billion € 13.5 billion
Day visits € 1.3 billion € 1.2 billion
Total € 21.9 billion € 14.7 billion
Germany as a conference location: No. 1 in Europe – no. 2 worldwideICCA – Ranking: International Meetings 2012
Rank TOP 10 in Europe Number of meetings TOP 10 worldwide Number of meetings
1. Germany 577 USA 759
2. Spain 453 Germany 577
3. UK 434 Spain 453
4. France 428 UK 434
5. Italy 363 France 428
Source: ICCA 2012 (16)
Trade Fairs in GermanyForeign visitors 2011/ AUMA category international and national events
Source: AUMA 2012 (8)
7.2%
3.4%
Total mnforeign visitors
Africa
Middle East
Latin America
North America
Australia/Oceania
South-East-Central-Asia
% European Union
% Europe (Non-EU)
2.0%
2.6%
3.2%
0.8%
14.5
66.3
2.5
Total expenditure= 13% of the total expenditure by tourists in Germany of € 278.3 billion
billion € 36.6

15
Business trips by Europeans
total in mn
Traditional business trips Promotable business trips (Meeting/Incentive/Convention/Exhibition)
61.5
6.3
2.1
2.1
1.9
1.4
1.5
1.3
0.9
0.9
0.7
6.2
2.4
2.4
1.4
1.7
1.4
1.3
1.0
0.8
0.7
Business travel destinations for Europeans Source: GNTB/WTM 2013 (5)
Germany leads the way among the top ten business travel destinations for Europeans
business trips in million
Germany 12.5
France 4.5
Great Britain 4.5
Austria 3.3
Spain 3.1
Italy 2.9
USA 2.6
Netherlands 1.9
China 1.5
Sweden 1.5
Types of business trips Source: GNTB/WTM 2013 (5)
Breakdown of European business travel volume into different types of business trips to Germany 2012
6.2 million promotable business tripsShare (change to 2011)
Incentives(+/− 0 %-Points)(+/− 0 %-Points)
Total volume
mn trips
% Traditional business trips (− 3 %-Points)
% Promotable business trips (+ 3 %-Points)
% Conferences / congresses (+ 2 %-Points)
% Trade fairs and exhibitions
50
26
5012.5
EUROPEANS IN GERMANY
16
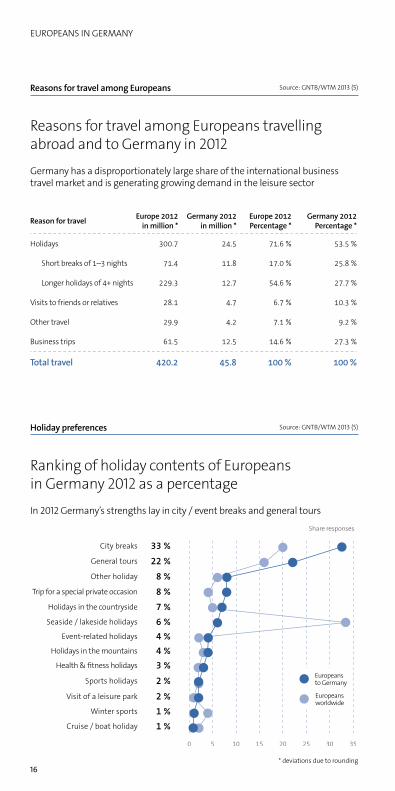
Reasons for travel among Europeans Source: GNTB/WTM 2013 (5)
Reasons for travel among Europeans travelling abroad and to Germany in 2012
Germany has a disproportionately large share of the international business travel market and is generating growing demand in the leisure sector
Reason for travel Europe 2012 in million *
Germany 2012 in million *
Europe 2012 Percentage *
Germany 2012 Percentage *
Holidays 300.7 24.5 71.6 % 53.5 %
Short breaks of 1–3 nights 71.4 11.8 17.0 % 25.8 %
Longer holidays of 4+ nights 229.3 12.7 54.6 % 27.7 %
Visits to friends or relatives 28.1 4.7 6.7 % 10.3 %
Other travel 29.9 4.2 7.1 % 9.2 %
Business trips 61.5 12.5 14.6 % 27.3 %
Total travel 420.2 45.8 100 % 100 %
Holiday preferences Source: GNTB/WTM 2013 (5)
Ranking of holiday contents of Europeans in Germany 2012 as a percentage
In 2012 Germany’s strengths lay in city / event breaks and general tours
Share responses
City breaks 33 %General tours 22 %Other holiday 8 %
Trip for a special private occasion 8 %Holidays in the countryside 7 %Seaside / lakeside holidays 6 %
Event-related holidays 4 %Holidays in the mountains 4 %
Health & fitness holidays 3 %Sports holidays 2 %
Visit of a leisure park 2 %Winter sports 1 %
Cruise / boat holiday 1 %
* deviations due to rounding
Europeans to Germany
Europeans worldwide
17
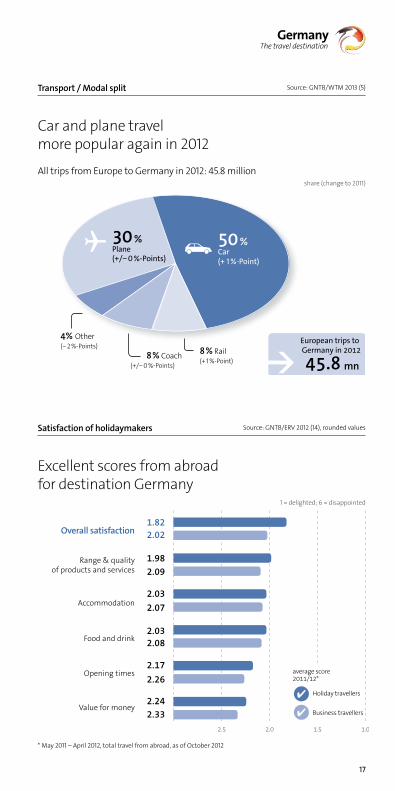
Transport / Modal split Source: GNTB/WTM 2013 (5)
Car and plane travel more popular again in 2012
All trips from Europe to Germany in 2012: 45.8 millionshare (change to 2011)
Satisfaction of holidaymakers Source: GNTB/ERV 2012 (14), rounded values
Excellent scores from abroad for destination Germany
1 = delighted; 6 = disappointed
Overall satisfaction 1.822.02
Range & quality of products and services
1.982.09
Accommodation 2.032.07
Food and drink2.032.08
Opening times2.172.26
Value for money2.242.33
* May 2011 – April 2012, total travel from abroad, as of October 2012
Holiday travellers
average score
Business travellers
2.5 2.0 1.5 1.0
% Plane (+/− 0 %-Points)
% Car (+ 1 %-Point)
Coach (+/− 0 %-Points)
Other (− 2 %-Points)
Rail (+ 1 %-Point) mn
European trips to Germany in 2012
45.84 %
EUROPEANS IN GERMANY
18
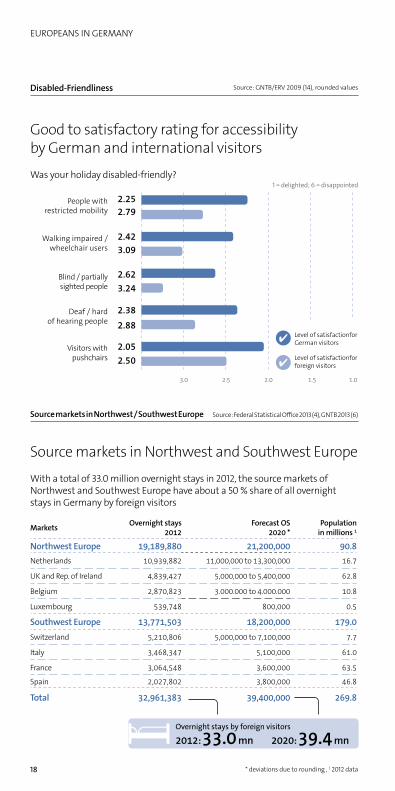
Disabled-Friendliness Source: GNTB/ERV 2009 (14), rounded values
Good to satisfactory rating for accessibility by German and international visitors
Was your holiday disabled-friendly?1 = delighted; 6 = disappointed
People with restricted mobility
2.252.79
Walking impaired / wheelchair users
2.423.09
Blind / partially sighted people
2.623.24
Deaf / hard of hearing people
2.38
2.88
Visitors with pushchairs
2.052.50
Source markets in Northwest / Southwest Europe Source: Federal Statistical Office 2013 (4), GNTB 2013 (6)
Source markets in Northwest and Southwest Europe
With a total of 33.0 million overnight stays in 2012, the source markets of Northwest and Southwest Europe have about a 50 % share of all overnight stays in Germany by foreign visitors
Markets Overnight stays 2012
Forecast OS 2020 *
Population in millions 1
Northwest Europe 19,189,880 21,200,000 90.8Netherlands 10,939,882 11,000,000 to 13,300,000 16.7
UK and Rep. of Ireland 4,839,427 5,000,000 to 5,400,000 62.8
Belgium 2,870,823 3.000.000 to 4.000.000 10.8
Luxembourg 539,748 800,000 0.5
Southwest Europe 13,771,503 18,200,000 179.0Switzerland 5,210,806 5,000,000 to 7,100,000 7.7
Italy 3,468,347 5,100,000 61.0
France 3,064,548 3,600,000 63.5
Spain 2,027,802 3,800,000 46.8
Total 32,961,383 39,400,000 269.8
* deviations due to rounding , 1 2012 data
Level of satisfactionfor German visitors
Level of satisfactionfor foreign visitors
3.0 2.5 2.0 1.5 1.0
Overnight stays by foreign visitors
mn mn33.0 39.4
19
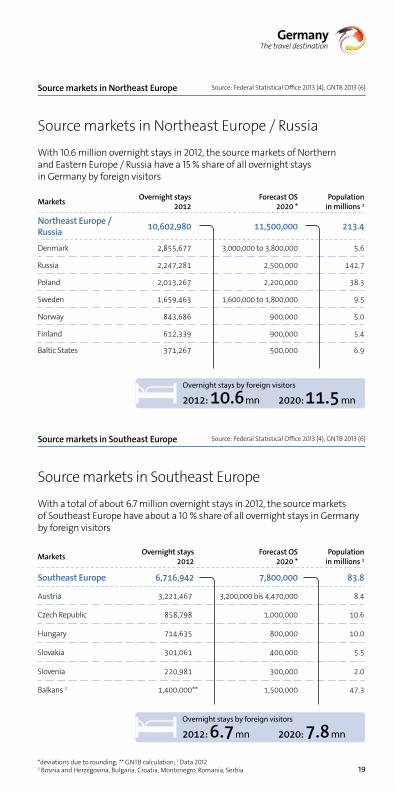
Source markets in Northeast Europe Source: Federal Statistical Office 2013 (4), GNTB 2013 (6)
Source markets in Northeast Europe / Russia
With 10.6 million overnight stays in 2012, the source markets of Northern and Eastern Europe / Russia have a 15 % share of all overnight stays in Germany by foreign visitors
Markets Overnight stays 2012
Forecast OS 2020 *
Populationin millions 1
Northeast Europe / Russia 10,602,980 11,500,000 213.4
Denmark 2,855,677 3,000,000 to 3,800,000 5.6
Russia 2,247,281 2,500,000 142.7
Poland 2,013,267 2,200,000 38.3
Sweden 1,659,463 1,600,000 to 1,800,000 9.5
Norway 843,686 900,000 5.0
Finland 612,339 900,000 5.4
Baltic States 371,267 500,000 6.9
Source markets in Southeast Europe Source: Federal Statistical Office 2013 (4), GNTB 2013 (6)
Source markets in Southeast Europe
With a total of about 6.7 million overnight stays in 2012, the source markets of Southeast Europe have about a 10 % share of all overnight stays in Germany by foreign visitors
Markets Overnight stays 2012
Forecast OS 2020 *
Populationin millions 1
Southeast Europe 6,716,942 7,800,000 83.8
Austria 3,221,467 3,200,000 bis 4,470,000 8.4
Czech Republic 858,798 1,000,000 10.6
Hungary 714,635 800,000 10.0
Slovakia 301,061 400,000 5.5
Slovenia 220,981 300,000 2.0
Balkans 2 1,400,000** 1,500,000 47.3
*deviations due to rounding; ** GNTB calculation; 1 Data 2012 2 Bosnia and Herzegovina, Bulgaria, Croatia, Montenegro, Romania, Serbia
Overnight stays by foreign visitors
mn mn10.6 11.5
Overnight stays by foreign visitors
mn mn6.7 7.8
EUROPEANS / US AMERICANS IN GERMANY
20
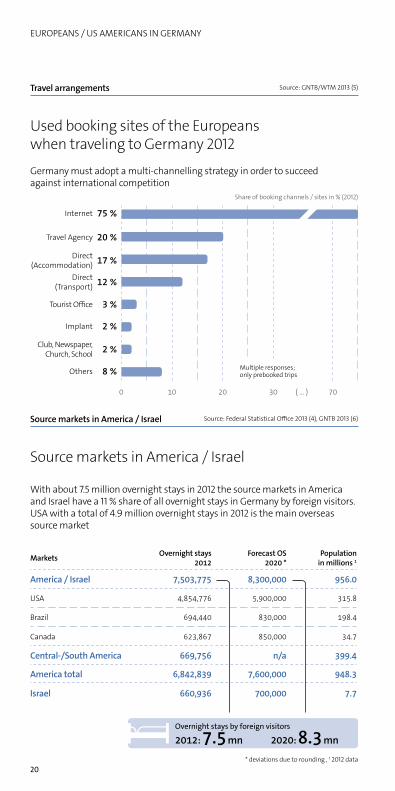
Travel arrangements Source: GNTB/WTM 2013 (5)
Used booking sites of the Europeans when traveling to Germany 2012
Germany must adopt a multi-channelling strategy in order to succeed against international competition
Share of booking channels / sites in % (2012)
Internet 75 %
Travel Agency 20 %
Direct (Accommodation) 17 %
Direct (Transport) 12 %
Tourist Office 3 %
Implant 2 %
Club, Newspaper, Church, School 2 %
Others 8 %
Source markets in America / Israel Source: Federal Statistical Office 2013 (4), GNTB 2013 (6)
Source markets in America / Israel
With about 7.5 million overnight stays in 2012 the source markets in America and Israel have a 11 % share of all overnight stays in Germany by foreign visitors. USA with a total of 4.9 million overnight stays in 2012 is the main overseas source market
Markets Overnight stays 2012
Forecast OS 2020 *
Population in millions 1
America / Israel 7,503,775 8,300,000 956.0
USA 4,854,776 5,900,000 315.8
Brazil 694,440 830,000 198.4
Canada 623,867 850,000 34.7
Central-/South America 669,756 n/a 399.4
America total 6,842,839 7,600,000 948.3
Israel 660,936 700,000 7.7
* deviations due to rounding , 1 2012 data
( … )
Multiple responses; only prebooked trips
Overnight stays by foreign visitors
mn mn7.5 8.3
21
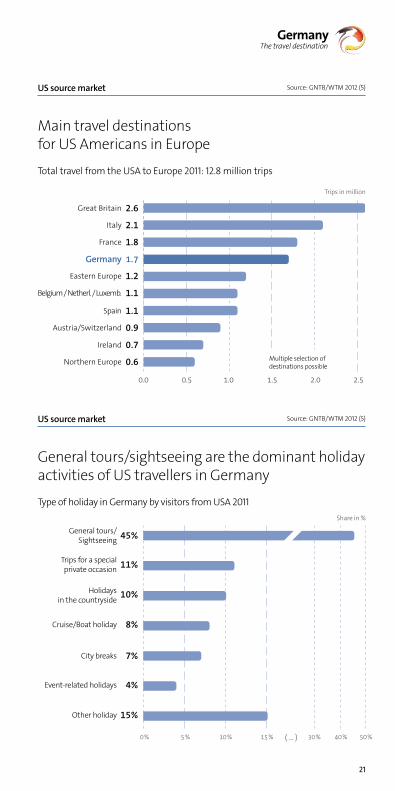
US source market Source: GNTB/WTM 2012 (5)
Main travel destinations for US Americans in Europe
Total travel from the USA to Europe 2011: 12.8 million trips
Trips in million
Great Britain 2.6
Italy 2.1
France 1.8
Germany 1.7
Eastern Europe 1.2
Belgium / Netherl. / Luxemb. 1.1
Spain 1.1
Austria/Switzerland 0.9
Ireland 0.7
Northern Europe 0.6
US source market Source: GNTB/WTM 2012 (5)
General tours/sightseeing are the dominant holiday activities of US travellers in Germany
Type of holiday in Germany by visitors from USA 2011Share in %
General tours/ Sightseeing 45%
Trips for a special private occasion 11%
Holidays in the countryside 10%
Cruise/Boat holiday 8%
City breaks 7%
Event-related holidays 4%
Other holiday 15%
Multiple selection of destinations possible
0.0 0.5 1.0 1.5 2.0 2.5
% % % % % % %( … )
ASIA / WORLD
22
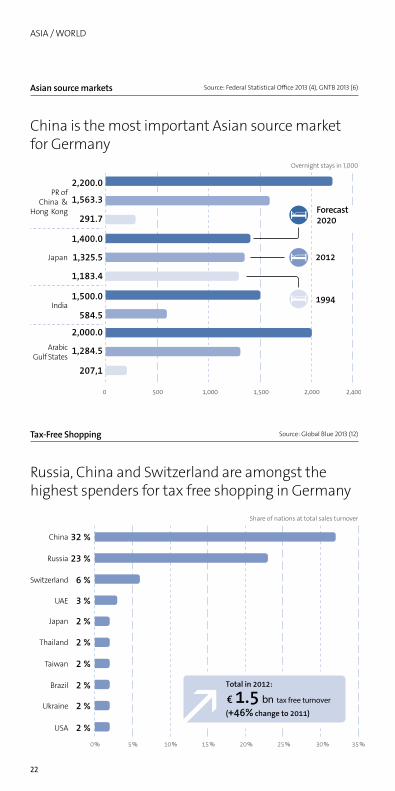
Asian source markets Source: Federal Statistical Office 2013 (4), GNTB 2013 (6)
China is the most important Asian source market for Germany
Overnight stays in 1,000
PR of China &
Hong Kong
2,200.0
1,563.3
291.7
Japan
1,400.0
1,325.5
1,183.4
India1,500.0
584.5
Arabic Gulf States
2,000.0
1,284.5
207,1
Tax-Free Shopping Source: Global Blue 2013 (12)
Russia, China and Switzerland are amongst the highest spenders for tax free shopping in Germany
Share of nations at total sales turnover
China 32 %
Russia 23 %
Switzerland 6 %
UAE 3 %
Japan 2 %
Thailand 2 %
Taiwan 2 %
Brazil 2 %
Ukraine 2 %
USA 2 %
Forecast
0 500 1,000 1,500 2,000 2,400
% % % % % % % %
tax free turnoverbn
Total in 2012:
€ 1.5(+46% change to 2011)
23
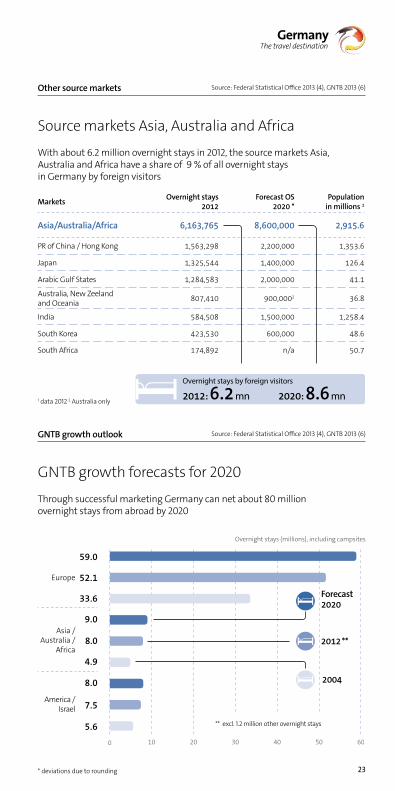
Other source markets Source: Federal Statistical Office 2013 (4), GNTB 2013 (6)
Source markets Asia, Australia and Africa
With about 6.2 million overnight stays in 2012, the source markets Asia, Australia and Africa have a share of 9 % of all overnight stays in Germany by foreign visitors
Markets Overnight stays 2012
Forecast OS 2020 *
Population in millions 1
Asia/Australia/Africa 6,163,765 8,600,000 2,915.6
PR of China / Hong Kong 1,563,298 2,200,000 1,353.6
Japan 1,325,544 1,400,000 126.4
Arabic Gulf States 1,284,583 2,000,000 41.1
Australia, New Zeeland and Oceania 807,410 900,0002 36.8
India 584,508 1,500,000 1,258.4
South Korea 423,530 600,000 48.6
South Africa 174,892 n/a 50.7
1 data 2012 2 Australia only
GNTB growth outlook Source: Federal Statistical Office 2013 (4), GNTB 2013 (6)
GNTB growth forecasts for 2020
Through successful marketing Germany can net about 80 million overnight stays from abroad by 2020
Overnight stays (millions), including campsites
Europe
59.0
52.1
33.6
Asia / Australia /
Africa
9.0
8.0
4.9
America / Israel
8.0
7.5
5.6
* deviations due to rounding
Overnight stays by foreign visitors
mn mn6.2 8.6
**
Forecast
** excl. 1.2 million other overnight stays
www.germany.travel
German National Tourist Board
Working on behalf of the federal government, the German National Tourist Board, based in Frankfurt am Main, has been planning, coordinating and implementing activities for marketing Germany abroad for more than 50 years.
The aims of the GNTB with its 6 regional managements and its 30 foreign representative offices / sales and marketing agencies include:
� Strengthening the economic position of Germany � Increasing the volume of tourism � Increasing tourism exports.
As a registered non-profit organisation, the GNTB is committed to transparency and efficiency rather than commercial gain.
Sources
1 UNWTO World Tourism Organization, World Tourism Barometer 1 / 2013, Madrid 2013
2 EUROSTAT, Luxembourg 2013
3 World Economic Forum, Travel & Tourism Competitiveness Report 2013, Geneva 2013
4 Federal Statistical Office, Annual Reports and Monthly Reports 1995 to 2012, Wiesbaden 2013
5 GNTB / IPK-International, World Travel Monitor, Malta 2012, 2013
6 GNTB Market Research, Frankfurt 2012, 2013
7 GNTB / Anholt-GfK Roper Nation-Brands- Index 2012, USA 2012
8 Association of the German Trade Fair Industry (AUMA), Messe-Trend, Key Figures, Berlin 2012
9 Meeting- und Event Barometer of EITW commissioned by EVVC, GCB, GNTB; Wernigerode 2011, 2012
10 German International Hotel Association (IHA) / STR Global, Berlin 2013
11 Regional Statistical Offices 2013
12 Global Blue Germany, Duesseldorf 2013
13 ADV (German Airports Association), Berlin 2013
14 GNTB / Europäische Reiseversicherung AG, Qualitätsmonitor Deutschland-Tourismus, (Quality Monitoring of German Tourism) Frankfurt, Munich 2010–2012
15 BTW/BMWi, DIW econ, Berlin 2012
16 ICCA, Amsterdam 2012
Copyrights
Page 2: © Getty ImagesPage 3: © Achim Mende, TMBW © Jochen Knobloch, www.aeroverde.eu
Imprint
Published by:
German National Tourist Board (GNTB)