Real Estate Advertiser - Niagara Region - Niagara May 5, 2016

Niagara Region Housing Market Analysis Trends, current state and forecasts, 1996-2041
June 2019

Niagara Region Housing Market Analysis
Page | 2
ABOUT THE CANADIAN CENTRE FOR
ECONOMIC ANALYSIS
The Canadian Centre for Economic Analysis
(CANCEA) is a socio-economic analytics and data
firm. CANCEA provides objective, independent
and high data intensity analysis and consulting
services.
CANCEA uses modern techniques in data science,
including agent-based modelling, for econometric
analysis, risk management assessments, and
estimating current and future population and
household characteristics. CANCEA’s field
expertise includes market analysis, policy
evaluation, business model optimization, cost-
effectiveness and rate-of-return analysis,
macroeconomic analysis, insurance risk
evaluation, land use and infrastructure planning,
logistics, and labour market analysis. CANCEA also
provides comprehensive Canadian data services.
At the centre of CANCEA’s analytical capabilities is
an agent-based platform called Prosperity at Risk®
that is an extensive, data-driven model of 56,000
locations across Canada. Given the systems focus
behind all of CANCEA’s work, CANCEA has a one-
model approach to its analysis which allows
various disciplines and stakeholders to be
incorporated into a single analysis.
©2019 Canadian Centre for Economic Analysis
Printed in Canada • All rights reserved
ISBN: 978-1-989077-12-2
ABOUT THE REPORT
CANCEA does not accept any research funding or
client engagements that require a pre-determined
result or policy stance, or otherwise inhibits its
independence.
In keeping with CANCEA’s guidelines for funded
research, the design and method of research, as
well as the content of this study, were determined
solely by CANCEA.
This information is not intended as specific
investment, accounting, legal or tax advice.
Citation: Niagara Region Housing Market Analysis.
CANCEA. June, 2019.

Niagara Region Housing Market Analysis
Page | 3
TABLE OF CONTENTS List of Figures ................................................................................................................................................ 4 List of Tables ................................................................................................................................................. 5 Glossary ......................................................................................................................................................... 6 Findings at a Glance ...................................................................................................................................... 8
Demographics ........................................................................................................................................... 8 Housing Stock ............................................................................................................................................ 8 Housing Need ............................................................................................................................................ 8
1.0 Introduction ...................................................................................................................................... 9 1.1 Objectives...................................................................................................................................... 9 1.2 Methodology ................................................................................................................................. 9
2.0 Population and Households ............................................................................................................ 11 2.1 Demographic Trends ................................................................................................................... 11 2.2 Employment and Incomes .......................................................................................................... 12 2.3 Concluding Remarks .................................................................................................................... 17
3.0 Housing Stock .................................................................................................................................. 18 3.1 Dwelling Types and Tenure ......................................................................................................... 18 3.2 Shelter Prices .............................................................................................................................. 20 3.3 Concluding Remarks .................................................................................................................... 23
4.0 Housing Need .................................................................................................................................. 24 4.1 Core Housing Need ..................................................................................................................... 24 4.2 Affordability ................................................................................................................................ 27 4.3 Concluding Remarks .................................................................................................................... 31
5.0 Sub Population Focus ...................................................................................................................... 32 5.1 Older Adults ................................................................................................................................ 32 5.2 Single-Person Households ........................................................................................................... 34 5.3 Lone Parent Households ............................................................................................................. 35 5.4 Immigrant and Aboriginal Populations & Other Priority Subgroups .......................................... 36 5.5 Concluding Remarks .................................................................................................................... 41
6.0 Consultation Feedback .................................................................................................................... 43 6.1 What We Heard .......................................................................................................................... 43 6.2 Local Policy Interests ................................................................................................................... 43 6.3 Data Gaps .................................................................................................................................... 44
7.0 Key Take-Aways .............................................................................................................................. 45 A. Appendix: Comparison Tables ............................................................................................................ 46
A.1. Within Niagara Region ................................................................................................................ 46 A.2. Neighbouring Municipalities ....................................................................................................... 50

Niagara Region Housing Market Analysis
Page | 4
LIST OF FIGURES
Households by age and type, 2016 ......................................................................................... 11
Population by age and sex, 2016 and 2041 ............................................................................ 12
Average and median individual incomes, 2016 ...................................................................... 13
Median household income by dissemination area (legend in $), 2016 .................................. 13
Top 5 occupation types, 2016 ................................................................................................. 15
Gender and age of employment income recipients with a total income in deciles 1 to 4 ..... 16
Education level of individuals with a total income in deciles 1 to 4 by gender ...................... 16
Employment trends and projections, 2001-2041 ................................................................... 17
Housing density by tenure, 2016 ............................................................................................ 18
Percentage of rental stock by dissemination area, 2016 ........................................................ 19
Tenure by household type, 2016 ............................................................................................ 19
Average rents by number of bedrooms reported by CMHC, 1996-2018 ............................... 21
Market rents reported by Padmapper, 2016-2019 ................................................................ 21
CMHC primary rental vacancy rates by number of bedrooms, 2014-2018 ............................ 22
Core housing need, share by household type, 2016 ............................................................... 24
Core housing need indicators by tenure (number of households), 2016 ............................... 25
Core housing need indicators by tenure (percentage of households), 2016 ......................... 26
Affordability matrix – Owners, 2016 ....................................................................................... 28
Affordability matrix – Renters, 2016 ....................................................................................... 29
Percentage of households spending over 30% of income on housing by DA, 2016 ............... 30
Share of population over 65 by dissemination area, 2016 ..................................................... 32
Older adult core housing need indicators (number of households) by age, 2016 ................. 33
Older adult core housing need indicators (percentage of households) by age, 2016 ............ 33
Single-person households in core need by age, 2016............................................................. 34
Lone-parent households in core need by age, 2016 ............................................................... 35
Lone parent core housing indicators by tenure (number of households), 2016 .................... 36
Lone parent core housing indicators by tenure (percentage of households), 2016 .............. 36
Population that immigrated before year 2001 by income level, 2016 ................................... 37
Population that immigrated in year 2001 or later by income level , 2016 ............................. 38
Non-immigrant population by income level, 2016 ................................................................. 38
Aboriginal-identifying population by age, 1996-2016 ............................................................ 39
Income, aboriginal-identifying population (CMA), 2016 ........................................................ 40

Niagara Region Housing Market Analysis
Page | 5
Share of population with any income and employment income, (CMA), 2016 ..................... 40
Population living in unsuitable dwelling by age and aboriginal identity, 2016 ...................... 41
LIST OF TABLES
Individual and household income deciles for Niagara Region, 2016 ...................................... 14
Housing stock by dwelling type, 2016 ..................................................................................... 18
Self-reported dwelling values, 2001-2016 (CMA) ................................................................... 20
Recent market prices, 2016-2019 ........................................................................................... 20
Affordable housing units by mandate and type, 2019 ........................................................... 23
Households in core need by household type, 2016 ................................................................ 24
Core housing need by age of household maintainer and tenure, 2016 ................................. 26
Households in core housing need by decile, 2016 .................................................................. 27
Households spending over 30% of income on shelter, 2016 .................................................. 30
Percent of older adult households of given type in core housing need, 2016 ....................... 34
Percent of older adult households spending over 30% of income on shelter, 2016 .............. 34

Niagara Region Housing Market Analysis
Page | 6
GLOSSARY
Census Household: Contains at least one census family.
Census Family: Defined as a married couple or a couple living common law, with or without children of
either and/or both spouses; or a lone parent of any marital status with at least one child living in the same
dwelling. Grandchildren living with their grandparent(s) but no parents are also considered a census
family.
CMA: Stands for Urban Census Metropolitan Area, defined by Statistics Canada as an area consisting of
one or more neighbouring municipalities situated around a major urban core.
CMHC: Stands for Canada Mortgage and Housing Corporation, a Crown Corporation of the Government
of Canada that acts as Canada’s national housing agency.
Core Housing Need: According to CMHC, a household is said to be in core housing need if its housing falls
below at least one of the adequacy, affordability or suitability standards and it would have to spend 30%
or more of its total before-tax income to pay the median rent of alternative local housing that is acceptable
(meets all three housing standards). Housing standards are defined as follows:
Adequate housing is reported by residents as not requiring any major repairs.
Affordable housing costs less than 30% of total before-tax household income.
Suitable housing has enough bedrooms for the size and makeup of resident households,
according to National Occupancy Standard requirements.
DA: Stands for Dissemination Area, a small area composed of one or more neighbouring dissemination
blocks with a population of 400 to 700 persons. This is a geographical resolution used by Statistics Canada.
High-Density Housing: Units in apartment buildings of five storeys or more. In some situations, housing is
mixed with other uses.
LIM-AT: Stands for low-income measure, after tax, and is a metric for determining whether a household
falls below a low-income threshold specific to the household size, based on whether its income is below
50% or median adjusted after-tax income.
Low-Density Housing: Single-detached and semi-detached housing.
MCR: Stands for Municipal Comprehensive Review, a new official plan, or an official plan amendment,
initiated by an upper- or single-tier municipality under section 26 of the Planning Act that
comprehensively applies the policies and schedules of the Provincial Growth Plan.
Medium-Density Housing: Units in row houses, duplex apartments, and apartment buildings of four
storeys or less.

Niagara Region Housing Market Analysis
Page | 7
Multiple-Family Households: Households that consist of two or more census families. There may also be
persons who are not in a census family in this type of household.
National Occupancy Standard: A standard developed by CMHC through consultations with provincial
governments which is used to determine the number of bedrooms required by a household in order to be
suitably housed.
Non-Census Household: Comprises a single person or two or more persons in a non-census family.
Primary Household Maintainer: The first person in the household identified as someone who pays the
rent or mortgage, the taxes, or the electricity bill, and so on, for the dwelling.
St. Catharines-Niagara CMA: Comprises the municipalities of St. Catharines, Niagara Falls, Welland, Fort
Erie, Lincoln, Port Colborne, Thorold, Pelham, Niagara-on-the-Lake and Wainfleet.

Niagara Region Housing Market Analysis
Page | 8
FINDINGS AT A GLANCE
The aim of this study was to develop the Niagara Housing Statement Database in support of the Regional
Housing Study and Housing and Homelessness Action Plan. It compiles the available information about
the current stock of rental, ownership and affordable housing in Niagara Region by type and location. This
information is combined with data about the households themselves, including the type of household,
income level, age of household maintainer, and whether the household faces core housing need or
affordability challenges. The study also provides a forecast to 2041 of the future housing stock based on
the Provincial Growth Plan projections as of May 2019 and current economic trends.
DEMOGRAPHICS
Niagara Region is facing unique challenges relative to much of Ontario. It already has a significantly older
population than the province, and this demographic aging is expected to continue to trend upwards in
the future. The population aged 65 years or older is expected to more than double by 2041. Single-person
households are the dominant type of households, a trend which is also expected to continue as the
population ages and household sizes decrease.
HOUSING STOCK
Niagara Region’s housing stock is primarily low-density. Single-detached homes are the most common
dwelling type, followed by low-rise apartments and row houses. Medium- and high-density housing
represents 24% of the total stock and houses 71% of the renter population.
HOUSING NEED
Core housing need affects 13% of households in Niagara Region, or approximately 24,000 households,
according to the most recent figures. Renter households are in core housing need at three times the rate
of owner households and also live in unsuitable, unaffordable and inadequate dwellings at higher rates
than their owner counterparts. Of these components of housing need, affordability is the main challenge
in the Region, as rates of housing unsuitability and inadequacy are low overall. Almost all households
affected by core housing need are in the lower 4 income deciles, and of these, the majority are in deciles
1 and 2, earning less than $29,500 per year.
Similar rates of core housing need exist across most ages of household maintainers. Rates are slightly
higher for households with a maintainer younger than 35 or older than 84. The household types
predominantly affected are single-person households, which are the large majority of households in core
housing need, and lone-parent households.

Niagara Region Housing Market Analysis
Page | 9
1.0 INTRODUCTION
1.1 OBJECTIVES
The aim of this study was to develop the Niagara Housing Statement Database in support of the Regional
Housing Study and Housing and Homelessness Action Plan. It compiles the available information about
the current stock of rental, ownership and affordable housing in Niagara Region by type and location. This
information is combined with data about the households themselves, including the type of household,
income level, age of household maintainer, and whether the household faces core housing need or
affordability challenges. The study also provides a forecast to 2041 of the future housing stock based on
the Provincial Growth Plan projections as of May 2019 and current economic trends.
Through the course of this study, working with Niagara Region, CANCEA:
Created a comprehensive dataset that:
o combines housing and demographic data in one place for use by Regional and local
municipal planners and policymakers; and
o includes historical forecasts and projections up to 2041 for key housing and
demographic metrics.
Conducted a housing need analysis to determine:
o how many households are in core need;
o how many households face affordability challenges; and
o which groups are facing pressure in the ownership and rental markets.
Consulted with local municipalities to:
o confirm that data capture was representative of the local experience;
o identify any relevant gaps;
o provide training on the use of the database; and
o determine the main scenarios of interest to test for the next study phase (scenario-
based analysis).
Presented findings to the Niagara Region Planning and Economic Development Committee.
This report is intended to provide a curated selection of representative housing and demographic data,
along with graphs and tables to easily visualize this information, and to summarize key findings from the
study.
1.2 METHODOLOGY
The Regional dataset was created using CANCEA’s statistical analysis and data simulation platform, which
makes use of 15 years’ worth of community-level data housed in a linked-path agent database covering
55,000 regions across Canada. The platform is regularly updated to include the most recent Statistics
Canada datasets and census information.

Niagara Region Housing Market Analysis
Page | 10
The population projections have been aligned to the Provincial Places to Grow targets as well as the
numbers generated by the Municipal Comprehensive Review. These population projections, along with
life expectancies and birth rates, are used to determine the number of households and the dwelling sizes
these would require under different conditions and over time.
Information about the current housing stock, the way in which the current population is housed
(affordability, suitability and adequacy) and dwelling formation rates (both market and non-market) are
used to assess the supply of housing over time.
This study and the accompanying dataset draw primarily from Statistics Canada census datasets and
CMHC tables. All population and household counts have been corrected for census undercounts. As a
result, these may be a few percent larger than those found in the census table. All income values are
presented in constant 2015 dollar figures to be consistent with the 2016 census results.
Additional data included was provided by Niagara Region, including:
o Provincial Policy Statement tables;
o Core housing need custom cuts; and
o Affordable housing data.
All figures, tables and statistics included in this report derive from these sources unless otherwise
specified.

Niagara Region Housing Market Analysis
Page | 11
2.0 POPULATION AND HOUSEHOLDS
2.1 DEMOGRAPHIC TRENDS
2.1.1 HOUSEHOLDS
In Niagara Region, single-person households are the most common type (31%)1, followed by couples
without children (28%) and with children (25%). The proportion of single-person households is 1.5 times
the provincial average. Additionally, 41% of singles are 65 years or older, which is 21% higher than the
rest of Ontario.
Households by age and type, 2016
1 Non-census households include all non-census family households (see glossary) and are predominantly single-person households. For simplicity this report will refer to non-census households as singles or single-person households moving forward.
0
5,000
10,000
15,000
20,000
25,000
30,000
35,000
40,000
45,000
15 to 24 25 to 34 35 to 44 45 to 54 55 to 64 65 to 74 75 to 84 85 andover
Household Maintainer Age by Type (2016)
25%
28%10%
6%
31%Couple, with children
Couple, without children
Lone-parent
Multiple-family
Singles

Niagara Region Housing Market Analysis
Page | 12
2.1.2 POPULATION TRENDS
The age profile of Niagara Region is expected to increasingly skew older as 2041 approaches. By 2041, it
is expected that the population aged 75 and older will be 50% larger than the 14 and under population.
At 180%, the growth rate of the cohort aged 75 years or older is at least 4 times larger than the growth
rate of any other cohort. The older population is projected to also skew female.
Population by age and sex, 2016 and 2041
2.2 EMPLOYMENT AND INCOMES
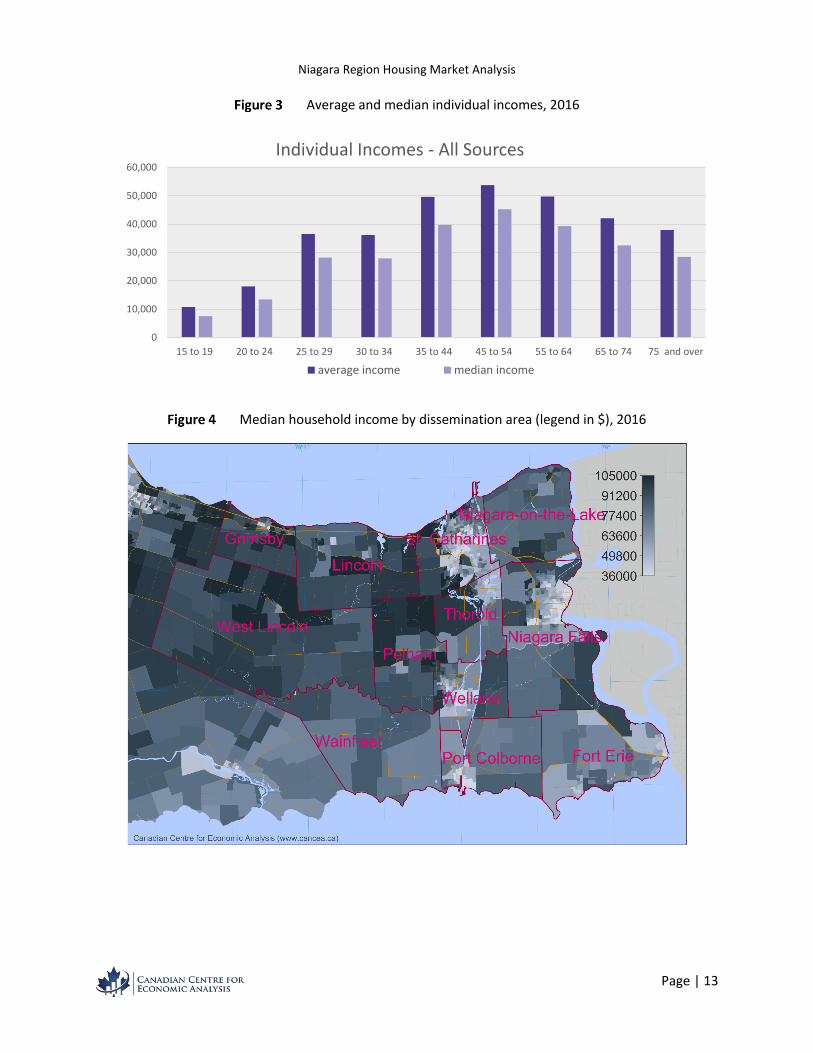
The average individual income in Niagara Region is $41,591, while the median income is $31,433. The
discrepancy between the average and the mean is an indication of the degree of income disparity in the
Region. Incomes are generally higher in the predominantly rural local municipalities and lower in the
larger cities, particularly near the downtown cores, as seen in Figure 4.
In this analysis, incomes are reported both at the individual and household level. To analyze differences
between individuals and households of different income levels, individual and household income deciles
are used. Each population (household) decile contains 10% of the Regional population (households). The
lower-bound income of each decile is the income of the person or household within the decile with the
lowest income, and the upper bound is the income of the person or household with the highest income.
Income deciles for Niagara Region are given in Table 1.
100,000 80,000 60,000 40,000 20,000 0 20,000 40,000 60,000 80,000 100,000
100,000 80,000 60,000 40,000 20,000 0 20,000 40,000 60,000 80,000 100,000
0 to 14
15 to 24
25 to 34
35 to 44
45 to 54
55 to 64
65 to 74
75 and over
Age Distribution: 2016 and 2041
Males (2041) Males (2016) Females (2041) Females (2016)
Niagara Region Housing Market Analysis
Page | 13
Average and median individual incomes, 2016
Median household income by dissemination area (legend in $), 2016
0
10,000
20,000
30,000
40,000
50,000
60,000
15 to 19 20 to 24 25 to 29 30 to 34 35 to 44 45 to 54 55 to 64 65 to 74 75 and over
Individual Incomes - All Sources
average income median income

Niagara Region Housing Market Analysis
Page | 14
Individual and household income deciles for Niagara Region, 2016
Individual Income Household Income
Decile 1 Less than $8,900 Less than $19,400
Decile 2 $8,900 to $13,999 $19,400 to $29,499
Decile 3 $14,000 to $19,099 $29,500 to $39,799
Decile 4 $19,100 to $24,799 $39,800 to $52,699
Decile 5 $24,800 to $31,399 $52,700 to $68,399
Decile 6 $31,400 to $38,999 $68,400 to $84,299
Decile 7 $39,000 to $48,999 $84,300 to $101,199
Decile 8 $49,000 to $62,799 $101,200 to $122,199
Decile 9 $62,800 to $85,799 $122,200 to $155,899
Decile 10 $85,800 or more $155,900 or more
2.2.1 OCCUPATION
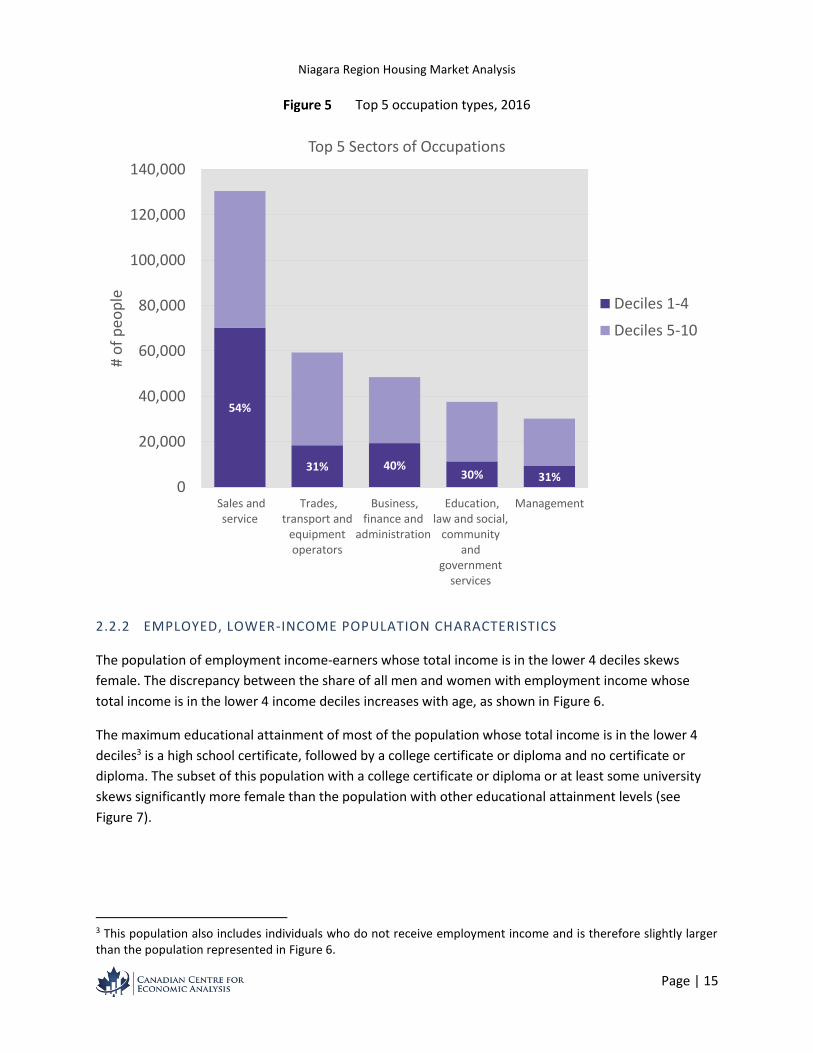
In Niagara Region, there is twice as many residents that report having an occupation in sales and service2
as in the next most common occupation type. People in these occupations are more concentrated in lower
income deciles than those in any other occupation type. In fact, over half of the people in sales and service
occupations (about 13,400) have individual incomes below $24,800, placing them in the lower 4 individual
income deciles. The main occupation types are illustrated in Figure 5.
2 This category contains retail and wholesale sales occupations and customer and personal service occupations related to a wide range of industries, such as accommodation and food service, travel, tourism, and cleaning services. See the National Occupational Classification (NOC) 2016 Version 1.0 on the Statistics Canada website for the full list of definitions of occupation types.
Niagara Region Housing Market Analysis
Page | 15
Top 5 occupation types, 2016
2.2.2 EMPLOYED, LOWER-INCOME POPULATION CHARACTERISTICS
The population of employment income-earners whose total income is in the lower 4 deciles skews
female. The discrepancy between the share of all men and women with employment income whose
total income is in the lower 4 income deciles increases with age, as shown in Figure 6.
The maximum educational attainment of most of the population whose total income is in the lower 4
deciles3 is a high school certificate, followed by a college certificate or diploma and no certificate or
diploma. The subset of this population with a college certificate or diploma or at least some university
skews significantly more female than the population with other educational attainment levels (see
Figure 7).
3 This population also includes individuals who do not receive employment income and is therefore slightly larger than the population represented in Figure 6.
54%
31% 40%30% 31%
0
20,000
40,000
60,000
80,000
100,000
120,000
140,000
Sales andservice
Trades,transport and
equipmentoperators
Business,finance and
administration
Education,law and social,
communityand
governmentservices
Management
# o
f p
eop
le
Top 5 Sectors of Occupations
Deciles 1-4
Deciles 5-10

Niagara Region Housing Market Analysis
Page | 16
Gender and age of employment income recipients with a total income in deciles 1 to 4
Education level of individuals with a total income in deciles 1 to 4 by gender
2.2.3 EMPLOYMENT INTENSITY
The Region is seeing an increasing number of people who are not employed, which correlates to the
demographic aging of the population. Since 2011, Niagara Region has had more people not employed
than people employed in full-time work. In parallel, the local dependency ratio – the proportion of
residents aged 15 or younger and 65 and older relative to those in their working years (15 to 65) – will
also increase.
48% 49%
35%
34%42%
39%38% 21%
14% 16%
0
2,000
4,000
6,000
8,000
10,000
12,000
25 to 29 30 to 34 35 to 44 45 to 54 55 to 64
Number and Percentage of Employment Income Recipients with Total Income in Deciles 1-4
Female Male
20,000 15,000 10,000 5,000 0 5,000 10,000 15,000
No certificate, diploma or degree
High school
Apprenticeship or trades certificate
College certificate or diploma
University
Education Level of Employment Income Recipients with Total Income in Deciles 1-4 (Ages 25-64)
Female Male

Niagara Region Housing Market Analysis
Page | 17
Employment trends and projections, 2001-2041
2.3 CONCLUDING REMARKS
The following demographic and employment trends will affect future housing demand in Niagara Region,
including the type of housing, location, tenure, density, etc.
The demographic aging of the population
o Demographic aging creates a trend towards smaller household sizes.
The importance of sales and service employment, which is primarily lower-wage
o Over half of the people in sales and service occupations are in the lower 4 individual
income deciles.
o Lower-income households are more concentrated in the larger cities in the Region,
particularly in the downtown areas.
o The ability to house this population can have an effect on the local economy.
0
50,000
100,000
150,000
200,000
250,000
2001 2006 2011 2016 2021 2026 2031 2036 2041
Niagara 15+ Employment
Full year, full time
Full year, part time
Seasonal
Not Working
32%
6%25%
37%
% of Total (2016)

Niagara Region Housing Market Analysis
Page | 18
3.0 HOUSING STOCK
3.1 DWELLING TYPES AND TENURE
The most common type of dwelling in the Region are single-detached houses. Low-density dwellings
represent 73% of all housing in the Region. The composition of Niagara Region’s housing stock by dwelling
type is presented in Table 1.
Housing stock by dwelling type, 2016
The Region’s housing stock is composed of 74% ownership and 26% rental. The majority of the rental
stock is concentrated in the larger cities in the Region, especially around the downtown cores, with very
little rental stock outside of these areas (see Figure 9). Most ownership stock is low-density housing while
most rental stock is medium- or high-density.
9 in 10 owners live in low-density housing.
Over half of renters live in medium-density housing.
Housing density by tenure, 2016
17%
54%
28%
Rental Stock
% high density % medium density % low density
1%
10%
89%
Ownership Stock
5%
21%
73%
Total Dwellings by Density
Density Dwelling Type Number of Dwellings
Low Single-detached 126,208
Low Semi-detached 9,734
Medium Row house 13,701
Medium Apartment 5 storeys or less 19,975
Medium Duplex Apartment 6,050
Medium Other 486
High Apartment over 5 storeys 9,864

Niagara Region Housing Market Analysis
Page | 19
Percentage of rental stock by dissemination area, 2016
The household types most likely to be renters are single-person and lone-parent households, as shown in
Figure 11.
Tenure by household type, 2016
80%
59%
87%
87%
57%
0 10,000 20,000 30,000 40,000 50,000 60,000 70,000
Multiple-family
Lone-parent
Couple, with children
Couple, without children
Single-person
Tenure by Household Type
Owner Renter

Niagara Region Housing Market Analysis
Page | 20
3.2 SHELTER PRICES
3.2.1 OWNERSHIP
In the 2001 to 2016 period, the median self-reported values of single-detached houses and other medium-
density attached dwelling types have increased by 114% and 113%, respectively, in the St. Catharines-
Niagara CMA4. On average, this is an annual increase of about 7.5%. The self-reported value of units in
apartments of five storeys or more has increased by 81% in the same timeframe, a 5.4% average annual
increase.
Market prices, which reflect the prices of the subset of the housing stock that is newly built or resold, have
increased by 36% between 2016 and 2019 in Niagara Region as a whole. On average, this is a 12% annual
increase, although the increases have been uneven year over year (see Table 3).
Self-reported dwelling values, 2001-2016 (CMA)
Year Single-detached house Apartment 5+ storeys Other
2001 $139,371 $99,225 $112,742
2006 $195,269 $145,380 $160,177
2016 $298,208 $179,421 $240,412
Recent market prices, 2016-20195
Year All Dwelling Types Change from previous year
2016 $333,030 —
2017 $403,099 21%
2018 $405,063 0%
2019 $454,780 12%
3.2.2 RENTAL
Average rents reported by CMHC include rents paid by all tenants in the rental market, including long-
term tenants whose rents may be below market. Average rents by number of bedrooms in the St.
Catharines-Niagara CMA are shown over time in Figure 12. Between 1996 and 2018, the average year-
over-year increase in CMHC average rents for a 1-bedroom apartment in the St. Catharines-Niagara CMA
was 2.4%. In recent years, between 2016 and 2018, the average year-over-year increase was 4.3%. During
that same timeframe, according to data from Padmapper’s monthly Canadian Rent Reports6, market rents
increased by 9% per year on average in the St. Catharines-Niagara CMA. Market rents are higher in general
4 Note that throughout the report CMA indicates that data is for the St. Catharines-Niagara CMA, which includes all local municipalities of Niagara Region with the exception of Grimsby and West Lincoln. Unless CMA is specified, the data covers Niagara Region in its entirety. 5 Source: Niagara Association of Realtors monthly market reports (January 2016-February 2019), available on the Niagara Association of Realtor’s Website. Accessed April 3rd, 2019. 6 Available on Padmapper’s Rental Data Blog. Accessed April 4th, 2019.

Niagara Region Housing Market Analysis
Page | 21
since new tenants will generally be charged a higher rent compared to what a long-term tenant would
pay, and only a subset of all rental units are put on the market in any given year.
Average rents by number of bedrooms reported by CMHC, 1996-2018
Market rents reported by Padmapper, 2016-2019
$0
$200
$400
$600
$800
$1,000
$1,20019
96
1997
1998
1999
2000
200
1
2002
2003
2004
2005
2006
2007
2008
2010
201
1
2012
201
3
2014
2015
2016
2017
2018
Average Rents (CMA)
Bachelor unitsOne bedroom unitsTwo bedroom unitsThree bedroom units
$400
$600
$800
$1,000
$1,200
$1,400
$1,600
2016 2017 2018 2019
Recent Market Rents (CMA)
1 bedroom units
2 bedroom units

Niagara Region Housing Market Analysis
Page | 22
The rental market in the St. Catharines-Niagara CMA appears to have tightened considerably in the past
decade. According to CMHC’s yearly Rental Market Reports from 2015 to 20187, which cover the St.
Catharines-Niagara CMA, the average vacancy rate for primary rental units decreased for six consecutive
years from 2011 to 2017, increasing for the first time between 2017 and 2018. Vacancy rates by number
of bedrooms for the 2014-2018 period are reported in Figure 14. In 2016, the turnover rate was reported
to be among the lowest in Ontario, third only to the rental markets in Toronto and Hamilton. Reasons for
this tightening of the rental market, according to CMHC, include increased demand from the immigrant
population and international students, as well as a growing gap between rental prices and ownership
costs that reduces movement out of the rental market and into homeownership.
CMHC primary rental vacancy rates by number of bedrooms, 2014-2018
3.2.3 AFFORDABLE HOUSING UNITS
In Niagara Region, there are 8,404 affordable units available, which includes public housing units operated
and managed by Niagara Regional Housing; non-profit and cooperative housing programs; rent
supplement units; as well as units provided through the New Development Housing Allowance Program
for private developers (Table 4 provides a breakdown by type and mandate). Almost three-quarters of the
units are mandated for families or seniors8. In terms of size, 50% of units have one bedroom, 25% have
three or more bedrooms, 23% have two bedrooms and the remainder are bachelor units. These are mainly
found in St. Catharines, Niagara Falls and Welland.
7 Available on the CMHC website. Accessed June 20th, 2019. 8 Applicants aged 55 years and older are eligible for senior housing.
0.0%
1.0%
2.0%
3.0%
4.0%
5.0%
2014 2015 2016 2017 2018
Primary Rental Vacancy Rate (CMA)
1 bedroom units
2 bedroom units
3+ bedroom units
average

Niagara Region Housing Market Analysis
Page | 23
Affordable housing units by mandate and type, 2019
Senior Adult Family Aboriginal Alternative None Total New Development 315 325 26 - 43 - 709
NFP / Coop 1024 29 2336 128 84 - 3601
NRH Owned 1642 140 902 - - - 2684
Rent Supplement - - - - - 1410 1410
Total 2981 494 3264 128 127 1410 8404
3.3 CONCLUDING REMARKS
Niagara Region’s housing stock differs between:
Larger cities and rural communities – Larger cities have the bulk of the housing stock, the high-
and medium-density stock and the affordable housing units in the Region.
Tenure types – Almost 90% of owner households live in a low-density dwelling compared to just
over 25% of renters.
There is some evidence that recent housing price and rent increases have exceeded long-term average
rates.
Average rents for a 1-bedroom apartment have increased by 4.3% between 2016 and 2018
compared to the 2.4% 22-year average.
Self-reported housing values have more than doubled from 2001 to 2016.
Market prices for homes have increased by 12% per year on average from 2016 to 2018, with a
20% increase between 2016 and 2017.

Niagara Region Housing Market Analysis
Page | 24
4.0 HOUSING NEED
4.1 CORE HOUSING NEED
Core housing need is the standard indicator of housing need in Canada used by CMHC and Statistics
Canada. A household is considered to be in core housing need if its dwelling does not acceptably meet its
needs, i.e. it is either too small9, in a major state of disrepair or too expensive given its budget, and there
is no alternative acceptable housing that would cost less than 30% of total household income.
Core housing need affected a total of 23,830 households in 2016. Of this number, about 20,000 are single-
person households and 3,250 are lone-parent households.
Core housing need, share by household type, 2016
Households in core need by household type, 2016
Household Composition % Core Need # Core Need Suitable Housing Single-Person Households 34.7% 20,002 Bachelor or 1 bedroom
Lone-Parent Households 17.8% 3,254 2 or more bedrooms
Couples without Children* 0.5% 286 1 bedroom
Couples with Children 0.6% 271 2 or more bedrooms
9 This is calculated based on the National Occupancy Standard. The number of bedrooms required by a household is derived according to the following (if household members meet more than one criteria, the first conditions listed take precedence over the subsequent): a maximum of two persons per bedroom; household members living as part of a married or common-law couple share a bedroom; lone parents have a separate bedroom; household members aged 18 or over have a separate bedroom; household members under 18 years of the same sex share a bedroom; household members under 5 years of the opposite sex share a bedroom if doing so would reduce the number of required bedrooms. The exception to the above is a household consisting of one person living alone. Such a household would not need a bedroom, i.e. they may live suitably in a bachelor apartment.
84%
14%
1%
0% Single-personhousehold
Lone-parenthousehold
Couple, with childrenhousehold
Couple, withoutchildren household
Multiple-familyhousehold

Niagara Region Housing Market Analysis
Page | 25
As shown in Table 5, the household types most vulnerable to core housing need are single-person and
lone-parent households.
Over 33% of single-person households are in core housing need.
18% of lone-parent households are in core housing need.
Breaking down housing need by tenure, we find that:
there are more renter households in core need than owner households, despite there being about
three times more owner than renter households in Niagara Region; and
renters experience higher rates than owners of all core housing need indicators (housing
unaffordability, unsuitability and inadequacy).
Of the components of core housing need, affordability is the main challenge in Niagara Region. Dwelling
unsuitability and inadequacy combined affect under 10% of all households, while 24% of households
spend over 30% of their total income on housing and are therefore considered to be living in unaffordable
housing.
Core housing need indicators by tenure (number of households), 2016
10,229
22,849
2,803
7,008
13,601
22,623
2,6854,385
0
5,000
10,000
15,000
20,000
25,000
In Core HousingNeed
Spending over30%
UnsuitablyHoused
InadequatelyHoused (Major
Repairs)
Number of Households in Core Housing Need
Owner Renter

Niagara Region Housing Market Analysis
Page | 26
Core housing need indicators by tenure (percentage of households), 2016
Core housing need affects households across all age groups, with tenure and household income level
being the main determinants, as shown in Table 6 and Table 7. Almost all households in core housing need
have a total household income below $52,700 (lower 4 income deciles), meaning that the maximum they
can afford to spend per month on shelter is $1,317.10 Of these, 70% of households in core need are in the
lower 2 deciles. The maximum these households can spend is $737 per month.
Core housing need by age of household maintainer and tenure, 2016
10 This includes all costs required to make a shelter operational, e.g. rent, mortgage payments, property taxes, condo fees, utilities, etc.
7%
16%
2%5%
29%
48%
6%9%
0%
5%
10%
15%
20%
25%
30%
35%
40%
45%
50%
In Core HousingNeed
Spending over30%
UnsuitablyHoused
InadequatelyHoused (Major
Repairs)
Percentage of Households in Core Housing Need
Owner Renter
Age Range
# in Core Housing Need
% of Households in Core Need
Renter Households in Core Need
% Renter Households in Core Need
15 to 34 4,031 16% 2,909 24%
35 to 64 12,201 12% 6,591 27%
65+ 7,598 13% 4,101 36%

Niagara Region Housing Market Analysis
Page | 27
Households in core housing need by decile, 2016
Income Decile
Household Income level
Maximum affordable monthly housing cost
# households in Niagara in core need
Decile 1 Less than $19,400 $485 8,557
Decile 2 $19,400 to $29,499 $737 7,545
Decile 3 $29,500 to $39,799 $995 6,295
Decile 4 $39,800 to $52,699 $1,317 1,429
Decile 5 $52,700 to $68,399 $1,710 4
Decile 6 $68,400 to $84,299 $2,107 0
Core housing need does not include homelessness. According to the Point in Time count conducted on
March 27th, 2018 in Niagara Region, 625 people were experiencing homelessness in shelters, transitional
housing programs and unsheltered locations. This included 144 children aged 15 or younger.
4.2 AFFORDABILITY
A household is considered affordably housed, according to Statistics Canada and CMHC, if it is spending
less than 30% of gross income on shelter costs. This includes expenses to make shelter operational, e.g.
rent, mortgage, condo fees, property taxes, and utilities. It does not include any transportation-related
expenses such as car ownership or public transportation.
In the shelter affordability matrices in Figure 18 and Figure 19, household income is shown on the vertical
axis and monthly shelter costs on the horizontal axis. The number in each square is the sum of households
that have a specific combination of income and monthly shelter costs. The darker the square, the higher
the number of households with that combination. The diagonal blue line represents the affordability
threshold (shelter costs are 30% of total income), meaning that all households below the line are
considered affordably housed.
The concentration of household differs between the two figures – owner households are distributed
across many income levels and are mainly found below or at the affordability threshold, while renter
households are highly concentrated above the line and at household incomes below $40,000.

Niagara Region Housing Market Analysis
Page | 28
Affordability matrix – Owners, 2016
Note: Only households with incomes under $100,000 per year are included

Niagara Region Housing Market Analysis
Page | 29
Affordability matrix – Renters, 2016
Note: Only households with incomes under $100,000 per year are included
Renter households in Niagara Region live in an unaffordable dwelling at higher rates than owner
households. Almost half of renter households in Niagara spend over 30% of income on shelter,
compared to 16% of owner households.
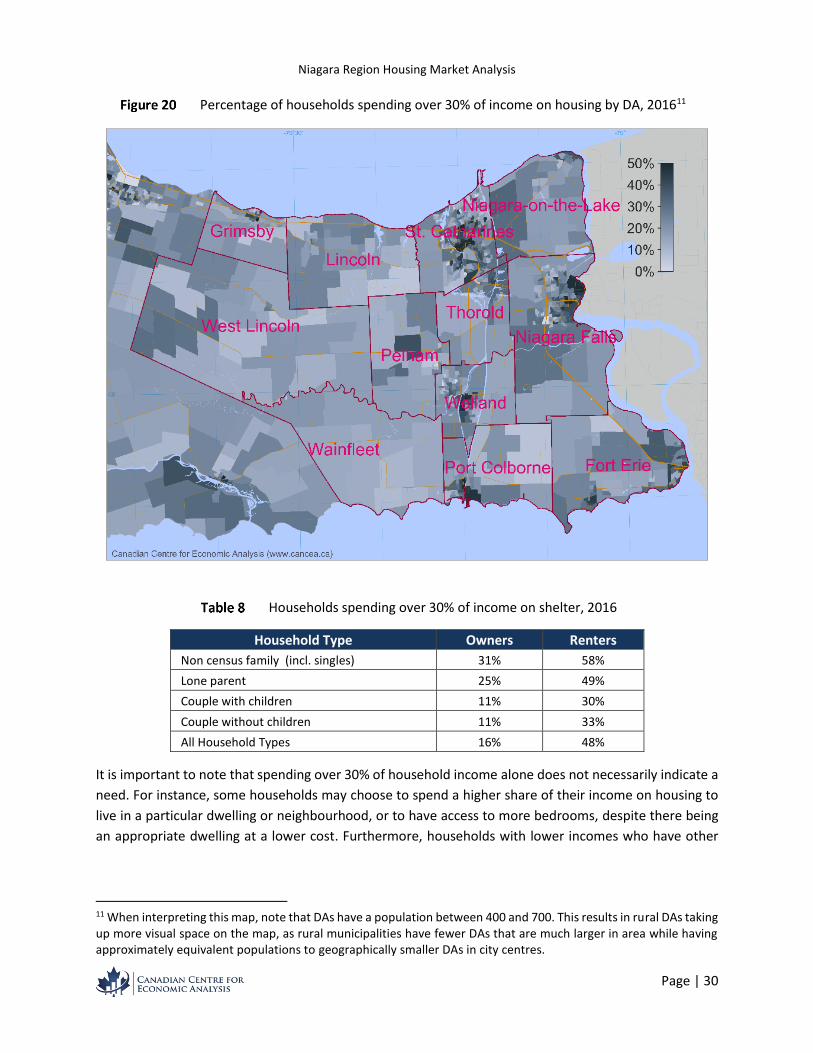
Households spending over 30% of income are located all over the Region but mainly concentrated in the
city cores.
Niagara Region Housing Market Analysis
Page | 30
Percentage of households spending over 30% of income on housing by DA, 201611
Households spending over 30% of income on shelter, 2016
Household Type Owners Renters Non census family (incl. singles) 31% 58% Lone parent 25% 49% Couple with children 11% 30% Couple without children 11% 33% All Household Types 16% 48%
It is important to note that spending over 30% of household income alone does not necessarily indicate a
need. For instance, some households may choose to spend a higher share of their income on housing to
live in a particular dwelling or neighbourhood, or to have access to more bedrooms, despite there being
an appropriate dwelling at a lower cost. Furthermore, households with lower incomes who have other
11 When interpreting this map, note that DAs have a population between 400 and 700. This results in rural DAs taking up more visual space on the map, as rural municipalities have fewer DAs that are much larger in area while having approximately equivalent populations to geographically smaller DAs in city centres.

Niagara Region Housing Market Analysis
Page | 31
sources of wealth or low monthly expenses may also willingly choose to spend a higher share of their
income on housing.
4.3 CONCLUDING REMARKS
According to the most recent numbers, about 24,000 households in Niagara Region are in core housing
need.
13,600 of these are renters.
Affordability is the main driver of housing need in the Region for all tenures.
o Rates of unsuitability and inadequacy are low overall.
o Core housing need predominantly affects single-person and lone-parent households
whether they rent or own, both single-earner household types, which reflects that
housing need is mainly a challenge of affordability.
Similar rates of core housing need exist across most ages of household maintainers.
o Rates are slightly higher for households with a maintainer younger than 35 or older than
84.
Core housing need and affordability, as defined by spending 30% or more of income on shelter, have
limitations:
Core housing need does not include the homeless population.
Core housing need does not include any households living in dwellings that are not counted as
dwellings by the census.
The definition of suitability is context-dependent and may not always be a reflection of true need.
Affordability can overstate need (some people spend more by choice).

Niagara Region Housing Market Analysis
Page | 32
5.0 SUB POPULATION FOCUS
5.1 OLDER ADULTS
Niagara Region’s share of adults aged 65 years or older in the population is higher than the provincial
average. This population resides mainly in low-density housing (71%).
Share of population over 65 by dissemination area, 2016
The rate of core housing need among older adults aged 65 years or older is in line with the Regional
average across all age groups. Within this group, segments of the older adult population that have higher
rates of core need are:
Single-person households, who comprise 96% of all older adult households in core need in Niagara
Region.
Renter households, who are 5 times more likely to be in core housing need than owners.
Households whose maintainer is age 85 years or older, 19% of which are considered to be in core
housing need.

Niagara Region Housing Market Analysis
Page | 33
Older adult core housing need indicators (number of households) by age, 2016
Older adult core housing need indicators (percentage of households) by age, 2016
0
1,000
2,000
3,000
4,000
5,000
6,000
7,000
8,000
9,000
10,000
In Core HousingNeed
Spending over 30% Unsuitably Housed InadequatelyHoused (Major
Repairs)
Older Adult Households in Core Housing Need
55 to 64
65 to 74
75 to 84
85 and over
0%
5%
10%
15%
20%
25%
30%
In Core HousingNeed
Spending over 30% Unsuitably Housed InadequatelyHoused (Major
Repairs)
Percentage of Older Adult Households in Core Housing Need
55 to 64
65 to 74
75 to 84
85 and over

Niagara Region Housing Market Analysis
Page | 34
Percent of older adult households of given type in core housing need, 2016
Maintainer Single Person Census Households 55 to 64 36% 1%
65 to 74 34% 1%
75 to 84 27% 1%
85 and over 31% 2%
Percent of older adult households of given type spending over 30% of income on shelter, 2016
Maintainer Single Person Census Households 55 to 64 43% 13%
65 to 74 42% 12%
75 to 84 35% 10%
85 and over 36% 10%
5.2 SINGLE-PERSON HOUSEHOLDS
Non-census households, which primarily consist of persons living alone, are the most common household
type in Niagara Region. They are also the great majority of households in core need, counting 20,000 in
2016. Among these households:
About half are between 35 and 64 years old.
Over one third are 65 and over.
The remainder are under 35.
Single-person households in core need by age, 2016
under 353,092
households 16%
35 to 649,634 households
48%
65 and over7,276
households 36%
Core Housing Need: Single-Person Households

Niagara Region Housing Market Analysis
Page | 35
5.3 LONE PARENT HOUSEHOLDS
Lone-parent households are the second most likely household type to be in core need in Niagara Region.
The Region counts a total of 3,250 lone-parent households in core housing need. Of these households,
most are between the ages of 35 to 64, and one in four is below the age of 35.
Lone-parent households in core need by age, 2016
Core need and affordability are a challenge for both renter and owner households of this type, although
renters have about twice the rate of core need and spending over 30% of income of their owner
counterparts, as shown in Figure 26.
under 35797 households
25%35 to 64
2,246 households69%
65 and over, 211 households
6%
Core Housing Need: Lone-Parent Households

Niagara Region Housing Market Analysis
Page | 36
Lone parent core housing indicators by tenure (number of households), 2016
Lone parent core housing indicators by tenure (percentage of households), 2016
5.4 IMMIGRANT AND ABORIGINAL POPULATIONS & OTHER PRIORITY SUBGROUPS
Priority sub-populations whose housing needs Niagara Region seeks to address include immigrant and
aboriginal populations, as well as persons with a disability and students. However, there exists limited
publicly available data on the housing needs of immigrant and aboriginal populations at the present time,
1,345
2,712
974
333
1,909
3,719
950 837
0
500
1,000
1,500
2,000
2,500
3,000
3,500
4,000
In Core HousingNeed
Spending over 30% InadequatelyHoused (Major
Repairs)
Unsuitably Housed
Lone Parent Households in Core Housing Need
Owner Renter
13%
25%
9%
3%
25%
49%
13% 11%
0%
10%
20%
30%
40%
50%
60%
In Core HousingNeed
Spending over 30% InadequatelyHoused (Major
Repairs)
Unsuitably Housed
Percentage of Lone Parent Households in Core Housing Need
Owner Renter

Niagara Region Housing Market Analysis
Page | 37
and historical census data is generally not available for many of the combinations of parameters. For these
populations, forward projections are not possible. For persons with disabilities, no data regarding housing
needs are presently available, since the Canadian census does not presently collect information about
health and ability status. Capturing data on students presents its own set of challenges, notably because
a student’s permanent address may not be the same as their student address. For this reason, most census
data tables are not able to distinguish students specifically, creating a significant data gap regarding their
housing needs. The available data on immigrant and aboriginal subgroups’ income, employment and
housing needs in Niagara Region are presented below.
5.4.1 IMMIGRANT POPULATION
Data on immigration status are collected at the individual level, while housing data are collected at the
household level, which makes it difficult to consolidate immigration status with housing need. What is
available are data on date of immigration, ages, income levels, occupation types and level of education.
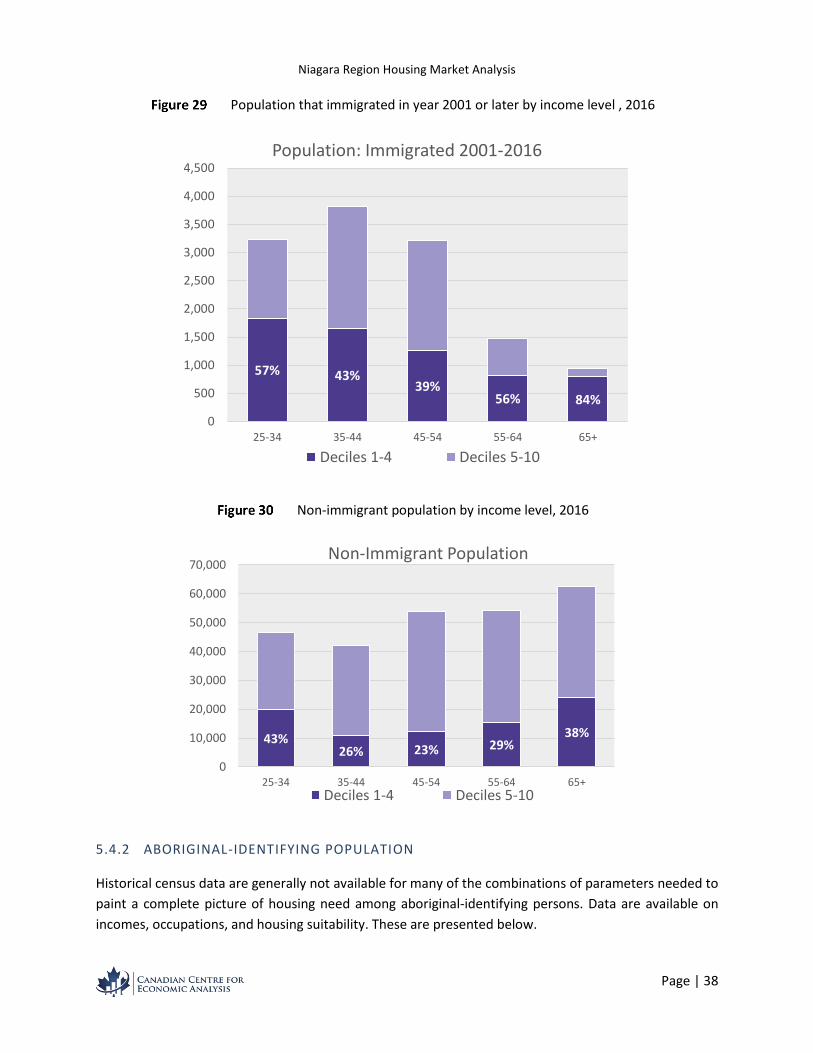
The immigrant population represents 18% of the total population in Niagara Region. Most of the
immigrant population arrived before 1981 and is above the age of 55. The immigrant population that
arrived after 2001 tends to be below the age of 55. A slightly higher percentage of immigrants who arrived
prior to the year 2001 have incomes in the lower deciles than the non-immigrant population, and this
difference increases as the immigration date become more recent (see Figure 28 through Figure 30).
Population that immigrated before year 2001 by income level, 2016
48% 32%
28%
31% 42%0
5,000
10,000
15,000
20,000
25,000
30,000
35,000
25-34 35-44 45-54 55-64 65+
Population: Immigrated Before Year 2001
Deciles 1-4 Deciles 5-10
Niagara Region Housing Market Analysis
Page | 38
Population that immigrated in year 2001 or later by income level , 2016
Non-immigrant population by income level, 2016
5.4.2 ABORIGINAL-IDENTIFYING POPULATION
Historical census data are generally not available for many of the combinations of parameters needed to
paint a complete picture of housing need among aboriginal-identifying persons. Data are available on
incomes, occupations, and housing suitability. These are presented below.
57% 43%39%
56% 84%
0
500
1,000
1,500
2,000
2,500
3,000
3,500
4,000
4,500
25-34 35-44 45-54 55-64 65+
Population: Immigrated 2001-2016
Deciles 1-4 Deciles 5-10
43%26% 23% 29%
38%
0
10,000
20,000
30,000
40,000
50,000
60,000
70,000
25-34 35-44 45-54 55-64 65+
Non-Immigrant Population
Deciles 1-4 Deciles 5-10
Niagara Region Housing Market Analysis
Page | 39
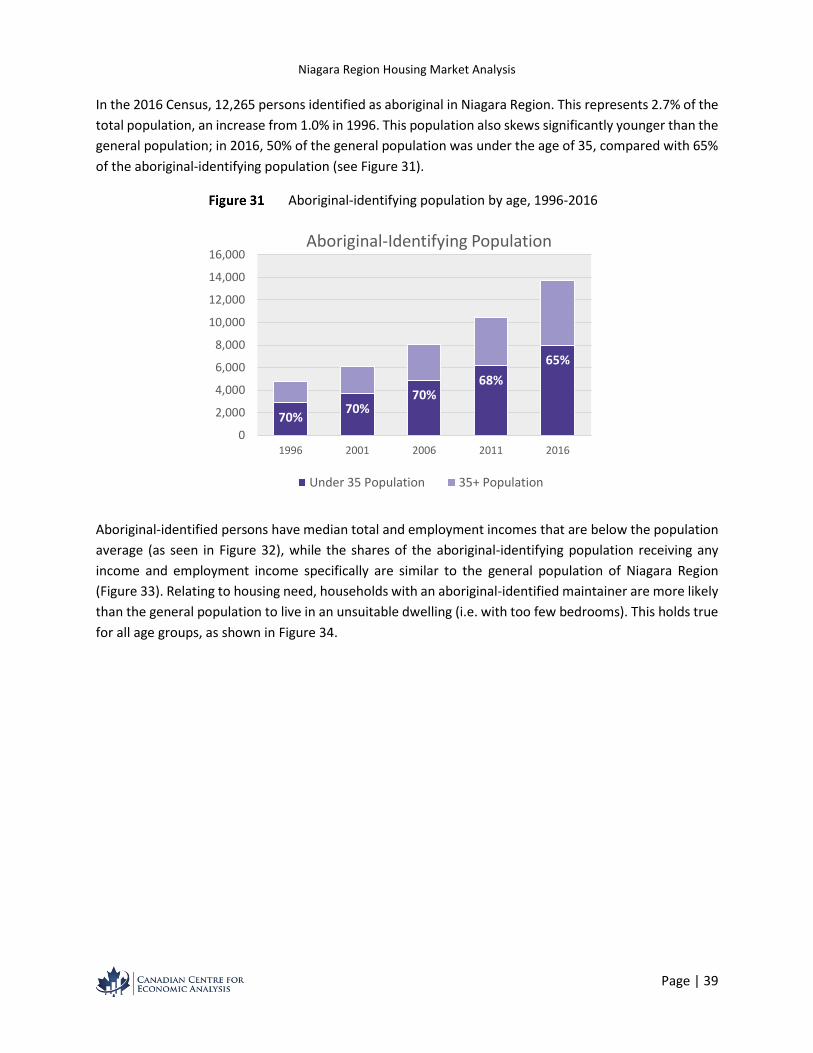
In the 2016 Census, 12,265 persons identified as aboriginal in Niagara Region. This represents 2.7% of the
total population, an increase from 1.0% in 1996. This population also skews significantly younger than the
general population; in 2016, 50% of the general population was under the age of 35, compared with 65%
of the aboriginal-identifying population (see Figure 31).
Aboriginal-identifying population by age, 1996-2016
Aboriginal-identified persons have median total and employment incomes that are below the population
average (as seen in Figure 32), while the shares of the aboriginal-identifying population receiving any
income and employment income specifically are similar to the general population of Niagara Region
(Figure 33). Relating to housing need, households with an aboriginal-identified maintainer are more likely
than the general population to live in an unsuitable dwelling (i.e. with too few bedrooms). This holds true
for all age groups, as shown in Figure 34.
70%70%
70%68%
65%
0
2,000
4,000
6,000
8,000
10,000
12,000
14,000
16,000
1996 2001 2006 2011 2016
Aboriginal-Identifying Population
Under 35 Population 35+ Population

Niagara Region Housing Market Analysis
Page | 40
Income, aboriginal-identifying population (CMA), 2016
Share of population with any income and employment income, (CMA), 2016
0
5,000
10,000
15,000
20,000
25,000
30,000
35,000
Median Total Income ($) Median EmplomentIncome ($)
Median Income ($)
Aboriginal Identity Total Population
0%
20%
40%
60%
80%
100%
% With Total Income % With EmploymentIncome
With Income (% of People)
Aboriginal Identity Total Population

Niagara Region Housing Market Analysis
Page | 41
Population living in unsuitable dwelling by age and aboriginal identity, 2016
5.5 CONCLUDING REMARKS
Many households in core need in Niagara Region are over the age of 65, as older adults represent a
significant share of the total population.
Households whose maintainer is 65 years or older:
are 7,600 of the almost 24,000 households in core housing need;
have similar rates of core housing need as the Regional average; and
are more likely to be in core need if they live alone, rent, and/or are 85 years or older.
Lone parent households with any number of children, followed by people living alone are most likely to
be low-income under the LIM-AT measure. This corresponds to the two household types that make up
the majority of households in core housing need in Niagara and highlights the challenge of finding
acceptable housing on a single income.
Limited data regarding immigrant and aboriginal sub-populations are currently available, while no data
are available on the housing needs of persons with disabilities in Niagara Region. Keeping these data
challenges in mind, the data show that within the immigrant population:
the income distribution of immigrants who arrived before the year 2000 most resembles the non-
immigrant population in each age group;
more recent immigrants have a higher instance of being low-income in each age group; and
recent immigrants skew much younger than the overall population.
The aboriginal-identifying population:
is much younger than the overall population;
0%2%4%6%8%
10%12%14%16%18%
0 to 14years
15 to 24years
25 to 34years
35 to 44years
45 to 54years
55 to 64years
65 to 74years
75 yearsand over
All Ages
Population Living in Unsuitable Dwellings
AboriginalIdentity
Non-AboriginalIdentify
Niagara Region Housing Market Analysis
Page | 42
is more likely to live in unsuitable dwellings than the non-aboriginal-identifying population; and
has a lower median income than the non-aboriginal-identifying population, while the percentage
of the population receiving any income and employment income is similar.

Niagara Region Housing Market Analysis
Page | 43
6.0 CONSULTATION FEEDBACK
6.1 WHAT WE HEARD
As part of this project, CANCEA presented the local housing and demographic data to each municipality
to elicit feedback and gain a local perspective on the trends and patterns seen in the data.
Local housing-related issues that were common to multiple local municipalities in Niagara are reported
by topic.
6.1.1 POPULATION AND HOUSEHOLDS
Minimum wage and service industry employees cannot find housing in the municipalities in
which they work. Many commute from neighbouring communities. Some large employers are
independently seeking ways to provide their employees with housing options.
There is a need for more transportation infrastructure – in the larger cities, public transit is not
frequent enough to provide transportation to and from work for many workers. In smaller
municipalities, it does not reach the industries where people work.
6.1.2 HOUSING STOCK
In certain established neighbourhoods, there is resistance to development by long-term
residents, especially to medium and high-density development. This has localized development
in some municipalities to neighbourhoods that are newer or less established.
Some smaller local municipalities that are looking to grow mentioned the costs associated with
servicing land as obstacles to new development.
6.1.3 HOUSING NEED
In some municipalities that have aging hotels and motels, these are being used by residents for
long-term stays. This type of housing would not be captured in the data, and residents would
not be counted as being in core need or living in an inadequate dwelling. Although these provide
affordable options in the housing continuum, these “units” may be highly inadequate, needing
major repairs in order to meet the needs of those who live in them.
In some municipalities, the older adult population is the primary or exclusive affordable housing
policy priority.
The definition of suitability used by CMHC and Statistics Canada was considered to be
potentially ineffective at capturing how well suited a dwelling is to its inhabitants.
6.2 LOCAL POLICY INTERESTS
The main housing policy interests that were brought up in the course of consultations were the following:

Niagara Region Housing Market Analysis
Page | 44
Encouraging the creation of secondary suites as a way to provide additional rental housing in small
and mid-sized municipalities.
Studying the incentives for developers to create additional affordable housing stock.
Finding ways to overcome local reluctance towards mixed-density development.
Discussing the importance of infrastructure investment and other creative servicing solutions.
6.3 DATA GAPS
In conversation with Niagara Region’s local municipalities, the following were identified as relevant data
gaps that, if filled, can help create a more complete picture of the local housing situation.
The use of short-term rentals (such as Airbnb): this could affect rental and ownership rates seen
in the data in certain communities with active tourism industries.
The use of motels as long-term, low-cost accommodations: understanding the number and
characteristics of the households that are housed in this way, as well as the features of these
units, can add to the discussion of housing need.
Housing-specific data on particular priority subgroups, e.g. student, aboriginal, disabled, and
immigrant populations.
Recent development in communities that have experienced significant growth since the last
census and its effects on housing stock and prices.12
12 Market prices and rents were added to the analysis as a result of these consultations.

Niagara Region Housing Market Analysis
Page | 45
7.0 KEY TAKE-AWAYS
Niagara Region currently has about 24,000 households in core housing need. The key sub-groups
most affected include:
o Renter households, 29% of which are in core housing need in the Region;
o Singles, who represent 84% of the 24,000 households in core need;
o Lone parents, who represent 14% of the households in core need; and
o Low-income households, specifically in deciles 1-4 who earn less than $52,700 per year.
The types of housing needed by most households in core need are:
o Bachelor apartments and one-bedroom units for single-person households;
o 2 or more bedroom, family-friendly units for lone-parent households; and
o Affordable housing – spending $737 a month on shelter is unaffordable for 70% of all
households in core need.
The Region’s aging population which is likely to increasingly skew older will also affect future
housing demand and housing need. The type of dwellings commonly considered appropriate for
this population would be 1-bedroom, senior-friendly accessible housing, suitable for couples and
single-person households. Transportation and location within the community may also be
important considerations.
At the local level, an effective housing strategy requires considering how economic and
infrastructure policy interacts with housing.
o The type and location of housing development can affect the ability to attract labour to
the area, especially for industries requiring minimum-wage labour.
o Transportation infrastructure can ease labour mobility and widen the radius for people to
find housing.
o Policies targeting housing, transportation and the economy can affect the type of growth
that the Region will experience and can either exacerbate trends identified or work to
minimize them.

Niagara Region Housing Market Analysis
Page | 46
A. APPENDIX: COMPARISON TABLES
A.1. WITHIN NIAGARA REGION
POPULATION AND HOUSEHOLDS
Niagara Falls
St. Catharines
West Lincoln Welland Fort Erie Thorold
Regional Average
Population growth rate (2016-2041) 41% 24% 96% 24% 40% 50% 34%
Household growth rate (2016-2041) 46% 31% 99% 30% 46% 56% 40%
Expected number of added residents, thousands (2016-2041)
36.3 32.9 14.08 12.70 12.44 9.54 156.0
Expected number of added households, thousands (2016-2041)
16.9 17.2 5.94 6.50 5.82 4.42 74.7
Share of Regional growth borne by municipality
22.7% 23.0% 7.9% 8.7% 7.8% 5.9% 100%
Under 25 population growth rate (2016-2041)
24% 8% 83% 9% 24% 36% 19%
65 and over population growth rate (2016-2041)
117% 93% 193% 89% 108% 139% 105%
Dependency ratio (2016) 52% 54% 51% 54% 58% 44% 55%
Most common household type (2016) Singles Singles Couple with
children Singles
Couple no children
Singles Singles
Proportion of households with a maintainer aged 65 and over (2016)
30% 31% 26% 31% 34% 25% 31%

Niagara Region Housing Market Analysis
Page | 47
Grimsby
Niagara-on-the-Lake Pelham Lincoln
Port Colborne Wainfleet
Regional Average
Population growth rate (2016-2041) 34% 51% 47% 32% 17% 13% 34%
Household growth rate (2016-2041) 39% 57% 51% 37% 23% 16% 40%
Expected number of added residents, thousands (2016-2041)
9.35 8.94 8.05 7.81 3.09 0.83 156.0
Expected number of added households, thousands (2016-2041)
4.37 4.09 3.60 3.65 1.77 0.43 74.7
Share of Regional growth borne by municipality
5.9% 5.5% 4.8% 4.9% 2.4% 0.6% 100%
Under 25 population growth rate (2016-2041)
20% 26% 27% 16% 0% 3% 19%
65 and over population growth rate (2016-2041)
107% 116% 119% 107% 78% 71% 105%
Dependency ratio (2016) 56% 72% 62% 59% 59% 49% 55%
Most common household type (2016) Couple with
children Couple no children
Couple no children
Couple with children
Singles Couple no children
Singles
Proportion of households with a maintainer aged 65 and over (2016)
29% 43% 35% 32% 34% 28% 31%

Niagara Region Housing Market Analysis
Page | 48
EMPLOYMENT & HOUSING
Niagara Falls
St. Catharines
West Lincoln Welland Fort Erie Thorold
Regional Average
Employment & Income
Average individual income (2016) $37,869 $38,963 $44,967 $37,126 $40,389 $37,745 $41,591
Median individual income (2016) $29,275 $30,110 $36,591 $29,856 $30,591 $30,912 $31,433
Average 15+ population full-time employment (2016)
31% 30% 41% 30% 30% 35% 32%
Average 15+ population not working (2016)
36% 38% 27% 41% 41% 32% 37%
Expected change in full time employed 15+ population (2016-2041)
22% 7% 79% 8% 20% 34% 17%
Expected change in non-working 15+ population (2016-2041)
76% 55% 143% 50% 72% 86% 67%
Housing Stock & Demand
Median price, single-detached home (2016)
$260,041 $280,193 $399,756 $229,411 $229,712 $259,834 $298,208
Median price, other (excluding 5+ storey and mobile)
$200,452 $210,341 $299,384 $185,858 $232,654 $224,261 $240,412
Average 1-bedroom rent (2016) $807 $831 N/A $757 $723 $693 $801
(CMA)
Rent increase, 1-bedroom (2006-2016) 28% 25% N/A 27% 24% 21% 26%
(CMA)
Low-density housing stock 72% 63% 90% 72% 85% 79% 73%
Medium-density housing stock 24% 26% 10% 21% 13% 19% 22%
High-density housing stock 4% 11% 0% 7% 2% 2% 5%
% Ownership 72% 67% 90% 70% 79% 73% 74%
% Renters 28% 33% 10.3% 30% 21% 27% 26%
% Core housing need 14% 16% 4% 16% 14% 12% 13%
% Spending over 30% of income on shelter
26% 28% 17% 26% 25% 25% 24%

Niagara Region Housing Market Analysis
Page | 49
Grimsby
Niagara-on-the-Lake Pelham Lincoln
Port Colborne Wainfleet
Regional Average
Employment & Income
Average individual income (2016) $53,634 $53,633 $55,892 $50,311 $39,282 $46,750 $41,591
Median individual income (2016) $41,527 $37,208 $41,313 $37,821 $29,977 $34,498 $31,433
Average 15+ population full-time employment (2016)
38% 28% 32% 37% 28% 39% 32%
Average 15+ population not working (2016)
31% 39% 36% 30% 42% 31% 37%
Expected change in full time employed 15+ population (2016-2041)
17% 27% 25% 14% -1% 1% 17%
Expected change in non-working 15+ population (2016-2041)
76% 91% 89% 79% 45% 37% 67%
Housing Stock & Demand
Median price, single-detached home (2016)
$449,564 $500,714 $400,196 $400,101 $200,065 $300,656 $298,208
Median price, other (excluding 5+ storey and mobile)
$334,955 $401,199 $300,758 $299,958 $199,835 $329,452 $240,412
Average 1-bedroom rent (2016) $768 N/A N/A $643 $728 N/A $801
(CMA)
Rent increase, 1-bedroom (2006-2016) 19% N/A N/A 2% N/A N/A 26%
(CMA)
Low-density housing stock 71% 87% 84% 81% 75% 99% 73%
Medium-density housing stock 27% 13% 15% 19% 22% 1% 22%
High-density housing stock 2% 0% 1% 1% 3% 0% 5%
% Ownership 86% 88% 89% 87% 74% 94% 74%
% Renters 14% 12% 11% 13% 26% 6% 26%
% Core housing need 6% 6% 5% 4% 17% 5% 13%
% Spending over 30% of income on shelter
18% 20% 15% 16% 25% 16% 24%

Niagara Region Housing Market Analysis
Page | 50
A.2. NEIGHBOURING MUNICIPALITIES
POPULATION & HOUSEHOLDS
Haldimand-
Norfolk Hamilton Peel Halton Toronto Niagara Region
Population and Households
Population growth rate (2016-2041)* 10% 39% 34% 76% 18% 34%
Household growth rate (2016-2041) 13% 43% 38% 81% 22% 40%
Expected number of added residents, thousands (2016-2041)
11.0 219 501 431 529 156
Expected number of added households, thousands (2016-2041)
5.89 95.8 175 162 258 74.7
Under 25 population growth rate (2016-2041)
1% 22% 22% 61% 13% 19%
65 and over population growth rate (2016-2041)
67% 131% 116% 180% 52% 105%
Dependency ratio (2016) 58% 50% 45% 53% 43% 55%
Most common household type (2016) Family with
children Family with
children Family with
children Family with
children Non-census
family Non-census
family
Proportion of households with a maintainer aged 65 and over (2016)
32% 22% 20% 24% 23% 31%
Note: Growth is based on Places to Grow targets

Niagara Region Housing Market Analysis
Page | 51
EMPLOYMENT & HOUSING
Haldimand-
Norfolk Hamilton Peel Halton Toronto Niagara Region
Employment & Income
Average individual income (2016) $41,731 $43,966 $42,651 $64,762 $52,268 $41,591
Median individual income (2016) $33,265 $32,917 $30,715 $42,577 $30,089 $31,433
Average 15+ population full-time employment (2016)
34% 34% 35% 40% 33% 32%
Average 15+ population not working (2016)
35% 35% 32% 28% 35% 37%
Housing Stock & Demand
Median price, single-detached home (2016)
$288,920 $400,815 $697,183 $738,304 $800,687 $298,208
Median price, other (excluding 5+ storey and mobile)
$230,095 $324,885 $479,570 $473,364 $601,891 $240,412
Average 1-bdr rent 2016 n/a $810 $1,101 $1,160 $1,137 $801
(CMA)
Low-density housing stock 87% 60% 57% 64% 31% 73%
Medium-density housing stock 12% 24% 24% 25% 25% 22%
High-density housing stock 1% 16% 19% 11% 44% 5%
% Ownership 81% 68% 76% 81% 53% 74%
% Renters 19% 32% 24% 19% 47% 26%
% Core housing need 9% 15% 16% 9% 24% 13%
% Spending over 30% of income on shelter
19% 26% 32% 24% 36% 24%