Fatigue Life, Fatigue Damage, Fatigue Factor of Safety ...
4
International Research Journal of Engineering and Technology (IRJET) e-ISSN: 2395-0056 Volume: 07 Issue: 09 | Sep 2020 www.irjet.net p-ISSN: 2395-0072 © 2020, IRJET | Impact Factor value: 7.529 | ISO 9001:2008 Certified Journal | Page 1499 Fatigue Life, Fatigue Damage, Fatigue Factor of Safety, Fatigue Sensitivity, Biaxiality Indication and Equivalent Stress of a Radial Connecting Rod More Sri Vidhya 1 , K V Merlyn Christina 2 1,2 UG Student, Dept. of Mechanical Engineering, Mahatma Gandhi Institute of Technology, Hyderabad, India ---------------------------------------------------------------------***---------------------------------------------------------------------- Abstract - Radial Connecting rod is one of the most important parts in engine assembly which transfers energy from piston to crankshaft and convert the linear, reciprocating motion of a piston into the rotary motion of a crankshaft. The connecting rod primarily undergoes tensile and compressive loading under engine cyclic process. The forces acting on connecting rod are: - forces due to maximum combustion pressure, force due to inertia of connecting rod and reciprocating mass. From the viewpoint of functionality, connecting rods must have the highest possible rigidity at the lowest weight. [1] Key Words: Radial connecting rod, Forces, Analysis, Fatigue 1. INTRODUCTION In this project, a radial type connecting rod is analysed based on different parameters. This radial connecting rod is designed in SolidWorks 2016 and later analysed in Ansys students version. The analysis is done for fatigue life, fatigue damage, fatigue factor of safety, fatigue sensitive, Biaxiality Indication. 1.1 SolidWorks SolidWorks is a solid modelling computer-aided design (CAD) and computer-aided engineering (CAE) software that runs primarily on Windows and MacOS operating system. The method generally used is to sketch 2D profile and use features like extrude, extrude cut, loft etc to produce the solid shapes. It is the widely used software for 3D modelling in various industries. 1.2 Ansys Ansys is a computer software for both Windows and MacOS operating systems which is mainly designed for engineering tasks. It is mainly used for works like Simulation, structural and elemental analysis, prototyping, mathematical computations, Finite element analysis (FEM), Computational fluid dynamics (CFD) and so on. In industries it is used to simulate the designed component and get the real time results and know how the designed component works. 2. ANALYSIS PARAMETERS 2.1 Fatigue life Fatigue life is the available life for the given fatigue analysis. Fatigue Life can be over the whole model or on parts, surfaces, edges, and vertices. If loading is of constant amplitude, this represents the number of cycles until the part will fail due to fatigue. If loading is non-constant, this represents the number of loading blocks until failure. In actual consider the Fatigue life for a body was found to be 24,000 & We are loading the body for one hour each day then the expected model life would be 1,000 days. 2.2 Fatigue Damage Fatigue damage is defined as the design life/available life. The default design life maybe set manually. For Fatigue Damage, values greater than 1 indicate failure before the design life is reached. 2.3 Fatigue Safety Factor Fatigue safety factor is the factor of safety with respect to a fatigue failure at a given design life. The maximum Factor of Safety is 15. For Fatigue Safety Factor, values less than one indicate failure before the design life is reached. 2.4 Fatigue sensitivity It shows how the fatigue results change as a function of the loading at the critical location on the model. Sensitivity may be found for life, damage, or factor of safety. The user may set the number of fill points as well as the load variation limits. For example, the user may wish to see the sensitivity of the model's life if the FE load was 50% of the current load up to if the load 150% of the current load. Linear, Log-X, Log- Y, or Log-Log scaling can be chosen for chart display. 2.5 Biaxiality Indication This result gives the user some idea of the stress state over the model and how to interpret the results. Real world stress states are usually multiaxial. Biaxiality indication is defined as the principal stress smaller in magnitude divided by the larger principal stress with the principal stress nearest zero ignored. A biaxiality of zero corresponds to uniaxial stress, a value of -1 corresponds to pure shear, and a value of 1 corresponds to a pure biaxial state. In this example the
Transcript of Fatigue Life, Fatigue Damage, Fatigue Factor of Safety ...
International Research Journal of Engineering and Technology (IRJET) e-ISSN: 2395-0056
Volume: 07 Issue: 09 | Sep 2020 www.irjet.net p-ISSN: 2395-0072
© 2020, IRJET | Impact Factor value: 7.529 | ISO 9001:2008 Certified Journal | Page 1499
Fatigue Life, Fatigue Damage, Fatigue Factor of Safety, Fatigue Sensitivity,
Biaxiality Indication and Equivalent Stress of a Radial Connecting Rod
More Sri Vidhya1, K V Merlyn Christina2
1,2UG Student, Dept. of Mechanical Engineering, Mahatma Gandhi Institute of Technology, Hyderabad, India ---------------------------------------------------------------------***----------------------------------------------------------------------
Abstract - Radial Connecting rod is one of the most important parts in engine assembly which transfers energy from piston to crankshaft and convert the linear, reciprocating motion of a piston into the rotary motion of a crankshaft. The connecting rod primarily undergoes tensile and compressive loading under engine cyclic process. The forces acting on connecting rod are: - forces due to maximum combustion pressure, force due to inertia of connecting rod and reciprocating mass. From the viewpoint of functionality, connecting rods must have the highest possible rigidity at the lowest weight. [1]
Key Words: Radial connecting rod, Forces, Analysis, Fatigue
1. INTRODUCTION In this project, a radial type connecting rod is analysed based on different parameters. This radial connecting rod is designed in SolidWorks 2016 and later analysed in Ansys students version. The analysis is done for fatigue life, fatigue damage, fatigue factor of safety, fatigue sensitive, Biaxiality Indication.
1.1 SolidWorks SolidWorks is a solid modelling computer-aided design (CAD) and computer-aided engineering (CAE) software that runs primarily on Windows and MacOS operating system. The method generally used is to sketch 2D profile and use features like extrude, extrude cut, loft etc to produce the solid shapes. It is the widely used software for 3D modelling in various industries.
1.2 Ansys
Ansys is a computer software for both Windows and MacOS operating systems which is mainly designed for engineering tasks. It is mainly used for works like Simulation, structural and elemental analysis, prototyping, mathematical computations, Finite element analysis (FEM), Computational fluid dynamics (CFD) and so on.
In industries it is used to simulate the designed
component and get the real time results and know how the designed component works.
2. ANALYSIS PARAMETERS 2.1 Fatigue life
Fatigue life is the available life for the given fatigue analysis. Fatigue Life can be over the whole model or on parts, surfaces, edges, and vertices. If loading is of constant amplitude, this represents the number of cycles until the part will fail due to fatigue. If loading is non-constant, this represents the number of loading blocks until failure. In actual consider the Fatigue life for a body was found to be 24,000 & We are loading the body for one hour each day then the expected model life would be 1,000 days.
2.2 Fatigue Damage Fatigue damage is defined as the design life/available life. The default design life maybe set manually. For Fatigue Damage, values greater than 1 indicate failure before the design life is reached.
2.3 Fatigue Safety Factor Fatigue safety factor is the factor of safety with respect to a fatigue failure at a given design life. The maximum Factor of Safety is 15. For Fatigue Safety Factor, values less than one
indicate failure before the design life is reached. 2.4 Fatigue sensitivity It shows how the fatigue results change as a function of the loading at the critical location on the model. Sensitivity may be found for life, damage, or factor of safety. The user may set the number of fill points as well as the load variation limits. For example, the user may wish to see the sensitivity of the model's life if the FE load was 50% of the current load up to if the load 150% of the current load. Linear, Log-X, Log-Y, or Log-Log scaling can be chosen for chart display.
2.5 Biaxiality Indication This result gives the user some idea of the stress state over the model and how to interpret the results. Real world stress states are usually multiaxial. Biaxiality indication is defined as the principal stress smaller in magnitude divided by the larger principal stress with the principal stress nearest zero ignored. A biaxiality of zero corresponds to uniaxial stress, a value of -1 corresponds to pure shear, and a value of 1 corresponds to a pure biaxial state. In this example the
International Research Journal of Engineering and Technology (IRJET) e-ISSN: 2395-0056
Volume: 07 Issue: 09 | Sep 2020 www.irjet.net p-ISSN: 2395-0072
© 2020, IRJET | Impact Factor value: 7.529 | ISO 9001:2008 Certified Journal | Page 1500
majority of this model is under a pure uniaxial stress, with parts exhibiting both pure shear and nearly pure biaxiality. When using the biaxiality plot along with the safety factor plot above, it can be seen that the most damaged point occurs at a point of mostly uniaxial stress. If the most damaged spot was under pure shear, then it would be desirable to use S-N data collected through torsional loading if such data was available. Of course, collecting experimental data under different loading conditions is cost prohibitive and not often done. Note that for non-proportional fatigue loading, there are multiple stress states and thus there is no single stress biaxiality at each node. Thus, if the fatigue tool has non-proportional loading, the user may select either to view the average or standard deviation of stress biaxiality. The average value "y be interpreted as above and in combination with the standard deviation, the user can get a measure of how the stress state changes at a given location. Thus, a small standard deviation indicates a condition where the loading is near proportional while a larger deviation indicates change in the direction of the principal stress vectors. This information can be used to give the user additional confidence in his results or whether more in-depth fatigue analysis is needed to account for non-proportionality.
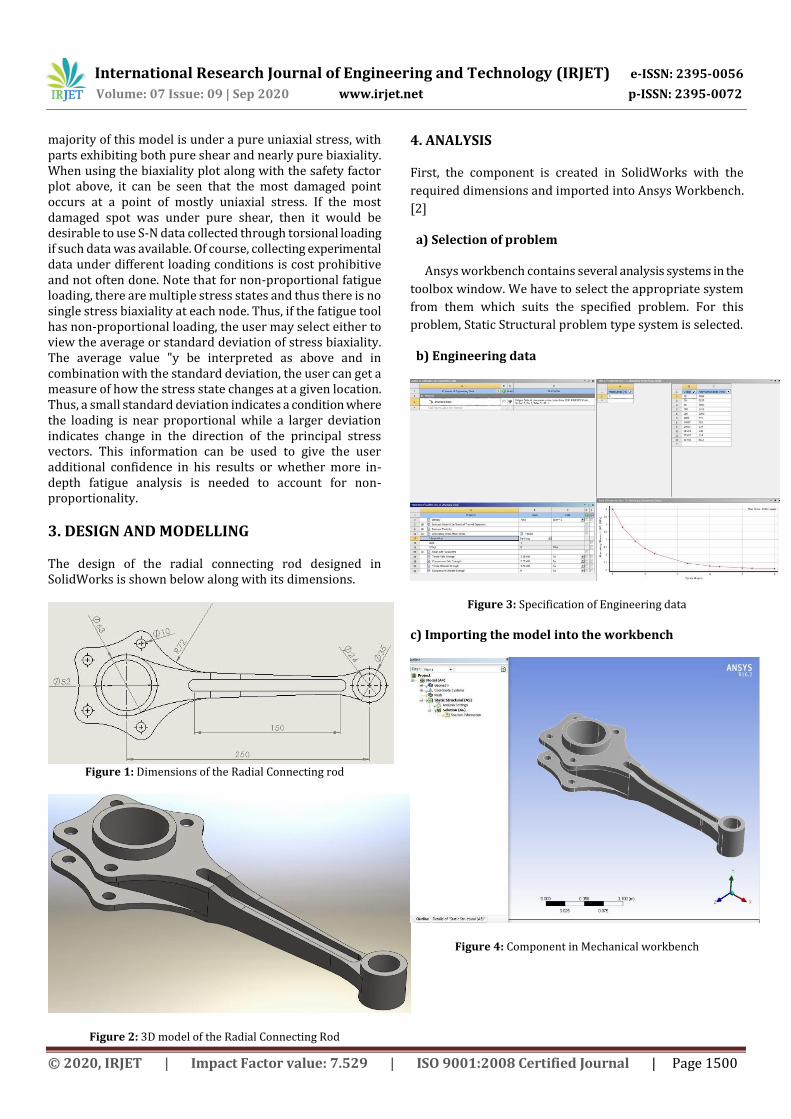
3. DESIGN AND MODELLING The design of the radial connecting rod designed in SolidWorks is shown below along with its dimensions.
Figure 1: Dimensions of the Radial Connecting rod
Figure 2: 3D model of the Radial Connecting Rod
4. ANALYSIS
First, the component is created in SolidWorks with the
required dimensions and imported into Ansys Workbench.
[2]
a) Selection of problem
Ansys workbench contains several analysis systems in the
toolbox window. We have to select the appropriate system
from them which suits the specified problem. For this
problem, Static Structural problem type system is selected.
b) Engineering data
Figure 3: Specification of Engineering data
c) Importing the model into the workbench
Figure 4: Component in Mechanical workbench
International Research Journal of Engineering and Technology (IRJET) e-ISSN: 2395-0056
Volume: 07 Issue: 09 | Sep 2020 www.irjet.net p-ISSN: 2395-0072
© 2020, IRJET | Impact Factor value: 7.529 | ISO 9001:2008 Certified Journal | Page 1501
d) Meshing
Figure 5: Meshing of Radial Connecting Rod
e) Defining Fatigue tool details
Figure 6: Fatigue Tools
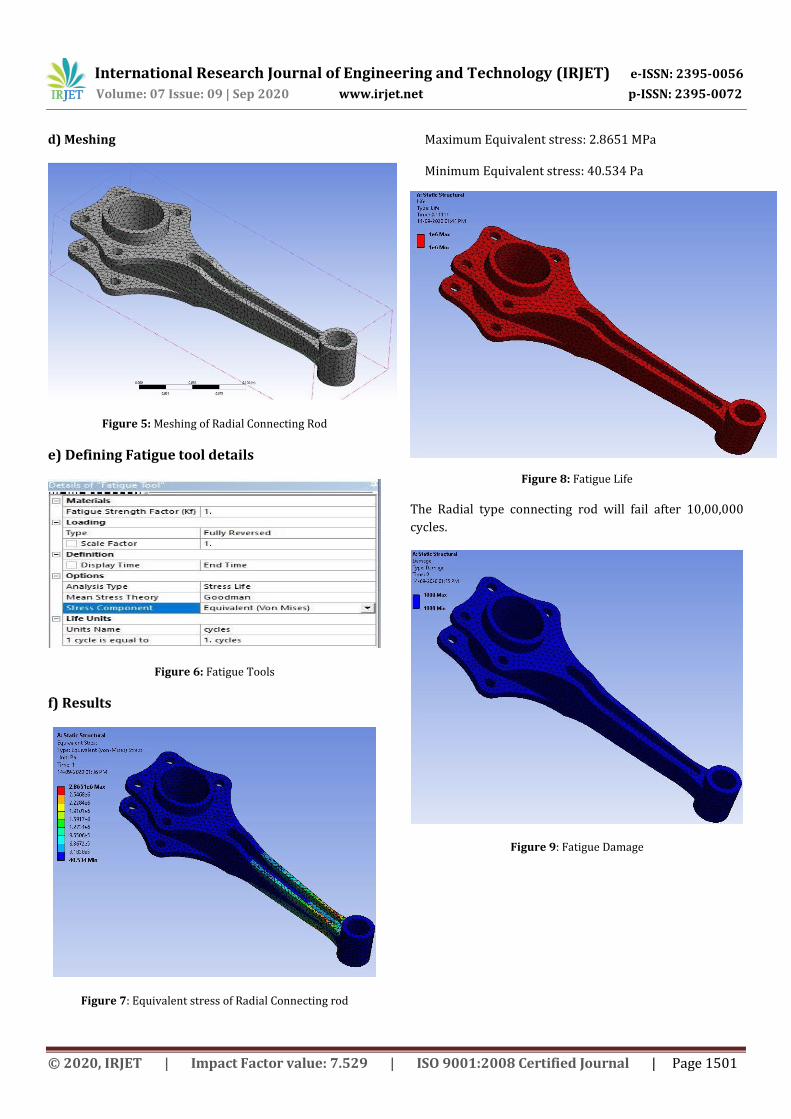
f) Results
Figure 7: Equivalent stress of Radial Connecting rod
Maximum Equivalent stress: 2.8651 MPa
Minimum Equivalent stress: 40.534 Pa
Figure 8: Fatigue Life
The Radial type connecting rod will fail after 10,00,000
cycles.
Figure 9: Fatigue Damage
International Research Journal of Engineering and Technology (IRJET) e-ISSN: 2395-0056
Volume: 07 Issue: 09 | Sep 2020 www.irjet.net p-ISSN: 2395-0072
© 2020, IRJET | Impact Factor value: 7.529 | ISO 9001:2008 Certified Journal | Page 1502
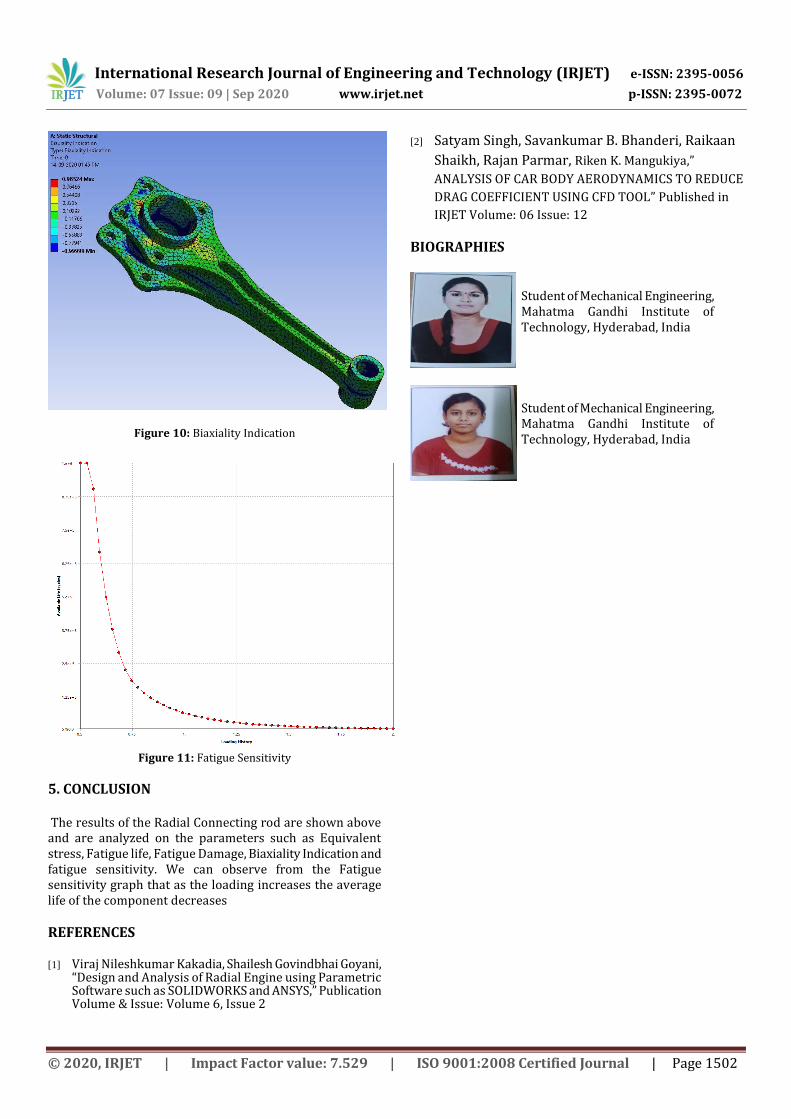
Figure 10: Biaxiality Indication
Figure 11: Fatigue Sensitivity
5. CONCLUSION The results of the Radial Connecting rod are shown above and are analyzed on the parameters such as Equivalent stress, Fatigue life, Fatigue Damage, Biaxiality Indication and fatigue sensitivity. We can observe from the Fatigue sensitivity graph that as the loading increases the average life of the component decreases
REFERENCES [1] Viraj Nileshkumar Kakadia, Shailesh Govindbhai Goyani,
“Design and Analysis of Radial Engine using Parametric Software such as SOLIDWORKS and ANSYS,” Publication Volume & Issue: Volume 6, Issue 2
[2] Satyam Singh, Savankumar B. Bhanderi, Raikaan
Shaikh, Rajan Parmar, Riken K. Mangukiya,”
ANALYSIS OF CAR BODY AERODYNAMICS TO REDUCE
DRAG COEFFICIENT USING CFD TOOL” Published in
IRJET Volume: 06 Issue: 12
BIOGRAPHIES
Student of Mechanical Engineering, Mahatma Gandhi Institute of Technology, Hyderabad, India
Student of Mechanical Engineering, Mahatma Gandhi Institute of Technology, Hyderabad, India