Usage Based Fatigue Damage Calculation for AH-64 …web.mit.edu/hchin/Public/HAI/AHS_Papers/Usage...
17
Usage Based Fatigue Damage Calculation for AH-64 Apache Dynamic Components P. Shanthakumaran 1 , Terry Larchuk 2 , Richard Christ 1 , David Mittleider 1 and Eric Hitchcock 1 1 Boeing Rotorcraft, Mesa, Arizona 2 Boeing Rotorcraft, Philadelphia, Pennsylvania Contact: E-mail: [email protected] , Phone: 480-891-6073 Abstract As part of the Condition Based Maintenance implementation for the rotorcraft fleet, the U.S. Army has laid out a multi- phased approach for the development, validation and demonstration of the usage-based fatigue damage calculation for critical life limited components on the rotorcraft. Phase-I effort involves development and validation of a new approach for usage-based fatigue damage calculation, Phase-II involves controlled implementation of that approach in field units and integration to the Standard Army Maintenance Information System (STAMIS) and Phase-III involves implementation in field operation that would lead to the development of a composite aircraft usage spectrum. This approach where the actual regimes flown by the aircraft are used, instead of the design usage spectrum, to calculate the damage accrued is called Structural Usage Monitoring System (SUMS). SUMS would lead to enhanced safety, reduced maintenance burden, increased operational availability, and reduced Operation and Support costs. Boeing Rotorcraft is under contract to the U.S. Army Apache Attack Helicopter (AAH) Project Manager’s Office (PMO) to develop, validate and implement a usage-based fatigue damage calculation for selected life-limited dynamic components on the AH-64 Apache. This paper documents the development and validation results for the Phase-I effort. Presented at The American Helicopter Society 66 th Annual Forum, Phoenix, Arizona, May 11-13, 2010. Copyright © 2010 by The American Helicopter Society International, Inc. All rights reserved. 1. Introduction Structural Usage Monitoring System (SUMS), where fatigue damage for life limited rotorcraft dynamic components are calculated based on actual aircraft usage, has been an area of focus for Condition Based Maintenance (CBM). The SUMS is used to calculate the damage accrued to serialized components and would lead to achieving the key CBM goals, which are reduced maintenance burden, increased operational availability, and reduced Operation and Support costs. In addition, SUMS can enhance safety of operation when the actual aircraft usage is more severe than the design usage spectrum. In such cases, SUMS can identify those components that may need to be replaced earlier than the life established by the design fatigue life. As part of the Condition Based Maintenance implementation for the rotorcraft fleet, the U.S. Army has laid out a multi-phased approach for the development of SUMS, which involves validation, and demonstration of the usage-based fatigue damage calculation for critical life limited components on the rotorcraft. Phase-I effort involves development and validation of a new approach for usage-based fatigue damage calculation, Phase-II involves controlled implementation of that approach in field units and integration to the Standard Army Maintenance Information System (STAMIS) and Phase- III involves implementation in field operation in order to develop a composite usage spectrum for the Army AH- 64D Apache fleet. The U.S. Navy in the early nineties had developed and implemented a fatigue life calculation system for helicopter components for the AH-1W fleet (Ref.1). The original specification for V-22 included structural life monitoring as part of the Vibration, Structural Life and Engine Diagnostics recorder (Ref. 2). Following the V- 22 effort, a structural usage monitoring capability for the UH-60 has been developed (Ref. 3). The U.S. Navy has developed a roadmap (Ref. 4) to implement structural usage monitoring system for other rotorcraft in their fleet including CH-53E. There has been several Government/Industry initiated efforts to develop and demonstrate SUMS for the Army rotorcraft platforms. SUMS development was performed by Boeing through an Army AATD (Aviation Applied Technology Directorate) contract in 1997 (Ref. 5). Following this effort, a fleet demonstration of the MH- 47E SUMS was performed (Ref. 6). Based on the successful demonstration on the MH-47E SUMS, a similar system for the AH-64D Apache was developed by Boeing, also through an AATD contract in 2000 (Ref. 7, 8 and 9). The AH-64D SUMS performed in 2000 included limited flight test for verification and validation of the system. Recently, development of SUMS for the commercial S-92 has been reported with the goal of receiving usage credits (Ref. 10). In addition to the development of SUMS for rotorcraft application, the U.S. Army Aviation Engineering Directorate (AED) has been pursuing the development of useful life improvement for the dynamic components through a process called remediation (Ref. 11) as part of
Transcript of Usage Based Fatigue Damage Calculation for AH-64 …web.mit.edu/hchin/Public/HAI/AHS_Papers/Usage...

Usage Based Fatigue Damage Calculation for AH-64 Apache Dynamic Components
P. Shanthakumaran1, Terry Larchuk2, Richard Christ1, David Mittleider1 and Eric Hitchcock1 1 Boeing Rotorcraft, Mesa, Arizona
2 Boeing Rotorcraft, Philadelphia, Pennsylvania Contact: E-mail: [email protected], Phone: 480-891-6073
Abstract As part of the Condition Based Maintenance implementation for the rotorcraft fleet, the U.S. Army has laid out a multi-phased approach for the development, validation and demonstration of the usage-based fatigue damage calculation for critical life limited components on the rotorcraft. Phase-I effort involves development and validation of a new approach for usage-based fatigue damage calculation, Phase-II involves controlled implementation of that approach in field units and integration to the Standard Army Maintenance Information System (STAMIS) and Phase-III involves implementation in field operation that would lead to the development of a composite aircraft usage spectrum. This approach where the actual regimes flown by the aircraft are used, instead of the design usage spectrum, to calculate the damage accrued is called Structural Usage Monitoring System (SUMS). SUMS would lead to enhanced safety, reduced maintenance burden, increased operational availability, and reduced Operation and Support costs. Boeing Rotorcraft is under contract to the U.S. Army Apache Attack Helicopter (AAH) Project Manager’s Office (PMO) to develop, validate and implement a usage-based fatigue damage calculation for selected life-limited dynamic components on the AH-64 Apache. This paper documents the development and validation results for the Phase-I effort.
Presented at The American Helicopter Society 66th Annual Forum, Phoenix, Arizona, May 11-13, 2010. Copyright © 2010 by The American Helicopter Society International, Inc. All rights reserved.
1. Introduction Structural Usage Monitoring System (SUMS), where fatigue damage for life limited rotorcraft dynamic components are calculated based on actual aircraft usage, has been an area of focus for Condition Based Maintenance (CBM). The SUMS is used to calculate the damage accrued to serialized components and would lead to achieving the key CBM goals, which are reduced maintenance burden, increased operational availability, and reduced Operation and Support costs. In addition, SUMS can enhance safety of operation when the actual aircraft usage is more severe than the design usage spectrum. In such cases, SUMS can identify those components that may need to be replaced earlier than the life established by the design fatigue life.
As part of the Condition Based Maintenance implementation for the rotorcraft fleet, the U.S. Army has laid out a multi-phased approach for the development of SUMS, which involves validation, and demonstration of the usage-based fatigue damage calculation for critical life limited components on the rotorcraft. Phase-I effort involves development and validation of a new approach for usage-based fatigue damage calculation, Phase-II involves controlled implementation of that approach in field units and integration to the Standard Army Maintenance Information System (STAMIS) and Phase-III involves implementation in field operation in order to develop a composite usage spectrum for the Army AH-64D Apache fleet.
The U.S. Navy in the early nineties had developed and implemented a fatigue life calculation system for helicopter components for the AH-1W fleet (Ref.1). The original specification for V-22 included structural life monitoring as part of the Vibration, Structural Life and Engine Diagnostics recorder (Ref. 2). Following the V-22 effort, a structural usage monitoring capability for the UH-60 has been developed (Ref. 3). The U.S. Navy has developed a roadmap (Ref. 4) to implement structural usage monitoring system for other rotorcraft in their fleet including CH-53E.
There has been several Government/Industry initiated efforts to develop and demonstrate SUMS for the Army rotorcraft platforms. SUMS development was performed by Boeing through an Army AATD (Aviation Applied Technology Directorate) contract in 1997 (Ref. 5). Following this effort, a fleet demonstration of the MH-47E SUMS was performed (Ref. 6). Based on the successful demonstration on the MH-47E SUMS, a similar system for the AH-64D Apache was developed by Boeing, also through an AATD contract in 2000 (Ref. 7, 8 and 9). The AH-64D SUMS performed in 2000 included limited flight test for verification and validation of the system. Recently, development of SUMS for the commercial S-92 has been reported with the goal of receiving usage credits (Ref. 10).
In addition to the development of SUMS for rotorcraft application, the U.S. Army Aviation Engineering Directorate (AED) has been pursuing the development of useful life improvement for the dynamic components through a process called remediation (Ref. 11) as part of

achieving the CBM objectives. The remediation process involves conducting engineering analysis and fatigue tests on high value components that are removed from service well before the component retirement time for other reasons such as damage due to removal and replacement or dings and scratches. The engineering analysis and tests conducted on these parts lead to exchanging unrealized fatigue life for increased damage/repair limits. The remediation process when implemented together with SUMS can achieve the Army CBM goals.
The key to achieving usage credits for SUMS is demonstrating the ability of the system to retain the same level of reliability as that established using the conventional safe life approach. Generating usage-based fatigue lives differ from the current fleet wide fatigue lives in that the life of a component (by serial number) is a function of the usage to which that component is subjected, rather than using a single fleet-wide component (by part number) fatigue life. The current fleet-wide component fatigue methodology has three constituents: measured flight loads, material fatigue strength, and an assumed usage spectrum. These constituents are used in conjunction with Miner’s Rule for the linear accumulation of fatigue damage for the fatigue life calculation. The resulting fatigue retirement life, in terms of flight hours, is applied to the entire population of a component in a fleet regardless of the actual usage to which an individual component is subjected. Empirical and statistical methods are applied to the three constituent inputs to the Miner’s Rule calculation as a means of introducing conservatism into the resulting calculated fatigue life. These include using a fatigue strength that is reduced from the mean, using a “composite worst case” usage spectrum, and designing flight loads surveys to collect higher than average loads for each maneuver category. Historically, this methodology has demonstrated an acceptable level of reliability at the fleet level. In general, the current methodology has been characterized as providing six-9’s (0.999 999) reliability (or a probability of failure of one in a million). This fleet level reliability is the accumulated reliability of the individual retired components, where the reliability of individual retired components will vary consistent with the variation in individual component usage.
The usage-based fatigue damage approach replaces the “composite worst case usage spectrum” assumption with the actual usage for each individual component. This approach gives retirement lives for parts as a function of the actual usage as quantified in terms of a Miner’s Rule fatigue damage calculation based on that actual usage. As a result, this approach can retire individual components at nearly the same levels of reliability.
The safe life reliability has been a subject of technical discussion for decades, as can be noted in Refs. 12 through 16, where the approach used to retain the reliability of usage-based fatigue calculations primarily is centered on recovering the conservatism built into using the worst-case design usage spectrum.
Structural Usage Monitoring System development for rotorcraft involves verification and validation of the Regime Recognition Algorithms (RRA) used for actual usage identification, fatigue Damage Fraction Calculation (DFC) based on actual usage and establishing the reliability of the usage-based fatigue damage calculation to the six-9’s reliability level.
This paper documents the Phase-I effort of the U.S. Army AH-64D Apache SUMS development. It includes the background for the current AH-64D SUMS development in support of the U.S. Army Aviation Directorate initiative, technical approach for SUMS, RRA and DFC validations and an approach for establishing the reliability of the usage-based fatigue calculation. Also included are recommendations of an approach for fleet implementation and ongoing and future efforts for the AH-64D SUMS development and fielding.
2. Background Towards meeting the U.S. Department of Defense objectives on CBM, the US Army/Aviation Engineering Directorate (AED) has developed and Program Offices (PMs) have fielded the VMEP/MSPU (Vibration Management Enhancement Program/Modernized Signal Processing Unit) system for the AH-64A/D, UH-60 and CH-47. The VMEP/MSPU system is a key Condition Based Maintenance (CBM) enabler for the US Army helicopter fleet. The primary function of the VMEP/MSPU system is to perform vibration monitoring of helicopter drive system components to provide CBM capability for the monitored components on the U.S. Army helicopter fleet. As of the end of 2009, the U.S. Army has more than 460 AH-64A/D Apache helicopters installed with MSPU operational in the field.
The MSPU system provides additional capability to record aircraft parametric data from the aircraft data bus. In the case of AH-64D Apache Longbow, the MSPU functions as a bus monitor on one of the aircraft 1553 multiplex data bus channels and records selected parametric data which are used to trigger onboard automatic vibration data acquisition in certain flight conditions using regime recognition algorithms.
Since the MSPU on the AH-64D records the aircraft 1553 multiplex data bus parametric data for the entire flight, this data could be post processed on a ground

station using appropriate Regime Recognition Algorithms to identify the actual regimes flown by the aircraft and calculate the fatigue damage for the life limited components based on actual usage to provide SUMS capability.
A key requirement for SUMS development for rotorcraft is onboard data recording capability. For the AH-64D Apache, the MSPU has provided the onboard data recording capability for use in SUMS development. In addition, the MSPU ground station (referred to as PC-GBS) that is used to process the vibration data to generate maintenance actions has the flexibility to host additional data processing capabilities. This flexibility in the MSPU PC-GBS can be leveraged to host regime recognition algorithms and damage fraction calculations for generating usage-based fatigue life for components, thus adding additional capability to an existing ground station.
Boeing-Rotorcraft is under contract to the U.S. Army AAH PMO to develop, validate and implement a usage-based fatigue damage calculation for selected life limited dynamic components on the AH-64 Apache. This paper documents the development and validation results for the Phase-I effort.
3. Technical Approach The technical approach used for the US Army Apache SUMS effort is to build on previous development efforts in the following areas. i) Leverage the maturity of the onboard MSPU on the AH-64D Apache to record the aircraft parametric data from the aircraft 1553 multiplex data bus at the desired data rates. ii) Utilize the flexibility of the MSPU ground station (PC-GBS) to host additional functionality such as the Regime Recognition Algorithm (RRA) and Damage Fraction Calculation (DFC) in order to process the aircraft parametric data recorded for each flight and subsequently move the DFC output to an Electronic Logbook. iii) Apply the rule-based RRA matured by Boeing for usage-based fatigue life calculations. The RRA software module with well-defined input/output interfaces can now be hosted into a ground station software. iv) Leverage the unified fatigue methodology approach that has been developed for the two Boeing rotorcraft platforms (Apache and Chinook) to address reliability (probability of failure) of actual usage-based fatigue calculation for life limited critical components.
Regime Recognition Algorithm/Damage Fraction Calculations It was decided to host the Boeing developed RRA/DFC module within the MSPU PC-GBS as an executable module. An interface Control Document for this was
generated (Ref. 17) and was provided to the MSPU PC-GBS developer (Honeywell). The MSPU recorded aircraft parametric data from the aircraft 1553 multiplex data bus are downloaded onto the ground station (PC-GBS) in order to calculate the fatigue damage for the components. The aircraft parametric data is used to identify the flight regimes flown during the flight using Regime Recognition Algorithms. Based on these regimes, combined with component loads obtained from flight loads survey data and component material strength (S-n curves) data, the fatigue damage for the components are calculated. The data flow for this process with in PC-GBS is illustrated in Figure-1.
Figure-1 RRA/DFC Implementation in MSPU PC-GBS
The RRA module is provided by Boeing in the form of an executable that is hosted in the PC-GBS. Boeing developed the Damage Fraction Calculations (DFC) based on the RRA with significant involvement from AED with the objective of retaining the reliability (probability of failure) of the approach the same as demonstrated by historical evidence.
The data items (1), (2), (3) and (4) shown in Fig. 1 are described below.
During the development stage of the project, the aircraft Flight Loads Survey (FLS) 1553 multiplex data was imported into the PC-GBS (1) using the Data Import facility available in the PC-GBS. (During Phase-II field implementation, the MSPU data from a web server will be imported into the PC-GBS for processing). The PC-GBS then passes this data to the RRA module (2) which generates an output (3) that includes the identified maneuver, start time and stop time for the maneuver, duration of the maneuver, aircraft configuration (gross weight, longitudinal and lateral center of gravity) and density altitude.

The output data from the RRA is passed on as input data to the DFC module where the fatigue damage for the components are calculated as output (4). The DFC module contains the flight loads data and material strength data (S-n curve) that are required to calculate the fatigue damage for the life limited components for the flight.
The input data to the RRA module (2), input data to the DFC module (3), and the output data from the DFC module (4) all are sent to a file store within the PC-GBS and for migration of the data to a web database for archival and eventual integration with the aircraft logbook. The damage fraction will be converted into “adjusted” flight hours before sending the data to the logbook, where the removal and repair/overhaul records for the components will be updated in accordance with the Army standard logistical system requirements.
4. Regime Recognition Algorithm Validation
The rule based Regime Recognition Algorithms used for the AH-64D Apache was initially developed based on the MH-47 SUMS development program (Ref. 5). Verification and validation of the AH-64D RRA against limited flight test data was performed in 2002 (Refs. 7, 8 and 9) where the aircraft parametric data recorded by the onboard Maintenance Data Recorder (MDR), that functions as the aircraft flight data recorder, was used as input data for the RRA. Since the completion of the initial development of the Apache RRA in 2002, Boeing has continued to refine the RRA for the AH-64D Apache in order to achieve a higher level of validation for application to Structural Usage Monitoring System. Aircraft Parametric Data for RRA For the current USG Apache SUMS program, it was decided to take advantage of the aircraft bus recording capability of the onboard MSPU to record all the aircraft parametric data required for the AH-64D Apache RRA. Table-1 provides a list of the aircraft flight parameters required for RRA. A subset of the aircraft parameters listed in Table-1 was already recorded by the MSPU in order to trigger automatic vibration data acquisition. The bus monitoring capability of the MSPU was reconfigured with the list of parameters in Table-1. In addition, MSPU onboard software was modified to save the recorded aircraft bus data at higher rates as required for the RRA input. All the dynamic aircraft parameter data are saved at 12.5 Hz and selected parameters such as aircraft gross weight are saved at lower rates. These aircraft parameters and recording rates meet the guidelines provided in Refs. 18 and 19.
Table-1 AH-64D Apache Aircraft States for RRA
SUMS VARIABLE Units Parameter Definition
1 time Seconds TIME Zulu time2 angle_pitch_deg Deg Pitch Angle Euler pitch angle
3 angle_roll_deg Deg Roll Angle Euler roll angle
4 angle_yaw_degDeg True Heading True heading (Euler yaw)
5 rate_pitch_dpsDeg/sec Pitch Rate Y component of angular
velocity in body axis
6 rate_roll_dpsDeg/sec Roll Rate X component of angular
velocity in body axis
7 rate_yaw_dpsDeg/sec Yaw Rate Z component of angular
velocity in body axis
8 vel_north_fps
Ft/sec North Velocity North component of inertial velocity in Earth coordinate system
9 vel_east_fps
Ft/sec East Velocity East component of inertial velocity in Earth coordinate system
10 vel_vertical_fps
Ft/sec Down Velocity Vertical component of inertial velocity in Earth coordinate system (+ down)
11 tas_lat_kntKnots Lateral Airspeed Y component of airspeed
in aircraft body coordinate
12 tas_long_kntKnots Longitudinal Airspeed X component of airspeed
in aircraft body coordinate
13 tas_knt
Knots Aircraft True Airspeed Aircraft True Airspeed (TAS)
14 accel xFt/sec^2 Longitudinal Acceleration X component of aircraft
acceleration at a/c CG
15 accel yFt/sec^2 Lateral Acceleration Y component of aircraft
acceleration at a/c CG
16 accel z
Ft/sec^2 Vertical Acceleration Z component of aircraft acceleration at a/c CG
17 posn_plt_long_stk_in
Inches Pilot Pitch Stick Position Pilot’s longitudinal stick position
18 posn_plt_lat_stk_in
Inches Pilot Roll Stick Position Pilot’s lateral stick position
19 posn_plt_pedal_inInches Pilot Yaw Pedal Position Pilot’s directional pedal
position
20 posn_plt_cltv_stk_inInches Pilot Collective Stick Position Pilot’s collective stick
position
21 altitude_pressure_ft Feet Pressure Altitude Pressure altitude
22 altitude_radar_ft Feet Radar Altitude Radar altitude23 torque_eng1_pcnt % Engine #1 Torque Left engine torque 24 torque_eng2_pcnt % Engine #2 Torque Right engine torque 25 rotor_speed_pcnt % Main Rotor RPM Main rotor speed26 gross_weight_lb Lb Aircraft Gross Weight Aircraft gross weight
27 cg_longitudinal_inInches
Aircraft Longitudinal CGLongitudinal component of the aircraft CG
28 cg_lateral_inInches Aircraft Lateral CG Lateral component of the
aircraft CG
29 temperature_static_c Deg C Outside Air Temperature Ambient air temperature
30 wowDiscrete Weight On Wheels Left squat switch position
31 rotor_brake_pstn Discrete Rotor Brake Position Rotor brake position Maneuver Recognition The rule based RRA consists of two parts: maneuver recognition and mapping the maneuvers to regimes used in the flight load spectrum for the aircraft. Table-2 below provides the base maneuvers included in the flight spectrum for the AH-64D Apache. The rule-based maneuver recognition algorithms consist of logic to identify the base maneuver, which when combined with other flight conditions identify the AH-64D Apache spectrum maneuvers. A set of the AH-64D Apache spectrum maneuvers is illustrated in Table-3. In general, the maneuver recognition algorithm involves identifying the three phases of the maneuver: Entry phase, Confirmed maneuver phase and Exit phase. The total maneuver time is equal to the sum of all three phases, if all three phases exist. Development of the AH-64D

Apache maneuver recognition algorithms have been presented in detail in References 7, 8 and 9. Table 2 AH-64D Apache Base Maneuvers Table-3 AH-64D Apache Spectrum Maneuvers Flight Test Data for Maneuver Recognition Validation As part of the USG Apache SUMS Phase-I effort, the Apache RRA was validated against the Flight Loads Survey (FLS) database available for the AH-64D. The AH-64D FLS database consists of a total of 42 flights which were conducted in the last ten years of the AH-64D Apache program. These FLS flights cover a range of aircraft configurations (weight and CG) and density altitudes, as shown in Table-4.
Table-4 AH-64D Apache FLS Database
Configuration WT [LB]
Long/Lat CG [IN]
Hd [FT]
Config-1 16,600 205.7/-0.1 3500 Config-2 18,700 204.6/-0.1 3500 Config-3 20,900 203.3/-0.2 3500 Config-4 16,600 205.7/-4.4 3500 Config-5 18,700 204.6/-2.9 3500 Config-6 16,600 205.7/-0.1 8500 Config-7 18,700 207.6/-3.75 3500 Config-8 19,500 207.2/-3.75 3500 Config-9 16,600 208.5/-4.4 3500
The FLS flight test maneuvers are flown in accordance with a set of maneuver standards for the AH-64D Apache (Ref. 20) that are designed to cover the flight maneuvers in the design usage spectrum. Both aircraft parameters and component loads generated for the flights are stored in the FLS database, where the data for each scripted maneuver is stored (“evented”) with start and stop times for the maneuver. The aircraft state parameters from the database for the FLS flights are used for the RRA validation. A total of 1127 maneuvers are evented and available for regime recognition validation. Each event has a test, point, description, and data start and stop time as shown in Table-5 for one of the tests (Test 232). The end of the description contains a maneuver code that is used to compare evented data to regime recognition output. RRA Validation for Scripted Flights Evented data from the FLS database are used to check the accuracy of the regime recognition algorithms. The RRA output shown in Table-6 contains Maneuver identification, aircraft time, start and stop times in seconds, and duration on the maneuver. Also included in the RRA output for the maneuver are aircraft gross weight, longitudinal CG, lateral CG and density altitude that are used for mapping the spectrum maneuver to a regime. For the evented maneuvers, time history data from the Boeing flight loads database is reviewed to ensure that the RRA has correctly identified the maneuvers. The Boeing flight test database analysis tool called ASAP (Access Select Analyze and Present) is used to review the time history data.
B1 Ground Op B17 Rearward FlightB2 Takeoff B18 PullupB3 Landing Approach B19 PushoverB4 Landing Flare B20 Pedal TurnB5 Landing B21 Banked TurnB6 Steady Flight B22 Engine TransitionB7 Translation B23 AutorotationB8 Control Reversal B24 Single Engine B9 Ascent B25 Lateral AgilityB10 Descent B26 Side Flare Kick OutB11 Acceleration B27 Rolling PulloutB12 Deceleration B28 Power CycleB13 Sideslip B29 Ground-Air-GroundB14 Sideward Flight B30 Roll ReversalB15 Sideward Accel. B31 Max PowerB16 Sideward Decel. B32 Unrecognized
AH-64D Maneuver Base Maneuver Flight ConditionsHover Turn Pedal Turn TAS < 20 ktsPedal Turn Pedal Turn TAS > 20 ktsTurn Banked Turn All other banked turnAutorotation Turn Banked Trun Autorotation conditionsTerrain Turn Banked Trun Terrain flight conditionsClimb Ascent delat(alt) > 100 ft
Unmask Ascent100ft >delat) > 15ft and Vx <20 kts
Collective Popup Ascent100ft >delat(alt) > 15ft and Vx >= 20 kts
Partial Power Descent Descent delat(alt) < 100 ft
Mask Descent-100ft >delat(alt) > -15ft and Vx < 20 kts
Power Dive Descent V > VHHover Control Reversals Hover Control reversalsLevel Control Reversals Level Flight Control reversalsSteady Heading Sideslip Sideslip TAS >= 100 ktsLeft and Right Sideslip Sideslip TAS < 100 kts
Sideward Accel/Decel Sideward AccelFollowed by sideward decel
Lateral Agility Sideward Decel Followed by sideward decel
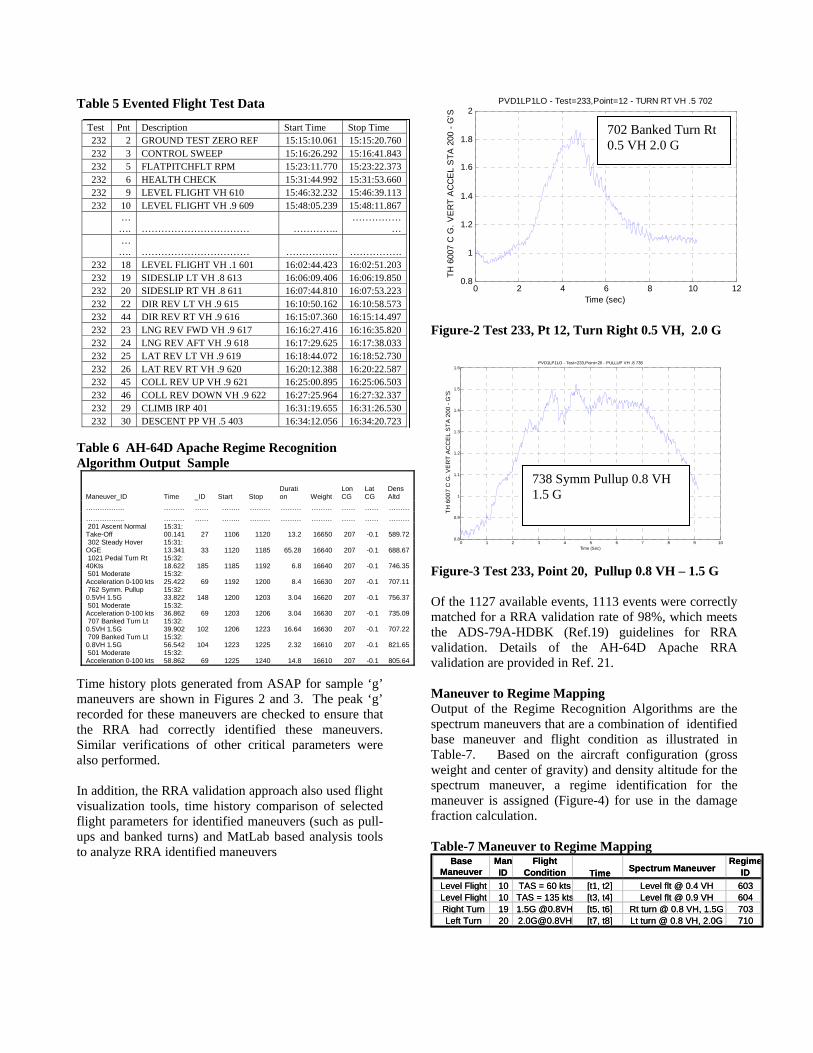
Table 5 Evented Flight Test Data
Table 6 AH-64D Apache Regime Recognition Algorithm Output Sample
Time history plots generated from ASAP for sample ‘g’ maneuvers are shown in Figures 2 and 3. The peak ‘g’ recorded for these maneuvers are checked to ensure that the RRA had correctly identified these maneuvers. Similar verifications of other critical parameters were also performed. In addition, the RRA validation approach also used flight visualization tools, time history comparison of selected flight parameters for identified maneuvers (such as pull-ups and banked turns) and MatLab based analysis tools to analyze RRA identified maneuvers
0 2 4 6 8 10 120.8
1
1.2
1.4
1.6
1.8
2PVD1LP1LO - Test=233,Point=12 - TURN RT VH .5 702
Time (sec)
TH
600
7 C
G. V
ER
T A
CC
EL
STA
200
- G
'S
Figure-2 Test 233, Pt 12, Turn Right 0.5 VH, 2.0 G
0 1 2 3 4 5 6 7 8 9 100.8
0.9
1
1.1
1.2
1.3
1.4
1.5
1.6PVD1LP1LO - Test=233,Point=20 - PULLUP VH .8 738
Time (Sec)
TH
600
7 C
G. V
ER
T A
CC
EL
STA
200
- G
'S
Figure-3 Test 233, Point 20, Pullup 0.8 VH – 1.5 G Of the 1127 available events, 1113 events were correctly matched for a RRA validation rate of 98%, which meets the ADS-79A-HDBK (Ref.19) guidelines for RRA validation. Details of the AH-64D Apache RRA validation are provided in Ref. 21. Maneuver to Regime Mapping Output of the Regime Recognition Algorithms are the spectrum maneuvers that are a combination of identified base maneuver and flight condition as illustrated in Table-7. Based on the aircraft configuration (gross weight and center of gravity) and density altitude for the spectrum maneuver, a regime identification for the maneuver is assigned (Figure-4) for use in the damage fraction calculation. Table-7 Maneuver to Regime Mapping
BaseManeuver
Man ID
Flight Condition Time Spectrum Maneuver
Regime ID
Level Flight 10 TAS = 60 kts [t1, t2] Level flt @ 0.4 VH 603Level Flight 10 TAS = 135 kts [t3, t4] Level flt @ 0.9 VH 604Right Turn 19 1.5G @0.8VH [t5, t6] Rt turn @ 0.8 VH, 1.5G 703Left Turn 20 [email protected] [t7, t8] Lt turn @ 0.8 VH, 2.0G 710
702 Banked Turn Rt 0.5 VH 2.0 G
738 Symm Pullup 0.8 VH 1.5 G
Test Pnt Description Start Time Stop Time 232 2 GROUND TEST ZERO REF 15:15:10.061 15:15:20.760 232 3 CONTROL SWEEP 15:16:26.292 15:16:41.843 232 5 FLATPITCHFLT RPM 15:23:11.770 15:23:22.373 232 6 HEALTH CHECK 15:31:44.992 15:31:53.660 232 9 LEVEL FLIGHT VH 610 15:46:32.232 15:46:39.113 232 10 LEVEL FLIGHT VH .9 609 15:48:05.239 15:48:11.867
…
…. …………………………… …………..……………
…
…
…. …………………………… ……………. ……………. 232 18 LEVEL FLIGHT VH .1 601 16:02:44.423 16:02:51.203 232 19 SIDESLIP LT VH .8 613 16:06:09.406 16:06:19.850 232 20 SIDESLIP RT VH .8 611 16:07:44.810 16:07:53.223 232 22 DIR REV LT VH .9 615 16:10:50.162 16:10:58.573 232 44 DIR REV RT VH .9 616 16:15:07.360 16:15:14.497 232 23 LNG REV FWD VH .9 617 16:16:27.416 16:16:35.820 232 24 LNG REV AFT VH .9 618 16:17:29.625 16:17:38.033 232 25 LAT REV LT VH .9 619 16:18:44.072 16:18:52.730 232 26 LAT REV RT VH .9 620 16:20:12.388 16:20:22.587 232 45 COLL REV UP VH .9 621 16:25:00.895 16:25:06.503 232 46 COLL REV DOWN VH .9 622 16:27:25.964 16:27:32.337 232 29 CLIMB IRP 401 16:31:19.655 16:31:26.530 232 30 DESCENT PP VH .5 403 16:34:12.056 16:34:20.723
Maneuver_ID Time _ID Start Stop Duration Weight
Lon CG
Lat CG
Dens Altd
…………….. ……… …… …….. ……… ……… ……… …… …… ……… …………….. ……… …… …….. ……… ……… ……… …… …… ……… 201 Ascent Normal Take-Off
15:31:00.141 27 1106 1120 13.2 16650 207 -0.1 589.72
302 Steady Hover OGE
15:31:13.341 33 1120 1185 65.28 16640 207 -0.1 688.67
1021 Pedal Turn Rt 40Kts
15:32:18.622 185 1185 1192 6.8 16640 207 -0.1 746.35
501 Moderate Acceleration 0-100 kts
15:32:25.422 69 1192 1200 8.4 16630 207 -0.1 707.11
762 Symm. Pullup 0.5VH 1.5G
15:32:33.822 148 1200 1203 3.04 16620 207 -0.1 756.37
501 Moderate Acceleration 0-100 kts
15:32:36.862 69 1203 1206 3.04 16630 207 -0.1 735.09
707 Banked Turn Lt 0.5VH 1.5G
15:32:39.902 102 1206 1223 16.64 16630 207 -0.1 707.22
709 Banked Turn Lt 0.8VH 1.5G
15:32:56.542 104 1223 1225 2.32 16610 207 -0.1 821.65
501 Moderate Acceleration 0-100 kts
15:32:58.862 69 1225 1240 14.8 16610 207 -0.1 805.64

Figure-4 Maneuver to Regime Mapping
5. Component Selection for End-to-End Validation
For the Phase-I AH-64D Apache SUMS effort, the Boeing/USG team generated a list of candidate components in order to select five dynamic components for the end-to-end validation of the SUMS approach. The criteria for selecting the five dynamic components included representation of Ground-Air-Ground (GAG) critical and flight critical parts as well as representation of most damaging maneuvers so that both RRA and DFC modules can be validated. Five Apache dynamic components that have been selected for the USG SUMS Phase-I effort are presented in Table-8 and are illustrated in Figures 5 through 9 below. Table-8 Dynamic Components Selected for Phase-I
Part Name Most damaging
maneuvers Type of damage
Pitch Housing
1001 - LAT AGILITY RIGHT 45 KT TO 0 1001 - LAT AGILITY RIGHT 45 KT TO 0 1018 - TERRN TURN, LEFT 60 KTS
1/maneuver, 1/rev 1/maneuver, 1/rev 1/maneuver, 1/rev
Lead-Lag Damper
1041/1042 - ALT DIVE RCVRY VH 1047/1048 - PITCH BACK ATTACK VH 747 - SYMM. PULLOUT,1.0VH, 2.5G
1/maneuver, 1/rev 1/maneuver, 1/rev 1/maneuver, 4/rev
M/R Drive Shaft (FMC/PGI) GAG 1/maneuver
T/R Gearbox Housing Assy
305 - OGE HOVER TURN RT GAG
1/maneuver, TR 2/rev 1/maneuver
Collective System
727 - RPO LEFT, .8VH, 2.0G 1047/1048 - PITCH BACK ATTACK VH GAG
1/maneuver, 1/rev 1/maneuver, 1/rev 1/maneuver
Figure-5 Main Rotor Pitch Housing
Figure-6 Main Rotor Lead-Lag Damper

Figure-7 Main Rotor Drive Shaft
Figure-8 Tail Rotor Gearbox Housing Assy
Figure-9 Collective System
6. Damage Fraction Calculation The RRA output for each flight generates the sequence of regimes flown along with the time spent in those regimes. In addition, all event based maneuver occurrences for the flight are also identified. Fatigue damage is tracked for high cycle fatigue loading (i.e. multiples of rotor rotational frequency loads within a regime) and low cycle fatigue loading (maneuver to maneuver peak load variation including ground-air-ground cycles (GAG) cycles). The component high cycle fatigue damage for the flight can then be calculated (Ref. 2), as illustrated in Equation-1, in two parts: i) Sum of damage rates for the regime multiplied by the time in regimes and ii) Sum of damage for number of maneuver event (such as control reversals) occurrences.
CcTr j
m
jji
n
ii DDDFChigh ×+×= ∑∑
== 11Eqn. (1)
Where DFChigh = Component damage for the flight based on RRA Dri = Damage rate for ‘i’ regime (damage/hour) Ti = Time in maneuver n = Total number of time based maneuvers Dcj = Damage per event for ‘j’ occurrence Cj= Number of ‘j’ event occurrences m = Total number of event occurrences
The component low cycle fatigue damage for the flight is calculated by first establishing a sequence of loads based on the RRA output sequence of regimes and the corresponding regime maximum and minimum loads. Cycle counting using rainflow-counting algorithms (Ref. 22) is then applied to this load sequence to generate fatigue load cycles. These loads are then used to calculate low cycle fatigue damage. The total damage is then the sum of the high cycle damage and the low cycle damage.

The Boeing developed Damage Fraction Calculation Module was designed to provide flexibility in the way the damage calculation is executed in order to accommodate reliability and data protection requirements. For component high cycle fatigue damage calculations, actual component s-n curve data and flight loads data can be stored and used to calculate fatigue damage, or fatigue damage rates can be stored in look-up tables. For low cycle fatigue damage calculations, regime maximum and minimum loads are stored for use in generating the maneuver to maneuver load sequencing, but the fatigue damage assigned to the resulting rainflow cycle counted fatigue loads can be accomplished either by actual calculation using stored component s-n data or by using a damage rate look-up table. The Damage Fraction Calculation module used for the Apache SUMS Phase-I program has the cycle counted loads data for components from the FLS database and the material strength data (S-n curve) embedded in the DFC module. In addition, a table of flight test data points mapped to the spectrum maneuvers (referred to as Rosetta Stone) and a table of alternate maneuvers for maneuver substitution in the case of missing loads for identified maneuvers (described in the Maneuver Selection subsection below) are also included in the DFC module. The DFC module is illustrated in Figure-10.
Figure-10 Damage Fraction Calculation Approach
The approach to embed all the data required for the damage fraction calculation with the DFC module has facilitated installation of this self contained module within the MSPU PC-GBS. In the event there needs to be a change to any one of the data contents of the DFC, a modified RRA/DFC module will be generated for installation on the PC-GBS. A potential candidate for modification may be the S-n curves in order to achieve the level of reliability required for the system. Strain Survey Loads The flight loads database contains measured loads for all the fatigue critical components in terms of cycle counted loads and maximum and minimum loads. The Damage Fraction Calculator uses cycle counted loads for regime damage calculations and maximum/minimum loads for maneuver-to-maneuver damage calculations based on top of the scatter loads in accordance with ADS-79A-HDBK (Ref.-19). S-n Curves The DFC results presented in this study are based on a working S-n curve with lognormal distribution. The working S-n curves meet the mean minus 3-sigma probability strength with 95% confidence in accordance with ADS-79A-HDBK (Ref.-19). Rosetta Stone The Rosetta Stone is a map of flight test number and points to maneuvers and aircraft configuration in the AH-64D Apache load spectrum. Maneuver Selection Figure-11 shows the process of selecting loads for each maneuver. The program determines the best matching loads data based on the recognized maneuver and the aircraft configuration. The Rosetta Stone is used to locate all possible test points for a given maneuver. Due to flight test instrumentation issues, not all test points may have data associated with it. The program checks which of the Rosetta Stone test points actually have data. Once a list of candidate maneuvers has been created, the flight test data from a configuration that best matches the fleet aircraft configuration is chosen. Loads data for a maneuver is chosen by comparing aircraft weight, altitude and CG location. The closest match is determined by generating a merit function, which is an average ratio of the aircraft data compared with the closet test data. If two configurations have the same merit function, then the max cyclic load determines which maneuver is used. If no data exists for a specific maneuver then the substitution list is used. The substitution list gives three alternatives to each maneuver. If data for the alternate
Regime Recognition Algorithm (RRA) Results for Flight
Component Damage Fraction for Flight
Damage Fraction Calculator (DFC)
S-n Curve Data for Component
Flight Loads Survey Data for Component
Rosetta Stone - Map of Flight Test Data to Maneuvers
Maneuver Substitution – Alternate Maneuvers for Missing Data

maneuvers is not found, then a damage fraction based on unrecognized time is given.
Figure-11 Maneuver Loads Selection Process in DFC Damage Calculation Details of the Damage Fraction Calculation are provided in Refs. 21 and 23. The damage calculation is based on Miner’s rule. Damage is the sum of flight maneuver high cycle fatigue damage and maneuver-to-maneuver low cycle fatigue damage. Using the selected flight loads and the S-n Curve definition, the damage fraction is calculated for each maneuver. Steady state maneuvers are time scaled if the regime maneuver time is greater than the flight test maneuver time. Scaling steady state maneuvers will enable the program to account for long periods for a given maneuver. The maneuver-to-maneuver damage is calculated based on the methodology proposed in Ref. 24. The sequenced
maneuver pairs are rain flow counted to account for the maneuver-to-maneuver damage. If the regime recognition labels a maneuver as unrecognized time then the unrecognized time damage fraction is used. The unrecognized time damage fraction is obtained from the damage rate defined in the AH-64D Apache FLS data (Ref. 25). The DFC output results file shown in Table-9 is a tab delimited text file and contains version information, RRA input file name, aircraft tail number, date flown, total flight hours, part name, part number, component and calculated damage for the flight. Table-9 Damage Fraction Calculation Output for Five Dynamic Components for One Flight Damage Fraction Calculator, Version 0.40 Data read from ../RRA_OUTPUT/pv01_2321.rra Aircraft TAILNU, flown 5/28/1999 1.938222 part number Component Damage
7-311411215
MAIN ROTOR PITCH HOUSING; LEAD-LAG LUG STA 34.5 0.000575
7-311411187 LEAD LAG DAMPER BODY 0.000153
7-211350021 M/R Drive Shaft (FMC/PGI) 0.000536
7-211350021 T/R Gearbox Housing Assy 0.001109
7-311511117, 7-311511107, 7-211511133, 7-211511134
COLLECTIVE SYSTEM 0.000077
The damage fraction values will be converted into “adjusted” flight hours, based on the existing component life which have been established based on conventional fatigue calculations, and passed on to the Electronic logbook for parts tracking. Damage Fraction Calculation for Selected Dynamic Components The damage fraction calculation for the dynamic components selected in Section-5 were computed for the available AH-64D Apache FLS data that includes 42 flights containing more than 72 flight hours. The selected dynamic components are main rotor housing, lead-lag damper body, main rotor drive shaft, tail rotor gearbox housing assembly and collective system. A summary of the damage rates (damage/hour) for these components over 71.8 flight hours are presented in Table-10.

Table-10 Damage Calculation Summary for Apache FLS Data
Component Fight Hrs
RRA-DFC Damage/Hr
Design Spectrum Damage /Hr
Damage Comparison with Design Spectrum
MR Pitch Housing 71.8 0.00135 0.003247 42% Lead Lag Damper Body 71.8 0.00075 0.001120 67% MR Drive Shaft 71.8 0.00026 0.000443 59% TR Gearbox Housing Assy 71.8 0.00068 0.000752 90% Collective System 71.8 0.00041 0.000381 108%
Results from the regime recognition/damage fraction calculation are compared to damage rates generated from the Flight Strain Survey data based on design spectrum. For three of the five components (main rotor pitch housing, lead-lag damper body and main rotor drive shaft), the damage rates for these flights obtained based on regime recognition are significantly less when compared with those generated based on design spectrum. For the other two components (tail rotor gearbox housing assembly and collective system) damage rates from RRA/DFC were nearly the same when compared to those from the design spectrum. As the damage fraction calculation based on regime recognition is exercised for a larger number of flight hours, it can be anticipated that most components will result in less damage than the damage based on the design spectrum. However, a few components can be expected to result in higher damage.
7. Reliability Approach for Actual Usage-based Fatigue Calculations
Maintaining adequate reliability is the key requirement that drives validation requirements for all of the elements that go into the damage fraction calculation and retirement criteria. The change from the current flight hour based methodology to usage methodology changes the calculus for determining the fleet reliability. This is demonstrated in Figure-12 where a notional representation of the current methodology is presented. The vertical “FH Based Retirement” (Flight Hours) line represents the deterministic fatigue life calculated using the current methodology using the “most severe” usage.
At retirement, components exposed to the most severe usage would have an associated risk or reliability. Components exposed to less severe usage would have a lower risk at retirement. As a result, the overall fleet risk is less (higher reliability).
Flight Hour Based Safe Life
0
20
40
60
80
100
120
0 200 400 600 800 1000 1200 1400
Flight Hours
Ris
k
Acceptable Risk of Crack Initiation, component
FH Based Retirement
Variable Risk at FH due to usage variability
Most Severe Usage
Most Benign Usage
Fleet Risk
Figure-12 Current Flight Hour Based Reliability
Usage Based Safe Life
0
20
40
60
80
100
120
0 200 400 600 800 1000 1200 1400
Flight Hours
Ris
k
Acceptable Risk of Crack Initiation, Component
FH Based
Constant Risk -Life Extension
Most Severe Usage
Most Benign
Fleet Risk
Figure-13 Notional Variation in Service Life for Usage-based Fatigue Lives Under usage monitoring, variability in component risk due to usage variability is eliminated and components are retired at variable flight hours. This is shown notionally in Figure 13. To maintain the same fleet level risk, the individual retirement criteria is set to be equal to the fleet level risk. Note that this spread between the fleet risk line and the individual component risk line represents the so-called “missing 9” or the reduction in reliability that occurs if usage monitoring is implemented without any adjustments in retirement criteria. In that instance, all
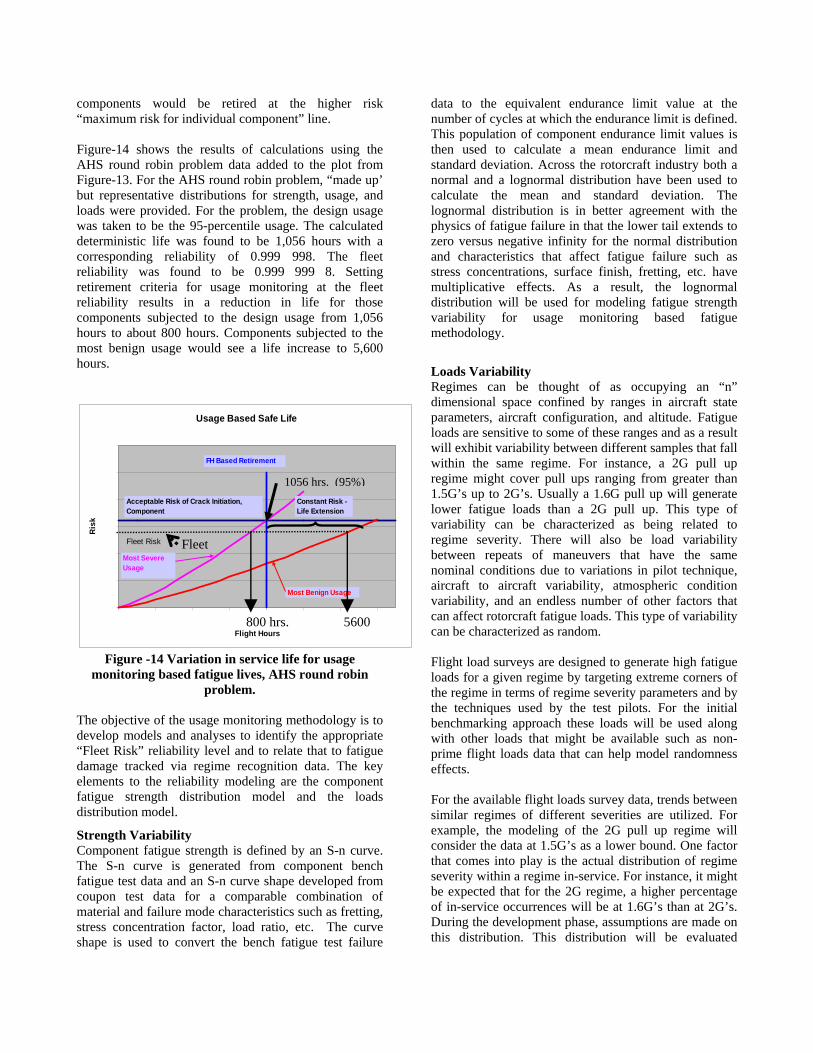
components would be retired at the higher risk “maximum risk for individual component” line. Figure-14 shows the results of calculations using the AHS round robin problem data added to the plot from Figure-13. For the AHS round robin problem, “made up’ but representative distributions for strength, usage, and loads were provided. For the problem, the design usage was taken to be the 95-percentile usage. The calculated deterministic life was found to be 1,056 hours with a corresponding reliability of 0.999 998. The fleet reliability was found to be 0.999 999 8. Setting retirement criteria for usage monitoring at the fleet reliability results in a reduction in life for those components subjected to the design usage from 1,056 hours to about 800 hours. Components subjected to the most benign usage would see a life increase to 5,600 hours.
Figure -14 Variation in service life for usage
monitoring based fatigue lives, AHS round robin problem.
The objective of the usage monitoring methodology is to develop models and analyses to identify the appropriate “Fleet Risk” reliability level and to relate that to fatigue damage tracked via regime recognition data. The key elements to the reliability modeling are the component fatigue strength distribution model and the loads distribution model.
Strength Variability Component fatigue strength is defined by an S-n curve. The S-n curve is generated from component bench fatigue test data and an S-n curve shape developed from coupon test data for a comparable combination of material and failure mode characteristics such as fretting, stress concentration factor, load ratio, etc. The curve shape is used to convert the bench fatigue test failure
data to the equivalent endurance limit value at the number of cycles at which the endurance limit is defined. This population of component endurance limit values is then used to calculate a mean endurance limit and standard deviation. Across the rotorcraft industry both a normal and a lognormal distribution have been used to calculate the mean and standard deviation. The lognormal distribution is in better agreement with the physics of fatigue failure in that the lower tail extends to zero versus negative infinity for the normal distribution and characteristics that affect fatigue failure such as stress concentrations, surface finish, fretting, etc. have multiplicative effects. As a result, the lognormal distribution will be used for modeling fatigue strength variability for usage monitoring based fatigue methodology.
Loads Variability Regimes can be thought of as occupying an “n” dimensional space confined by ranges in aircraft state parameters, aircraft configuration, and altitude. Fatigue loads are sensitive to some of these ranges and as a result will exhibit variability between different samples that fall within the same regime. For instance, a 2G pull up regime might cover pull ups ranging from greater than 1.5G’s up to 2G’s. Usually a 1.6G pull up will generate lower fatigue loads than a 2G pull up. This type of variability can be characterized as being related to regime severity. There will also be load variability between repeats of maneuvers that have the same nominal conditions due to variations in pilot technique, aircraft to aircraft variability, atmospheric condition variability, and an endless number of other factors that can affect rotorcraft fatigue loads. This type of variability can be characterized as random. Flight load surveys are designed to generate high fatigue loads for a given regime by targeting extreme corners of the regime in terms of regime severity parameters and by the techniques used by the test pilots. For the initial benchmarking approach these loads will be used along with other loads that might be available such as non-prime flight loads data that can help model randomness effects. For the available flight loads survey data, trends between similar regimes of different severities are utilized. For example, the modeling of the 2G pull up regime will consider the data at 1.5G’s as a lower bound. One factor that comes into play is the actual distribution of regime severity within a regime in-service. For instance, it might be expected that for the 2G regime, a higher percentage of in-service occurrences will be at 1.6G’s than at 2G’s. During the development phase, assumptions are made on this distribution. This distribution will be evaluated
Usage Based Safe Life
0
20
40
60
80
100
120
0 200 400 600 800 1000 1200 1400
Flight Hours
Ris
k
Acceptable Risk of Crack Initiation, Component
FH Based Retirement
Constant Risk - Life Extension
Most Severe Usage
Most Benign Usage
Fleet Risk Fleet
1056 hrs. (95%)
5600 800 hrs.

during the controlled introduction phase by evaluating the regime metrics tracking (max and min G’s for each regime will be part of the tracking metrics). Adjustments as appropriate will be made based on the in-service data; also, this will be monitored as part of the operational phase continued airworthiness. The actual distribution modeling technique employed relies first on use of the Weibull distribution that has been shown to be applicable in several published studies. The general approach is to use a Weibull distribution to model the distribution of fatigue loads within a given sample. The characteristic life (eta) and slope (beta) for each available sample are then evaluated. The expectation is that in general, a representative beta can be selected and the variation in eta between samples can be used to model the sample-to-sample variation. The modeling distribution for the regime then becomes a Weibull distribution using a representative beta with an eta that is itself a distribution. The transition from the initial benchmarking approach to the full reliability approach will require gathering fleet loads data to validate the loads distribution models. These data will be evaluated in the same manner to determine fleet loads and distribution.
Damage Calculation For the benchmarking modeling, fatigue damage is calculated using the strength distribution and the approximated loads distribution to create output of fatigue damage as a function of reliability. These results are used to evaluate the deterministic damage calculation to see if the deterministic value provides adequate representative reliability or if adjustments are needed. Once robust modeling is available for the loads distribution, fatigue damage is defined by the selected required reliability value.
Example Reliability Calculation The reliability calculation is demonstrated for the AH-64D Apache Lead-Lag Damper body component for a symmetric pull-up maneuver (2.0 g pull-up at 0.8Vh). This maneuver is performed as a test/point during the test and as a housekeeping maneuver at the conclusion of each test. The maneuver is performed per the maneuver standards guide (Ref. 20) during the test. The housekeeping maneuver is flown as an operational cyclic pull-up. This example shows the following steps for calculating fatigue damage and corresponding reliability: fatigue bench test data analyses to develop a distribution for the fatigue strength, distribution modeling of the fatigue loads, and the damage/reliability calculation process.
The S-n curve for the lead-lag damper was generated from eight test specimens which were tested to failure. A lognormal distribution for the S-n curve is used. Table-11 provides information on each of the available flight test data points for the maneuver: The configuration, database, maneuver description, test, point, and the fatigue damage resulting from the occurrence of the maneuver, calculated with the legacy methodology and with SUMS methodology using log normal strength distribution. Table-12 presents the statistics of the flight test data for each test and point. Statistics are the maximum and minimum load during the point, and the mean and cyclic load for the maneuver. Table-11 Damage per Maneuver for Single aircraft Configuration Maneuver Test Pn
t Legacy Damage
SUMS Damage
740 PU 0.8 Vh 2.0g 259 10 0.0000143 0.0000170 740 PU 0.8 Vh 2.0g 233 21 0.0000126 0.0000154 740 PU 0.8 Vh 2.0g 348 33 0.0000099 0.0000119 740 PU 0.8 Vh 2.0g*
235 50 0.0000031 0.0000013
740 PU 0.8 Vh 2.0g*
232 39 0.0000023 0.0000032
740 PU 0.8 Vh 2.0g*
233 60 0.0000012 0.0000000
740 PU 0.8 Vh 2.0g*
234 43 0.0000066 0.0000010
740 PU 0.8 Vh 2.0g*
236 58 0.0000012 0.0000000
740 PU 0.8 Vh 2.0g*
237 37 0.0000039 0.0000017
740 PU 0.8 Vh 2.0g*
239 39 0.0000000 0.0000000
740 PU 0.8 Vh 2.0g*
240 39 0.0000000 0.0000000
*Housekeeping Maneuver Table -12 Loads for 2.0g Pull-Up Maneuver Test
Point
Max
Min
Mean
Cyclic ½ pk to pk
259 10 4008.6 -4725.7 123.42 4367.1 233 21 3822.8 -4911.5 -44.441 4213.0 348 33 3062.5 -4846.8 -292.41 3954.7 235 50* 3451.1 -3849.6 70.675 3650.4 232 39* 3132.5 -4247.8 57.322 3690.2 233 60* 2867.0 -3371.8 -100.86 3119.4 234 43* 3185.6 -3955.8 -8.2451 3486.7 236 58* 2468.8 -4115.1 -661.74 3292.0 237 37* 2495.4 -4991.2 -511.21 3728.6 239 39* 2495.4 -3610.7 -338.81 3053.0 240 39* 2920.1 -3318.7 18.346 3033.8

The flight loads data provides a comparison of the damage caused by a flight test maneuver flown to the instructions in the maneuver Standards Guide and a housekeeping maneuver flown in a more typical manner. For this example, based on the calculated fatigue damages, the flight test maneuver is an order of magnitude more damaging than the house keeping maneuver. References 26 and 27 suggest that a Weibull distribution of the binned cyclic flight loads is the appropriate distribution model for loads. Cyclic data from the eight bin tables for the housekeeping 2G pull-up samples were each processed with Weibull analysis. These data fit well when bin data are plotted without the entry and recovery as shown in Figure-15.
Figure-15 Binned Data w/o Entry and Recovery Weibull Plot This approach of using the distribution of these binned data to define the distribution of the loads is used for this example. Table-13 shows a summary of the Weibull fit results for the FLS and housekeeping 2G pull ups and also results for 1.5G and 3G FLS pull-ups. The eta values are plotted as a function of G’s in Figure-16. The spread in the housekeeping etas at 2G’s represents variability due to randomness. The variability due to regime severity for the 2G pull up would be expected to range from the 1.5G eta value to the 2G peak values. The actual distribution for in-service operation would be dependent on the distribution of G’s between 1.5 and 2, which would be counted in the 2G regime.
Table-13 Summary of Weibull Fit Results, 2g, 1.5g, and 3g Pullups
g level
Test Program
ID
Test Point Bin Table eta beta
2.0g 740 259 10 4367.14 3334 4.881 2.0g 740 233 21 4367.14 3287 5.501 2.0g 740 348 33 3954.66 3239 4.753 2.0g 740 235 50* 3650.35 2969 6.081 2.0g 740 232 39* 3690.17 3043 6.248 2.0g 740 233 60* 3119.39 2586 7.486 2.0g 740 234 43* 3570.71 2968 6.816 2.0g 740 236 58* 3253.22 3016 6.762 2.0g 740 237 37* 3743.26 3159 6.312 2.0g 740 239 39* 3053.02 2658 7.547 2.0g 740 240 39* 3119.4 2695 7.449 1.5g 738 259 9 2119 13.259 3.0g 742 233 23 4129 2.674 3.0g 742 259 16 3930 2.64
Figure-16 Variation in Eta as a Function of G's Weibull distribution fit of the eta values for the eight housekeeping 2G pull-ups result in eta = 2978 lbs. with beta equal 16.96. Based on the housekeeping 2G pull ups, the load distribution can be approximated by a Weibull distribution with a beta equal to the average beta for the housekeeping data (beta = 6.83) and an eta value that is itself a Weibull distribution with beta = 16.96 and eta = 2978 lbs. Fatigue damage and reliability calculations were conducted using this model for the loads distribution. To evaluate the results, consider the damage rates from the first row of Table-11 (Test 259, Point 10). These would be the damage rates used in the conventional flight hour calculation where the Legacy Damage represents the use of a normal distribution for strength (damage = 1.43x10⁻⁵) and the SUMS Damage represents the use of a log normal distribution for strength (damage = 1.70x10⁻⁵). Comparing these damage
0
500
1000
1500
2000
2500
3000
3500
4000
4500
1 10
G's
eta
- lb
s.
Hdbk - 2g's
Housekeeping - 2g's
Hdbk - 1.5g'sHdbk - 3g's

rates to the reliability calculation indicates a reliability level of approximately 0.9997. Considering the eta distribution as a function of G’s as shown in Figure-16, the use of the housekeeping data eta distribution is a conservative estimation for the overall distribution covering the 2G pull up regime range of 1.5 to 2G’s. The actual distribution of pull ups within the 2G pull up regime range of G’s would have to be determined from in-service usage data. However, for an estimate, an adjustment was made in the eta value where the housekeeping eta value of 2978 lbs. was reduced by 1/3 of the difference between that value and the 1.5G value. This adjustment results in an eta value of 2551 lbs. Fatigue damage and reliability calculations were performed for this value of eta. In this instance, the high legacy and SUMS damage rates from Table-10 have reliability levels of approximately 0.999998. This is close to the traditional target of six-9’s reliability and suggests that the deterministic flight hour damage rate could provide adequate reliability for usage monitoring. Any assumption of the distribution of 2G pull ups as a function of G’s would have to be validated using the controlled introduction phase and monitored on a continuing basis to assure continued airworthiness. Details of the reliability calculations are presented here are available in Ref. 28. Loads variation in a component for usage-based fatigue calculation can be eliminated if direct loads measurement for the component is available. The current Operations Support and Sustainment Technology (OSST 6.3) effort reported in Ref. 29 is using direct loads measurement for selected rotorcraft components to improve the reliability of the usage-based fatigue calculations. A maturated direct loads monitoring system can be applied for selected high pay-off components for usage-based fatigue calculation in fielded systems.
8. Summary Results from the AH-64D Apache SUMS Phase-I effort on the application Regime Recognition Algorithms, Damage Fraction Calculations, and illustration of reliability of usage-based life calculation are presented. Specifics are summarized below. i) Regime Recognition Algorithms are validated against
42 flight hours of AH-64D Apache Flight Loads Survey database, where 98% of the maneuvers flown in the database have been successfully identified by RRA.
ii) Damage Fraction Calculation based on actual usage for five dynamic components for 72 flight hours are
calculated and compared against damage obtained for the design usage spectrum. Usage-based damage fraction for three components (main rotor pitch housing, lead-lag damper body and main drive shaft) were significantly lower when compared to the design spectrum based damage fraction. Two other components (tail rotor gearbox housing assembly and collective system) resulted in nearly the same level of damage for both approaches.
iii) Reliability calculation for the lead-lag damper body
component based on loads variability is illustrated for a 2.0 G symmetric pull-up maneuver where the load can vary based on how the maneuver was flown between 1.5 G to 2.0 G pull-up which are binned as 2.0 G pull-up maneuver. A Weibull fit for the loads variability is used in the reliability calculations. Through an adjustment to the eta parameter for the Weibull distribution of the loads, it is demonstrated that a six-9’s reliability can be achieved.
The usage-based fatigue damage calculations for the five selected AH-64 Apache dynamic components presented in this paper has demonstrated that the regime recognition algorithms and damage fraction calculations can now be applied for controlled field evaluations. Load variation within the binned loads can be modeled to establish the appropriate adjustment required to achieve six-9’s reliability.
9. Recommendations for Usage-based Fatigue Life Implementation
The usage monitoring based fatigue methodology includes the following dependent modeling elements:
i) regime recognition algorithms that characterize operational time in terms of defined flight maneuvers and aircraft configurations
ii) fatigue loads assignment to each regime iii) high cycle fatigue damage assignment to each
regime iv) low cycle load fatigue damage assignment for
maneuver to maneuver and ground air ground low cycle fatigue loads
v) total damage tracking vi) individual component retirement criteria vii) component and fleet level reliability
The transition to usage-based retirement lives requires a rigorous validation process to ensure this method provides correct fatigue damage with an acceptable level of reliability. The models used for usage-based fatigue lives require inputs from on-board sensors, data storage, data processing, and usage tracking for all life limited parts on each aircraft. All of these constituents in usage

monitoring must be validated as well as all of the mitigation processes for any failures of the constituents. Due to the complex variety of rotorcraft operations, the large amount of data needed to fully characterize all operational possibilities, and the cost limiting factors in obtaining that data, the implementation of usage monitoring will most likely require three phases: Development, Controlled Introduction, and Operational.
Development Phase The AH-64D Apache Structural Usage Monitoring System Phase-I effort presented in this paper addresses all the tasks to be completed in the development phase for a usage-based fatigue calculation process. The development phase includes traditional design usage spectrum, fatigue bench testing with emphasis on failures, and flight loads survey. Development of regime recognition algorithms, fatigue strength modeling, and fatigue loads modeling and damage calculation modeling are also included. Verification and validation of the process is performed during the development phase.
Controlled Introduction Phase Characteristics of the controlled introduction phase include partial or full fleet sampling of usage data, usage evaluation including usage spectrum update, targeted regime selection for additional loads collection, and in-service load survey candidate selection. Damage evaluation that is part of benchmarking of modeling evaluation and retirement criteria are also included. Models and processes used for usage damage evaluation are validated during this phase. Robust reliability models are also developed in this phase.
Operational Phase Characteristics of the operational phase could include full fleet operation, scheduled updates to usage spectrum and scheduled reviews of usage and damage tracking results. Fatigue strength sampling program (bench test selected retired parts) and scheduled in-service load surveys (“bell weather” loads) will also be part of the operational phase. In order to benefit from the SUMS implementation, the fleet electronic logbook needs to be modified to provide the capability to track individual parts by serial number so that a serialized part when moved to a different aircraft can be tracked for correct usage.
10. Ongoing and Future Tasks Phase-II of the AH-64D Apache Structural Usage Monitoring System effort, which has been started in the
fall of 2009, addresses the controlled introduction phase of the program. As a Phase-II risk reduction effort, the U.S. Army Apache Program has teamed with the South Carolina Army National Guard (SCARNG) to collect a set of field data from their 24-MSPU equipped AH-64D Apache fleet. Flight data gathered from the SCARNG AH-64D fleet for a period of four months during their regular operations, totaling 1200 flight hours, will be analyzed using the RRA/DFC hosted in the MSPU PC-GBS. The outcome of the Phase-II effort will identify the process for developing the aircraft usage spectrum based on the evaluation of flight data using regime recognition algorithms. Based on the identification of frequently occurring high damage regimes and frequently occurring moderate regimes, targeted selection for additional flight-loads data collection will be established. Candidate components for direct loads measurement for use in SUMS will also be assessed for a more accurate fatigue life calculation. In addition, the goal of Phase-II is to demonstrate interfacing the damage fraction calculation output from SUMS to the Standard Army Maintenance Information System (STAMIS). This interface will be in terms of adjusted flight hours where the remaining useful life for the components (in terms of remaining flight hours) can be calculated for component parts life tracking. After successful completion of the Phase-II effort at SCARNG, the U.S. Army AAH PMO plans to field the MSPU-based SUMS in operational units. The Phase-III objective is to develop a composite usage spectrum for the fleet.. It is anticipated that the Phase-III effort would involve collecting usage data from multiple Army AH-64D operational units to cover different usages including standard unit operation, training operations and combat operations.
11. Acknowledgments The authors would like to acknowledge the continued technical involvement in the AH-64D Apache SUMS program by key personnel (Dr. Robert Vaughan, Dr. Robert Benton and Dr. Chang) from the U.S. Army Aviation Engineering Directorate. The continued support provided by Jerry Jacobs from Honeywell is also acknowledged. The authors would also like to thank Michele Kochoff Platt (AVNIK Defense Solutions, Inc) from the Apache Program office for her review of this paper and her tireless effort in keeping the program on track. The AH-64D Apache SUMS effort is being funded by the U.S. Army AAH PMO.

12. References 1. Moon, S., Moon, D., and Barndt, G., “Fatigue Life
Reliability Based on Measured Usage, Flight Loads and Fatigue Strength Variations,” American Helicopter Society 52nd Annual Forum, Washington, D.C., June 4-6, 1996.
2. Martin, W., Collingwood, G., and Barndt, G., “Structural Life Monitoring on the V-22,” American Helicopter Society 55th Annual Forum, Montreal, Quebec, Canada, May 25-27, 1999.
3. Barndt, Gene, et al, “ Maneuver Regime Recognition Development and Verification for H-60 Structural Monitoring,” 63rd American Helicopter Society Annual Forum, Virginia Beach, VA, May 1-3, 2006.
4. Maley, S., et al., “ US Navy Roadmap to Structural Health and Usage Monitoring – The Present and Future,” American Helicopter Society 63rd Annual Forum, Virginia Beach, VA, May 1-3, 2007.
5. Teal, R.S., et al, “Regime Recognition for MH-47E Structural Usage Monitoring,” American Helicopter Society 53rd Annual Forum, Virginia Beach, VA, April 29 – May 1, 1997.
6. Robeson, E., “MH-47E Structural Monitoring System (SUMS) Fleet Demonstration Results,” American Helicopter Society 56th Annual Forum, Virginia Beach, VA, May 2-4, 2000.
7. “Apache Longbow Structural Usage Monitoring System (ALB SUMS),” USAAMCOM TR-02-D10, 28 February 2002.
8. Christ, R. et al, “Apache Longbow Structural Usage Monitoring System,” American Helicopter Society 56th Annual Forum, Virginia Beach, VA, May 2-4, 2000.
9. Lu, Yi, et al, “AH-64D Apache Longbow Structural Usage Monitoring System,” American Helicopter Society 58th Annual Forum, Montreal, Canada, June 11-13, 2002.
10. Davis, M., “Rotorcraft Structural Health Monitoring System,” American Helicopter Society 65th Annual Forum, Grapevine, Texas, May 27-29, 2009.
11. Martin, E.D. and Page, T.M., “Useful Life Improvements to Dynamic Components through Remediation,” American Helicopter Society 61st Annual Forum, Grapevine, Texas, June 1-3, 2005.
12. Zion, H.L., “Safe Life Reliability: Evaluation of New Statistical Methods,” American Helicopter Society Annual Forum, Phoenix, AZ, May 1991.
13. Vaughan, R. E., Chang, J.H., and Rogers, M.H., “Obtaining Usage Credits from Monitoring of Helicopter Dynamic Components without Impacting Safe Life Reliability,” American Helicopter Society 63rd Annual Forum, Virginia Beach, VA, May 1-3, 2007.
14. Brown, M.A., and Chang, J.H., “Analytical Techniques for Helicopter Component Reliability,” American
Helicopter Society 64th Annual Forum, Montreal, Canada, April 29 – May 1, 2008.
15. Benton, R.E., “Cumulative-Damage Reliability for Random-Independent (Normal- or Weibull-Distributed) Fatigue Stress, Random-fixed Strength, and Deterministic Usage,” American Helicopter Society 65th Annual Forum, Grapevine, Texas, May 27-29, 2009.
16. Adams, D.O., and Zhao, J., “Searching for the Usage Monitor Reliability Factor using and Advanced Fatigue Reliability Assessment Model,” American Helicopter Society 65th Annual Forum, Grapevine, Texas, May 27-29, 2009.
17. “Interface Control Document for MSPU PC-GBS to Host SUMS Regime Recognition Algorithms and Damage Fraction Calculations,” Document Number D-0251-07-A022-001, 24 November 2008.
18. “Assessment of Helicopter Usage Monitoring System Requirements,” DOT/FAA/AR-04/3, April 2004.
19. “Aeronautical Design Standard Handbook for Condition Based Maintenance Systems for US Army Rotorcraft,” ADS-79A-HDBK, 18 June 2009.
20. “AH-64D Longbow Flight Loads Survey Maneuver Standard Guide,” Boeing Report, April 2000.
21. “Regime Recognition Damage Fraction Calculator,” Boeing STN 09-016, April 2009.
22. ASTM E 1049-85 (Reapproved 2005) “Standard Practices for Cycle Counting in Fatigue Analysis,” ASTM International.
23. “End-to-end Fatigue Life Calculations for Selected Components (AH-64D Apache,” Document Number D-0251-07-A012-001, August 2009. Boeing report submitted to the US Army.
24. Benton, R.E., Dudley, R.J., and Chang, J.H., “Maneuver-to-Maneuver Load Cycle Case Study,” American Helicopter Society 65th Annual Forum, Grapevine, Texas, May 27-29, 2009.
25. “US Army AH-64D Longbow Production Aircraft Fatigue Substantiation Report,” MSIPL10060-011-03R, Rev B, October 11, 2002.
26. Harris, W., Larchuk, T., Zanoni, E., Zion, L., “Application of Probabilistic Methodology in the Development of Retirement Lives of Critical Dynamic Components in Rotorcraft,” American Helicopter Society 55th Annual Forum, Montreal, Canada, May 1999.
27. Boorla, R., Rotenberger, K., “Load Variability of a Two-Bladed Helicopter,” Journal of the American Helicopter Society, January, 1997.
28. “Verification and Validation Plan for Usage-based Fatigue Life Calculation”, Document Number D-0251-07-A020-001, August 2009. Boeing report submitted to the US Army.
29. Baker, T., Thompson, B., Ferrie, C., Augustine, M., and Yeary, D., “Operations Support and sustainment Technologies for Current and Future Aircraft,” American Helicopter Society 65th Annual Forum, Grapevine, Texas, May 27-29, 2009.