European Embedded Value 2014 - Corporativo MAPFRE · Increase in the distribution expenses of the...
36
European Embedded Value 2014 5 th May 2015
Transcript of European Embedded Value 2014 - Corporativo MAPFRE · Increase in the distribution expenses of the...

European Embedded Value 20145th May 2015

2
Contents
1 EEV analysis
2 Towers Watson opinion letter
3 Methodological appendix
4 Statistical appendix
5 Glossary

3
2014 %
Value of In-force Business (VIF)(1) 1,811.2 9.4%
European Embedded Value (EEV)(1) 3,219.2 15.3%
Attributable to the Parent Company 2,178.8 11.2%
Attributable to Minority Interests 1,040.4 24.9%
Return on Embedded Value (RoEV) 12.7% 4.2 p.p.
Present Value of New Business Income (PVNBI)(1) 4,523.4 25.0%
Value added by new business(1) 182.3 21.6%
New business margin 4.0% -0.1 p.p.
EEV analysis1
Million Euros
Development of the EEV in 2014
Key highlights
1) No adjustments made for the share of minority interests
Significant 15.3% increase in the EEV, reflecting:• the downward shift in the yield curve used for discounting• the decrease in the tax rate from 30% in 2014 to 28% in 2015 and 25% in future years• larger new business volumes• the increase in the market value of the investment portfolio • the inclusion of the portfolio from the former network of Bancaja (Aseval) and Laietana into the
new agreement signed with Bankia

4
736.9
2.791,5
871.4
3,219.2
398.7
1.955,4
(244.9) (54.6)
536.6
2,153.4
(276.5)(65.7)
ANAVParent2013
ANAVMinorityInterests
PVIF CoC TVFOGs 2013 EEV ANAVParent2014
ANAVMinorityInterests
PVIF CoC TVFOGs 2014 EEV
EEV analysis1
EEV components and their variation in 20142013 EEV 2014 EEV
Million Euros
1) No adjustments made for the share of minority interests
(1)(1)

5
1
Breakdown of the 2014 EEV
EEV analysis
By business line By distribution channel
1) PVIF = “Present Value of In-Force business”2) Includes the in-force values of the Life assurance and accidental death insurance businesses3) EEV calculations based on an amount of capital equal to 100% of the minimum required solvency margin as at 31/12/2014
Million Euros
€ mill. % %
Adjusted Net Asset Value 1,408.0 43.7% 24.0%
Net PVIF(1) - Life Assurance(2) 1,610.8 50.0% 16.7%
- PVIF 1,866.6 15.9%
- CoC (255.8) 11.5%
Net PVIF(1) - Mutual Funds 128.5 4.0% -13.4%
- PVIF 130.2 -13.1%
- CoC (1.7) 6.3%
Net PVIF(1) - Pension Funds 137.6 4.3% -24.1%
- PVIF 156.6 -19.8%
- CoC (19.0) 37.7%
TVFOGs (65.7) -2.0% 20.3%
EEV 2014 3,219.2 100.0% 15.3%
Initial capital used to calculate the CoC(3) 817.8 1.7%
€ mill. % %
Adjusted Net Asset Value 1,408.0 43.7% 24.0%
Net PVIF - Agents' channel 852.1 26.5% 3.3%
- PVIF 1,000.4 4.5%
- CoC (148.3) 12.4%
Net PVIF - Bank channels 1,024.8 31.8% 15.8%
- PVIF 1,153.0 15.5%
- CoC (128.2) 13.4%
TVFOGs (65.7) -2.0% 20.3%
EEV 2014 3,219.2 100.0% 15.3%
Initial capital used to calculate the CoC(3) 817.8 1.7%

6
1
Share of the parent company in the 2014 VIF
EEV analysis
Million Euros
1,876.9
(65.7)
1,811.2
(503.8)
1,307.4
Net PVIF pre-TVFOGs
TVFOGs Net PVIFpost-TVFOGs
Minorityinterests
VIFattributable
toMAPFRE VIDA

7
2,791.5 2,779.8 2,779.8 2,786.6 2,824.5
3,006.83,132.1
2,779.8
3,132.13,219.3 3,219.3
(11.6) 6.837.9
182.3
142.3 (17.0)
352.3
206.6 (119.5)
EEV 2013 Changes inmodel
Changes inassumptions
Expectedreturn
Value added bynew business
Deviationof actual value
fromexpectations
Change inTVFOGs
Value added in2014
Additions (2) Dividends paidand other items
EEV 2014
RoEV = 12.7% (1)
1
Value added in 2014
EEV analysis
Change in Embedded Value
1) Return on Embedded Value = Value added in the year / Embedded Value 2013, adjusted for changes in model2) Inclusion of the portfolio from the former network of Bancaja (Aseval) and Laietana into the new agreement signed with Bankia
Million Euros

8
1
Changes in modelChanges in model
Mainly reflects the inclusion of more detailed information regarding the pricing of Group Life-Protection policies in the agents’ channel (-€12.5 million)
Change Description
EEV analysis
Analysis of the main variations in EEV
Changes in assumptionsChanges in assumptions
Reflects the positive impact of the downward shift in the swap curve (+€128.4 million) and the decrease in the future tax rate (+€115.5 million)This was offset by: changes in the commission ladder, which resulted in higher costs (-€109.4 million), lower fee-related revenues from pension plans and mutual funds (-€85.7 million) and a decline in financial returns (-€21.0 million)
Expected returnExpected returnIncludes the impact of the unwinding of the discount rate (+€34.8 million), and the expected after-tax investment return on the adjusted net asset value at the beginning of the year, net of the cost of capital (+€3.2 million)

9
Analysis of the main variations in EEV (contd.)
1
Change Description
Deviation of actual value from expectations
Deviation of actual value from expectations
Reflects primarily the positive impact on the net asset value of the increase in the market value of financial investments
TVFOGsTVFOGs The increase in costs of the TVFOGs is due to the downturn in the yield curve
EEV analysis

10
1
Value added by new business
EEV analysis
Development of the value added Key highlights
149.9182.3
4.1% 4.0%
2013 2014
Value added by new business (€ million)
Margin over PVNBI (%)
11Larger margins in the agents’ network, due to the greater weight of life-protection insurance
44Increase in the distribution expenses of the mutual funds business
22
Strong increase in new business volumes of pension plans in both channels, as well as of mutual funds in the agents’ channel
55Greater weight of new pension fund business, whose margin is comparatively lower
33 Decrease in the discount and tax rates

11
1
Sensitivity analysis of the value of in-force business(1)
EEV analysis
1) VIF = PVIF – TVFOGS – CoC2) The 25bp increase represents a probability of default of 1.04 times that applied to the whole fixed income portfolio included in the credit risk adjustment to the VIF
Variation in VIF Resulting valueSensitivity
100bp increase in interest rates
10% decrease in the value of stocks and real estate
10% decrease in expenses
10% decrease in the lapse rate
5% decrease in mortality and morbidity
25bp increase in the default rate of the fixed
income portfolio(2)
Base scenario:1,811.2
Million Euros
-86.8
-12.2
56.2
173.3
-11.1
-209.5
54.3100bp decrease in
interest rates
1,724.4
1,799.0
1,867.4
1,984.5
1,800.1
1,601.7
1,865.5

12
-6.8
-0.9
5.4
29.8
-1.0
10.1
1
Sensitivity analysis of the value added by new businessEEV analysis
100bp increase in interest rates
10% decrease in the value of stocks and real estate
10% decrease in expenses
10% decrease in the lapse rate
5% decrease in mortality and morbidity
Variation in the value added by new business Resulting valueSensitivity
Base scenario: 182.3
Million Euros
176.7
181.4
187.7
212.1
181.3
100bp decrease in interest rates 192.4
13
Contents
1 EEV analysis
2 Towers Watson opinion letter
3 Methodological appendix
4 Statistical appendix
5 Glossary

14
2 Towers Watson opinion letter

15
Contents
1 EEV analysis
2 Towers Watson opinion letter
3 Methodological appendix
4 Statistical appendix
5 Glossary

16
Methodological appendix
Covered business
3
The 2014 embedded value was calculated for all the domestic businesses issued by MAPFRE VIDA and its subsidiaries, which include the following blocks of business:
– Life assurance (including complementary) and accidental death insurance businesses of MAPFRE VIDA, sold through the agents’ channel
– Life assurance (including complementary) and accidental death insurance businesses of BANKIA MAPFRE VIDA (formerly MAPFRE-CAJA MADRID VIDA) and ASEVAL
– Life assurance (including complementary), accidental death insurance and pension funds businesses of CATALUNYACAIXA, CCM VIDA Y PENSIONES, BANKINTER SEGUROS DE VIDA, UNIÓN DUERO VIDA and DUERO PENSIONES
– Mutual funds and pension funds businesses of MAPFRE INVERSIÓN S.V., S.A., MAPFRE INVERSIÓN DOS, S.G.I.I.C., S.A. and MAPFRE VIDA PENSIONES, E.G.F.P., S.A. de Seguros, S.A. ("MAPFRE INVERSIÓN Y PENSIONES")
The MAPFRE GROUP operates Life Assurance business in several geographies which have not been included in the EEV calculation
Non-covered business

17
Methodological appendix
Methodology
3
The embedded value of the life assurance, accidental death insurance, mutual funds and pension funds businesses includes the adjusted net asset value and the value of in-force business, defined as follows:
– Embedded value = Adjusted Net Asset Value + Value of In-Force Business– Adjusted Net Asset Value (ANAV) = Shareholders’ equity at market value, adjusted to obtain the economic value of capital– Value of the In-Force Business (VIF) = PVIF – TVFOGs – CoC
A bottom-up approach was followed to comply with EEVP, valuing separately each risk component in the business, since it was deemed that this methodology provides the most transparent information about shareholder value, better quantifies the risk in each product, differentiating between in-force and new business
Adjusted Net Asset Value:– The Adjusted Net Asset Value or "ANAV” is equal to shareholders’ equity as defined under IFRS, adjusted for:
committed donations and dividends; goodwill; deferred expenses; and any other item needed to calculate the economic value of capital
Present Value of In-force Business:
– The Present Value of In-force Business or “PVIF” is determined as the present value of future statutory profits which are expected to be generated from the existing business in force at the valuation date, after tax and discounted using the euroswap curve. Investment returns for existing business have been calculated on the basis of the euroswap curve, except for existing fixed interest assets backing the Life-Savings business, where book returns adjusted for credit risk based on historical transition matrices and defaults rates have been used. Life-Savings business VIF represents 18.2% of the total EEV. PVIF includes the intrinsic value of financial options and guarantees granted to the insured.
– Financial returns on future investments have been calculated on the basis of the euroswap curve.
18
Methodological appendix
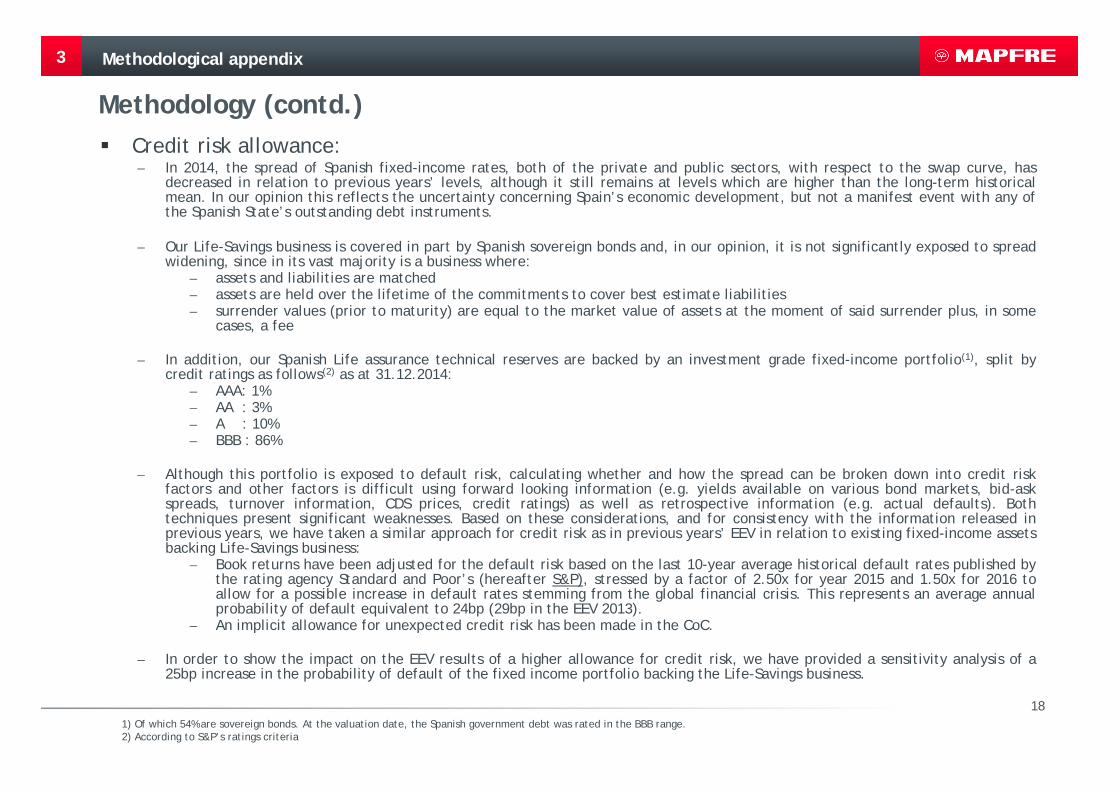
Methodology (contd.)
3
Credit risk allowance:– In 2014, the spread of Spanish fixed-income rates, both of the private and public sectors, with respect to the swap curve, has
decreased in relation to previous years’ levels, although it still remains at levels which are higher than the long-term historicalmean. In our opinion this reflects the uncertainty concerning Spain’s economic development, but not a manifest event with any ofthe Spanish State’s outstanding debt instruments.
– Our Life-Savings business is covered in part by Spanish sovereign bonds and, in our opinion, it is not significantly exposed to spreadwidening, since in its vast majority is a business where:
– assets and liabilities are matched– assets are held over the lifetime of the commitments to cover best estimate liabilities– surrender values (prior to maturity) are equal to the market value of assets at the moment of said surrender plus, in some
cases, a fee
– In addition, our Spanish Life assurance technical reserves are backed by an investment grade fixed-income portfolio(1), split bycredit ratings as follows(2) as at 31.12.2014:
– AAA: 1%– AA : 3%– A : 10%– BBB : 86%
– Although this portfolio is exposed to default risk, calculating whether and how the spread can be broken down into credit riskfactors and other factors is difficult using forward looking information (e.g. yields available on various bond markets, bid-askspreads, turnover information, CDS prices, credit ratings) as well as retrospective information (e.g. actual defaults). Bothtechniques present significant weaknesses. Based on these considerations, and for consistency with the information released inprevious years, we have taken a similar approach for credit risk as in previous years’ EEV in relation to existing fixed-income assetsbacking Life-Savings business:
– Book returns have been adjusted for the default risk based on the last 10-year average historical default rates published bythe rating agency Standard and Poor’s (hereafter S&P), stressed by a factor of 2.50x for year 2015 and 1.50x for 2016 toallow for a possible increase in default rates stemming from the global financial crisis. This represents an average annualprobability of default equivalent to 24bp (29bp in the EEV 2013).
– An implicit allowance for unexpected credit risk has been made in the CoC.
– In order to show the impact on the EEV results of a higher allowance for credit risk, we have provided a sensitivity analysis of a25bp increase in the probability of default of the fixed income portfolio backing the Life-Savings business.
1) Of which 54% are sovereign bonds. At the valuation date, the Spanish government debt was rated in the BBB range.2) According to S&P’s ratings criteria

19
Methodological appendix
Methodology (contd.)
3
TVFOGs:
– Under EEVP, FOGs (Financial Options and Guarantees) are defined as those features of the coveredbusiness conferring potentially valuable underlying guarantees, or options to change, the level ornature of policyholders’ benefits and exercisable at the discretion of policyholders, whose potentialvalue is impacted by the performance of financial variables.
– The cost of FOGs is valued through the measurement of two different elements:• intrinsic value: the cost of FOGs under existing conditions at the valuation date• time value: the change in the cost of FOGs resulting from potential changes in policyholders’ benefits
that may occur throughout the life of the policy– The intrinsic value of FOGs is already recognised implicitly in the calculation of the PVIF. It is therefore
necessary to include the additional cost arising from the time value of FOGs (TVFOGs).– TVFOGs was calculated for the main FOGs in the covered Life business. Specifically, the calculation
focused on the TVFOGs corresponding to the guaranteed interest rate in with-profits products, as wellas on other products with variable interest rates and minimum guaranteed returns.
– The calculation of TVFOGs assumed the realisation of gains/losses on equity and property investmentsto:
• minimise the impact of profit sharing on the Company’s results; and• keep the asset mix close to its breakdown as at 31.12.2014.
– TVFOGs is based on 2,000 stochastic simulations of market-consistent financial assumptions and isequal to the difference between the value of in-force business calculated under a deterministicapproach and the average value of the in-force business calculated stochastically.

20
Methodological appendix
Methodology (contd.)
3
CoC:
– In line with Spanish market practices, the CoC used in the calculation of the 2014 EEV was measured byapplying a 4% p.a. fixed rate to the minimum required solvency margin.
– This represents an allowance for frictional costs, non-hedgeable risks as well as unexpected credit riskwhich has not been considered in the present value of in-force business.
With-profits business:
– MAPFRE’s with-profits in-force business comprises products with the following features that are common in theSpanish insurance market:
• A minimum return guarantee, ranging between 0.75% and 6.0% in the case of MAPFRE.• A profit-sharing mechanism defined as: X% of (Financial return – minimum guaranteed return – expense loadings) on the average
mathematical reserve, which cannot be negative under any circumstance. X% varies by product, although it is equal to 90% in most cases.Financial returns and their volatility depend on the book returns of the assets backing the product, and is subject to some degree ofdiscretion by management including, for instance, decisions on the realisation of gains/losses and on the asset mix.
– The combination of a minimum return guarantee and a profit-sharing mechanism that cannot yield negative resultsgenerates asymmetric flows for shareholders and, as a consequence, a positive time value of FOGs.

21
Methodological appendix
Methodology (contd.)
3
Look through EEVP:
– In order to assign correctly revenues and expenses to the businesses that generate them and measurethe value of each block of business more consistently with its economic reality, the followingadjustments were made:
• The mutual funds business, as well as a part of pension funds and accidental death businesses, are soldthrough the distribution network of MAPFRE VIDA. The EEV and VNB of the aforementioned mutual funds,pension funds and accidental death businesses have been adjusted in order to include the net presentvalue of the future profits/losses expected to arise in the distribution company from this business.
• The assets of the Life assurance business are managed by MAPFRE INVERSIÓN Y PENSIONES. The EEV andVNB of the aforementioned Life assurance business have been adjusted in order to include the netpresent value of the future profits/losses expected to arise in the asset management company from thisbusiness.

22
Methodological appendix
Methodology (contd.)
3
Value added by new business:
– In Life assurance, new business is defined as single, extraordinary and regular premiums written inthe year, as well as extraordinary contributions to existing policies not already considered in thevaluation of the in-force business. In the mutual funds business, new business is defined as newcontributions. In the pension funds business, new business is defined as single, extraordinary andregular contributions from new participants, as well as extraordinary contributions from existingparticipants.
– The value added by new business is the intrinsic value added by new business in the period, net ofacquisition expenses, TVFOGs and CoC, valued at year-end using the assumptions applicable at thatpoint in time.

23
Based on the euroswap zero-coupon
Euroswap zero-coupon curve as at 31/12/2013
1 year 0.16%5 years 0.36%10 years 0.82%15 years 1.17%20 years 1.36%
curve as at 31/12/2013
- Based on internal analyses- Expressed in Euros per policy- Indexed to a 2.5% inflation
In line with the existing fee structure
Tables based on the company’sown experience
100% of the minimum solvency margin4% p.a.
30%
Market-consistent using swaption implied volatilities as at 31/12/2013
Euroswap curve rates except for existing fixed interest assets backing Life-Savings business, where book returns adjusted for credit risk based on historical transition matrices and defaults rates have been used
- There are no exceptional expenses to be excluded
Methodological appendix
Assumptions
3
Discount rate
Financial returns
- Existing assets
- Reinvestment yield
Maintenance expenses
Fees and commissions
Mortality, disability,surrenders and turnovers
Cost of capital- Capital requirement- Annual cost
Tax rate
Stochastic asset model(TVFOGs)
Euroswap zero-coupon curve as at 31/12/2014
1 year0.40%5 years1.27%10 years2.22%15 years2.71%20 years2.85%
Based on the euroswap zero-coupon curve as at 31/12/2014
- Based on internal analyses- Expressed in Euros per policy- Indexed to a 2.5% inflation
In line with the existing fee structure
Tables based on the company’sown experience
100% of the minimum solvency margin4% p.a.
28% in 2015 and 25% in future years
Market-consistent using swaption implied volatilities as at 31/12/2014
Euroswap curve rates except for existing fixed interest assets backing Life-Savings business, where book returns adjusted for credit risk based on historical transition matrices and defaults rates have been used
- There are no exceptional expenses to be excluded
EEV 2013 EEV 2014
29 bp 24 bpAverage annual probability of default

24
Contents
1 EEV analysis
2 Towers Watson opinion letter
3 Methodological appendix
4 Statistical appendix
5 Glossary

25
Statistical appendix
Breakdown of the value added by new business
4
Breakdown by business line
Breakdown by distribution channel
1) Present Value of New Business Income 2) Value added by new business
Million Euros
2013 2014 2013 2014 2013 2014
Life Assurance: 2,301.0 2,477.5 121.8 153.8 5.3% 6.2% - Agents' channel 1,199.4 1,160.0 27.3 42.8 2.3% 3.7%
- Bank channel 1,101.6 1,317.5 94.5 111.0 8.6% 8.4%
Mutual Funds 914.9 1,101.0 24.4 18.2 2.7% 1.7%
Pension Funds 401.5 944.9 3.7 10.3 0.9% 1.1% - Agents' channel 209.6 551.6 1.6 4.9 0.8% 0.9%
- Bank channel 191.9 393.3 2.1 5.4 1.1% 1.4%
TOTAL 3,617.4 4,523.4 149.9 182.3 4.1% 4.0%
PVNBI(1) VNB(2) VNB/PVNBI
2013 2014 2013 2014 2013 2014
Agents' channel 2,323.9 2,812.6 53.3 65.9 2.3% 2.3%
Bank channels 1,293.5 1,710.8 96.6 116.4 7.5% 6.8%
TOTAL 3,617.4 4,523.4 149.9 182.3 4.1% 4.0%
PVNBI(1) VNB(2) VNB/PVNBI

26
Statistical appendix
Breakdown of 2014 change in EEV between ANAV and value of in-force business(1)
4
1) VIF = PVIF – TVFOGs – CoC2) Not considering TVFOGs from new business, which are considered in the line “Value added by new business”3) Return on Embedded Value» = Value added in the year/ Previous Embedded Value, adjusted for changes in the model
Million Euros
ANAVValue of in-force
business(1) TOTAL
Value in 2013 - Attributable to MAPFRE VIDA 736.9 1,221.6 1,958.5
Minority interests 398.7 434.3 833.0
EEV 2013 1,135.6 1,655.9 2,791.5
Changes in assumptions 0.0 6.8 6.8
Expected return 185.2 -147.3 37.9
Value added by new business -55.5 237.8 182.3
Deviation of actual value from expectations 136.5 5.8 142.3
Change in the TVFOGs(2) 0.0 -17.0 -17.0
Value added in 2014 266.2 86.1 352.3
Changes in the model 0.0 -11.6 -11.6
Additions 125.8 80.9 206.6
Dividends paid and other items -119.5 0.0 -119.5
Value in 2014 1,408.0 1,811.3 3,219.3
Minority interests 536.6 503.8 1,040.4
Value in 2014 - Attributable to MAPFRE VIDA 871.4 1,307.5 2,178.9
RoEV(3) 23.4% 5.2% 12.7%

27
Statistical appendix
Breakdown of the sensitivity analysis
4
Sensitivity of the value of in-force business
Sensitivity of the value added by new business
Million Euros
Agents' channel Bank channel
Impact of:
- 100bp increase in interest rates -37.6 -49.2
- 10% decrease in the value of stocks and real estate -11.2 -1.0
- 10% decrease in expenses 28.7 27.5
- 10% decrease in the lapse rate 81.3 92.0
- 5% decrease in mortality and morbidity -25.5 14.4
- 25bp increase in the defaut rates of the fixed income portfolio -130.3 -79.2
- 100bp decrease in interest rates 18.7 35.6
Agents' channel Bank channel
Impact of:
- 100bp increase in interest rates -0.4 -6.4
- 10% decrease in the value of stocks and real estate -0.8 -0.1
- 10% decrease in expenses 2.9 2.5
- 10% decrease in the lapse rate 16.3 13.6
- 5% decrease in mortality and morbidity -2.1 1.2
- 100bp decrease in interest rates 5.1 5.0

28
Statistical appendix
Reconciliation of the adjusted net asset value
4
1) Amount used in embedded value calculations
Million Euros
Consolidated shareholders' equity for MAPFRE VIDA as at 31/12/2014 (IFRS) 1,625.5
Unrealised gains (losses) -120.7
- of which: property 48.8
- of which: financial assets -169.5
Donations and dividends 0.0
Intangible assets -634.6
Commissions and other acquisition costs net of taxes 0.0
Other 1.2
Consolidated adjusted shareholders' equity for MAPFRE VIDA as at 31/12/14(1) 871.4
Minority interests 536.6
Consolidated adjusted net asset value for MAPFRE VIDA as at 31/12/14(1) 1,408.0

29
Statistical appendix
Share of the parent company in the EEV
4
Million Euros
Parent company - MAPFRE VIDA Minority interests
ANAV
ANAV 871.4 536.6
NET PVIF(1)
AGENTS' CHANNEL 852.1 0.0
BANK CHANNELS 514.1 510.7
TOTAL 1,366.2 510.7
TVFOGS
AGENTS' CHANNEL -51.9 0.0
BANK CHANNELS -6.9 -6.9
TOTAL -58.8 -6.9
EEV 2014 2,178.8 1,040.4
1) NET PVIF = PVIF - CoC

30
Statistical appendix
Share of the parent company in the value added by new business
4
Million Euros
Parent company - MAPFRE VIDA Minority interests
Value added by new business
AGENTS' CHANNEL 65.9 --
BANK CHANNELS 58.4 58.0
2014 Value added by new business 124.4 58.0

31
4
Breakdown of the EEV 2014 attributable to the parent company - MAPFRE VIDA
By line of business By distribution channel
1) PVIF = “Present Value of In-Force business”2) Includes the in-force values of the Life assurance and accidental death insurance businesses
Million Euros
Statistical appendix
€ mill. % %
Adjusted Net Asset Value 871.4 40.0% 18.2%
Net PVIF - Agents' channel 852.1 39.1% 3.3%
- PVIF 1,000.4 4.5%
- CoC (148.3) 12.4%
Net PVIF - Bank channels 514.1 23.6% 15.6%
- PVIF 578.9 15.4%
- CoC (64.8) 13.4%
TVFOGs (58.8) -2.7% 22.0%
EEV 2014 2,178.8 100.0% 11.2%
€ mill. % %
Adjusted Net Asset Value 871.4 40.0% 18.2%
Net PVIF(1) - Life Assurance(2) 1,127.3 51.7% 16.2%
- PVIF 1,327.9 15.5%
- CoC (200.6) 11.6%
Net PVIF(1) - Mutual Funds 128.5 5.9% -13.4%
- PVIF 130.2 -13.1%
- CoC (1.7) 6.3%
Net PVIF(1) - Pension Funds 110.4 5.1% -27.0%
- PVIF 121.1 -23.8%
- CoC (10.7) 39.0%
TVFOGs (58.8) -2.7% 22.0%
EEV 2014 2,178.8 100.0% 11.2%

32
Content
1 EEV analysis
2 Towers Watson opinion letter
3 Methodological appendix
4 Statistical appendix
5 Glossary

33
Glossary5
The European Embedded Value Principles or “EEVP” are the principles that establish the methodologythat must be applied in order to calculate the European Embedded Value. The EEVP were agreed upon bythe CFOs of the multinational European insurers belonging to the “CFO Forum” in order to increase thecomparability and transparency of the embedded value calculations carried out by insurance companies.The document that contains the EEVP can be obtained at the following Internet address: www.cfoforum.nl.The Adjusted Net Asset Value or "ANAV” is equal to the shareholders’ equity as defined under IFRSadjusted for: unrealised gains or losses belonging to shareholders; committed donations and dividends;goodwill; deferred expenses; and any other item needed to calculate the economic capital.Financial Options and Guarantees or “FOGs” are those features of the covered business conferringpotentially valuable guarantees underlying, or options to change, the level or nature of policyholders’benefits and exercisable at the discretion of policyholders, whose potential value is impacted by theperformance of financial variables.The Value of an Option is composed of two elements: the Intrinsic Value and the Time Value. In the caseof a call option, the intrinsic value is equal to the difference between the price of the underlying assetand the strike price of the option (in the case of a put option the order of the difference is inverted). Theintrinsic value cannot be less than zero. The time value is equal to the difference between the total valueand the intrinsic value and it is ascribed to the potential for benefits under the option to increase in valueprior to expiry.The Present Value of In-force Business or “PVIF” is determined as the present value of future statutoryprofits which are expected to be generated from the existing business in force at the valuation date, aftertax and discounted using the euroswap curve. Investment returns for existing business have beencalculated on the basis of the euroswap curve, except for existing fixed interest assets backing Life-Savings business, where book returns adjusted for credit risk based on historical transition matrices anddefaults rates have been used. PVIF includes the intrinsic value of financial options and guaranteesgranted to the insured.

34
Glossary5
The Cost of Capital or “CoC” represents an allowance for frictional costs, non-hedgeable risks as well asunexpected credit risk which has not been considered in the value of in-force business. The CoC used in thecalculation of the EEV was measured on the basis of an amount of capital equal to 100% of the minimumregulatory requirement.
The Value of In-force Business or “VIF” is equal to: PVIF – Time Value of FOGs (“TVFOGs”) - CoC.
The European Embedded Value or “EEV” is the embedded value calculated in accordance with “EuropeanEmbedded Value Principles”. EEV is equal to: ANAV + VIF.
Changes in Assumptions are changes in the future experience assumed in the calculation of the presentvalue of in-force business, including economic, expense, lapse and mortality assumptions.
The Expected Return on the Beginning of the Year Embedded Value is equal to the actual after-taxinvestment return on the beginning-of-the-year adjusted net asset value less the cost of capital, plus thereturn, at the discount rate, on the beginning-of-the-year value of the in-force business and capital.
The Deviation of Actual Value from Expectations arises mainly from the variance between the actualexperience and the assumed experience used to calculate the beginning-of-the-year embedded value.
The Return on Embedded Value or “RoEV” is obtained by dividing the value added in the year by theembedded value at the close of the previous year, adjusted for changes in the model.

35
Glossary5
New Business is defined as: in the case of Life assurance, single, extraordinary and regular premiums frompolicies written in the year, as well as extraordinary contributions to existing policies not alreadyconsidered in the valuation of the in-force business; in the case of mutual funds, new contributions; in thecase of pension funds, single, extraordinary and regular contributions from new participants, as well asextraordinary contributions from existing participants.The Present Value of New Business Income or “PVNBI” corresponds to: in the case of Life assurance, thepresent value of received and expected premiums from new business; in the case of mutual funds,contributions received in the year; and in the case of pension funds, contributions received in the year andexpected from new business.The Value added by New Business or “VNB” is the intrinsic value added by new business in the period, netof acquisition expenses, TVFOGs and CoC, valued at year-end using the assumptions applicable at that pointin time.

36
Disclaimer
This document is purely informative. Its content does not constitute, nor can it be interpreted as, an offer or an invitationto sell, exchange or buy, and it is not binding on the issuer in any way. The information about the plans of the Company, itsevolution, its results and its dividends represents a simple forecast whose formulation does not represent a guarantee withrespect to the future performance of the Company or the achievement of its targets or estimated results. The recipients ofthis information must be aware that the preparation of these forecasts is based on assumptions and estimates, which aresubject to a high degree of uncertainty, and that, due to multiple factors, future results may differ materially fromexpected results. Among such factors, the following are worth highlighting: the development of the insurance market andthe general economic situation of those countries where the Group operates; circumstances which may affect thecompetitiveness of insurance products and services; changes in the basis of calculation of mortality and morbidity tableswhich may affect the insurance activities of the Life and Health segments; frequency and severity of claims covered;effectiveness of the Groups reinsurance policies and fluctuations in the cost and availability of covers offered by third partyreinsurers; changes in the legal environment; adverse legal actions; changes in monetary policy; variations in interest ratesand exchange rates; fluctuations in liquidity and the value and profitability of assets which make up the investmentportfolio; restrictions in the access to third party financing.
MAPFRE S.A. does not undertake to update or revise periodically the content of this document.