
Insurance - Corporativo MAPFRE · Insurance 27 July 2017 Spain MAPFRE, S.A. ... Harish Gohil +44...
17
Insurance www.fitchratings.com 27 July 2017 Spain MAPFRE, S.A. And Its Main Operating Subsidiaries Full Rating Report Key Rating Drivers Resilient Underwriting Performance: In 2016, MAPFRE, S.A. demonstrated resilient underwriting performance despite difficulties in its core markets, including an economic slowdown in Brazil. The group reported a combined ratio of 97.4% in 2016 (2015: 98.6%). The improvement in the combined ratio reflects stronger underwriting discipline and cost-saving initiatives in MAPFRE’s core markets. Fitch Ratings expects MAPFRE’s technical profitability to remain strong and stable over the next 12-24 months. Robust Capital Adequacy: Fitch considers MAPFRE to be strongly capitalised, based on a ‘Strong’ score from the agency’s Prism factor-based model (FBM). The group’s regulatory Solvency II (SII) ratio also was strong at 210% at end-2016 (end-2015: 198%). Own funds backing the SII ratio largely consist of Unrestricted Tier 1 capital. However, the quality of capital is somewhat reduced by the goodwill of EUR2.0 billion in 2016 on MAPFRE’s balance sheet, which is equivalent to 22% of shareholders’ equity. Low Financial Debt Leverage: MAPFRE’s Fitch-calculated financial leverage was 15% in 2016 (2015: 13%). Fitch considers MAPFRE’s financial leverage ratio as low (the median guideline for the ‘A’ rating category is 28%) and a positive rating factor. Strong International Franchise: MAPFRE has a strong market position in Spain, where it is the leader in the non-life segment, and in Latin America, particularly Brazil. MAPFRE’s share of Spanish non-life insurance was 14.6%, life 6.3% and Latin American non-life 7.6% in 2016. This makes it the 11th-largest European and the third-largest Latin American insurance group. Sovereign Constraint: MAPFRE’s exposure to sovereign debt (Spanish sovereign debt to equity was 148% at end-2016), used to match domestic liabilities in Spain, is reflected in the sovereign constraint on MAPFRE’s ratings at ‘A−’, one notch higher than the sovereign rating of Spain (BBB+/Positive). MAPFRE is substantially exposed to the Spanish economy as around 60% of its operating profits originate from Spain. However, Fitch believes that MAPFRE’s capital is resilient enough against potential stress from substantial exposure to sovereign debt. Strong Liquidity Position: Fitch expects MAPFRE’s balance sheet to remain liquid and able to support its policyholder liabilities. In 2016, the investment portfolio was composed of highly liquid assets, which support the rating. Conservative Investment Portfolio: In 2016, MAPFRE’s ratio of risky assets to equity as calculated by Fitch was low at 42% (2015: 41%), which supports the rating. However, of MAPFRE’s fixed income and cash investments, 56% are allocated to ‘BBB’ rated instruments. Rating Sensitivities Sovereign Upgrade: The ratings could be upgraded if Spain’s sovereign rating is upgraded, providing that MAPFRE maintains strong earnings and capitalisation. Capital Deterioration: As the Outlook is Positive, Fitch does not anticipate developments with a high likelihood of triggering a downgrade. However, MAPFRE’s ratings could be downgraded on significant losses with a material impact on the group’s capitalisation. Ratings Insurer Financial Strength Ratings MAPFRE ESPANA Compania de Seguros y Reaseguros, S.A. A− MAPFRE Global Risks, S.A. A− MAPFRE Vida SA De Seguros y Reaseguros A− MAPFRE RE, Compania De Reaseguros, S.A. A− MAPFRE, S.A. Long-Term Foreign-Currency IDR A− Senior Unsecured BBB+ Subordinated BBB− Sovereign Risk Long-Term IDR BBB+ Outlooks Insurer Financial Strength Ratings Positive Long-Term Foreign-Currency IDR Positive Sovereign Long-Term IDR Positive Financial Data MAPFRE, S.A. (Consolidated) (EURm) 2016 2015 Gross written premiums 22,813 22,312 Non-life combined ratio (%) 97.4 98.6 Net result 776 709 Total assets 67,882 63,489 Total equity 11,443 10,408 As reported by company Related Research 2017 Outlook: Brazilian Insurance (December 2016) Brazilian Insurance Dashboard (Second-Half 2016) (March 2017) Spain – June 2017 Global Economic Outlook Forecast Analysts Ekaterina Ishchenko +44 20 3530 1532 [email protected] Harish Gohil +44 20 3530 1257 [email protected]
Transcript of Insurance - Corporativo MAPFRE · Insurance 27 July 2017 Spain MAPFRE, S.A. ... Harish Gohil +44...
Insurance
www.fitchratings.com 27 July 2017
Spain
MAPFRE, S.A. And Its Main Operating Subsidiaries
Full Rating Report
Key Rating Drivers
Resilient Underwriting Performance: In 2016, MAPFRE, S.A. demonstrated resilient
underwriting performance despite difficulties in its core markets, including an economic
slowdown in Brazil. The group reported a combined ratio of 97.4% in 2016 (2015: 98.6%). The
improvement in the combined ratio reflects stronger underwriting discipline and cost-saving
initiatives in MAPFRE’s core markets. Fitch Ratings expects MAPFRE’s technical profitability to
remain strong and stable over the next 12-24 months.
Robust Capital Adequacy: Fitch considers MAPFRE to be strongly capitalised, based on a
‘Strong’ score from the agency’s Prism factor-based model (FBM). The group’s regulatory
Solvency II (SII) ratio also was strong at 210% at end-2016 (end-2015: 198%). Own funds
backing the SII ratio largely consist of Unrestricted Tier 1 capital. However, the quality of capital
is somewhat reduced by the goodwill of EUR2.0 billion in 2016 on MAPFRE’s balance sheet,
which is equivalent to 22% of shareholders’ equity.
Low Financial Debt Leverage: MAPFRE’s Fitch-calculated financial leverage was 15% in
2016 (2015: 13%). Fitch considers MAPFRE’s financial leverage ratio as low (the median
guideline for the ‘A’ rating category is 28%) and a positive rating factor.
Strong International Franchise: MAPFRE has a strong market position in Spain, where it is
the leader in the non-life segment, and in Latin America, particularly Brazil. MAPFRE’s share of
Spanish non-life insurance was 14.6%, life 6.3% and Latin American non-life 7.6% in 2016.
This makes it the 11th-largest European and the third-largest Latin American insurance group.
Sovereign Constraint: MAPFRE’s exposure to sovereign debt (Spanish sovereign debt to
equity was 148% at end-2016), used to match domestic liabilities in Spain, is reflected in the
sovereign constraint on MAPFRE’s ratings at ‘A−’, one notch higher than the sovereign rating of
Spain (BBB+/Positive). MAPFRE is substantially exposed to the Spanish economy as around
60% of its operating profits originate from Spain. However, Fitch believes that MAPFRE’s
capital is resilient enough against potential stress from substantial exposure to sovereign debt.
Strong Liquidity Position: Fitch expects MAPFRE’s balance sheet to remain liquid and able
to support its policyholder liabilities. In 2016, the investment portfolio was composed of highly
liquid assets, which support the rating.
Conservative Investment Portfolio: In 2016, MAPFRE’s ratio of risky assets to equity as
calculated by Fitch was low at 42% (2015: 41%), which supports the rating. However, of
MAPFRE’s fixed income and cash investments, 56% are allocated to ‘BBB’ rated instruments.
Rating Sensitivities
Sovereign Upgrade: The ratings could be upgraded if Spain’s sovereign rating is upgraded,
providing that MAPFRE maintains strong earnings and capitalisation.
Capital Deterioration: As the Outlook is Positive, Fitch does not anticipate developments with
a high likelihood of triggering a downgrade. However, MAPFRE’s ratings could be downgraded
on significant losses with a material impact on the group’s capitalisation.
Ratings
Insurer Financial Strength Ratings
MAPFRE ESPANA Compania de Seguros y Reaseguros, S.A.
A−
MAPFRE Global Risks, S.A. A− MAPFRE Vida SA De Seguros y Reaseguros
A−
MAPFRE RE, Compania De Reaseguros, S.A.
A−
MAPFRE, S.A. Long-Term Foreign-Currency IDR A− Senior Unsecured BBB+ Subordinated BBB−
Sovereign Risk Long-Term IDR BBB+
Outlooks
Insurer Financial Strength Ratings Positive Long-Term Foreign-Currency IDR Positive Sovereign Long-Term IDR Positive
Financial Data
MAPFRE, S.A. (Consolidated)
(EURm) 2016 2015
Gross written premiums 22,813 22,312 Non-life combined ratio (%)
97.4 98.6
Net result 776 709 Total assets 67,882 63,489 Total equity 11,443 10,408 As reported by company
Related Research
2017 Outlook: Brazilian Insurance (December 2016)
Brazilian Insurance Dashboard (Second-Half 2016) (March 2017)
Spain – June 2017 Global Economic Outlook Forecast
Analysts
Ekaterina Ishchenko +44 20 3530 1532 [email protected] Harish Gohil +44 20 3530 1257 [email protected]

Insurance
MAPFRE, S.A.
July 2017 2
Business Profile
Large Diversified Composite Insurer Strong international franchise
Well diversified by products, sectors and distribution channels
Acquisitions support international growth strategy
Ratings Range Based on Business Profile IFS rating category AAA AA A BBB <BBB
Very strong business profile Strong business profile Moderate business profile Weak business profile
Source: Fitch
Strong International Franchise
With EUR22.8 billion of gross written premiums (GWP) in 2016, MAPFRE has a strong
franchise in Spain and Latin America. It is the market leader in Spain, with 10.5% market share,
and has a strong presence in Latin America. In non-life and life insurance in Spain, MAPFRE’s
market shares are 14.6% and 6.3%, respectively, and 7.6% in Latin American non-life. This
makes MAPFRE the 11th-largest European insurer and the third-largest insurer in Latin
America. Both Spain and Latin America are core regions for MAPFRE and a profitable source
of growth.
Well Diversified by Products, Sectors and Distribution Channels
MAPFRE underwrites life (including savings) and non-life business, which accounted for 22%
and 78% of GWP, respectively, in 2016. Most of its business is primary insurance, but
MAPFRE acts as a reinsurer through MAPFRE Re Compania De Reaseguros S.A (MAPFRE
RE), which accounts for 17% of total GWP.
MAPFRE has multichannel distribution comprising its own branch network, agents, brokers and
bancassurance agreements, and a wide geographical presence within Spain and Latin America.
Non-life business is predominantly distributed via agents. Life business is distributed through
agents and bancassurance partnerships (such as Bankia, Bankinter and Banco do Brasil).
27.8%
20.0%
15.6%8.5%
11.6%
8.3%7.7%
0.5%
28.7%
18.5%17.1%
7.7%
11.7%
10.4%
5.4% 0.5%
Iberia Brazil MAPFRE RELatam South North America EMEALatam North APAC
Source: MAPFRE SA
Premium Income by GeographyOuter ring: 2016Inner ring: 2015
57.9%
63.1%
18.0%
15.6%
17.9%
20.1%
5.8%
1.6%
-3.8%
8.7%
5.0%
4.2%
-0.3%
-11.1%
-0.4%
-2.2%
-20% 0% 20% 40% 60% 80% 100%
2015
2016
Iberia Brazil Mapfre Re
Latam South N.America Latam North
EMEA APAC
Source: MAPFRE SA
Contribution to Consolidated Results
Source: Mapfre 2016 results presentation
Premium Split by Line of Business2016
General P&C insurance
31%
Health & accidents
5%
Mapfre Re17%
Motor 29%
Life18%
Related Criteria
Insurance Rating Methodology (April 2017)

Insurance
MAPFRE, S.A.
July 2017 3
Acquisitions Support International Growth Strategy
Outside of Iberia and Latin America, MAPFRE’s international insurance operations comprise
subsidiaries in North America, EMEA and Asia Pacific. Most of these operations were acquired
by MAPFRE to strengthen its presence in these regions.
MAPFRE International Acquisitions
Year Company Country
2007 Genel Sigorta Turkey 2008 The Commerce Group USA 2011 Middlesea Insurance Plc Malta 2015 Direct Line Insurance S.p.A. Italy 2015 Direct line Versicherung Aktiengesellschaft Germany 2016 - 2017 PT Asuransi Bina Dana Arta Tbk (ABDA) Indonesia
Source: MAPFRE
In 2015, MAPFRE completed the acquisition of Direct Line in Italy and Germany, both well-
established and growing operations. Direct Line is a leading company in the Italian direct motor
insurance market and the third largest in Germany’s direct motor market. Fitch believes these
acquisitions will allow MAPFRE to strengthen its position in Europe and improve its global
diversification in line with its profitable growth strategy.
In June 2017, MAPFRE obtained the regulatory authorisation to complete the acquisition of a
further 31% of share capital of the Indonesian insurance company PT Asuransi Bina Dana Arta
Tbk (ABDA) for EUR92 million, which was announced in October 2016. MAPFRE will hold a
major interest in the company with 51% of capital and have management control. Through this
acquisition, MAPFRE will complete its entry into the Indonesian insurance market, which began
in October 2013, when it bought 20% of ABDA. ABDA is ranked fifth in the country’s motor
insurance market, with a share of 6.4%.

Insurance
MAPFRE, S.A.
July 2017 4
Ownership is Neutral to Rating
MAPFRE S.A., the top holding company of the MAPFRE group, is listed on the Madrid and
Barcelona stock exchanges. The group operates in 45 countries through 232 subsidiaries.
MAPFRE is a subsidiary of Cartera MAPFRE S.L. Sociedad Unipersonal, which is 100%
controlled by Fundacion MAPFRE (FM). At the end of 2016, FM held 67.73%, directly and
indirectly, of MAPFRE’s capital. The rest is a free float held by local and foreign shareholders.
FM is a non-profit institution created by MAPFRE in 1975, the main purpose of which is to
promote the well-being of society and citizens across the company footprint. FM works to drive
economic, social and cultural improvements for society’s most disadvantaged people and
groups. Its operations focus on five areas: Accident prevention and road safety, insurance and
social protection, culture, social action, and health promotion.
Organisational Chart 2016
Source: Mapfre SA 2016 annual report
Mapfre SA
International ReinsuranceIberia Latam
North AmericaSpain/Portugal Brazil
EMEALatam North
Latam South APAC
- General Counsel
- Internal Audit
- Business Support
- Strategy and M&A
- Finance
- Investment
- Human Resources
- Resources & Institutional coordination
- Business, Clients and Innovation
Corporate Governance and
Management
Corporate governance and
management are adequate and neutral
for the rating.
MAPFRE’s board consists of 15
members, of whom five are external
directors representing Cartera
MAPFRE. Other directors include four
executive members and six
independent directors.

Insurance
MAPFRE, S.A.
July 2017 5
Industry Profile and Operating Environment
Strong Recovery in the Spanish Insurance Market
The strong recovery of the Spanish economy continued in 4Q16 as GDP grew by 0.7% qoq,
which was the same rate as in 3Q16 and only marginally below the 0.8% in the previous three
quarters. Annual GDP growth was 3.2% in 2016, the same as in 2015. Private consumption
continues to be the main driver, supported by earlier income tax cuts, improving credit
conditions, and a 2.4pp fall in the unemployment rate last year. In light of the resilience of the
recovery, we have revised our GDP forecasts to 2.6% for 2017 and 2.1% for 2018.
Supported by a stronger economy, the Spanish insurance sector continued its recovery and
recorded 12% yoy total premium growth in 2016 (2015: 2.1%). The non-life insurance sector
expanded by 4.5% (2015: 2.4%) with all lines contributing to premium growth. Motor, health
and multi-risk home insurance segments saw an increase in premiums of 5.1%, 5.1%, and
3.1%, respectively. Life insurance and savings products also saw a strong recovery in 2016,
with assets under management increasing by 5.7%.
Sector profitability remained resilient in 2016 and throughout the difficult economic conditions
during the eurozone crisis. Non-life insurance technical profitability in 2016 was strong with a
combined ratio of 93.6% as of December 2016 (2015: 94.7%).
The insurance market in Spain is well developed with a large number of domestic and foreign
companies that offer a comprehensive range of products. The top 10 companies represent
65% of market premiums. The insurance penetration rate is lower than in other developed
economies (5.7% in 2016), offering potentially significant growth opportunities.
Brazilian Insurance: Sector Resilient to Slower Growth
Fitch’s outlook for the Brazilian insurance sector remains stable. The insurance sector is one of
the few that has withstood the significant deterioration in the operating environment in 2015
and 2016. Fitch believes that the Brazilian insurance sector will continue to be resilient and
maintain overall adequate key credit metrics in 2017. In 2016, the growth of insurance
premiums declined, but sector profitability and other key credit metrics have all held up well.
Downward pressure on premium growth could ease somewhat in line with economic
stabilisation, but Fitch does not foresee a significant recovery and forecasts growth to be close
to inflation. This is because GDP growth is likely to be modest.
Fitch expects sector profitability to remain solid in 2017, despite a likely decline in interest rates,
which would exert downward pressure on investment income, and expectations that premium
growth will remain modest. Similar to previous years, sector performance should be supported
by adequate technical results and still meaningful investment income. The latter is positively
correlated with interest rates. This acts as a natural hedge for the sector, as interest rates, and
hence investment income, tend to rise when premium growth slows, partly offsetting the
reduction in the revenue base, and vice versa.
Ratings Range Based on Industry Profile/Operating Environment
IFS rating AAA AA A BBB <BBB
Life insurance
Non-life insurance Reinsurance lines
Source: Fitch
Top 10 Spanish Insurers
2016 Market
share (%)
VidaCaixa 14.9 MAPFRE 10.5 Zurich 8.7 Grupo Mutua Madrileña 7.4 Allianz 5.6 Grupo Catalana Occidente 4.6 Grupo Axa 4.0 Generali 3.9 BBVA Seguros 3.0 Grupo Caser 2.3 % of total GWP 64.9
Source: ICEA, Fitch
Motor32.3%
Health23.6%
Other16.8%
Source: ICEA
Direct Non-life Premiums in Spain2016
Multirisk20.7%
Funeral expenses
6.6%
Sovereign and Country-Related
Constraints
Fitch rates Spain’s Long-Term IDR
‘BBB+’ with a Positive Outlook; the
Country Ceiling is ‘AA+’. The sovereign
rating expresses the maximum limit for
the ratings of most, but not all, issuers in
a given country. At current levels, the
ratings of Spanish insurance
organisations and other corporate issuers
could be constrained by sovereign or
macroeconomic risks.
Due to the sovereign-related constraint of
'A−' applied to MAPFRE's ratings, the
operating entities' IFS ratings and implied
IDRs are at the same level.

Insurance
MAPFRE, S.A.
July 2017 6
Peer Analysis
Smaller But Compares Well with Peers
MAPFRE’s closest peers are the largest European composite insurance groups and some
financial conglomerates with significant insurance operations.
Overall, MAPFRE compares well with peers. In 2016, MAPFRE’s return on equity was in line
with the peer group average and its combined ratio was slightly higher than the average of the
group. MAPFRE’s five-year average reported combined ratio is 96.7% and it continues to target
sub-96%. MAPFRE’s financial leverage is also the lowest of the peer group. However,
MAPFRE is smaller and consequently less diversified than peers. Its high exposure to lower-
rated sovereigns, similar to Generali, acts as a drag on the group’s ratings.
Peer Comparison - 2016
EURm IFS Rating/ Outlook
a Total equity
Return on equity
b (%)
Gross written premium
Total assets
Return on assets
c (%)
Net income
d
Solvency II /SST
ratioe (%)
Reported combined
ratio (%)
Financial leverage
(%)
AXA AA−/Stable 75,880 8.4 94,933 892,783 0.7 5,829 197 96.5 25 Allianz AA/Stable 70,392 10.5 76,331 883,809 0.8 6,883 218 94.3 21 Generali A−/Stable 25,668 8.7 70,513 521,184 0.4 2,081 177 92.5 33 Zurich AA−/Stable 30,054 10.4 41,673 334,882 0.9 3,041 227 98.4 23 MAPFRE A−/Positive 11,444 8.8 22,813 67,882 1.3 776 210 97.4 15
Foreign exchange rates used: Average: USD1 = EUR0.947; Period end: USD1 = EUR0.90359
a Current IFS Ratings of primary operating companies of each group
b Group net income/2015,2016 shareholders' equity
c Group net income/2015,2016 average total assets less reinsurance share of technical provisions
d Net income excludes minorities
e For Zurich Swiss Solvency Test as of 1 January 2017
Source: Companies’ accounts, Fitch

Insurance
MAPFRE, S.A.
July 2017 7
Robust Solvency Position
Strong capital
Low financial leverage
Strong Capital
Fitch believes MAPFRE is strongly capitalised as reflected in the ‘Strong’ Prism FBM score.
The group’s regulatory solvency position is also strong, as reflected in the 210% reported
Solvency II ratio at end-2016 (end-2015: 198%) under the standard formula calculation
approach. The group uses transitional measures for technical provisions and the matching
adjustment. Without the transitional measures for technical provisions and the matching
adjustment the solvency ratio would be 193.4% and 206.6%, respectively. Own funds backing
the Solvency II ratio largely consist of Unrestricted Tier 1 capital (94%).
In 2016, shareholders’ funds (excluding minorities) increased by 6% to EUR9,127 million (end-
2015: EUR8,574 million). This was largely due to an increase in retained earnings and
appreciation of the main currencies. Fitch views MAPFRE’s capital position as strong and
supportive of its current ratings. However, the quality of capital is somewhat reduced by the
goodwill of EUR2.0 billion in 2016 on the balance sheet.
Low Financial Leverage
MAPFRE’s Fitch-calculated financial leverage was 15% in 2016 (2015: 13%). The 2pp increase
in the Fitch-calculated financial leverage ratio was due to the increase in the total financial debt
to EUR2.1 billion (2015: EUR1.6 billion) as MAPFRE issued a 10-year EUR1,000 million senior
bond in May 2016 to replace a EUR1,000 million senior bond that was redeemed in 2015.
Fitch considers MAPFRE’s financial leverage ratio as low (the median guideline for the ‘A’
rating category is 28%) and a positive rating factor.
In March 2017, MAPFRE issued a 30-year EUR600 million callable subordinated bond with a
fixed coupon of 4.375% for the first 10 years. The issuance is a Solvency II Tier 2 instrument
and is given 100% equity credit in Fitch’s Prism FBM model and considered as 100% debt in
the agency’s financial leverage calculations. Fitch does not anticipate any significant impact on
MAPFRE’s financial leverage ratio from this issuance given that MAPFRE called its existing
EUR700 million subordinated bond on 24 July 2017.
Capitalisation and Leverage
2012 2013 2014 2015 2016 Fitch’s expectation
Total equity (including minorities) (EURm) 10,136 9,894 11,469 10,408 11,444 Fitch expects MAPFRE to maintain strong levels of capital adequacy. Regulatory Solvency I ratio (%) 261 246 259 255 n.a.
Regulatory Solvency II ratio (%) n.a. n.a. n.a. 198 210
Total financing and commitments (TFC) (x) 0.2 0.2 0.2 0.2 0.3
Financial leverage (%) 15 14 12 13 15
Net premiums written (non-life) to equity (x) 1.3 1.4 1.2 1.3 1.3
Source: Fitch calculations, company accounts

Insurance
MAPFRE, S.A.
July 2017 8
Strong Fixed-Charge Coverage
MAPFRE’s debt-servicing capabilities were robust at 20x in 2016 (2015: 14x). In 2016,
MAPFRE refinanced its senior debt, substantially reducing the finance costs (there was a
coupon of 5.125% on the previous three-year senior bond versus a 1.625% coupon on the new
10-year senior bond). The subordinated bond issued by MAPFRE in March 2017 that replaces
the subordinated bond MAPFRE called on 24 July 2017, also carries a lower coupon rate.
Good Financial Flexibility
Fitch considers MAPFRE’s financial flexibility as good with proven access to capital markets as
evidenced by the two recent bond issues.
Debt Service Capabilities and Financial Flexibility
(EURm) 2012 2013 2014 2015 2016 Fitch’s expectation
Fixed-charge coverage ratio excluding gains and losses (x) 15 14 13 14 24 Fitch expects MAPFRE’s fixed-charge coverage ratio to remain at current strong levels.
Fixed-charge coverage ratio including gains and losses (x) 18 16 18 18 34
Financial debt interest payments 78 101 99 84 52
Source: Fitch calculations, company accounts
Holding Company Liquidity/
Bank Facilities
In 2016 MAPFRE extended the maturity
of its syndicated loan facility of EUR1bn
from December 2020 to December
2021. At 31 December 2016, EUR480m
was drawn down under the credit facility
(2015: EUR1bn).

Insurance
MAPFRE, S.A.
July 2017 9
Strong Underwriting Profitability Maintained
Resilient non-life underwriting performance
Premium growth in life insurance
Growth and net income exposed to currency movements
Resilient Non-Life Underwriting Performance
In 2016, MAPFRE’s underwriting performance remained resilient despite difficulties in some of
its core markets, including an economic downturn in Brazil. The group reported a combined
ratio of 97.4% in 2016 (2015: 98.6%). The improvement in the combined ratio reflects improved
underwriting discipline and cost-saving initiatives in MAPFRE's core markets. MAPFRE’s target
combined ratio is unchanged at 96% or less.
MAPFRE’s three largest regional segments – Iberia, Brazil and the US – performed well in
2016. In Spain, all main business classes contributed to premium growth and to the technical
result. The 3pp decrease in the combined ratio in Iberia in 2016 was due to improvements in
both loss and expense ratios due to enhancements in claims handling, risk selection and
stricter cost control. In Brazil, higher claims costs resulting from the difficult economic
environment were offset by lower expenses, resulting in an overall improvement in the
combined ratio. MAPFRE USA underwriting result improved in 2016, given the absence of
large weather losses.
Premium Growth in Life Insurance
In 2016, total life insurance GWP increased by 5% to EUR5,113 million from EUR4,870 million
in 2015. The increase in premiums was driven by strong performance in Spain, which saw
premium growth of 18% due to strong sales through the agents’ network and higher demand in
corporate savings policies. In Brazil, life premiums fell by 7% as a result of lower lending
activity by Banco do Brazil, MAPFRE’s strategic partner. Despite the difficult operating
environment, however, Brazil remains the largest contributor to the overall life business result,
followed by Spain.
94101 101
94107
100
119
94 9797 97 98 95103 108 104
94 99
0
20
40
60
80
100
120
140
Iberia Latam north Latamsouth
Brazil EMEA NorthAmerica
APAC Mapfre Re Mapfre SA
(%)
Combined Ratio by Geography2015 - 2016
2016 2015
Source: MAPFRE 2016 Annual Report
Financial Performance and Earnings
(%) 2012 2013 2014 2015 2016 Fitch’s expectation
Net income (EURm) 666 790 845 709 776 Fitch expects MAPFRE to continue to deliver profitable underwriting returns, with a combined ratio below 100%.
Combined ratio (non-life, net earned premium basis) 95.4 96.1 95.8 98.6 97.4
Loss ratio (non-life) 67.4 67.0 68.0 70.0 69.9
Net income return on assets (group) 1.3 1.4 1.4 1.2 1.3
Net income return on equity 9 10 10 8 9
Source: Fitch calculations, company accounts
Insurance
MAPFRE, S.A.
July 2017 10
Growth and Net Income Exposed to Currency Movements
Fitch believes the effect of currency fluctuations in some of MAPFRE’s main markets will be
manageable. In 2016 the Turkish lira, the Argentinian peso and other Latin American
currencies depreciated against the euro. In 2016, LatAm premiums shrank by 9.7%, but in
local-currency terms, growth was recorded in all LatAm South countries. In LatAm North
countries, the premium decline would have been 7.7% due to non-renewal of loss-making
policies in Mexico, excluding the effect of a large multi-year policy issued in Mexico in 2015.
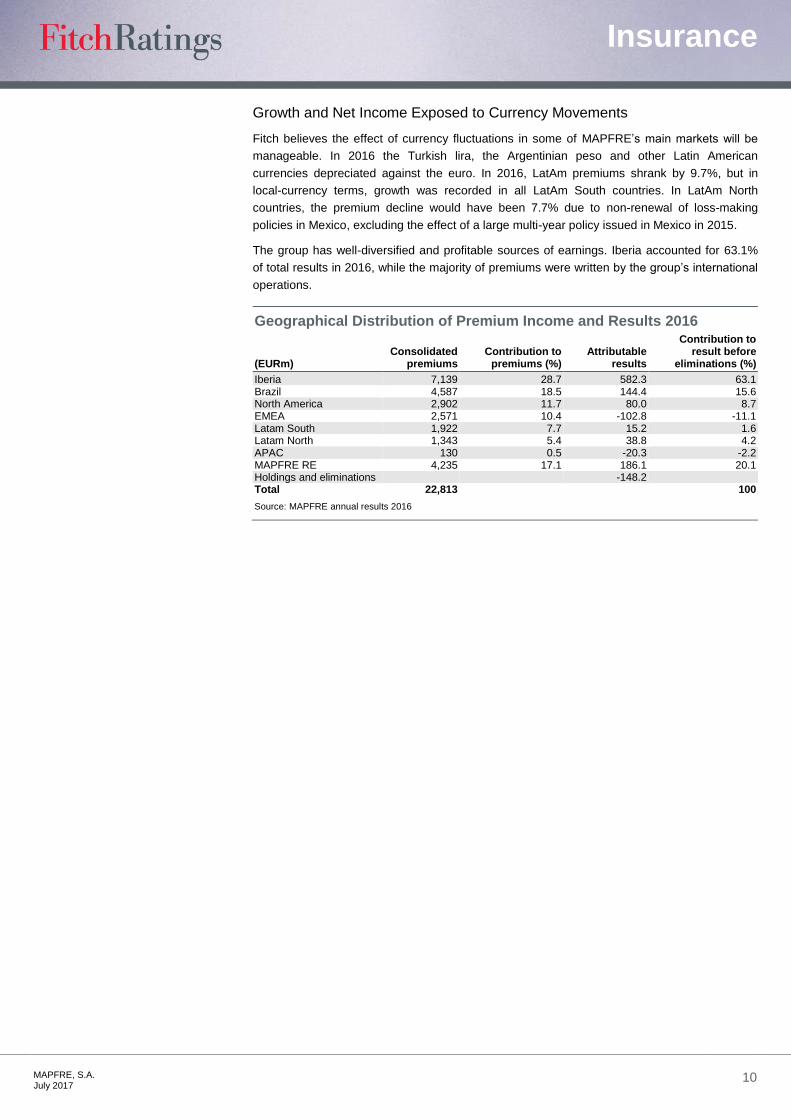
The group has well-diversified and profitable sources of earnings. Iberia accounted for 63.1%
of total results in 2016, while the majority of premiums were written by the group’s international
operations.
Geographical Distribution of Premium Income and Results 2016
(EURm) Consolidated
premiums Contribution to
premiums (%) Attributable
results
Contribution to result before
eliminations (%)
Iberia 7,139 28.7 582.3 63.1 Brazil 4,587 18.5 144.4 15.6 North America 2,902 11.7 80.0 8.7 EMEA 2,571 10.4 -102.8 -11.1 Latam South 1,922 7.7 15.2 1.6 Latam North 1,343 5.4 38.8 4.2 APAC 130 0.5 -20.3 -2.2 MAPFRE RE 4,235 17.1 186.1 20.1 Holdings and eliminations -148.2 Total 22,813 100
Source: MAPFRE annual results 2016

Insurance
MAPFRE, S.A.
July 2017 11
Prudent Investments but High Concentrations High exposure to Spanish debt
Low-risk asset allocation
High Exposure to Spanish Debt
Fitch assesses MAPFRE’s overall investment portfolio as well balanced and prudent, with over
95% of total investments in fixed income and cash allocated to investment-grade instruments.
However, fixed-income assets have a high degree of concentration in Spanish sovereign debt,
which accounted for 60% of total government bonds at end-2016. Of MAPFRE’s fixed income
and cash investments, 56% are allocated to ‘BBB’-rated instruments.
Breakdown of Fixed-Income Portfolio by Issuer (End-2016)
Government (%) 57 Corporate (%) 20 Of which Of which Spain (%) 60 Spain (%) 24 Rest of Europe (%) 13 Rest of Europe (%) 41 Brazil (%) 13 Brazil (%) 0 Rest of Latin America (%) 7 Rest of Latin America (%) 6 United States (%) 5 United States (%) 24 Others (%) 2 Others (%) 5
Source: MAPFRE 2016 results presentation
Low-Risk Asset Allocation
According to Fitch’s calculations, exposure to equities was only 15% of total equity at end-2016
(end-2015: 14%), which we consider prudently low. The ratio of risky assets to shareholders’
equity was 42% at end-2016, which Fitch also considers strong and supportive of the ratings.
Investment and Asset Risk
(%) 2012 2013 2014 2015 2016 Fitch’s expectation
Unaffiliated shares to equitya 18 22 21 26 28 Fitch does not expect any significant
changes in MAPFRE’s asset mix. Below-investment-grade bonds to equity 15 12 16 13 12
Investments in affiliates to equity 1 2 2 2 2
Risky assets to equity b 34 36 39 41 42
a Ratio includes equities and mutual funds
b Ratio includes equities, mutual funds and non-investment-grade bonds
Source: Fitch calculations, company accounts
Cash2.9%
Other8.4%
Source: MAPFRE 2016 annual results presentation
Investment Portfolio Split2016
Government bonds57.2%
Corporate bonds20.2%
Property4.6%
Mutual funds3.3%
Equities3.4%
6.0%11.9%
13.8%
63.8%
3.8%
0.7%
8.0%
17.8%
13.3%56.3%
3.6%1.0%
AAA AA A BBB BB NR
Source: Fitch, MAPFRE annual reportsAssumed a mapping of MAPFRE's reported credit ratings to Fitch's rating scale
Fixed Income & Cash Investments Credit QualityOuter ring: 2016Inner ring: 2015

Insurance
MAPFRE, S.A.
July 2017 12
Liquid Investment Portfolio
Strong liquidity position
Currency risk exposure manageable
Interest-rate risk manageable
Strong Liquidity Position
Fitch considers MAPFRE’s balance sheet as liquid and able to support its policyholder liabilities.
The agency also considers the investment portfolio liquid and supportive of the rating with over
95% of its fixed-income and cash portfolio allocated to investment-grade, fixed-income
instruments. Fitch believes these are likely to be readily tradable.
Currency Risk Exposure Manageable
MAPFRE has some exposure to currency volatility. Its principal foreign-currency risk arises
because its functional currency is the euro, whereas the currencies of a large part of its
operations include the Brazilian real and US dollar.
Reported premiums and earnings are exposed to exchange rates but capital and shareholders’
equity are also exposed. In 2016, EUR924 million of negative foreign exchange differences
under the company’s shareholders’ funds were recognised at year end, compared to EUR1,142
million in 2015.
MAPFRE closely matches its assets and liabilities by currency exposure, which, in Fitch’s
opinion, keeps the risk relating to changes in exchange rates manageable. Although currency
mismatch risk is minimised in its operations, the group has translation risks because of its
reporting currency.
Interest-Rate Risk Manageable
MAPFRE manages its exposure to interest-rate risk through close matching of the assets and
liabilities exposed to interest-rate fluctuations. At group level, asset and liability durations have
little mismatch, with a duration gap of less than one year, protecting the company against
fluctuations in interest rates.
Asset/Liability and Liquidity Management
(%) 2012 2013 2014 2015 2016
Fitch’s expectation
Liquid assets to policyholder liabilities (life and non-life combined)
100 100 100 100 102 MAPFRE has a liquid balance sheet, which Fitch expects to be maintained.
Source: Fitch, company accounts

Insurance
MAPFRE, S.A.
July 2017 13
Adequate Reserve Adequacy
Favourable claims run-off development
Favourable Claims Run-Off Development
Fitch’s analysis of MAPFRE’s reported claims development triangles suggests that the
development of prior-year reserves has largely been favourable in the past decade. The Fitch-
calculated reserves ratio (net technical reserves to net earned premiums) was 103% at end-
2016. Fitch views this level as adequate. We believe the ratio adequately reflects the group’s
high claims settlement speed and the short-tail nature of its non-life business. A vast majority of
the outstanding provision is released one year after the event.
Reserve Adequacy
(%) 2012 2013 2014 2015 2016 Fitch’s expectation
Loss reserves to CY incurred losses (non-life) (x) 0.6 0.6 0.6 0.6 0.6 Fitch expects MAPFRE’s reserving practice to remain prudent. Loss reserves/equity (non-life) 51 50 48 58 58
Net technical reserves to net earned premiums (non-life) 91 87 95 100 103
Source: Fitch, company accounts

Insurance
MAPFRE, S.A.
July 2017 14
Centralised Reinsurance Programme
Central procurement role for MAPFRE Re
Moderate exposure to natural catastrophes
Central Procurement Role for MAPFRE Re
Fitch understands that MAPFRE Re provides the group with catastrophe risk management
expertise and has a central procurement role in arranging the group’s outwards reinsurance
programme. It also acts as a writer of external inward reinsurance business. MAPFRE Re’s
retrocession panel is strong with most reinsurers rated at least ‘A+’.
Moderate Exposure to Natural Catastrophes
MAPFRE is exposed to natural catastrophe risks. However, in 2011 the company comfortably
withstood the impact of the catastrophes in Japan, New Zealand, Thailand, Asia, Australia and
the US, suggesting adequate business and geographical diversification and reinsurance
protection.
The Spanish insurance industry also benefits from the presence of the Consorcio de
Compensacion de Seguros (Insurance Compensation Consortium in Spain) – the Spanish
government scheme set up to cover the costs of the direct damage from natural hazards and
political and social risks such as terrorism or riots.
Reinsurance, Risk Management and Catastrophe Risk
(%) 2012 2013 2014 2015 2016 Fitch’s expectation
Net written premiums/gross written premiums (non-life)
85 83 84 80 81 Fitch does not expect any significant change in MAPFRE’s reinsurance buying. Reinsurance recoveries to equity (life and non-life) 29 28 26 31 28
Source: Fitch, company accounts
Insurance
MAPFRE, S.A.
July 2017 15
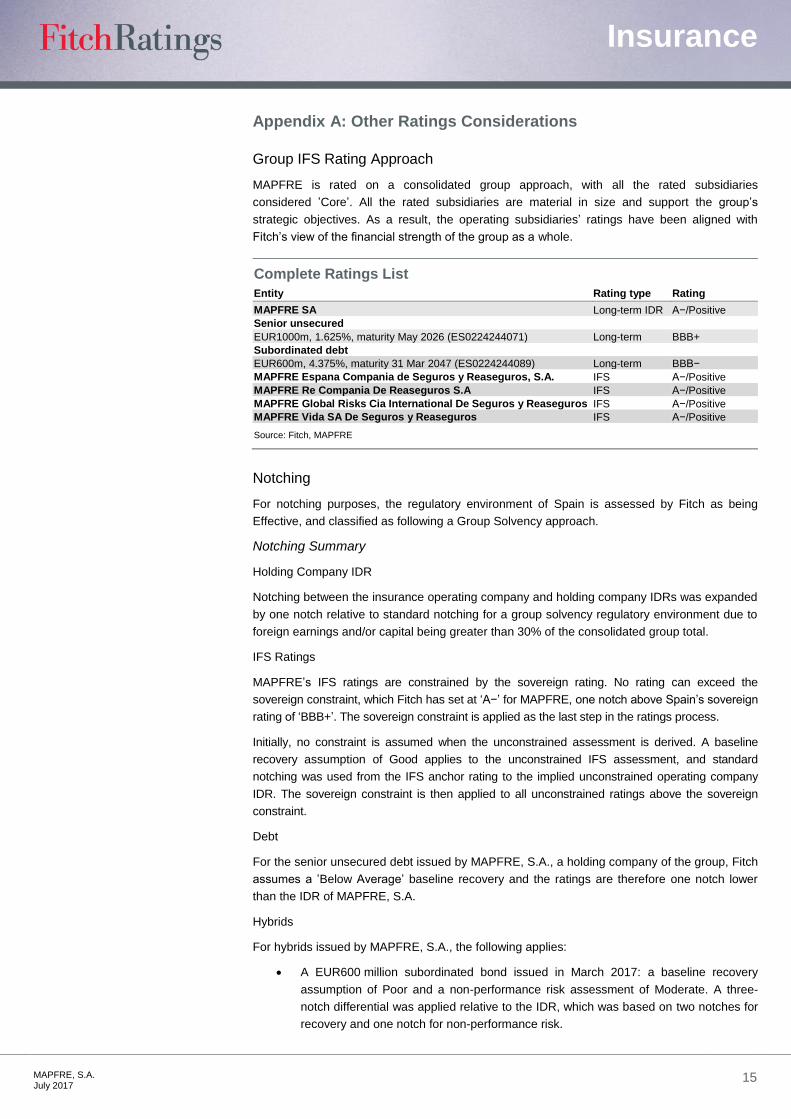
Appendix A: Other Ratings Considerations
Group IFS Rating Approach
MAPFRE is rated on a consolidated group approach, with all the rated subsidiaries
considered ’Core’. All the rated subsidiaries are material in size and support the group’s
strategic objectives. As a result, the operating subsidiaries’ ratings have been aligned with
Fitch’s view of the financial strength of the group as a whole.
Complete Ratings List
Entity Rating type Rating
MAPFRE SA Long-term IDR A−/Positive
Senior unsecured
EUR1000m, 1.625%, maturity May 2026 (ES0224244071) Long-term BBB+
Subordinated debt
EUR600m, 4.375%, maturity 31 Mar 2047 (ES0224244089) Long-term BBB−
MAPFRE Espana Compania de Seguros y Reaseguros, S.A. IFS A−/Positive
MAPFRE Re Compania De Reaseguros S.A IFS A−/Positive
MAPFRE Global Risks Cia International De Seguros y Reaseguros IFS A−/Positive
MAPFRE Vida SA De Seguros y Reaseguros IFS A−/Positive
Source: Fitch, MAPFRE
Notching
For notching purposes, the regulatory environment of Spain is assessed by Fitch as being
Effective, and classified as following a Group Solvency approach.
Notching Summary
Holding Company IDR
Notching between the insurance operating company and holding company IDRs was expanded
by one notch relative to standard notching for a group solvency regulatory environment due to
foreign earnings and/or capital being greater than 30% of the consolidated group total.
IFS Ratings
MAPFRE’s IFS ratings are constrained by the sovereign rating. No rating can exceed the
sovereign constraint, which Fitch has set at ‘A−’ for MAPFRE, one notch above Spain’s sovereign
rating of ‘BBB+’. The sovereign constraint is applied as the last step in the ratings process.
Initially, no constraint is assumed when the unconstrained assessment is derived. A baseline
recovery assumption of Good applies to the unconstrained IFS assessment, and standard
notching was used from the IFS anchor rating to the implied unconstrained operating company
IDR. The sovereign constraint is then applied to all unconstrained ratings above the sovereign
constraint.
Debt
For the senior unsecured debt issued by MAPFRE, S.A., a holding company of the group, Fitch
assumes a ’Below Average’ baseline recovery and the ratings are therefore one notch lower
than the IDR of MAPFRE, S.A.
Hybrids
For hybrids issued by MAPFRE, S.A., the following applies:
A EUR600 million subordinated bond issued in March 2017: a baseline recovery
assumption of Poor and a non-performance risk assessment of Moderate. A three-
notch differential was applied relative to the IDR, which was based on two notches for
recovery and one notch for non-performance risk.

Insurance
MAPFRE, S.A.
July 2017 16
Hybrids – Equity/Debt Treatment
Hybrids Treatment
Hybrid Amount FBM Fitch (%) FBM reg. override (%) FLR debt (%)
MAPFRE, S.A.
ES0224244089 EUR600m 0 100 100
FBM Factor-based capital model; FLR Financial leverage ratio; n.a. Not Applicable For FBM, % tells portion of hybrid value included as Available Capital, both before (Fitch %) and after the Regulatory Override For FLR, % tells portion of hybrid value included as debt in numerator of leverage ratio Source: Fitch
Exceptions to Criteria/Ratings Limitations
None.

Insurance
MAPFRE, S.A.
July 2017 17
The ratings above were solicited by, or on behalf of, the issuer, and therefore,
Fitch has been compensated for the provision of the ratings.
ALL FITCH CREDIT RATINGS ARE SUBJECT TO CERTAIN LIMITATIONS AND DISCLAIMERS. PLEASE READ THESE LIMITATIONS AND DISCLAIMERS BY FOLLOWING THIS LINK: HTTPS://FITCHRATINGS.COM/UNDERSTANDINGCREDITRATINGS. IN ADDITION, RATING DEFINITIONS AND THE TERMS OF USE OF SUCH RATINGS ARE AVAILABLE ON THE AGENCY'S PUBLIC WEB SITE AT WWW.FITCHRATINGS.COM. PUBLISHED RATINGS, CRITERIA, AND METHODOLOGIES ARE AVAILABLE FROM THIS SITE AT ALL TIMES. FITCH'S CODE OF CONDUCT, CONFIDENTIALITY, CONFLICTS OF INTEREST, AFFILIATE FIREWALL, COMPLIANCE, AND OTHER RELEVANT POLICIES AND PROCEDURES ARE ALSO AVAILABLE FROM THE CODE OF CONDUCT SECTION OF THIS SITE. FITCH MAY HAVE PROVIDED ANOTHER PERMISSIBLE SERVICE TO THE RATED ENTITY OR ITS RELATED THIRD PARTIES. DETAILS OF THIS SERVICE FOR RATINGS FOR WHICH THE LEAD ANALYST IS BASED IN AN EU-REGISTERED ENTITY CAN BE FOUND ON THE ENTITY SUMMARY PAGE FOR THIS ISSUER ON THE FITCH WEBSITE.
Copyright © 2017 by Fitch Ratings, Inc., Fitch Ratings Ltd. and its subsidiaries. 33 Whitehall Street, NY, NY 10004. Telephone: 1-800-753-4824, (212) 908-0500. Fax: (212) 480-4435. Reproduction or retransmission in whole or in part is prohibited except by permission. All rights reserved. In issuing and maintaining its ratings and in making other reports (including forecast information), Fi tch relies on factual information it receives from issuers and underwriters and from other sources Fitch believes to be credible. Fitch conducts a reasonable investigation of the factual information relied upon by it in accordance with its ratings methodology, and obtains reasonable verification of that information from independent sources, to the extent such sources are available for a given security or in a given jurisdiction. The manner of Fitch’s factual investigation and the scope of the third-party verification it obtains will vary depending on the nature of the rated security and its issuer, the requirements and practices in the jurisdiction in which the rated security is offered and sold and/or the issuer is located, the availability and nature of relevant public information, access to the management of the issuer and its advisers, the availability of pre-existing third-party verifications such as audit reports, agreed-upon procedures letters, appraisals, actuarial reports, engineering reports, legal opinions and other reports provided by third parties, the availability of independent and competent third-party verification sources with respect to the particular security or in the particular jurisdiction of the issuer, and a variety of other factors. Users of Fitch’s ratings and reports should understand that neither an enhanced factual investigation nor any third-party verification can ensure that all of the information Fitch relies on in connection with a rating or a report will be accurate and complete. Ul timately, the issuer and its advisers are responsible for the accuracy of the information they provide to Fitch and to the market in offering documents and other reports. In issuing its ratings and its reports, Fitch must rely on the work of experts, including independent auditors with respect to financial statements and attorneys with respect to legal and tax matters. Further, ratings and forecasts of financial and other information are inherently forward-looking and embody assumptions and predictions about future events that by their nature cannot be verified as facts. As a result, despite any verification of current facts, ratings and forecasts can be affected by future events or conditions that were not anticipated at the time a rating or forecast was issued or affirmed.
The information in this report is provided “as is” without any representation or warranty of any kind, and Fitch does not represent or warrant that the report or any of its contents will meet any of the requirements of a recipient of the report. A Fitch rating is an opinion as to the creditworthiness of a security. This opinion and reports made by Fitch are based on established criteria and methodologies that Fitch is continuously evaluating and updating. Therefore, ratings and reports are the collective work product of Fitch and no individual, or group of individuals, is solely responsible for a rating or a report. The rating does not address the risk of loss due to risks other than credit risk, unless such risk is specifically mentioned. Fitch is not engaged in the offer or sale of any security. All Fitch reports have shared authorship. Individuals identified in a Fitch report were involved in, but are not solely responsible for, the opinions stated therein. The individuals are named for contact purposes only. A report providing a Fitch rating is neither a prospectus nor a substitute for the information assembled, verified and presented to investors by the issuer and its agents in connection with the sale of the securities. Ratings may be changed or withdrawn at any time for any reason in the sole discretion of Fitch. Fitch does not provide investment advice of any sort. Ratings are not a recommendation to buy, sell, or hold any security. Ratings do not comment on the adequacy of market price, the suitability of any security for a particular investor, or the tax-exempt nature or taxability of payments made in respect to any security. Fitch receives fees from issuers, insurers, guarantors, other obligors, and underwriters for rating securities. Such fees generally vary from US$1,000 to US$750,000 (or the applicable currency equivalent) per issue. In certain cases, Fitch will rate all or a number of issues issued by a particular issuer, or insured or guaranteed by a particular insurer or guarantor, for a single annual fee. Such fees are expected to vary from US$10,000 to US$1,500,000 (or the applicable currency equivalent). The assignment, publication, or dissemination of a rating by Fitch shall not constitute a consent by Fitch to use its name as an expert in connection with any registration statement filed under the United States securities laws, the Financial Services and Markets Act of 2000 of the United Kingdom, or the securities laws of any particular jurisdiction. Due to the relative efficiency of electronic publishing and distribution, Fitch research may be available to electronic subscribers up to three days earlier than to print subscribers.
For Australia, New Zealand, Taiwan and South Korea only: Fitch Australia Pty Ltd holds an Australian financial services license (AFS license no. 337123) which authorizes it to provide credit ratings to wholesale clients only. Credit ratings information published by Fitch is not
intended to be used by persons who are retail clients within the meaning of the Corporations Act 2001.


