European Embedded Value, first year application Alberto Minali March 10th, 2005.

Nº 2009 – 15
European Embedded Value 2008 23rd July 2009

2Nº 2009 - 15
European Embedded Value analysis
Watson Wyatt certification
Methodological appendix
Statistical appendix
Glossary

3Nº 2009 - 15
Executive summary
European Embedded Value analysis
EEV evolution in 2008
Million Euros
A greater weight of Life-Protection insuranceThe inclusion of UNIÓN DUERO VIDA and DUERO PENSIONES into the scope of consolidationA new distribution agreement signed by MAPFRE VERA CRUZ, which mitigates to a significant extent the effect of the depreciation of the Brazilian RealSales focus on shorter duration products
These results reflect mainly:
1) “European Embedded Value Principles” (“EEVP”). Further details on the share of minority interests are provided on slides 6,7 and 38 of this document.
2) As per the certification letters contained in the Appendix.
Watson Wyatt has acted as advisor in the preparation of the figures shown herein and has also verified their compliance with the EEVP(2).
Value of In-force Business (VIF) 1,405.4 +6.1%
European Embedded Value (EEV(1)) 2,191.8 +13.0%
Return on Embedded Value (RoEV) 9.4% +2.3p.p
Value added by new business 226.3 +44.7%
New business margin 5.5% +1.3p.p

4Nº 2009 - 15
EEV components
ANAV
PVIF
TVFOGs
CoC
Adjusted Net Asset Value.
Present value of the in-force business, after tax, calculated on the basis of risk-free investment returns and discounted using the risk-free yield curve.
Time value of embedded financial options and guarantees.
Cost of capital.
European Embedded Value
European Embedded Value analysis

5Nº 2009 - 15
EEV 2007 EEV 2008(1)
EEV components and their variation in 2008
Million Euros
European Embedded Value analysis
1) Aggregate EEV for the covered businesses, with no adjustment for the share of minority interests in their respective VIFs. Additional information on which is provided on slides 7 and 38 of this document
Changes in 2008Value in 2007EEV 2007 and 2008
1,637.9
(110.1)
1,939.3
614.3
2,191.91,637.9
(202.8)(110.1)
172.2
(202.8)86.1
ANAV 2007 PVIF CoC TVFOGs EEV 2007 ANAV 2008 PVIFs CoC TVFOGs EEV 2008
1.724.0
614.3
786.4
(11.5)
(214.3)
5.8
(104.3)

6Nº 2009 - 15
By distribution channelBy business line
Breakdown of 2008 EEV(1)
1) The EEV of MAPFRE VIDA was calculated by Consultora MAPFRE VIDA and certified by Watson Wyatt; the EEV of the rest of the businesses has been calculated partly by Watson Wyatt and partly by Consultora MAPFRE VIDA. The certification letters are shown in the Appendix. Aggregate figures with no adjustment for the share of VIF corresponding to the minority interests (see pages 7 and 38)
2) Adjusted Net Asset value = MAPFRE VIDA pro forma + MAPFRE VERA CRUZ.3) PVIF = Present Value of In-Force business, calculated using a risk-free rate4) Includes the in-force values of the Life assurance and Accidental Death insurance businesses5) EEV calculations based on an amount of capital equal to 100% of the required minimum as at 31/12/2008
European Embedded Value analysis
2007: 755.7
€ mill. % Var. %
Adjusted Net Asset Value(2) 786.4 35.9% 28.0%
Net PVIF(3) - Life Assurance(4) 1,170.8 53.4% 15.5%
- PVIF 1,370.3 62.5% 14.0% - CoC (199.5) -9.1% 6.0%
Net PVIF(3) - Investment Funds 147.7 6.7% -27.9%
- PVIF 150.7 6.9% -27.6% - CoC (3.0) -0.1% -11.2%
Net PVIF(3) - Pension Funds 191.2 8.7% -11.7%
- PVIF 203.0 9.3% -10.9% - CoC (11.8) -0.5% 5.9%
TVFOGs (104.3) -4.8% -5.3%
EEV 2008 2,191.8 100.0% 13.0%
Initial capital used to calculate the CoC(5) 733.1 --- -3.0%
€ mill. % Var. %
Adjusted Net Asset Value 786.4 35.9% 28.0%
Net PVIF - Spanish agents' channel 898.6 41.0% -5.3%
- PVIF 1,030.5 47.0% -4.3% - CoC (131.9) -6.0% 3.5%
Net PVIF - Caja Madrid channel 188.5 8.6% 1.0%
- PVIF 242.1 11.0% -1.5% - CoC (53.6) -2.4% -9.2%
Net PVIF - other Spanish bancassurance channels 293.5 13.4% 67.4%
- PVIF 312.7 14.3% 68.5% - CoC (19.2) -0.9% 86.3%
Net PVIF - MAPFRE VERACRUZ VIDA 129.1 5.9% 4.2%
- PVIF 138.8 6.3% 6.8% - CoC (9.7) -0.4% 61.2%
TVFOGs (104.3) -4.8% -5.3%
EEV 2007 2,191.8 100.0% 13.0%
Initial capital used to calculate the CoC(4) 733.1 --- -3.0%
Million Euros

7Nº 2009 - 15
Minority interests in 2008 PVIF
Million Euros
Breakdown of MAPFRE’s 2008 PVIF
European Embedded Value analysis
1,405.41,509.7
(104.3)
(248.0)
1,157.4
Consolidated PVIF pre-TVFOGs
TVFOGs Consolidated PVIF post-TVFOGs
Minority interests PVIF attributable toMAPFRE S.A.

8Nº 2009 - 15
1,939.3
2,191.8
(24.5)
10.868.1
(78.3)
6.2
88.5
226.3
(44.6) 198.1
2007 EEV Changes inmodel
Additions Changes inassumptions
Expectedreturn
Value addedby new
business
Deviation of actual
value fromexpectations
Change inTVFOGs
Dividendspaid and
other items
2008 EEV
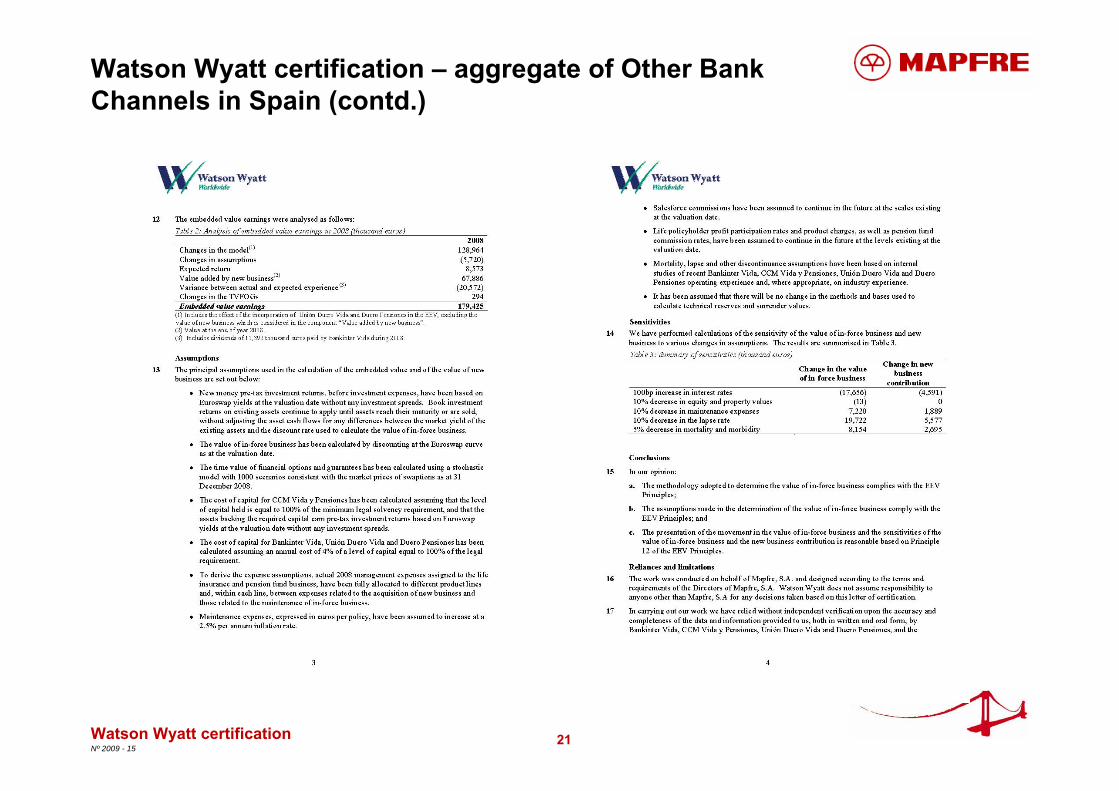
Embedded Value Earnings
Value added in 2008 (aggregate figures)
1) Return on Embedded Value = Value added in the year / Embedded Value, adjusted for model changes. The effect of the inclusion of the Life assurance and Pensions businesses of CAJA DUERO was not considered in the calculation of the RoEV
Million Euros
European Embedded Value analysis
RoEV(1) = 9.4%

9Nº 2009 - 15
Analysis of the main variations in EEV
The increase in the embedded value reflects primarily the following:
Model changes Net positive effect arising from the changes in the way fees and the loss ratio are projected
AdditionsIncludes the PVIF and the ANAV of UNIÓN DUERO VIDA and DUERO PENSIONES (the value of new business is included in the corresponding item)
European Embedded Value analysis
Change Description
Million Euros
Financial assumptions
Reflects primarily:– the effect of the fall in interest rates, which includes a positive impact of €123.7
million due to the application of lower discount rates, and a negative amount of €55.8 million due to the decrease in expected financial revenues
– higher lapse rate assumptions, especially in the mutual and pension funds businesses, whose effect amounted to -€87.5 million
– the depreciation of the Brazilian Real, with an impact of -€49.6 million
– higher mortality rates, with a total effect of -€14.3 million

10Nº 2009 - 15
Analysis of the main variations in EEV(cont’d)
Expected returnIncludes primarily the positive impact of the unwind of the discount rate, which amounted to €50 million, and the actual after-tax investment return on the beginning-of-the-year adjusted net asset value, net of the cost of capital
European Embedded Value analysis
Change Description
Million Euros
Deviation of actual value from expectations
Includes, among others, the effect of the depreciation of the Brazilian Real, which amounted to -€49,5 million
TVFOGs The time value of financial options has decreased due to a lower weight of equities in the investment portfolio

11Nº 2009 - 15
Value added by new business
Added value breakdown in 2008Added value evolution
By product
By distribution channel
Mutual fundsLife assurance – bank channelLife assurance – agents’ channel
Pension funds
Spain – Caja Madrid channelSpain –Other bank channelsSpain – agents’ channel
MAPFRE VERA CRUZ VIDA
European Embedded Value analysis
156.4
226.3
5.5%
4.2%
2007 2008Value added by new business (€ million)
Margin over PVNBI (%)
24.5%49.0%
46.2%
40.2%12.2%
17.1% 8.2%2.5%
2007 2008
46.3%22.2%
19.3%
11.2%
27.9% 36.5%
30.1%
6.5%
2007 2008

12Nº 2009 - 15
The increase in the value added by new business reflects:
Analysis of the main variations in the value added by new business
1A new distribution agreement signed by VERA CRUZ VIDA E PREVIDÊNCIA, which contributed €81.6 million to the value added by new business and was also the main reason for the margin increase
European Embedded Value analysis
▲
2A significant increase in the contribution from the new bancassuranceagreements, which include the Life assurance and pension funds businesses of CAJA DUERO
▲
3 A decrease in the agents channel in Spain, mainly due to a lower demand of mutual and pension funds ▼
4 Lower contribution from the CAJA MADRID channel, primarily due to lower sales volumes ▼

13Nº 2009 - 15
Analysis of the main variations in the value added by new business (contd.)
7 Customer preference for more conservative products with shorter maturities
5 A higher relative weight of Life-Protection products
European Embedded Value analysis
▼
▲
6 A reduction of investment returns of Life-Savings products, partially offset by a lower discount rate ▼

14Nº 2009 - 15
-49.2
-8.2
31.0
98.0
19.2
Sensitivity analysis of the value of in-force business(1)
1,424.6
1,503.4
1,436.4
1,397.2
1,356.2
Variation in PVIF€ million
Resulting Value
Base scenario:€1,405.4 million
1) PVIF - TVFOGs – CoCEuropean Embedded Value analysis
100bp increase in interest rates
10% decrease in the value of stocks and real estate
10% decrease in expenses
10% decrease in the lapse rate
5% decrease in mortality and morbidity
Million Euros

15Nº 2009 - 15
-13.6
0.0
6.0
21.9
7.7
Sensitivity analysis of the value added by new business
Variation in the value added by new business€ million
Base scenario:€226.3 million
234.0
248.2
232.3
226.3
212.7100bp increase in interest rates
10% decrease in the value of stocks and real estate
10% decrease in expenses
10% decrease in the lapse rate
5% decrease in mortality and morbidity
European Embedded Value analysis
Resulting Value
Million Euros

16Nº 2009 - 15
European Embedded Value analysis
Watson Wyatt certification
Methodological appendix
Statistical appendix
Glossary

17Nº 2009 - 15
Watson Wyatt certification – MAPFRE VIDA
Watson Wyatt certification

18Nº 2009 - 15
Watson Wyatt certification – MAPFRE VIDA (contd.)
Watson Wyatt certification

19Nº 2009 - 15
Watson Wyatt certification – MAPFRE VIDA (contd.)
Watson Wyatt certification

20Nº 2009 - 15
Watson Wyatt certification – aggregate of Other Bank Channels in Spain
Watson Wyatt certification
21Nº 2009 - 15
Watson Wyatt certification – aggregate of Other Bank Channels in Spain (contd.)
Watson Wyatt certification
22Nº 2009 - 15
Watson Wyatt certification – aggregate of Other Bank Channels in Spain (contd.)
Watson Wyatt certification

23Nº 2009 - 15
Watson Wyatt certification– MAPFRE VERA CRUZ VIDA E PREVIDÊNCIA
Watson Wyatt certification

24Nº 2009 - 15
Watson Wyatt certification– MAPFRE VERA CRUZ VIDA E PREVIDÊNCIA (contd.)
Watson Wyatt certification

25Nº 2009 - 15
European Embedded Value analysis
Watson Wyatt certification
Methodological appendix
Statistical appendix
Glossary

26Nº 2009 - 15
Covered business
The embedded value was calculated for the following blocks of business:
– Life assurance (including complementary) and accidental death insurance businesses of MAPFRE VIDA, sold through the agents channel, both in Spain and in Portugal
– Life assurance (including complementary) and accidental death insurance businesses of MAPFRE-CAJA MADRID VIDA
– Life assurance (including complementary), accidental death insurance and pension funds businesses of CCM VIDA Y PENSIONES, BANKINTER SEGUROS DE VIDA, UNIÓN DUERO VIDA and DUERO PENSIONES
– Mutual funds and pension funds businesses of MAPFRE INVERSIÓN S.V., S.A., MAPFRE INVERSIÓN DOS, S.G.I.I.C., S.A. and MAPFRE VIDA PENSIONES, E.G.F.P., S.A. de Seguros, S.A. ("MAPFRE INVERSIÓN Y PENSIONES")
– Life assurance business of MAPFRE VERA CRUZ
Methodological appendix

27Nº 2009 - 15
Methodology
The consolidated embedded value of the Life assurance, accidental death insurance, mutual funds and pension funds businesses includes the adjusted net asset value and the value of in-force business, defined as follows:
Embedded value = Adjusted Net Asset Value + Value of the In-Force BusinessAdjusted Net Asset Value (ANAV) = Shareholders’ equity at market value, adjusted to obtain the economic value of capitalValue of the In-Force Business = PVIF – TVFOGs – CoC
A bottom-up approach was followed to comply with EEVP, valuing separately each component of risk in the business, since it was deemed that this methodology provides the most transparent information about shareholder value, better quantifies the risk in each product, differentiating between in-force and new business and is independent from the subjective choice of a set of financial return assumptions
Adjusted Net Asset Value:The Adjusted Net Asset Value or "ANAV” is equal to shareholders’ equity as defined under the new local GAAP (which came into effect from 31/12/2008) and which is aligned with IFRS, adjusted for: committed donations and dividends; goodwill; deferred expenses; and any other item needed to calculate the economic capital
Present Value of In-force Business:The Present Value of In-force Business or “PVIF” is determined as the present value of future statutory profits which are expected to be generated from the existing business in force at the valuation date, after tax, calculated on the basis of risk-free investment returns and discounted using the risk-free yield curve. PVIF includes the intrinsic value of financial options and guarantees granted to the insured
Methodological appendix

28Nº 2009 - 15
Methodology (contd.)
TVFOGs:
– Under EEVP, FOGs (Financial Options and Guarantees) are defined as those features of the covered business that imply the existence of significant guarantees on the amount or the nature of the benefits payable to policyholders, or options to vary such benefits, which can be exercised at the discretion of the policyholder and whose potential value is driven by changes in financial variables.
– The cost of FOGs is valued through the measurement of two different elements:• intrinsic value: the cost of FOGs under existing conditions at the valuation date.• time value: the change in the cost of FOGs that can result from potential changes in policyholder’s
benefits that may occur throughout the life of the policy.– The intrinsic value of FOGs is already recognised implicitly in the calculation of the PVIF. It is
therefore necessary to include the additional cost arising from the time value of FOGs (TVFOGs).– TVFOGs was calculated for the main FOGs in the covered life business. Specifically, the
calculation focussed on the TVFOGs corresponding to the guaranteed interest rate in with-profits products.
– The calculation of TVFOGs assumed the realisation of gains/losses on equity and property investments to:
• minimise the impact of profit sharing on the Company’s results; and• keep the asset mix close to its breakdown as at 31 December 2008
– TVFOGs is based on a 1,000 stochastic simulations of market-consistent financial assumptions and is equal to the difference between the value of in-force business calculated under a deterministic approach and the average value of the in-force business calculated stochastically.
Methodological appendix

29Nº 2009 - 15
Methodology (contd.)
PVIF – TVFOG:
– The difference between these two components yields the “risk-neutral” value of the in-force business, which is equal to the value of said business adjusted for financial risks.
CoC:
– In line with market practices, the CoC used in the calculation of the 2008 EEV was measured by applying a 4% fixed rate to the minimum required solvency margin.
– It provides an indication of the cost of the required capital including the capital needed to cover financial and non-financial risks. Non-financial risks are not considered in any other part of the calculation of the EEV.
Methodological appendix

30Nº 2009 - 15
Methodology (contd.)
With-profits business:
– MAPFRE’s with-profits in-force business comprises products with the following features that are common in the Spanish insurance market:
• A minimum return guarantee, ranging between 2.25% and 6% in the case of MAPFRE.• A profit-sharing mechanism defined as: X% of (Financial return – minimum guaranteed return –
expense loadings) on the average mathematical reserve, which cannot be negative under any circumstance. X% varies by product, although it is equal to 90% in most cases. Financial returns and their volatility depend on the book returns of the assets backing the product and is subject to some degree of discretion by management, including, for instance, decisions on the realisation of gains/losses and on the asset mix.
– The combination of a minimum return guarantee and a profit-sharing mechanism that cannot yield negative results generates asymmetric flows for shareholders and, as a consequence, a positive time value of FOGs.
Methodological appendix
31Nº 2009 - 15
Methodology (contd.)
Look through EEVP:
– In order to assign correctly revenues and expenses to the businesses that generate them and measure the value of each block of business more consistently with its economic reality, the following adjustments were made:
• Mutual funds (not linked to Life assurance) and pension fund businesses, as well as a part of the accidental death business, are sold through the distribution network of MAPFRE VIDA. The income statement of MAPFRE VIDA shows its total expenses with no adjustment for the service referred to above. The values of the aforementioned mutual funds, pension funds and accidental death businesses have been adjusted in order to include the expenses (other than commissions) incurred by the aforesaid MAPFRE VIDA distribution network in connection with the effort of selling the said businesses.
• The assets of the Life assurance business are managed by MAPFRE INVERSIÓN Y PENSIONES. The income statement of MAPFRE INVERSIÓN Y PENSIONES shows its total expenses with no adjustment for the service referred to above. The value of the aforementioned Life assurance business has been adjusted in order to include the asset management expenses incurred by MAPFRE INVERSIÓN Y PENSIONES in said business.
Methodological appendix
32Nº 2009 - 15
Methodology (contd.)
Value added by new business:
– In Life assurance, new business is defined as single, extraordinary and regular premiums written in the year, as well as extraordinary contributions to existing policies. In the mutual funds business, new business is defined as new contributions. In the pension funds business, new business is defined as single, extraordinary and regular contributions from new participants, as well as extraordinary contributions from existing participants.
– The value added by new business is the value of in-force added by new business in the period, net of acquisition expenses, TVFOGs and CoC, valued at year-end using the assumptions applicable at that point in time.
Methodological appendix
33Nº 2009 - 15
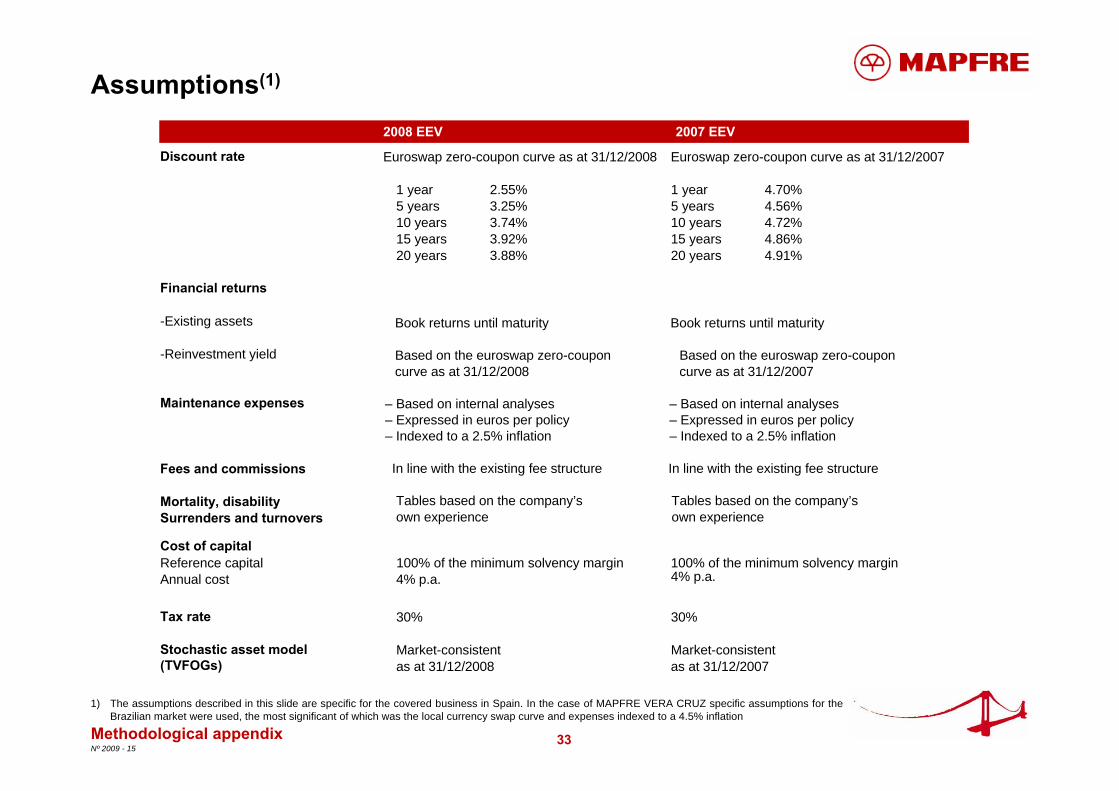
Assumptions(1)
2008 EEV 2007 EEV
Methodological appendix
Discount rate Euroswap zero-coupon curve as at 31/12/2008 Euroswap zero-coupon curve as at 31/12/2007
1 year 2.55% 1 year 4.70%5 years 3.25% 5 years 4.56%10 years 3.74% 10 years 4.72%15 years 3.92% 15 years 4.86%20 years 3.88% 20 years 4.91%
Financial returns
-Existing assets
-Reinvestment yield
Maintenance expenses
Fees and commissions
Mortality, disabilitySurrenders and turnovers
Cost of capitalReference capital 100% of the minimum solvency margin 100% of the minimum solvency marginAnnual cost 4% p.a.
Tax rate 30% 30%
Stochastic asset model (TVFOGs)
Market-consistent Market-consistentas at 31/12/2008 as at 31/12/2007
Book returns until maturity Book returns until maturity
Based on the euroswap zero-coupon Based on the euroswap zero-couponcurve as at 31/12/2008 curve as at 31/12/2007
– Based on internal analyses – Based on internal analyses– Expressed in euros per policy – Expressed in euros per policy– Indexed to a 2.5% inflation – Indexed to a 2.5% inflation
In line with the existing fee structure In line with the existing fee structure
Tables based on the company’s Tables based on the company’sown experience own experience
1) The assumptions described in this slide are specific for the covered business in Spain. In the case of MAPFRE VERA CRUZ specific assumptions for the Brazilian market were used, the most significant of which was the local currency swap curve and expenses indexed to a 4.5% inflation
4% p.a.

34Nº 2009 - 15
European Embedded Value analysis
Watson Wyatt certification
Methodological appendix
Statistical appendix
Glossary

35Nº 2009 - 15
Value added by new business
1) Present Value of New Business Income.2) Value added by new business.
Million Euros
Breakdown by business line
Breakdown by distribution channel
Statistical appendix
2008 2007 2008 2007 2008 2007Life assurance: 2,931.0 2,240.7 201.9 110.5 6.9% 4.9%
- Agents channel 1,649.6 891.5 110.9 38.3 6.7% 4.3% - Bank channel 1,281.4 1,349.2 91.0 72.2 7.1% 5.4%
Mutual Funds 513.7 781.8 5.7 19.1 1.1% 2.4%
Pension Funds 675.9 669.5 18.7 26.8 2.8% 4.0%
- Agents channel 427.7 544.4 16.4 25.2 3.8% 4.6% - Bank channel 248.2 125.1 2.3 1.6 0.9% 1.3%
TOTAL 4,120.5 3,692.0 226.3 156.4 5.5% 4.2%
VNB(2) VNB/PVNBIPVNBI(1)
2008 2007 2008 2007 2008 2007Spain 3,385.2 3,394.1 143.6 146.2 4.2% 4.3%
- Agents channel 1,855.6 1,919.8 50.3 72.3 2.7% 3.8%
- Caja Madrid channels 818.5 985.4 25.4 30.2 3.1% 3.1%
- Other bancassurance 711.1 488.9 67.9 43.6 9.6% 8.9%
VERA CRUZ VIDA 735.3 297.8 82.7 10.2 11.2% 3.4%
TOTAL 4,120.5 3,692.0 226.3 156.4 5.5% 4.3%
PVNBI(1) VNB(2) VNB/PVNBI
36Nº 2009 - 15
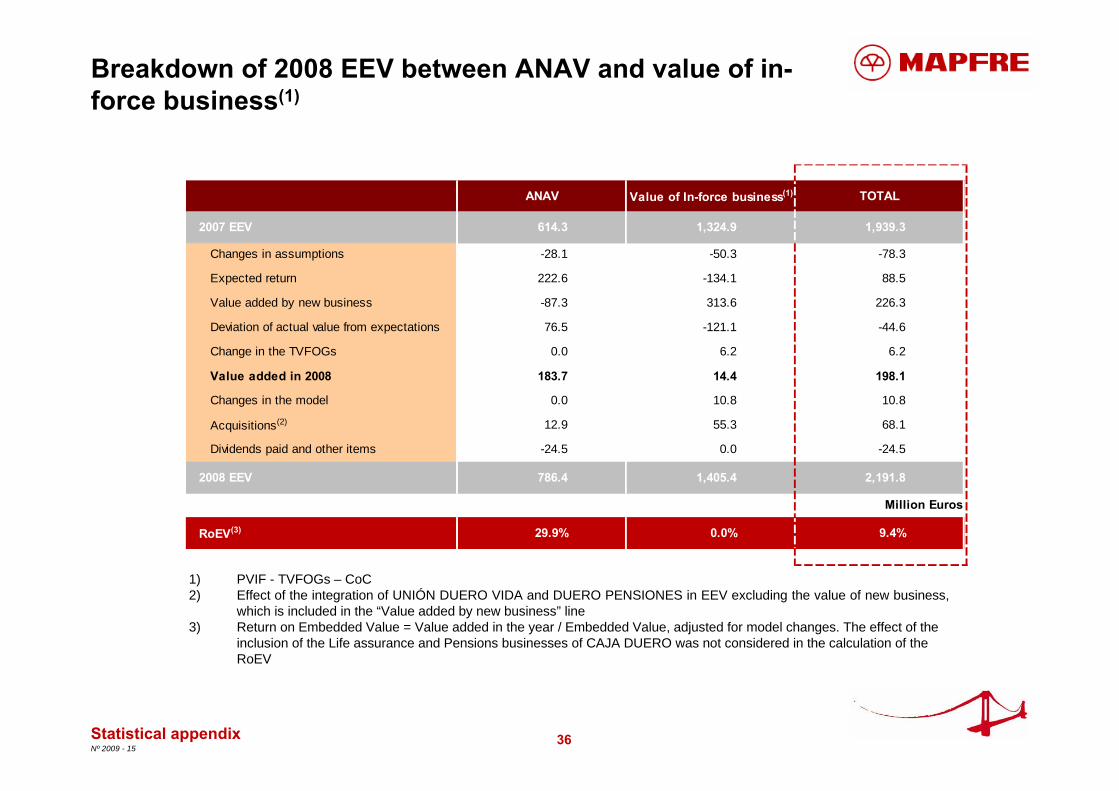
Breakdown of 2008 EEV between ANAV and value of in-force business(1)
Statistical appendix
1) PVIF - TVFOGs – CoC2) Effect of the integration of UNIÓN DUERO VIDA and DUERO PENSIONES in EEV excluding the value of new business,
which is included in the “Value added by new business” line3) Return on Embedded Value = Value added in the year / Embedded Value, adjusted for model changes. The effect of the
inclusion of the Life assurance and Pensions businesses of CAJA DUERO was not considered in the calculation of the RoEV
ANAV Value of In-force business(1) TOTAL
2007 EEV 614.3 1,324.9 1,939.3
Changes in assumptions -28.1 -50.3 -78.3
Expected return 222.6 -134.1 88.5
Value added by new business -87.3 313.6 226.3
Deviation of actual value from expectations 76.5 -121.1 -44.6
Change in the TVFOGs 0.0 6.2 6.2
Value added in 2008 183.7 14.4 198.1
Changes in the model 0.0 10.8 10.8
Acquisitions(2) 12.9 55.3 68.1
Dividends paid and other items -24.5 0.0 -24.5
2008 EEV 786.4 1,405.4 2,191.8
Million Euros
RoEV(3) 29.9% 0.0% 9.4%

37Nº 2009 - 15
Breakdown of the sensitivity analysis
MAPFRE VIDA(1) Bank channels - Other
MAPFRE VERA CRUZ VIDA
Impact of:
- 100bp increase in interest rates -29.3 -17.6 -2.3
- 10% decrease in equity and property values -8.2 0.0 0.0
- 10% decrease in expenses 20.8 7.3 2.9
- 10% decrease in the lapse rate 77.7 19.7 0.6
- 5% decrease in mortality and morbidity 6.9 8.1 4.2
Sensitivity of the value of in-force business
Sensitivity of the value added by new business
Statistical appendix
Million Euros
MAPFRE VIDA Bank channels - Other
MAPFRE VERA CRUZ VIDA
Impact of:
- 100bp increase in interest rates -5.7 -4.6 -3.3
- 10% decrease in equity and property values 0.0 0.0 0.0
- 10% decrease in expenses 3.0 1.9 1.1
- 10% decrease in the lapse rate 16.1 5.6 0.2
- 5% decrease in mortality and morbidity 2.8 2.7 2.2
1) Includes the value of in-force business of MAPFRE-CAJA MADRID VIDA gross of minority interests and excludes that of BANKINTER VIDA

38Nº 2009 - 15
MAPFRE VIDA:IFRS adjustments and reconciliation to adjusted net asset value
Million Euros
Statistical appendix1) Amount used in embedded value calculations.
Consolidated net assets for MAPFRE VIDA as at 31/12/08 (Previous local GAAP) 797.9
Consolidated net assets for MAPFRE VIDA as at 31/12/08 (New local GAAP) 852.2Unrealised gains -18.6 - of which: property 6.4 - of which: financial assets -25.0Donations and dividends 0.0Goodwill -181.5Acquisition costs net of taxes 0.0Other 1.1
Adjusted consolidated net assets for MAPFRE VIDA as at 31/12/08(1) 653.2

39Nº 2009 - 15
OTHER BANK CHANNELS(2)MAPFRE VIDA(1)
Units and operating companies included in the2008 EEV
1) Excluding BANKINTER VIDA’s PVIF and including the PVIF of MAPFRE-CAJA MADRID VIDA.2) BANKINTER VIDA + CCM VIDA y PENSIONES + UNIÓN DUERO VIDA + DUERO PENSIONES. Aggregate data.
Statistical appendix
Million Euros
2007 2008
Adjusted Net Asset Value 450.5 653.2
Net PVIF - Life Assurance 751.7 784.2
- PVIF 931.7 964.0
- CoC (179.9) (179.8)
Net PVIF - Investment Funds 198.2 144.1
- PVIF 200.2 145.7
- CoC (2.0) (1.6)
Net PVIF- Pension Funds 185.8 158.7
- PVIF 190.5 162.8
- CoC (4.7) (4.1)
TVFOGs (104.3) (98.4)
EEV 1,482.0 1,641.8
Initial capital used to calculate the CoC 623.1 602.5
2007 2008
Adjusted Net Asset Value 82.1 143.4
Net PVIF - Life Assurance 144.5 261.0
- PVIF 148.3 272.5
- CoC (3.8) (11.4)
Net PVIF - Investment Funds 0.0 0.0
- PVIF 0.0 0.0
- CoC 0.0 0.0
Net PVIF- Pension Funds 30.8 32.5
- PVIF 37.3 40.2
- CoC (6.5) (7.7)
TVFOGs (5.8) (5.9)
EEV 251.6 431.1
Initial capital used to calculate the CoC 84.1 95.4

40Nº 2009 - 15
MAPFRE VERA CRUZ VIDA E PREVIDÊNCIA
Statistical appendix
Million Euros
Units and operating companies included in the2008 EEV
Exchange rate at year end 2007 2008
Adjusted Net Asset Value 142.2 115.2
Net PVIF - Life Assurance 117.4 125.6
- PVIF 121.9 133.8
- CoC (4.5) (8.2)
Net PVIF - Investment Funds 6.6 3.6
- PVIF 8.1 5.0
- CoC (1.5) (1.4)
Net PVIF- Pension Funds 0.0 0.0
- PVIF 0.0 0.0
- CoC 0.0 0.0
TVFOGs 0.0 0.0
EEV 266.1 244.3
Initial capital used to calculate the CoC 48.5 35.1
Constant exchange rate 2007 2008
Adjusted Net Asset Value 114.1 115.2
Net PVIF - Life Assurance 94.2 125.6
- PVIF 97.8 133.8
- CoC (3.6) (8.2)
Net PVIF - Investment Funds 5.3 3.6
- PVIF 6.5 5.0
- CoC (1.2) (1.4)
Net PVIF- Pension Funds 0.0 0.0
- PVIF 0.0 0.0
- CoC 0.0 0.0
TVFOGs 0.0 0.0
EEV 213.6 244.3

41Nº 2009 - 15
Share of the parent company in the EEV
Million euros1) Includes BANKINTER VIDA, CCM VIDA Y PENSIONES, UNION DUERO VIDA and DUERO PENSIONES
Statistical appendix
MAPFRE Controllingstake Shareholder Minorities
ANAV
MAPFRE VIDA pro forma 100.0% 671.3 0.0MAPFRE VERA CRUZ VIDA E PREVIDÊNCIA 87.6% 100.9 14.3
AGGREGATE TOTAL 772.2 14.3VIF
MAPFRE VIDA - AGENTS CHANNEL 100.0% 898.6 0.0MAPFRE VIDA - CAJA MADRID CHANNEL 51.0% 96.1 92.3OTHER BANK CHANNELS IN SPAIN (1) 50.0% 146.8 146.8MAPFRE VERA CRUZ VIDA E PREVIDÊNCIA 87.6% 113.1 16.0
AGGREGATE TOTAL 1,254.6 255.1TVFOGS
MAPFRE VIDA - AGENTS CHANNEL 100.0% -89.9 0.0MAPFRE VIDA - CAJA MADRID CHANNEL 51.0% -4.3 -4.2OTHER BANK CHANNELS IN SPAIN (1) 50.0% -2.9 -2.9MAPFRE VERA CRUZ VIDA E PREVIDÊNCIA 87.6% 0.0 0.0
AGGREGATE TOTAL -97.2 -7.1
AGGREGATE 2008 EEV 1,929.6 262.3
42Nº 2009 - 15
European Embedded Value analysis
Watson Wyatt certification
Methodological appendix
Statistical appendix
Glossary

43Nº 2009 - 15
Glossary
The European Embedded Value Principles or “EEVP” are the principles that establish the methodology that must be applied in order to calculate the European Embedded Value. The EEVP were agreed upon by the CFOs of the multinational European insurers belonging to the “CFO Forum” in order to increase the comparability and transparency of the embedded value calculations carried out by insurance companies. The document that contains the EEVP can be obtained at the following Internet address: www.cfoforum.nl.The Adjusted Net Asset Value or "ANAV” is equal to shareholders’ equity as defined under Spanish GAAP (PGC) adjusted for: unrealised gains or losses belonging to shareholders; committed donations and dividends; goodwill; deferred expenses; and any other item needed to calculate the economic capital.Financial Options and Guarantees or “FOGs” are those features of the covered business thatimply the existence of significant guarantees on the amount or the nature of the benefits payableto policyholders, or options to vary such benefits, which can be exercised at the discretion of thepolicyholder and whose potential value is driven by changes in financial variables.The Value of an Option is composed by two elements: the Intrinsic Value and the Time Value. In the case of a call option, the intrinsic value is equal to the difference between the price of the underlying asset and the strike price of the option (in the case of a put option the order of the difference is inverted). The intrinsic value cannot be less than zero. The time value is equal to the difference between the total value and the intrinsic value and it is ascribed to the potential for benefits under the option to increase in value prior to expiry.The Present Value of In-force Business or “PVIF” is determined as the present value of future statutory profits which are expected to be generated from the existing business in force at the valuation date, after tax, calculated on the basis of risk-free investment returns and discounted using the risk-free yield curve. PVIF includes the intrinsic value of financial options and guarantees granted to the insured.
Glossary

44Nº 2009 - 15
Glossary
The Cost of Capital or “CoC” is equal to the difference between the amount of required capital and the present value of future releases, allowing for future investment return, of that capital. The CoC used in the calculation of the 2008 EEV was measured on the basis of an amount of capital equal to 100% of the minimum regulatory requirement.The Value of In-force Business or “VIF” is equal to: PVIF – Time Value of FOGs (“TVFOGs”) - CoC.The European Embedded Value or “EEV” is the embedded value obtained calculated in accordance with “European Embedded Value Principles”. EEV is equal to: ANAV + VIF.Embedded value earnings are defined as the change in embedded value during the period, including dividends paid and excluding capital injections, and provide a measure of the economic performance during the year.Changes in Assumptions are changes in the future experience assumed in the calculation of the present value of in-force business, including economic, expense, lapse, and mortality assumptions.The Expected Return on the Beginning of the Year Embedded Value is equal to the actual after-tax investment return on the beginning-of-the-year adjusted net asset value less the cost of capital, plus the return, at the discount rate, on the beginning-of-the-year value of the in-force business and capital.Deviation of Actual Value from Expectations arise from the variance between the actual experience during the year and the assumed experience used to calculate the beginning-of-the-year embedded value.The Return on Embedded Value or “RoEV” is obtained by dividing the value added in the year by the embedded value at the close of the previous year.
Glossary

45Nº 2009 - 15
Glossary
New Business is defined as: in the case of Life assurance, single, extraordinary and regular premiums from policies written in the year, as well as extraordinary contributions to existing policies; in the case of Mutual Funds, new contributions; in the case of Pension Funds, single, extraordinary and regular contributions from new participants, as well as extraordinary contributions from existing participants.The Present Value of New Business Income or “PVNBI” corresponds to: in the case of Life assurance, the present value of received and expected premiums from new business; in the case of Mutual Funds, contributions received in the year; and in the case of Pension Funds, contributions received in the year and expected from new business.The Value added by New Business or “VNB” is the value of in-force added by new business in the period, net of acquisition expenses, TVFOGs and CoC, valued at year-end using the assumptions applicable at that point in time.
Glossary

46Nº 2009 - 15
DisclaimerThis document is purely informative. Its content does not constitute, nor can it be interpreted as, an offer or an invitation to sell, exchange or buy, and it is not binding on the issuer in any way. The information about the plans of the Company, its evolution, its results and its dividends represents a simple forecast whose formulation does not represent a guarantee with respect to the future performance of the Company or the achievement of its targets or estimated results. The recipients of this information must be aware that the preparation of these forecasts is based on assumptions and estimates, which are subject to a high degree of uncertainty, and that, due to multiple factors, future results may differ materially from expected results. Among such factors, the following are worth highlighting: the development of the insurance market and the general economic situation of those countries where the Group operates; circumstances which may affect the competitiveness of insurance products and services; changes in the basis of calculation of mortality and morbidity tables which may affect the insurance activities of the Life and Health segments; frequency and severity of claims covered; effectiveness of the Groups reinsurance policies and fluctuations in the cost and availability of covers offered by third party reinsurers; changes in the legal environment; adverse legal actions; changes in monetary policy; variations in interest rates and exchange rates; fluctuations in liquidity and the value and profitability of assets which make up the investment portfolio; restrictions in the access to third party financing.
MAPFRE S.A. does not undertake to update or revise periodically the content of this document.