Presentación de PowerPoint - Corporativo MAPFRE 02 CAPITAL MANAGEMENT Million euros 13.2 billion...
94
Transcript of Presentación de PowerPoint - Corporativo MAPFRE 02 CAPITAL MANAGEMENT Million euros 13.2 billion...


This document is purely informative. Its content does not constitute, nor can it be interpreted as, an offer or an invitation to sell, exchange or buy, and it is not binding on the issuer in any way. The information about the plans of the Company, its evolution, its results and its dividends represents a simple forecast whose formulation does not represent a guarantee with respect to the future performance of the Company or the achievement of its targets or estimated results. The recipients of this information must be aware that the preparation of these forecasts is based on assumptions and estimates, which are subject to a high degree of uncertainty, and that, due to multiple factors, future results may differ materially from expected results. Among such factors, the following are worth highlighting: the development of the insurance market and the general economic situation of those countries where the Group operates; circumstances which may affect the competitiveness of insurance products and services; changes in the basis of calculation of mortality and morbidity tables which may affect the insurance activities of the Life and Health segments; frequency and severity of claims covered; effectiveness of the Groups reinsurance policies and fluctuations in the cost and availability of covers offered by third party reinsurers; changes in the legal environment; adverse legal actions; changes in monetary policy; variations in interest rates and exchange rates; fluctuations in liquidity and the value and profitability of assets which make up the investment portfolio; restrictions in the access to third party financing.
MAPFRE S.A. does not undertake to update or revise periodically the content of this document.
Certain numerical figures included in the Investor Presentation have been rounded. Therefore, discrepancies in tables between totals and the sums of the amounts listed may occur due to such rounding.
Disclaimer

3
0 1 O P E N I N G R E M A R K S
Fernando Mata CFO & Member of the Board
Speakers
Antonio Huertas Chairman & CEO
Eduardo Pérez de Lema CEO MAPFRE RE
Jaime Tamayo CEO International
Alfredo Castelo CEO North America
Natalia Núñez Head of Investor Relations
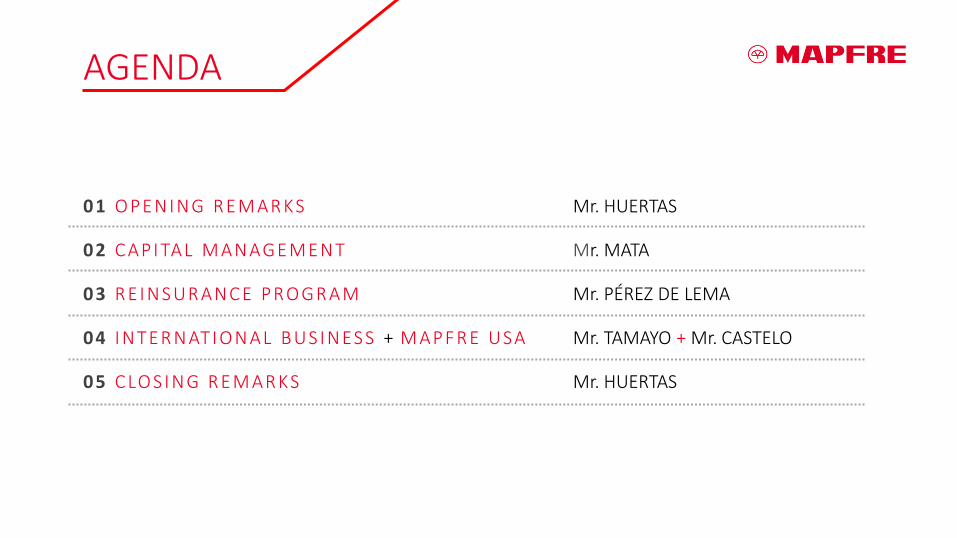
01 OPENI NG R EM AR KS Mr. HUERTAS
02 CAPI TAL M ANAGEM ENT Mr. MATA
03 R EI NS UR ANCE PROGR AM Mr. PÉREZ DE LEMA
04 I NTER NATI ONAL BUS I NES S + M APF R E USA Mr. TAMAYO + Mr. CASTELO
05 CLOS I NG R EM AR KS Mr. HUERTAS
AGENDA
01 OPENING REMARKS Antonio Huertas
Profitable growth strategy Delivering results
6
0 1 O P E N I N G R E M A R K S
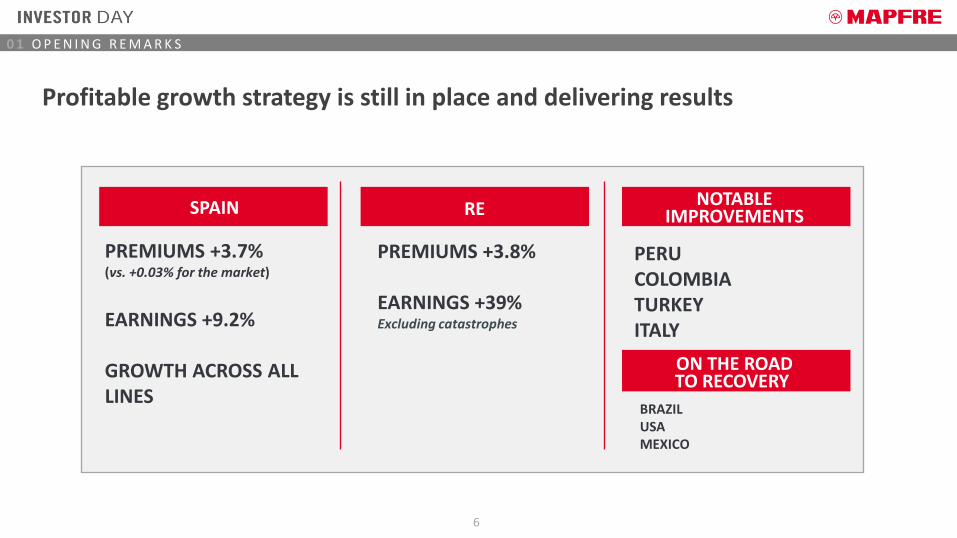
Profitable growth strategy is still in place and delivering results
PREMIUMS +3.7% (vs. +0.03% for the market)
EARNINGS +9.2%
GROWTH ACROSS ALL LINES
SPAIN
PREMIUMS +3.8%
EARNINGS +39% Excluding catastrophes
RE
PERU COLOMBIA TURKEY ITALY
NOTABLE
ON THE ROAD
BRAZIL USA MEXICO
IMPROVEMENTS
TO RECOVERY

7
0 1 O P E N I N G R E M A R K S
3Q Catastrophic Events
› Occasional impact of natural disasters does not alter the profitable growth strategy
› The 176 million net impact estimate announced in September is reaffirmed
› Gross impact >€1.1 bn
› MAPFRE’s protection measures have proven to be very effective

8
0 1 O P E N I N G R E M A R K S
Effective capital management
› High quality capital structure and financial flexibility
› Successful investment management in a low interest rate environment
› Commitment to stable and growing shareholder remuneration
› Final dividend against 2017 results to be announced in February 2018

9
0 1 O P E N I N G R E M A R K S
U.S. : Moving toward a streamlined geographic presence
› Reduced geographical footprint to achieve profitable growth. Exit five states:
› New York, New Jersey, Kentucky, Tennessee and Indiana
› Focus on Core Business (Auto and Homeowner) and digital transformation
› Launch of Verti USA

10
0 1 O P E N I N G R E M A R K S
Restructuring of international operations
› INTERNATIONAL AREA: Consolidation of EMEA and APAC regions into new EURASIA region
› From Jan. 1st. To streamline operations in Europe and Asia
› LATAM NORTH: creation of new subregion with all the Central American and Dominican businesses

11
0 1 O P E N I N G R E M A R K S
Strategic plan 2016-2018: Focus on profitable growth
To September 30th, satisfactory progress was made in executing our strategy
97% of projects
75% of indicators
Culture and human talent
Excellence in technical management
Client orientation
Digital transformation

12
0 1 O P E N I N G R E M A R K S
≈+5% CAGR
11% In 2018
50-65%
Financial Objectives
Creation of sustainable shareholder value
PAYOUT ROE GROWTH TARGET
Fulfillment of strategic objectives 2016-2018

13
0 1 O P E N I N G R E M A R K S
PERCEIVED QUALITY METRIC MARKET SHARE
NPS IN THE FIRST HALF WE
HAVE ALREADY REACHED
65% (final target for three year
period of 70%)
IMPROVEMENT IN
54% NON-LIFE BUSINESSES
(target 75%)
Core strategic objectives 2016-2018
Client Orientation

14
0 1 O P E N I N G R E M A R K S
INCREASE OF
19.8% IN DIGITAL TRANSACTIONS
(target 30%)
INCREASE OF
33% IN DIGITAL BUSINESS
(cumulative target for three year period of 50%)
Core strategic objectives 2016-2018
Digital Transformation
15
0 1 O P E N I N G R E M A R K S
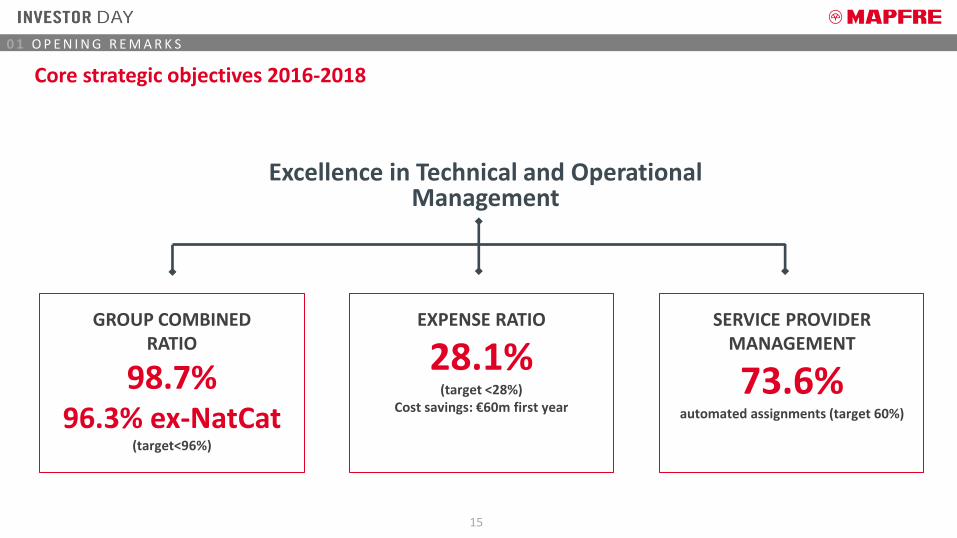
Excellence in Technical and Operational Management
GROUP COMBINED RATIO
98.7% 96.3% ex-NatCat
(target<96%)
EXPENSE RATIO
28.1% (target <28%)
Cost savings: €60m first year
SERVICE PROVIDER MANAGEMENT
73.6% automated assignments (target 60%)
Core strategic objectives 2016-2018
16
0 1 O P E N I N G R E M A R K S
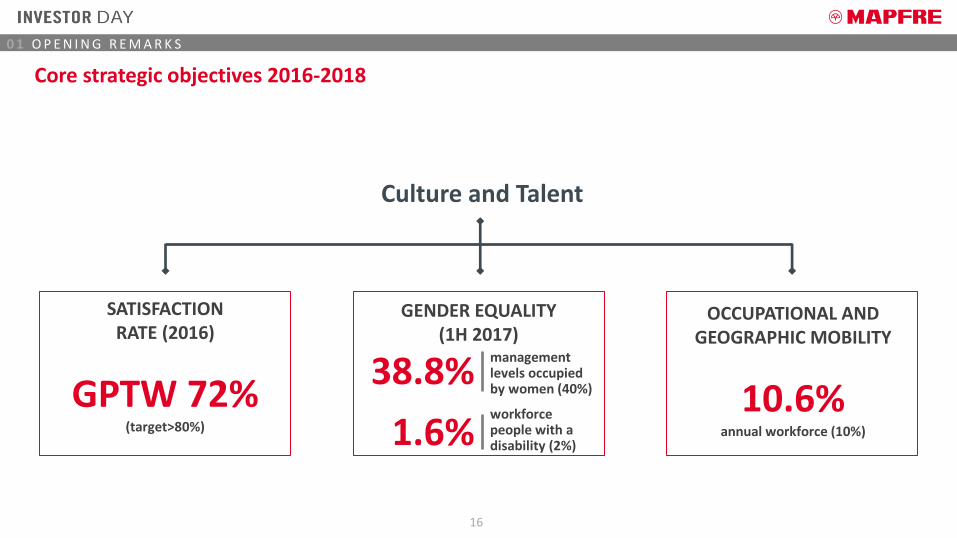
management levels occupied by women (40%)
38.8%
1.6% workforce people with a disability (2%)
SATISFACTION RATE (2016)
GPTW 72% (target>80%)
GENDER EQUALITY (1H 2017)
OCCUPATIONAL AND GEOGRAPHIC MOBILITY
10.6% annual workforce (10%)
Core strategic objectives 2016-2018
Culture and Talent

17
0 1 O P E N I N G R E M A R K S
Agenda
Value creation in MAPFRE Group Effective capital management
Cat risk management within MAPFRE Group Effective protection program
Restructuring of International operations & U.S. footprint Optimizing profitability

02 CAPITAL MANAGEMENT Fernando Mata
Value creation in MAPFRE Group Effective capital management

19
0 2 C A P I T A L M A N A G E M E N T
Million euros
13.2
billion
€
High quality capital structure and financial flexibility
Data as at September 30th, 2017 (1) Total Debt/ (Total Equity + Total Debt) (2) Pro-forma, excluding subordinated bond called on July 24th 2017
Capital structure Leverage (%)1
Solvency II ratio
93% Tier 1
197% 210% 192%2 EQUITY
82%
SENIOR DEBT
7%
BANK FINANCING
6%
SUBORDINATED DEBT
5%
189%
200% Solvency II target, including transitionals (+/- 25 p.p.)
16.7% 16.1%18.1%
09.30.2016 12.31.2016 09.30.2017
8,5029,616
8,810 8,678
09.30.2016 12.31.2016 06.30.2017 09.30.2017

20
0 2 C A P I T A L M A N A G E M E N T
Million euros
57 219
881 628 651 668
-199
-780 -636-1,142
-924
-1,45112M 2012 12M 2013 12M 2014 12M 2015 12M 2016 9M 2017
AFS portfolio Currency conversion differences
Growing equity base, underpinned by resilient earnings growth and market volatility management
CAGR 2012-16
+4.0%
YTD
-3.8%
YTD
-€526 mn +€17 mn
7,810 7,833
9,1538,574
9,1278,781
12M 2012 12M 2013 12M 2014 12M 2015 12M 2016 9M 2017
21
0 2 C A P I T A L M A N A G E M E N T
Million euros
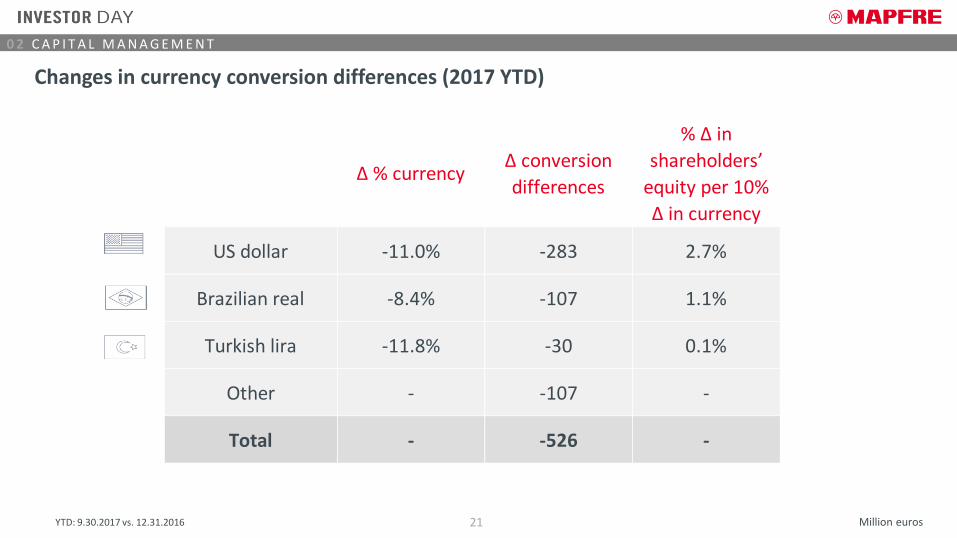
Changes in currency conversion differences (2017 YTD)
YTD: 9.30.2017 vs. 12.31.2016
∆ % currency ∆ conversion
differences
% ∆ in
shareholders’
equity per 10%
∆ in currency
US dollar -11.0% -283 2.7%
Brazilian real -8.4% -107 1.1%
Turkish lira -11.8% -30 0.1%
Other - -107 -
Total - -526 -
22
0 2 C A P I T A L M A N A G E M E N T
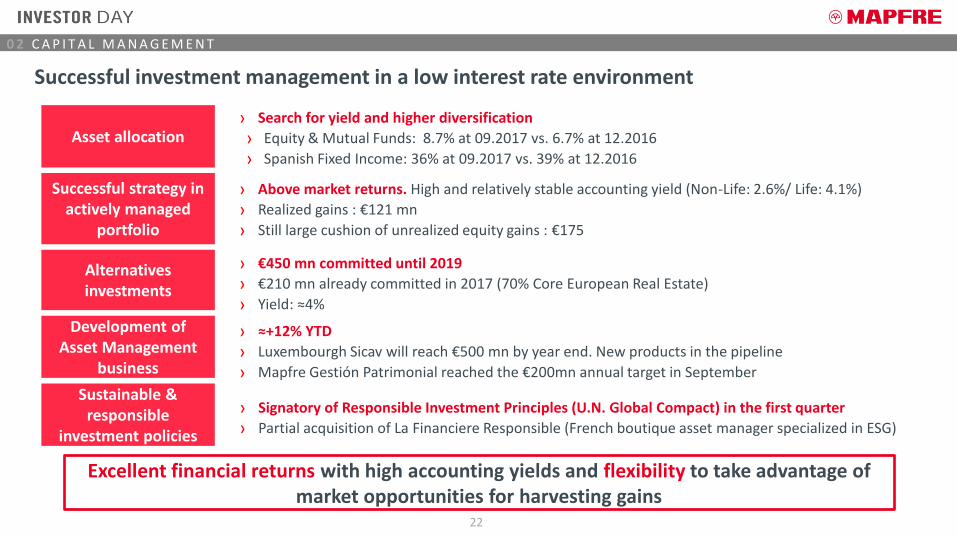
Successful investment management in a low interest rate environment
› Signatory of Responsible Investment Principles (U.N. Global Compact) in the first quarter
› Partial acquisition of La Financiere Responsible (French boutique asset manager specialized in ESG)
› Above market returns. High and relatively stable accounting yield (Non-Life: 2.6%/ Life: 4.1%)
› Realized gains : €121 mn
› Still large cushion of unrealized equity gains : €175
Alternatives investments
Successful strategy in actively managed
portfolio
› €450 mn committed until 2019
› €210 mn already committed in 2017 (70% Core European Real Estate)
› Yield: ≈4%
Excellent financial returns with high accounting yields and flexibility to take advantage of market opportunities for harvesting gains
Asset allocation
Sustainable & responsible
investment policies
› Search for yield and higher diversification
› Equity & Mutual Funds: 8.7% at 09.2017 vs. 6.7% at 12.2016
› Spanish Fixed Income: 36% at 09.2017 vs. 39% at 12.2016
Development of Asset Management
business
› ≈+12% YTD
› Luxembourgh Sicav will reach €500 mn by year end. New products in the pipeline
› Mapfre Gestión Patrimonial reached the €200mn annual target in September

23
0 2 C A P I T A L M A N A G E M E N T
Million euros
Active rotation of real estate portfolio throughout the cycle
Unrealized gains on real estate*
*Before tax, net of policyholder participation
› Spanish real estate crisis
› Writedowns: ≈€200 mn
› Purchase Plaza de Independencia (Madrid)
› Purchase price: €82 mn
› Purchase One Winthrop Square (Boston)
› Purchase price: €55 mn
› Sale of Luchana building (Madrid)
› Purchase price: €72 mn
› Net gain: €29 mn
Real estate writedowns › Partial sale of Torre MAPFRE (Barcelona)
› Purchase price: €175 mn
› Net gain: €88 mn
2015
2016
2017
2012 -
2013
Real Estate portfolio (Book Value at 09.30.2017): €2.2 bn
733
604 569
2015 2016 9M 2017
171.8
27.53.8 13.9 4.6 11.9
2012 2013 2014 2015 2016 9M 2017

24
0 2 C A P I T A L M A N A G E M E N T
2017
Forecast
SPAIN 427MAPFRE ESPAÑA 273MAPFRE VIDA 154
INTERNATIONAL 222of which:
Brazil 95MAPFRE RE 95
OTHER 10
TOTAL 754
› Dividends upstreamed from Operating Units to Holding Company must cover:
› MAPFRE S.A. dividend, holding expenses and capital needs of loss-making Units
› Operating Units must retain enough capital to finance their organic growth
› Debt can only be used to finance acquisitions
2017: Capital management and cash flow upstreaming in MAPFRE Group
MAPFRE S.A. - Net cash flows Dividends upstreamed from subsidiaries
2017
ForecastDividends paid to shareholders (2017 calendar year) -447
Interest and other payments at holding companies -124
Capital increases of loss making units -183
Dividends upstreamed from subsidiaries 754
Acquisitions (ABDA) -122
Increase in debt 122

25
0 2 C A P I T A L M A N A G E M E N T
Million euros
MAPFRE is working towards its commitment of stable and growing shareholder remuneration
339 400 431 400 447
2012 2013 2014 2015 2016
Dividends paid against results
Payout 50.9% 50.6% 51.0% 56.5% 57.6%
› Dividend payout target range (50-65%) is still in place, with flexibility to reach upper limit
› Dividend yield target on track (>5%)
› Final dividend against 2017 results to be announced in February 2018 and approved at AGM

03 REINSURANCE PROGRAM Eduardo Pérez de Lema
CAT risk management within MAPFRE Group Effective protection program

27
0 3 R E I N S U R A N C E P R O G R A M
› Update on MAPFRE RE
› OVERVIEW – CAT Risk Management Framework
1. Accumulation Control
2. CAT Modelling
3. Reinsurance Design
4. Credit & Liquidity Risk
5. Contingency Plan and Disaster Recovery

28
0 3 R E I N S U R A N C E P R O G R A M
Million euros
≈21%
2,885 3,254 3,343
3,732 4,235
3,180 3,300
2012 2013 2014 2015 2016 9M 2016 9M 2017
+3.8%
87 109
142 153 186
123 97
2012 2013 2014 2015 2016 9M 2016 9M 2017
≈+39%
Premiums
Attributable result
CAGR 2012-2016 ≈10%
CAGR 2012-2016
excluding catastrophes
-20.7%

29
0 3 R E I N S U R A N C E P R O G R A M
99.7 92.3 91.6
95.5 93.5 95.7
100.6 97.0 96.5 93.1 93.9 94.1 96.6
114.0
90.0 93.2 93.2
86.8
92.6
107.7
91.1 89.8 90.1 90.6
95.2
115.0
2005 2006 2007 2008 2009 2010 2011 2012 2013 2014 2015 2016 9M 2017
Combined Ratio - MAPFRE RE (%) Combined Ratio - Industry
MAPFRE RE continues achieving good underwriting results, with reduced volatility . . .
MAPFRE RE Industry
Average Combined Ratio (2005 - 9M 2017) 95.4% 96.1%
Standard Deviation Combined Ratio (2005 - 9M 2017) 2.7% 9.6%
(1)
(1) Source: AM Best, except 2017, MAPFRE RE estimate
30
0 3 R E I N S U R A N C E P R O G R A M
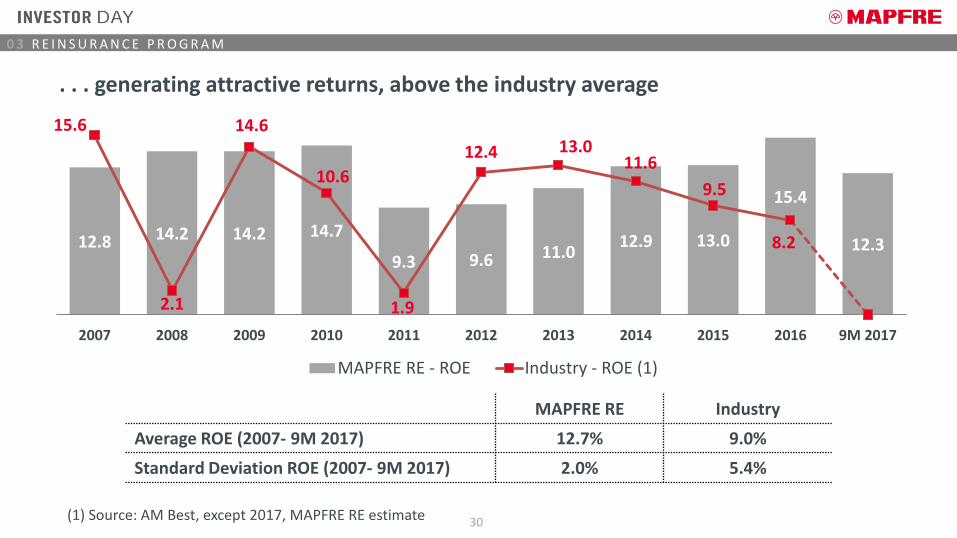
. . . generating attractive returns, above the industry average
12.8 14.2 14.2 14.7
9.3 9.6 11.0 12.9 13.0
15.4
12.3
15.6
2.1
14.6
10.6
1.9
12.4 13.0 11.6
9.5
8.2
2007 2008 2009 2010 2011 2012 2013 2014 2015 2016 9M 2017
MAPFRE RE - ROE Industry - ROE (1)
MAPFRE RE Industry
Average ROE (2007- 9M 2017) 12.7% 9.0%
Standard Deviation ROE (2007- 9M 2017) 2.0% 5.4%
(1) Source: AM Best, except 2017, MAPFRE RE estimate

31
0 3 R E I N S U R A N C E P R O G R A M
Million euros
Evolution of Shareholders’ Equity Dividends paid
848
969 1,010
1,179 1,174
1,279 1,312
2011 2012 2013 2014 2015 2016 2017(Sept.)
56.6
86.0 81.6 90.3 90.3
103.3
2012 2013 2014 2015 2016 2017
Average Pay Out: 61%
MAPFRE RE is a strong cash flow generator for MAPFRE and has been able to finance its growth

32
0 3 R E I N S U R A N C E P R O G R A M
› Update on MAPFRE RE
› OVERVIEW – CAT Risk Management Framework
1. Accumulation Control
2. CAT Modelling
3. Reinsurance Design
4. Credit & Liquidity Risk
5. Contingency Plan and Disaster Recovery

33
0 3 R E I N S U R A N C E P R O G R A M
› MAPFRE RE’s role in Cat Risk Management within the Group
› MAPFRE RE is a Professional Reinsurer
› Present in 20 countries
› Business in +100 countries
› Extensive experience in Cat Risk Management
› As MAPFRE’s reinsurance unit, it is 100% reinsurer of all Treaty reinsurance in the Group
› Defines Group’s reinsurance structures and retrocession programs
› Optimizes retentions for the Group
› Supervises reinsurance Credit risk policy for treaty & facultative
› Monitors and controls Cat Risk across the Group
MAPFRE’s CAT Risk Management Framework

34
0 3 R E I N S U R A N C E P R O G R A M
› MAPFRE RE’s reinsurance buying philosophy
› Separation between protections for the Non Group inwards portfolio in MAPFRE RE and MAPFRE Group Insurance business (MAPFRE Insurance and MGR)
› Long term partnership with reinsurers
› Preference for global support
› Design of sustainable structures and pricing
› No overriders for MAPFRE RE. Remuneration through risk underwriting
› Internal reinsurance at strict market prices. No subsidies. Price allocation is done internally
MAPFRE’s CAT Risk Management Framework

35
0 3 R E I N S U R A N C E P R O G R A M
› Cat XL Regional Protections
› Part of a comprehensive risk management and reinsurance framework
› Objective: to protect MAPFRE in an efficient way
› Structuring & placing global XL reinsurance programs
› Simplifying the Group’s XL reinsurance structures
› Territorial approach (regardless of the MAPFRE entity)
› Focusing on protecting Group’s balance sheet
MAPFRE’s Catastrophe Reinsurance Protection

36
0 3 R E I N S U R A N C E P R O G R A M
MAPFRE CAT Risk
Management Framework
1. Accumulation
Control
2. Catastrophe
Risk Modelling
3. Reinsurance Design
4. Credit and Liquidity
Risk
5. Contingency
Plan and Disaster Recovery
Cover for three different business units, with different characteristics:
MAPFRE Insurance
MAPFRE RE
MAPFRE Global Risks

37
0 3 R E I N S U R A N C E P R O G R A M
1. Accumulation Control
Legal Entity
› Detailed CAT Exposures are delivered by each MAPFRE entity upon the standard criteria set by MAPFRE RE:
› By policy & location
› High geocoding level
› Original currency
› Including insurance terms & limits per peril
› The exposure data is provided at policy & location level, including:
› TIVs. Indemnity Limits. Coinsurance. Deductibles
› Geocoding information: Lat/Long. – Postcode - City
› Primary modifiers:
› Year built
› Occupancy type
› Construction type
› Number of floors
Corporate Level (MAPFRE RE)
› The MAPFRE GROUP controls its exposures to natural catastrophes at different levels:
› This detailed data allows to run the exposures in CAT models and obtain internal PML estimations

38
0 3 R E I N S U R A N C E P R O G R A M
• Frequency & Severity distributions obtained for each portfolio (by legal entity, territory, peril & portfolio )
• ELTs: Event Loss tables
• YLTs: Year Loss tables
• PML Curves (when ELTs/YLTs not available)
• Correlations between territories are included
Cat Models:
Modelling of portfolios (vendor models)
• All modelled Cat loss distributions are imported into the DFA model (≈ 800 distributions)
• Local and Group reinsurance programs are simulated
• Inclusion reinsurance panels
• Cloud-based model in ReMetrica® (20k components + 250k simulations for each portfolio)
Dynamic Financial Analysis
(ReMetrica®)
• Probabilistic scenarios
• Exceedance Probability (EP) distribution per event (OEP) or in the aggregate (AEP)
• Tail Conditional Expectation (TCE) distributions (OEP-TCE & AEP-TCE)
• Pure Premium and Standard Deviation
• Deterministic scenarios
• Stress Testing
• Credit Risk Control
Outputs
› Coordinated by MAPFRE RE, Cat modelling of:
› Entities: 20
› Territories: 177
› Complete view of the Group’s Cat risk
2. Catastrophe Risk Modelling in MAPFRE GROUP

39
0 3 R E I N S U R A N C E P R O G R A M
› Probabilistic scenario outputs – Group’s capital requirement for CAT risk and reduction through reinsurance type (AEP 1/250 yrs)
› All MAPFRE primary insurance entities / All perils / All territories
100.0%
70.6%
40.9% 20.7%
29.4%
29.7%
20.2%
20.7%
GROSS Facultative Non CAT XLTreaties
MAPFRE Group XLProtection
NET
% o
f To
tal A
EP L
oss
2. Catastrophe Risk Modelling in MAPFRE GROUP
40
0 3 R E I N S U R A N C E P R O G R A M
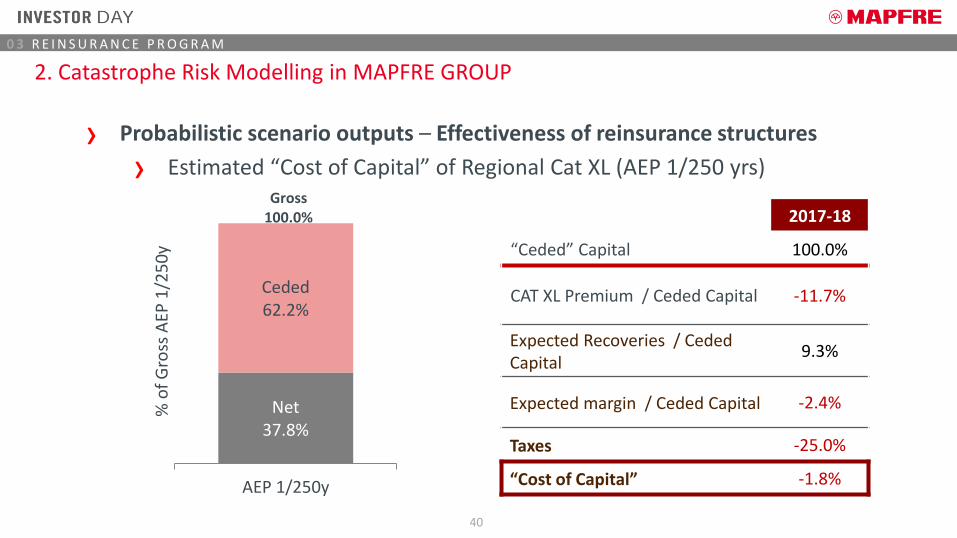
› Probabilistic scenario outputs – Effectiveness of reinsurance structures
› Estimated “Cost of Capital” of Regional Cat XL (AEP 1/250 yrs)
Net 37.8%
Ceded 62.2%
Gross 100.0%
AEP 1/250y
% o
f G
ross
AEP
1/2
50
y
2017-18
“Ceded” Capital 100.0%
CAT XL Premium / Ceded Capital -11.7%
Expected Recoveries / Ceded Capital
9.3%
Expected margin / Ceded Capital -2.4%
Taxes -25.0%
“Cost of Capital” -1.8%
2. Catastrophe Risk Modelling in MAPFRE GROUP

41
0 3 R E I N S U R A N C E P R O G R A M
› Deterministic scenario outputs
Event#1 Storm in Europe
DE, FR, UK, BE, NL, SE, NO, CH, DK, AT, IE, PL, LU, CZ, SK Return Period ≈ 90 yrs
Event#2 Earthquake in Chile
Mw 8.7 LOS VILOS. (Coquimbo) 225 km. N of Santiago
Return Period ≈ 250 yrs
Event#3 Hurricane in U.S.
Cat. 3 MA, RI, VA, NY, NC Return Period ≈ 120 yrs
2. Catastrophe Risk Modelling in MAPFRE GROUP
42
0 3 R E I N S U R A N C E P R O G R A M
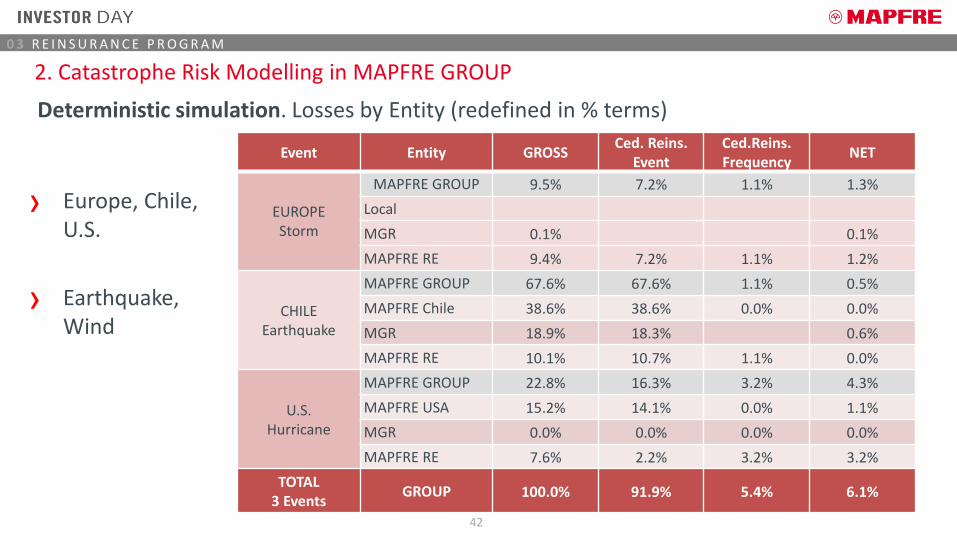
Deterministic simulation. Losses by Entity (redefined in % terms)
Event Entity GROSS Ced. Reins.
Event Ced.Reins. Frequency
NET
EUROPE Storm
MAPFRE GROUP 9.5% 7.2% 1.1% 1.3%
Local
MGR 0.1% 0.1%
MAPFRE RE 9.4% 7.2% 1.1% 1.2%
CHILE Earthquake
MAPFRE GROUP 67.6% 67.6% 1.1% 0.5%
MAPFRE Chile 38.6% 38.6% 0.0% 0.0%
MGR 18.9% 18.3% 0.6%
MAPFRE RE 10.1% 10.7% 1.1% 0.0%
U.S. Hurricane
MAPFRE GROUP 22.8% 16.3% 3.2% 4.3%
MAPFRE USA 15.2% 14.1% 0.0% 1.1%
MGR 0.0% 0.0% 0.0% 0.0%
MAPFRE RE 7.6% 2.2% 3.2% 3.2%
TOTAL 3 Events
GROUP 100.0% 91.9% 5.4% 6.1%
2. Catastrophe Risk Modelling in MAPFRE GROUP
› Europe, Chile, U.S.
› Earthquake, Wind

43
0 3 R E I N S U R A N C E P R O G R A M
› Group’s retentions protected under MAPFRE’s Cat XL (excludes MAPFRE RE “Non Group” business)
3. Reinsurance Design
Retention Retention
XL Limit XL Limit XL Limit
Proportional Tty Proportional Tty
Proportional Retrocession
Proportional Tty
Facultative Facultative
Facultative
MAPFRE Entity MAPFRE RE acceptance ProportionalRetrocession
Protected MAPFRE GroupRetention
Retention XL Limit Proportional Tty Facultative

44
0 3 R E I N S U R A N C E P R O G R A M
› Cat XL Regional Protections 2017-18
Determination of cover for North Atlantic Regional Cover (NARC) - OEP Losses
USA Mexico CentralAmerica
Puerto Rico Dom.Rep. Caribbean Total NARC
100 years Return Period 250 years Return Period Cat XL Limit
3. Reinsurance Design

45
0 3 R E I N S U R A N C E P R O G R A M
› Cat XL Regional Protections 2017-18
100 100 25
900 1,000
75
300 300
300
0
200
400
600
800
1,000
1,200
1,400
NARC MERC CIRC
Mill
ion
USD
UMBRELLA (WW) 300 xs Underlying
FREQUENCY COVER 75 xs 25 (AAD 75/ 1 Pre-paid Reinstatement)
3. Reinsurance Design

46
0 3 R E I N S U R A N C E P R O G R A M
Million euros
› Hurricane Maria. Gross Losses (MAPFRE Insurance entities only)
30 30
415 415
55
500 445
0
250
500
750
Gross Loss ProtectedRetention
MAPFRE PUERTO RICO
23 23
159 159
53
146
10
381
192
Gross Loss ProtectedRetention
MAPFRE GLOBAL RISKS
54
575
10
639
Protected Retention
LOSS TO MAPFRE GROUP XL
MAPFRE BHD (Dominican Rep.) Contribution to MAPFRE GROUP XL PROTECTION:
0.8
3. Reinsurance Design: Recent Catastrophic Events

47
0 3 R E I N S U R A N C E P R O G R A M
Million euros
› Hurricane Maria. Net Loss (MAPFRE Insurance entities + MAPFRE RE)
30
85 114
1 23
31
30
53
Puerto Rico Dom.Republic
MGR MAPFREInsurance
Entities
MAPFRE REGroup
MAPFREInsurance
Entities + RE
MAPFRE RENon Group
TotalMAPFRE
3. Reinsurance Design: Recent Catastrophic Events

48
0 3 R E I N S U R A N C E P R O G R A M
Million euros
› The initial Net Loss estimates released on Sept. 25th and detailed on the Q3 2017 Results Presentation still apply:
Figures in million EUR MAPFRE GLOBAL
MAPFRE RE PUERTO
RICO USA
(FLORIDA) MEXICO
DOMINICAN REPUBLIC
TOTAL
HURRICANE HARVEY 11.3 17.2 - - - - 28.5
HURRICANE IRMA 22.5 13.4 10.3 1.1 - - 47.3
HURRICANE MARIA 17.1 25.5 18.1 - - 0.2 60.9
MEXICO EARTHQUAKE (CHIAPAS) 7.5 2.9 - - 0.4 - 10.8
MEXICO EARTHQUAKE (PUEBLA) 14.6 13.7 - - 0.6 - 28.9
TOTAL 73.0 72.7 28.4 1.1 1.0 0.2 176.4
3. Reinsurance Design: Recent Catastrophic Events

49
0 3 R E I N S U R A N C E P R O G R A M
Million euros
› The initial Loss estimates released on the Q3 2017 Results Presentation still apply, but will be reviewed for the year-end closing:
Figures in million € Gross Loss Facultative
Cession Non CAT XL Treaty
CAT XL NET Frequency
Cover (1)
NET (Pretax
and non- controlling
Interest)
(Postax and non-
controlling Interest)
HURRICANE HARVEY 40 - - - 40 40 29
HURRICANE IRMA 94 -1 -25 - 68 68 47
HURRICANE MARIA 943 -146 -108 -574 114 -24 90 61
MEXICO EARTHQUAKE (CHIAPAS)
18 -2 -1 - 15 15 11
MEXICO EARTHQUAKE (PUEBLA) 58 -3 -15 - 40 40 29
TOTAL 1,153 -152 -150 -574 277 -24 253 176
3. Reinsurance Design: Recent Catastrophic Events
(1) The “Niño Costero” Loss contributes to triggering this cover

50
0 3 R E I N S U R A N C E P R O G R A M
› Hurricane Maria
› MAPFRE Puerto Rico’s conservative loss estimate, within our expectations and within Group’s protection. Very effective use of market intelligence and local knowledge to build a high quality portfolio
› MAPFRE GLOBAL RISKS business includes a high degree of facultative cessions and event limits, which prevent strong deviations
› MAPFRE RE’s impact is very moderate, due to certain underwriting decisions in the affected areas
3. Reinsurance Design: Recent Catastrophic Events

51
0 3 R E I N S U R A N C E P R O G R A M
› Credit risk by rating level. Estimated recoverable for 3rd Quarter Events
4. Credit & Liquidity Risk
Figures in million €
Facultative Cession
Non CAT XL Treaty
CAT XL Frequency
Cover Total
%/ Total
AA 13 2 23 0 38 4%
AA- 14 41 401 13.2 468 52%
A+ 42 76 95 10.56 223 25%
A 52 21 28 0 100 11%
A- 31 11 27 0.24 70 8%
TOTAL 152 150 574 24 900 100%

52
0 3 R E I N S U R A N C E P R O G R A M
› Corporate Business Continuity Plan
› Successfully deployed in all events & entities (Puerto Rico, Mexico, US)
› MAPFRE has been able to provide service to clients and community all the time
› Strengthening of wireless telecommunications & power generator infrastructures
› Call center support provided by adjacent countries
› Support to employees, families & communities in need
5. Contingency Plan and Disaster Recovery

53
0 3 R E I N S U R A N C E P R O G R A M
› The events occurred this year prove the effectiveness of our CAT Risk Management Model
› These events will have a limited impact to earnings. They will not be a capital event
› The Group’s Cat reinsurance structure has proved very effective for the protection of the MAPFRE entities
Key takeaways

Q&A

04 INTERNATIONAL BUSINESS & MAPFRE USA Jaime Tamayo Alfredo Castelo

04.1 INTERNATIONAL BUSINESS Jaime Tamayo
Restructuring of International operations Optimizing profitability

57
0 4 . 1 I N T E R N A T I O N A L B U S I N E S S
INDONESIA
PHILIPPINES
DIVERSITY
DEMOGRAPHIC
LINGUISTIC
CULTURAL
ECONOMIC DEVELOPMENT
DEGREE OF MARKET MATURITY
GEOGRAPHIC
EMEA APAC NORTH AMERICA
USA
PUERTO RICO
GERMANY
ITALY
MALTA
TURKEY
INTERNATIONAL BUSINESS: diverse markets

58
0 4 . 1 I N T E R N A T I O N A L B U S I N E S S
Million euros
1,977 -1% 1,717
+0%
260 -8%
501 -19%
259 +7%
352 +2%
278 +13%
33 -4%
1,390 -4%
56 + 63% 23
-2% 3,424
TOTAL PREMIUMS
INTERNATIONAL - 9M 2017

59
0 4 . 1 I N T E R N A T I O N A L B U S I N E S S
› Successful new branding of Verti Germany
› Business diversification into digital life insurance
› DL Italy’s restructuring is delivering tangible benefits (net result up by 71% vs 2016)
› Excellent results in Massachusetts (4.9% Premium growth/ 96.3% COR)
› Launch of VERTI USA in Pennsylvania
› Turkey’s result is up by 120% in local currency terms and almost 80% in euros vs. 2016
› Malta continues its sustained value-creation thanks to leadership in both Life and Non-life, strong partnership with Bank of Valletta and return to profitability in Non-Life
› 62.3% stake in ABDA after takeover
2017 key achievements

60
0 4 . 1 I N T E R N A T I O N A L B U S I N E S S
ABDA – 9M 2017
ABDA INDONESIA 2016 2017
Issued Premium 56.9 56.5
Income from Investments 6.2 6.5
Total Income 62.8 62.7
Operating Expenses Ratio 31.9% 35.4%
Net. Acq. Exp. Ratio 16.2% 14.8%
Net. Admin. Expenses Ratio 15.7% 20.6%
Loss Ratio 61.0% 58.7%
Net Combined Ratio 92.9% 94.1%
EBT 10.01 9.41
Earning after Taxes 9.00 8.70

61
0 4 . 1 I N T E R N A T I O N A L B U S I N E S S
INTERNATIONAL – Current organizational structure
*Members of the Executive Committee

62
0 4 . 1 I N T E R N A T I O N A L B U S I N E S S
MAPFRE USA is realigning and simplifying its operations IN A CHALLENGING
ENVIRONMENT
o US Market showing 10 years of lack of technical profitability in Private Auto: 2016 COR at 106%
o Fastest Growth in a decade of Miles Driven due to a much improved economy
o Dramatic increase in loss costs (2015-2017)
o Distracted Driving now a major element of concern
o Weather still playing a key role
o “Marihuana States” now a reality of concern.
Total Focus on Profitability outside Massachusetts
Reduced geographical footprint
More customer centric organization
Focus on Core Business and digital transformation
INTERNATIONAL – Restructuring of operations

63
0 4 . 1 I N T E R N A T I O N A L B U S I N E S S
Nikos Antimissaris
Nikos Antimissaris
Consolidation of EMEA and APAC Regions
Improve dimension adequacy
Increase capacity of resources and services
INTERNATIONAL – Restructuring of operations
64
0 4 . 1 I N T E R N A T I O N A L B U S I N E S S
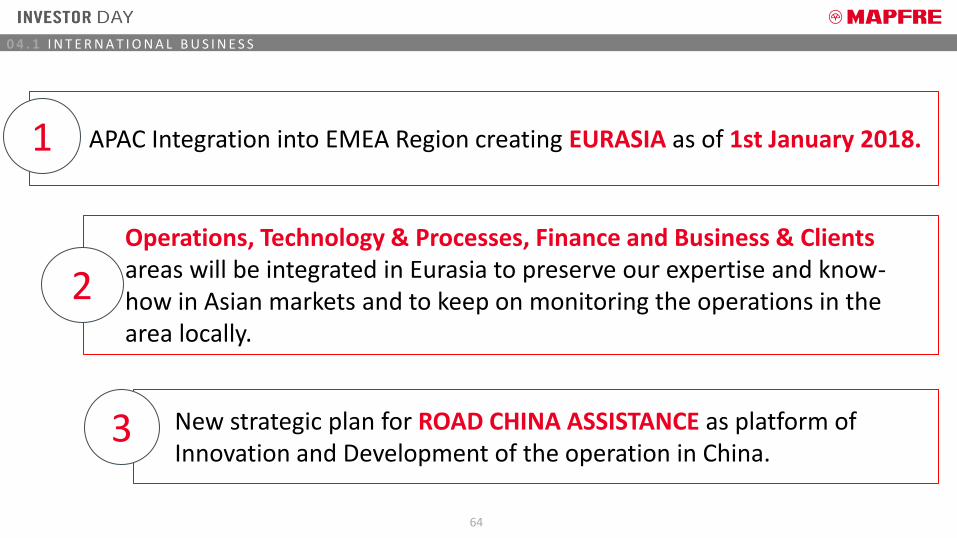
Operations, Technology & Processes, Finance and Business & Clients areas will be integrated in Eurasia to preserve our expertise and know-how in Asian markets and to keep on monitoring the operations in the area locally.
2
New strategic plan for ROAD CHINA ASSISTANCE as platform of Innovation and Development of the operation in China.
APAC Integration into EMEA Region creating EURASIA as of 1st January 2018. 1
3

65
0 4 . 1 I N T E R N A T I O N A L B U S I N E S S
Million euros
EURASIA €1,446 mn
9M 2017
TOTAL PREMIUMS
-2% 3,424
INTERNATIONAL - Premiums – 9M 2017
1,977 -1%
1,390 -4%
56 + 63%

66
0 4 . 1 I N T E R N A T I O N A L B U S I N E S S
Million euros
EMEA – Key financial highlights by country
9M 2016 9M 2017 Δ 9M 2016 9M 2017 Δ 9M 2016 9M 2017 Δ
Turkey 617 501 -18.8% 22 39 77.4% 97.8% 96.5% -1.2 p.p
Italy 345 352 2.1% -40 -11 -71.4% 128.6% 114.2% -14.4 p.p
Germany 241 259 7.5% 3 1 -67.2% 98.3% 99.0% 0.8 p.p
Malta 247 278 12.8% 1 3 214.9% 106.6% 96.5% -10.1 p.p
TOTAL 1,450 1,390 -4.1% -14 31 -324.3% 106.0% 100.7% -5.3 p.p
PREMIUMS ATTRIBUTABLE RESULT COMBINED RATIO

67
0 4 . 1 I N T E R N A T I O N A L B U S I N E S S
› MTPL regulation in Turkey has materially changed the rules of the game and the negative effects will become more evident in 2018
› Turkish lira will likely continue to be volatile in the short term
› DL Italy needs to finalize its turnaround and enter value-creation mode
› Verti Germany’s continued growth has to keep materializing in increasing ROEs
Some challenges still remain

68
0 4 . 1 I N T E R N A T I O N A L B U S I N E S S
9M 2017
TOTAL NON-LIFE 100.3%
Peer 1 90.7%
MAPFRE SIGORTA 96.5%
Peer 2 97.7%
Peer 3 111.2%
TOTAL MOTOR 102.5%
Peer 1 92.7%
MAPFRE SIGORTA 94.5%
Peer 2 97.5%
Peer 3 113.2%
TOTAL MOTOR-MTPL 107.2%
Peer 1 94.1%
MAPFRE SIGORTA 97.4%
Peer 2 98.5%
Peer 3 130.9%Figures in Turkish GAAP
› Continuous focus on technical profitability and average costs
› Client-oriented: channel diversification following the MAPFRE model
› Cross-selling into higher-profitable segments
› Sustained investment in technology, both client-facing and back-office
MAPFRE SIGORTA has adapted quickly to the new market context in Turkey and remains one of the most profitable companies in its “Top 4” peer group
TURKEY Net combined ratio

69
0 4 . 1 I N T E R N A T I O N A L B U S I N E S S
Million euros
› The direct channel has been restructured according to plan and now back in recovery mode
› 2018 rebranding will be a key milestone
› MAPFRE in Italy is a key partner of choice for key Automotive partners
› Focus on expense reduction is delivering tangible results
DIRECT LINE ITALY has almost completed its restructuring and now fully focused on building a profitable digital leader
ITALY
Key figures
9M 2016 9M 2017 Δ
PREMIUMS 345.3 352.4 2,1%
Direct 178.7 148.3 -17.0%
Partnerhsips 166.6 204.1 22.5%
COMBINED RATIO 128.6% 114.2% -14.4 P.P
Loss ratio 68.5% 74.4% 5.8 P.P
Acquisition costs 40.3% 24.5% -15.8 P.P
Administration costs 19.7% 15.3% -4.4 P.P
ATTRIBUTABLE RESULT -39.8 -11.4 -128.6%

70
0 4 . 1 I N T E R N A T I O N A L B U S I N E S S
Million euros
9M 2016 9M 2017 Δ
PREMIUMS 240.5 258.5 7.5%
Renewal ratio 90% 90%
COMBINED RATIO 98.3% 99.0% 0.8 P.P
ow hail&floods 4.1% 7.5%
ADJ. COMBINED RATIO 94.1% 91.5% -2.7 P.P
› The highly successful rebranding has confirmed the strength of our value proposition…
› … which has allowed strong growth in both policies and premiums…
› … while the focus on technical management has allowed VERTI Germany to withstand the worst hail season in years
VERTI GERMANY’S model has been put to test and shows remarkable strength
724,597775,311
9M 2016 9M 2017
+7%
GERMANY
Key figures
In force policies

71
0 4 . 1 I N T E R N A T I O N A L B U S I N E S S
Million euros
9M 2016 9M 2017 Δ
PREMIUMS 246.9 278.4 12.8%
Life 203.4 232.0 14.1%
Non-life 43.5 46.4 6.7%
COMBINED RATIO 106.6% 96.5% -10.1 P.P
Loss ratio 77.2% 69.4% -7.9 P.P
MANAGED ASSETS 1,672.2 1,862.5 11.4%
LIFE VIF 59.9 64.4 7.5%
› Pricing actions in motor have allowed a significant improvement in Non-Life profitability
› The multichannel strategy continues delivering strong growth in both Life and Non-life, further reinforcing our #1 market position:
MAPFRE MIDDLESEA’s decisive actions on the motor business and the successful partnership with Bank of Valletta continue driving sustained value-creation
> 77,4%
> 34%
Life market share
Non-Life market share
MALTA
Key figures

72
0 4 . 1 I N T E R N A T I O N A L B U S I N E S S
2017F 2018F
TURKEY 5.0% 3.5%
ITALY 1.5% 1.3%
GERMANY 2.1% 1.9%
MALTA 4.1% 3.5%
Source: MAPFRE Servicio de Estudios
In a nutshell: MAPFRE is invested in a region with good growth opportunities
Source: MAPFRE Economic Research
Real GDP growth forecasts

04.2 MAPFRE USA Alfredo Castelo
U.S. footprint Moving toward a streamlined geographic presence

74
0 4 . 2 M A P F R E U S A
› Exit five states
› Adaptation of regional structure (three regions, instead of four)
› Emphasis and focus on profitable North East region
Reduced geographical footprint
› Focus on core business (Auto and Homeowner)
› Commercial Lines (Auto & small business-BOP policies), focused on three states (MA, CA, and FL)
› Launch of Verti USA
› Digital transformation
› Creation of Business & Clients and Business Support Areas
› Appointment of CEO for North East region and empowering other regional leadership
MAPFRE USA is realigning and simplifying its operations with main focus on profitable growth
Focus on core business
More customer centric organization

75
0 4 . 2 M A P F R E U S A
› Higher frequency and severity in Auto
› Many weather related claims and wildfires
› Auto Q2 Combined Ratio 106%
› Rate filings, 36 in Auto and 17 in Homeowners in 2017
› Enhance pricing engine outside Massachusetts
› Strengthening of underwriting and claims guidelines
› Underwriting process automation to reduce “premium leakage”
› Agency Management, more than 300 agency contracts cancelled because of poor performance
› Improve new business quality by introducing comparative rater strategies, to minimize adverse selection
› Manage Loss Adjustment Expenses through automation and use of Preferred Repair Network
› Strengthening of the technical area with new appointments (Chief Actuarial and Chief Technical officers)
Market context
MAPFRE INSURANCE
MAPFRE is strengthening profitability initiatives in a challenging year for personal lines carriers

76
0 4 . 2 M A P F R E U S A
9M16 9M17 Delta
Premiums
1,273
1,336 4.9%
Technical income 46 39 -15.2% Financial Income 69 61 -11.6% Earning before Tax 115 100 -13.0%
Loss Ratio 71.6% 72.3% 0.7 pp Expense Ratio 23.8% 24.0% 0.2pp Combined Ratio 95.4% 96.3% 0.9 pp
› MAPFRE is the leading insurance company in Massachusetts in Non-Life with important market shares:
› Private Passenger Auto: 25.5% (#1)
› Homeowners: 13.5% (#1)
› Commercial auto: 13.3% (#1)
› Growth driven primarily by:
› Private Passenger Auto: 4.9%
› Commercial Auto: 11.4%
› Massachusetts is a mature and profitable state
› Distribution in traditional channels (independent agents and AAA)
Key figures – Massachusetts (mn USD)
Massachusetts: MAPFRE is the leading insurance company, with a mature and profitable business

77
0 4 . 2 M A P F R E U S A
› Fall in premiums (-8%), due to profitability initiatives:
› New Jersey: -34.1%
› New York: -17.3%,
› Connecticut: -9.8%
› California: -8.6%
› Ohio: -13.5%
› Arizona: -10.4%
› Improvements in Auto loss ratio in two large Core States
› California: -5.8 p.p.
› Connecticut: -3.0 p.p.
› Winter weather adversely impacted Pacific Northwest in Q1, resulting in 91% loss ratio. The Q2 and Q3 loss ratio improved to 75%
› Hurricane Irma: negatively impacted Florida
9M16 9M17 Delta
Premiums
564
519 -8.0%
Technical income -60 -59 -1.7% Financial Income 29 24 -17.2% Earning before Tax -31 -35 12.9%
Loss Ratio 89.8% 90.6% 0.8 pp Expense Ratio 24.2% 23.6% -0.6 pp Combined Ratio 114.0% 114.2% 0.2 pp
Key figures – Outside Mass. (mn USD)
Outside of Massachusetts: Focus on profitability initiatives

78
0 4 . 2 M A P F R E U S A
OR
MT
ID
WY
CA
NV UT
CO
AZ NM
TX
OK
KS
NE
SD
WA
ND MN
IA
MO
AR
WI
IL
MI
IN OH
PA
NY
KY
WV
TN
VA
NC
SC
MS AL GA
FL
ME VT
NH MA RI CT
LA
Core states
› New England › Massachusetts › Rhode Island › New Hampshire › Vermont › Maine
Development states
› Florida › Pennsylvania › Arizona
Exit states
› New York › New Jersey
NJ
MAPFRE USA’s new geographic footprint: focus on 11 core states
› Connecticut › California › Washington › Oregon › Ohio › Idaho
› Kentucky › Tennessee › Indiana

79
0 4 . 2 M A P F R E U S A
Core states: focus on eleven states, subject to profitable growth initiatives
9M17 9M17
DWP* Combined
Ratio
New England 1,397,199 96.4%
Massachusetts 1,335,579 96.3%
Connecticut 102,794 111.7%
California 98,224 112.4%
Washington 49,923 124.1%
Oregon 23,220 117.0%
Ohio 15,690 104.4%
Idaho 3,918 101.1%
Total Core States 1,690,968 99.5%
› Contribution to MAPFRE USA:
› ≈91% of premiums
› ≈135% of earnings before tax
Key figures – Core states (USD ‘000)
(*) Direct Written Premiums
› Core states selection rationale:
› Brand recognition in New England
› Scale in Massachusetts and Connecticut
› Effective multi-distribution strategy in California
› Distribution agreements with AAA in Massachusetts, Washington, Oregon, Ohio and Idaho

80
0 4 . 2 M A P F R E U S A
› Development states selection rationale:
› Florida and Arizona will be subject to further actions to reinforce underwriting, pricing and distribution foundations prior to future expansion plans
› Pennsylvania is a new state with an immature book of business
› Complementary distribution strategy between MAPFRE Insurance and VERTI
› Contribution to MAPFRE USA:
› ≈4% of premiums
› ≈-20% of earnings before tax
Key figures – Development states (USD ‘000)
9M17 9M17
DWP* Combined
Ratio
Florida 48,897 119.3% Pennsylvania 11,206 132.8% Arizona 10,720 129.4%
Total Development States 70,823 122.2%
Development states: subject to further profitability actions
(*) Direct Written Premiums

81
0 4 . 2 M A P F R E U S A
› Contribution to MAPFRE USA:
› ≈5% of premiums
› ≈-15% of earnings before tax
› New York and New Jersey:
› Highly Regulated (NY)
› Very litigious with high Personal Injury Protection Fraud
› Lack of scale to be competitive
› High Loss Adjustment Expense ratio
› Indiana/Kentucky/Tennessee:
› Lack of automation
› Lack of scale to be competitive
Key figures – Exit states (USD ‘000)
9M17 9M17
DWP* Combined Ratio
New York 43,364 114.8%
New Jersey 33,285 123.6%
Tennessee 11,298 106.9%
Kentucky 3,153 96.3%
Indiana 1,999 142.5%
Total Exit States 93,099 117.0%
Exit states: decision to focus on core states
(*) Direct Written Premiums

82
0 4 . 2 M A P F R E U S A
› New York: MAPFRE has already engaged the services of an investment bank to pursue the sale of its New York subsidiary, MAPFRE Insurance Company of New York
› New Jersey, Kentucky, Tennessee and Indiana: The Company is taking all steps necessary to produce an orderly withdrawal for the other four states, including the pursuit of replacement carriers transactions where viable
› MAPFRE is committed to its customers and agents and will continue to operate in these states with the same high level of customer service
› Regulatory compliance will determine the time require to complete the exit
Exit states: orderly withdrawal with commitment to our customers and agents

83
0 4 . 2 M A P F R E U S A
› More streamlined structure (reduction from 4 to 3 regions)
› New operational structure with its new core state footprint, brings decision making process closer to the states of operation, both from a technical and business development standpoint
› Provides additional empowerment and accountability to regional leadership (underwriting, claims, operations, etc.)
Northeast region
- Massachusetts (*) - Maine - New Hampshire - Rhode Island - Vermont
East Central region
- Connecticut - Florida (*) - Ohio (*) - Pennsylvania
(*) Physical operations
Western region
- Arizona (*) - California (*) - Idaho - Oregon - Washington (*)
New regional structure aligned with business strategy

84
0 4 . 2 M A P F R E U S A
› Soft launch in October, offering Auto Insurance to digital customers in Pennsylvania
› Truly direct to consumer digital insurance operation with state of the art IT platform
VERTI USA
› MAPFRE Insurance will leverage the learnings from VERTI in its digital transformation process
› Digital Transformation will focus on customer engagement and operational digitalization
› Deployed center of competence for Intelligent Automation processing
› Deployed center of excellence for predictive analytics with the implementation of marketing, underwriting and claims models
MAPFRE INSURANCE
Digital transformation: strategic pillar at MAPFRE USA

85
0 4 . 2 M A P F R E U S A
› Strategic realignment and focus on core markets:
› Reinforced market position in Massachusetts/New England
› Profitable growth strategy outside of Massachusetts
› More customer centric organization with regional empowerment and accountability
› Digital transformation to meet changing customer expectations and operational efficiencies
Key messages

86
0 4 . 2 M A P F R E U S A
Positioning MAPFRE USA for success through a focused business strategy
› MAPFRE INSURANCE 2020 targets*:
› Average growth: ≈4%
› Combined ratio: ≈97%
› ROE: ≈8%
Key messages
(*) MAPFRE INSURANCE does not include Verti

Q&A

05 CLOSING REMARKS Antonio Huertas
Profitable growth strategy Accelerating our transformation
89
0 5 C L O S I N G R E M A R K S
On the right path to achieve our targets
› Positive underlying trends and strategic plan on track
› Value creation through capital management
› Effective Cat protection program
› Restructuring in International units, focusing on US footprint

90
0 5 C L O S I N G R E M A R K S
› Changes in the essence of the insurance model
› Empowerment of the connected client
› Human element
Prepared for the digital transformation to come

91
0 5 C L O S I N G R E M A R K S
Agent challenge
Technology and digital service
as allies Client focus
Multi-channel approach
Reinforced internal structure
(local, regional, corporate)
Secure information, systems and
professional teams to achieve excellence
More self-governance
and control
Profitable growth levers

92
0 5 C L O S I N G R E M A R K S
SAM 3.0 NEW AUTO INSURANCE PREDICTIVE MODELS BIG CITIES
Different & simple mobility insurance solutions
Automatization of simple insurance
processes
Taylor made products & services for the urban client
New strategic initiatives
DIGITAL HEALTH DIGITAL CHALLENGE ALL ONGOING
Simple & low-cost digital health insurance
The first phase of these initiatives should be
finalized in 2019
Cultural and organizational transformation

93
0 5 C L O S I N G R E M A R K S
Conclusions
We are sustaining revenue growth
Enhanced efficiency, automation and cost reduction
Financial returns
MAPFRE’s business model and strategy will ensure recurring profitable growth in the coming years

Thank you