Estimation of Aquifer Secondary Hydraulic Parameter ...
14
www.ccsenet.org/apr Applied Physics Research Vol. 3, No. 2; November 2011 Published by Canadian Center of Science and Education 67 Estimation of Aquifer Secondary Hydraulic Parameter Distributions from Surficial Geophysical Measurements of Primary Parameters: a Case Study of Ngor-Okpala Area of Imo State, Nigeria Victor Ifeanyi Obianwu (Corresponding Author) University of Calabar, Calabar, Nigeria P. M. B. 1115, 540242, Calabar Tel: 234-803-347-3805 E-mail: [email protected] Innocent Chibuzo Chimezie University of Calabar, Calabar, Nigeria Tel: 234-806-949-4912 E-mail: [email protected] Anthony Effiong Akpan University of Calabar, Calabar, Nigeria Tel: 234-803-089-4698 E-mail: [email protected] Nyakno Jimmy George University of Calabar, Calabar, Nigeria Tel: 234-802-408-7839 E-mail: [email protected] Received: July 19, 2011 Accepted: August 15, 2011 Published: November 1, 2011 doi:10.5539/apr.v3n2p67 URL: http://dx.doi.org/10.5539/apr.v3n2p67 The research is financed by Asian Development Bank. No. 2006-A171 (sponsoring information) Abstract Estimation of aquifer secondary hydraulic parameter distributions from surficial Geophysical measurement of primary parameters at Ngor–Okpala local government area of Imo State was carried out. The parameters estimated are practically significant in groundwater management. With the help of average permeability value for fine to coarse sandy formations, transmissivity and Kσ-values were obtained in addition to the Dar-zarouk parameters. The primary data which were validated by constraining the field data with the data obtained from logged borehole were converted to maps along with the estimated secondary parameters. Their distributions are diagnostic of significant information needed in groundwater assessment. The maps can also be used to improve the quality of model in the area. Keywords: Aquifer, Hydraulic parameters, VES, Ngor–Okpala 1. Introduction The hydraulic characteristics of subsurface aquifers are important properties for both groundwater and contaminated land assessments and also for safe construction of civil engineering structures (Pantelis et al., 2007). In addition, the effective management of groundwater in any geologic setting is cost-effective when the secondary parameters such as transverse resistance, longitudinal conductance, hydraulic conductivity or permeability and transmissivity are known in addition to the primary properties which are the usual electrical resistivity or its inverse which is conductivity and the thickness and depth of the aquifers (deLima and Niwas, 2000).
Transcript of Estimation of Aquifer Secondary Hydraulic Parameter ...

www.ccsenet.org/apr Applied Physics Research Vol. 3, No. 2; November 2011
Published by Canadian Center of Science and Education 67
Estimation of Aquifer Secondary Hydraulic Parameter Distributions from Surficial Geophysical Measurements of Primary Parameters: a
Case Study of Ngor-Okpala Area of Imo State, Nigeria
Victor Ifeanyi Obianwu (Corresponding Author)
University of Calabar, Calabar, Nigeria
P. M. B. 1115, 540242, Calabar
Tel: 234-803-347-3805 E-mail: [email protected]
Innocent Chibuzo Chimezie
University of Calabar, Calabar, Nigeria
Tel: 234-806-949-4912 E-mail: [email protected]
Anthony Effiong Akpan
University of Calabar, Calabar, Nigeria
Tel: 234-803-089-4698 E-mail: [email protected]
Nyakno Jimmy George
University of Calabar, Calabar, Nigeria
Tel: 234-802-408-7839 E-mail: [email protected]
Received: July 19, 2011 Accepted: August 15, 2011 Published: November 1, 2011
doi:10.5539/apr.v3n2p67 URL: http://dx.doi.org/10.5539/apr.v3n2p67
The research is financed by Asian Development Bank. No. 2006-A171 (sponsoring information)
Abstract
Estimation of aquifer secondary hydraulic parameter distributions from surficial Geophysical measurement of primary parameters at Ngor–Okpala local government area of Imo State was carried out. The parameters estimated are practically significant in groundwater management. With the help of average permeability value for fine to coarse sandy formations, transmissivity and Kσ-values were obtained in addition to the Dar-zarouk parameters. The primary data which were validated by constraining the field data with the data obtained from logged borehole were converted to maps along with the estimated secondary parameters. Their distributions are diagnostic of significant information needed in groundwater assessment. The maps can also be used to improve the quality of model in the area.
Keywords: Aquifer, Hydraulic parameters, VES, Ngor–Okpala
1. Introduction
The hydraulic characteristics of subsurface aquifers are important properties for both groundwater and contaminated land assessments and also for safe construction of civil engineering structures (Pantelis et al., 2007). In addition, the effective management of groundwater in any geologic setting is cost-effective when the secondary parameters such as transverse resistance, longitudinal conductance, hydraulic conductivity or permeability and transmissivity are known in addition to the primary properties which are the usual electrical resistivity or its inverse which is conductivity and the thickness and depth of the aquifers (deLima and Niwas, 2000).
www.ccsenet.org/apr Applied Physics Research Vol. 3, No. 2; November 2011
ISSN 1916-9639 E-ISSN 1916-9647 68
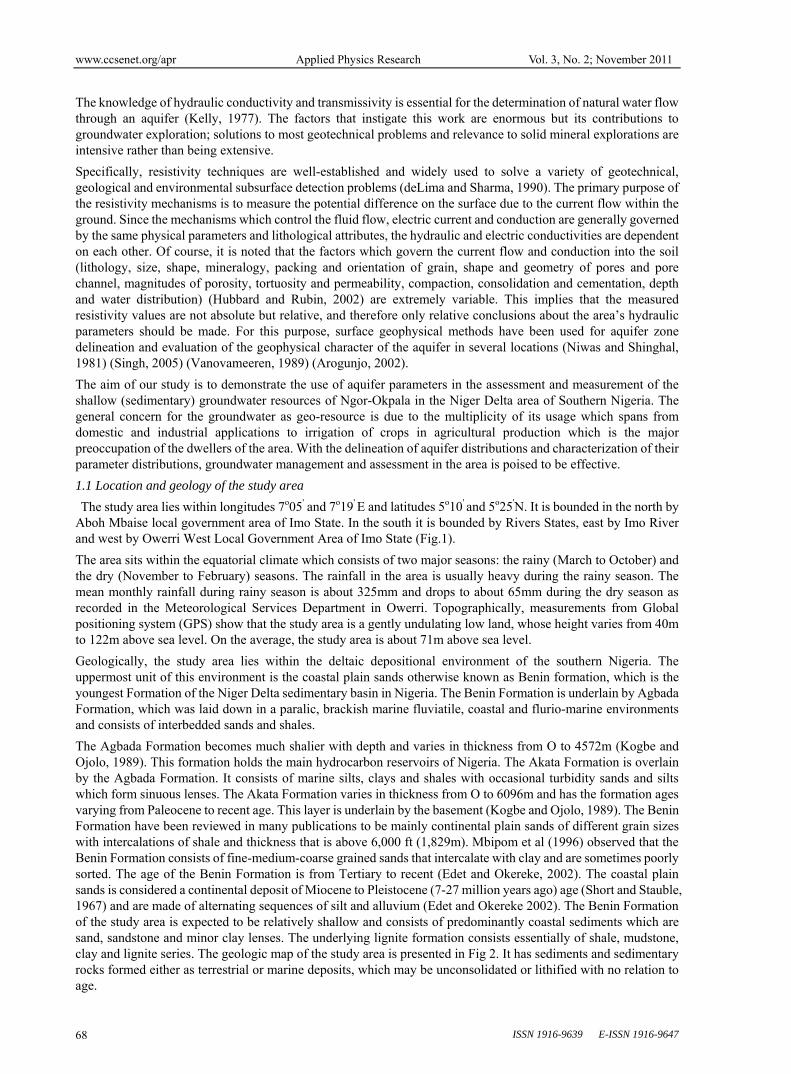
The knowledge of hydraulic conductivity and transmissivity is essential for the determination of natural water flow through an aquifer (Kelly, 1977). The factors that instigate this work are enormous but its contributions to groundwater exploration; solutions to most geotechnical problems and relevance to solid mineral explorations are intensive rather than being extensive.
Specifically, resistivity techniques are well-established and widely used to solve a variety of geotechnical, geological and environmental subsurface detection problems (deLima and Sharma, 1990). The primary purpose of the resistivity mechanisms is to measure the potential difference on the surface due to the current flow within the ground. Since the mechanisms which control the fluid flow, electric current and conduction are generally governed by the same physical parameters and lithological attributes, the hydraulic and electric conductivities are dependent on each other. Of course, it is noted that the factors which govern the current flow and conduction into the soil (lithology, size, shape, mineralogy, packing and orientation of grain, shape and geometry of pores and pore channel, magnitudes of porosity, tortuosity and permeability, compaction, consolidation and cementation, depth and water distribution) (Hubbard and Rubin, 2002) are extremely variable. This implies that the measured resistivity values are not absolute but relative, and therefore only relative conclusions about the area’s hydraulic parameters should be made. For this purpose, surface geophysical methods have been used for aquifer zone delineation and evaluation of the geophysical character of the aquifer in several locations (Niwas and Shinghal, 1981) (Singh, 2005) (Vanovameeren, 1989) (Arogunjo, 2002).
The aim of our study is to demonstrate the use of aquifer parameters in the assessment and measurement of the shallow (sedimentary) groundwater resources of Ngor-Okpala in the Niger Delta area of Southern Nigeria. The general concern for the groundwater as geo-resource is due to the multiplicity of its usage which spans from domestic and industrial applications to irrigation of crops in agricultural production which is the major preoccupation of the dwellers of the area. With the delineation of aquifer distributions and characterization of their parameter distributions, groundwater management and assessment in the area is poised to be effective.
1.1 Location and geology of the study area
The study area lies within longitudes 7o05' and 7o19' E and latitudes 5o10' and 5o25'N. It is bounded in the north by Aboh Mbaise local government area of Imo State. In the south it is bounded by Rivers States, east by Imo River and west by Owerri West Local Government Area of Imo State (Fig.1).
The area sits within the equatorial climate which consists of two major seasons: the rainy (March to October) and the dry (November to February) seasons. The rainfall in the area is usually heavy during the rainy season. The mean monthly rainfall during rainy season is about 325mm and drops to about 65mm during the dry season as recorded in the Meteorological Services Department in Owerri. Topographically, measurements from Global positioning system (GPS) show that the study area is a gently undulating low land, whose height varies from 40m to 122m above sea level. On the average, the study area is about 71m above sea level.
Geologically, the study area lies within the deltaic depositional environment of the southern Nigeria. The uppermost unit of this environment is the coastal plain sands otherwise known as Benin formation, which is the youngest Formation of the Niger Delta sedimentary basin in Nigeria. The Benin Formation is underlain by Agbada Formation, which was laid down in a paralic, brackish marine fluviatile, coastal and flurio-marine environments and consists of interbedded sands and shales.
The Agbada Formation becomes much shalier with depth and varies in thickness from O to 4572m (Kogbe and Ojolo, 1989). This formation holds the main hydrocarbon reservoirs of Nigeria. The Akata Formation is overlain by the Agbada Formation. It consists of marine silts, clays and shales with occasional turbidity sands and silts which form sinuous lenses. The Akata Formation varies in thickness from O to 6096m and has the formation ages varying from Paleocene to recent age. This layer is underlain by the basement (Kogbe and Ojolo, 1989). The Benin Formation have been reviewed in many publications to be mainly continental plain sands of different grain sizes with intercalations of shale and thickness that is above 6,000 ft (1,829m). Mbipom et al (1996) observed that the Benin Formation consists of fine-medium-coarse grained sands that intercalate with clay and are sometimes poorly sorted. The age of the Benin Formation is from Tertiary to recent (Edet and Okereke, 2002). The coastal plain sands is considered a continental deposit of Miocene to Pleistocene (7-27 million years ago) age (Short and Stauble, 1967) and are made of alternating sequences of silt and alluvium (Edet and Okereke 2002). The Benin Formation of the study area is expected to be relatively shallow and consists of predominantly coastal sediments which are sand, sandstone and minor clay lenses. The underlying lignite formation consists essentially of shale, mudstone, clay and lignite series. The geologic map of the study area is presented in Fig 2. It has sediments and sedimentary rocks formed either as terrestrial or marine deposits, which may be unconsolidated or lithified with no relation to age.
www.ccsenet.org/apr Applied Physics Research Vol. 3, No. 2; November 2011
Published by Canadian Center of Science and Education 69
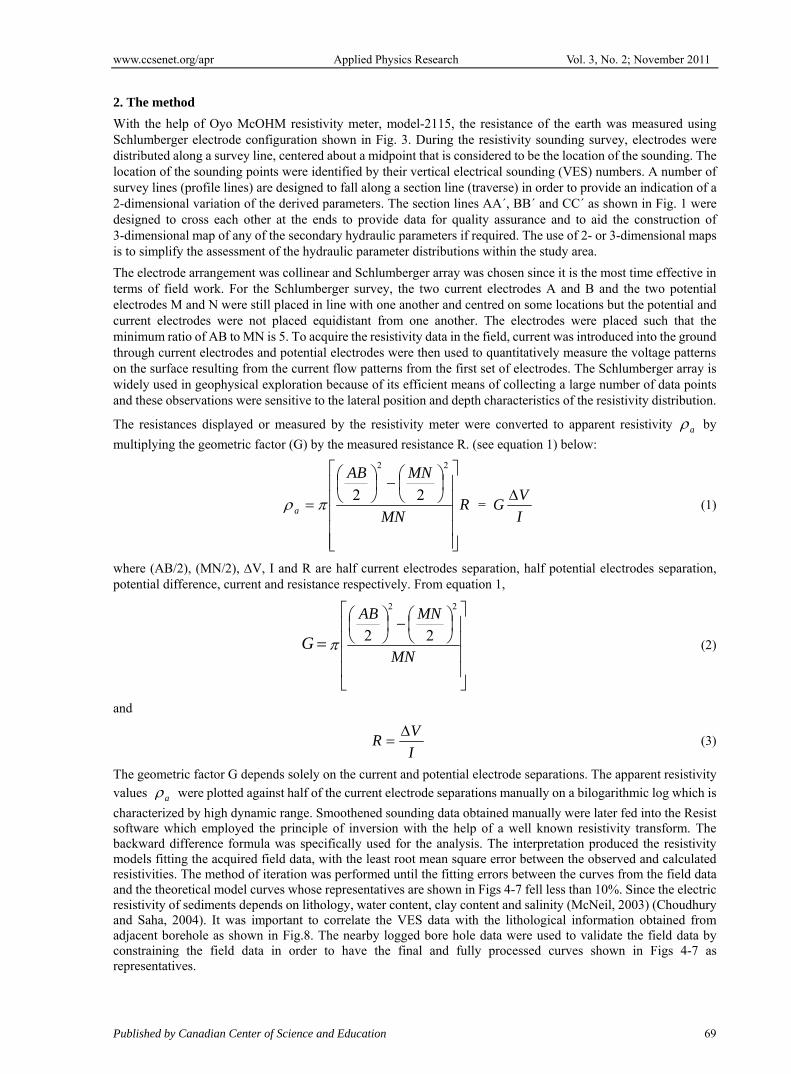
2. The method
With the help of Oyo McOHM resistivity meter, model-2115, the resistance of the earth was measured using Schlumberger electrode configuration shown in Fig. 3. During the resistivity sounding survey, electrodes were distributed along a survey line, centered about a midpoint that is considered to be the location of the sounding. The location of the sounding points were identified by their vertical electrical sounding (VES) numbers. A number of survey lines (profile lines) are designed to fall along a section line (traverse) in order to provide an indication of a 2-dimensional variation of the derived parameters. The section lines AA´, BB´ and CC´ as shown in Fig. 1 were designed to cross each other at the ends to provide data for quality assurance and to aid the construction of 3-dimensional map of any of the secondary hydraulic parameters if required. The use of 2- or 3-dimensional maps is to simplify the assessment of the hydraulic parameter distributions within the study area.
The electrode arrangement was collinear and Schlumberger array was chosen since it is the most time effective in terms of field work. For the Schlumberger survey, the two current electrodes A and B and the two potential electrodes M and N were still placed in line with one another and centred on some locations but the potential and current electrodes were not placed equidistant from one another. The electrodes were placed such that the minimum ratio of AB to MN is 5. To acquire the resistivity data in the field, current was introduced into the ground through current electrodes and potential electrodes were then used to quantitatively measure the voltage patterns on the surface resulting from the current flow patterns from the first set of electrodes. The Schlumberger array is widely used in geophysical exploration because of its efficient means of collecting a large number of data points and these observations were sensitive to the lateral position and depth characteristics of the resistivity distribution.
The resistances displayed or measured by the resistivity meter were converted to apparent resistivity a by
multiplying the geometric factor (G) by the measured resistance R. (see equation 1) below:
RMN
MNAB
a
22
22 = I
VG
(1)
where (AB/2), (MN/2), V, I and R are half current electrodes separation, half potential electrodes separation, potential difference, current and resistance respectively. From equation 1,
G
MN
MNAB22
22 (2)
and
I
VR
(3)
The geometric factor G depends solely on the current and potential electrode separations. The apparent resistivity
values a were plotted against half of the current electrode separations manually on a bilogarithmic log which is
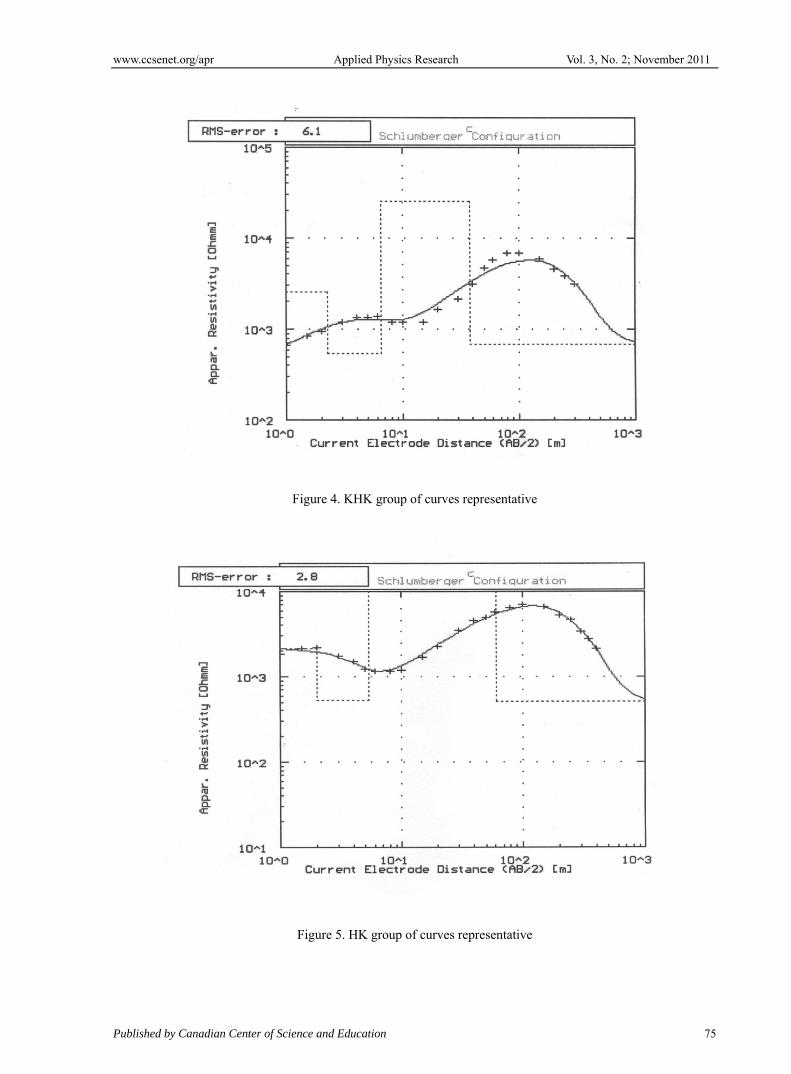
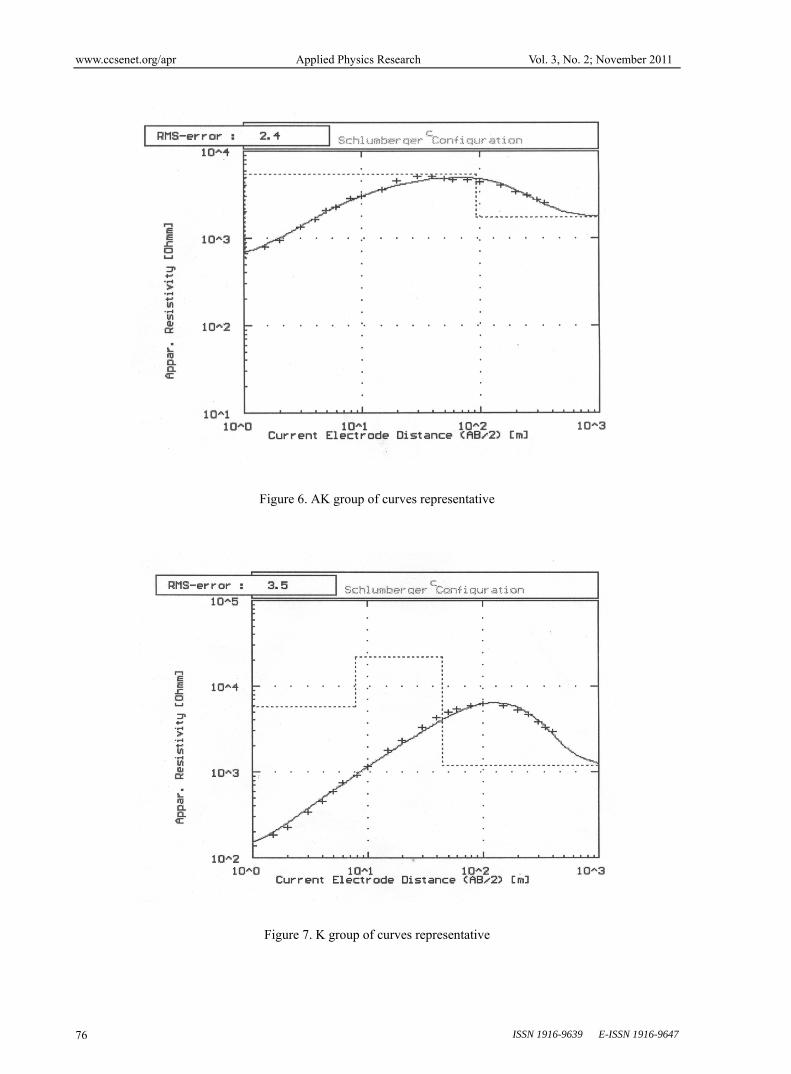
characterized by high dynamic range. Smoothened sounding data obtained manually were later fed into the Resist software which employed the principle of inversion with the help of a well known resistivity transform. The backward difference formula was specifically used for the analysis. The interpretation produced the resistivity models fitting the acquired field data, with the least root mean square error between the observed and calculated resistivities. The method of iteration was performed until the fitting errors between the curves from the field data and the theoretical model curves whose representatives are shown in Figs 4-7 fell less than 10%. Since the electric resistivity of sediments depends on lithology, water content, clay content and salinity (McNeil, 2003) (Choudhury and Saha, 2004). It was important to correlate the VES data with the lithological information obtained from adjacent borehole as shown in Fig.8. The nearby logged bore hole data were used to validate the field data by constraining the field data in order to have the final and fully processed curves shown in Figs 4-7 as representatives.

www.ccsenet.org/apr Applied Physics Research Vol. 3, No. 2; November 2011
ISSN 1916-9639 E-ISSN 1916-9647 70
The resistivities and thicknesses which serve as primary parameters were used to calculate Dar-zarouk parameters (transverse resistance and longitudinal conductance). In conjunction with the average value of 8.64m/day hydraulic conductivity of sands given by Mbonu et al (1991); Niwas and deLima (2003), the transmissivity and the K values were all estimated and used in producing maps that show the distributions of the various hydraulic
parameters in the area.
3. Results and interpretations
The aquifer parameters in Ngor-Okpala have been studied in terms of thicknesses and resistivities. The information realized has been used to deduce the Dar-zarouk parameters (transverse resistance and longitudinal conductance). Average hydraulic conductivity of 8.64m/day for sandy aquifer has been used to estimate the transmissivity and the product of permeability and conductivity values in the area. From the estimated parameters (thickness, resistivity, transverse resistance, transverse conductance, Kσ-values and transmissivity) of aquifers, which are all sandy, aquifer parameter maps have been drawn using a software to show the lateral and vertical distributions of the estimated primary and secondary parameters. The high and low values of some of these parameters in some locations of the study area have some hydraulic significance which is explained below:
3.1 Hydraulic significance of aquifer parameters
3.1.1 Aquifer resistivity
Since the identified aquifers are averagely medium grained sands, their resistivities are moderately high. The aquifer iso-resistivity map shown in Fig.9 shows the distribution in the area under study. The higher values are generally found in the western parts of the area. In the eastern parts, some high values are also noticed but not as many as in the western parts. Some lower values are found in between the western and eastern parts of the area. This is an indication that in the areas where higher values are found, there are aquifer geomaterials that are predominantly gravels interlaced with fine sand while the area with lower resistivity values have pure fine sand intercalated with argillaceous materials. The fine and the gravelly sands can be exploited for building materials since the area is maximally characterized with these geomaterials.
3.1.2 Aquifer thickness
The viability of an aquifer is dependent on the thickness. Highly thick aquifer gives rise to prolific aquifers. Through aquifer isopach map in Figs 10 and 11, the distribution of aquifer in the study area has been found to highly concentrate at the western zone of the study area. At the eastern zone, averagely thick aquifers whose thicknesses are in excess of 60m have been identified. In between the east and the western zone, aquifers with thickness in excess of 30 to 45m have been earmarked as shown in Figs 10 and 11. This distribution of aquifer thickness shown in Figs 10 and 11 explains why groundwater would be obtained when a borehole is drilled to cut these aquifer geomaterials from a depth of 40m and above.
3.1.3 Dar-zarouk parameters
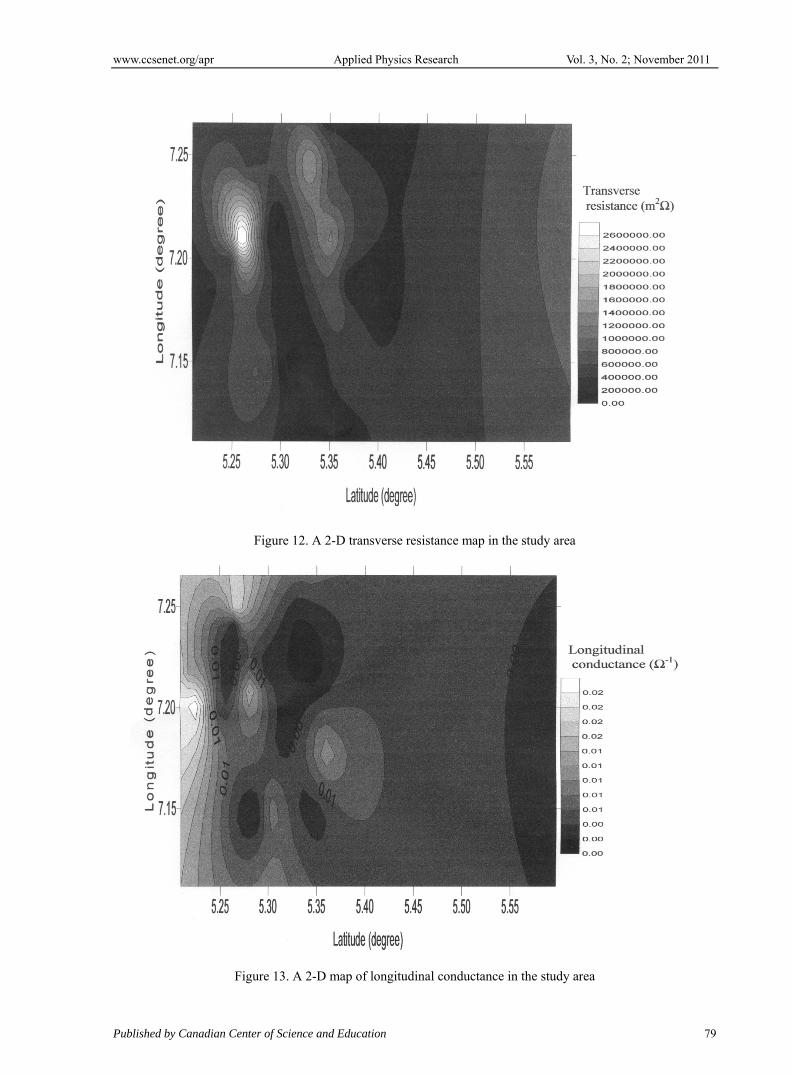
The transverse resistance and longitudinal conductance which constitute the Dar-zarouk parameters have been estimated from the primary parameters. Maps connoting their distribution in the area have been drawn in Figs 12 and 13 for transverse resistance and longitudinal conductance respectively. For transverse resistance, the values are extremely high, mostly at the western part of the survey area. This extremely high values of transverse resistance is due to the proportional values of resistivities and thicknesses which are proportional to transverse resistance on the map (Fig.12). High values are marked with white patches while dark colouration indicates lower value of transverse resistance. This actually shows the transverse arrangements of the aquifer geomaterials in the study area. The distribution of transverse resistance also follows the pattern in which resistivities and thicknesses are distributed.
Longitudinal conductance which is the ratio of thickness to resistivity in per Ohm also seems to have its high values concentrated at the western zone while the lowest values are concentrated at the eastern parts and some strategic places nearer to the west (Fig.13). These lower values are diagnostic of places with high values of resistivities, whose thicknesses are relatively small. The longitudinal conductance emphasizes on the longitudinal distributions of the aquifer geomaterials within the area under examination. Provided the parameters remain constant, the Dar-zarouk parameters are diagnostic of the transmissivity of the area which depends solely on thickness of the Aquifers.
3.1.4 Transmissivity
This is the product of permeability (K) and the aquifer thickness (h). High values indicate the viability of the aquifer and its safety, as water from such zones are expected to be produced from aquifers that are not brackish.

www.ccsenet.org/apr Applied Physics Research Vol. 3, No. 2; November 2011
Published by Canadian Center of Science and Education 71
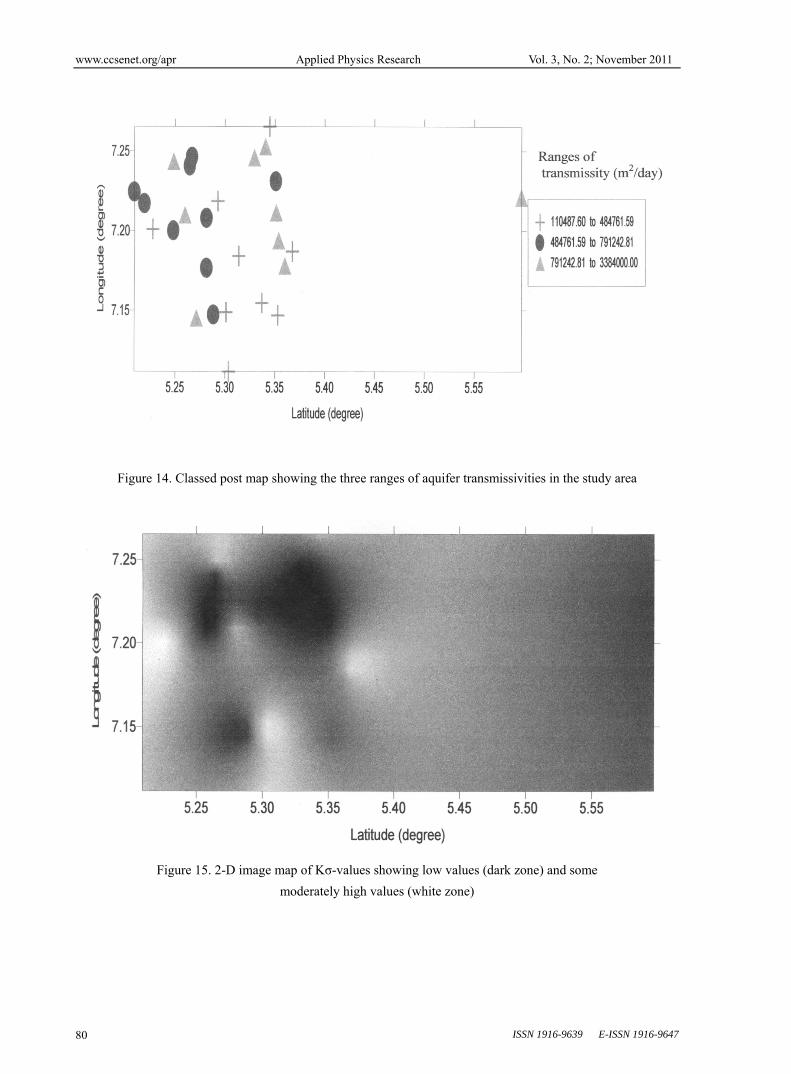
The area has averagely high transmissivity which guarantees the safety of the underground water in the area. Fig.14 indicates a classed post map showing the distributions of the three ranges of values of transmissivity in the area. The three categories of formations also concentrate at the western parts of the study area. On the average, the study area has transmissivity values ranging from 110,187.60 – 181,761.59m2/day followed by 181,761.59 – 791,212.81m2/day and 791,212.81 – 3,384,000.00m2/day in an increasing order. The values obtained here were made possible by using an average value of permeability of 8.64m/day estimated for sandy aquifer by Mbonu and Saha (2004).
3.1.5 Kσ-Values
The area has been delineated using the product of permeability, K and electrical conductivity, σ, to have shown low values. The image maps in Fig.15 indicates that some sections of the area show lower values which are indicated by the dark zones. Patches of white colouration indicate the areas where resistivities were some what low and as such the kσ-values are higher. However, the entire area shows generally low values on the average and this shows that the area has high prolific and good quality water that is devoid of salt. The 2-D image map actually connotes the subsurface distribution of Kσ-values which is a true reflection of the values estimated, which are infinitesimally small or insignificant in the area on the average.
4. Conclusion
The fundamental principle of the application of the geoelectrical methods in hydrogeology and solid mineral exploration is the utilization of the dependence of the resistivity on the subsurface lithology and the mineralization of the water filling the pores. This notion has been used as the basic principle governing the impressed current that interacts with the subsurface true resistivity estimated along with thickness. The estimated parameters gave the physical state of the hydrogeologic conditions of the subsurface. The various maps presented for various parameters estimated are diagnostic of regional distribution of hydraulic parameters within the Niger Delta where the research was conducted. Due to the dependence of secondary parameters on the primary parameters, there is a general conformity of the different parameters in the east–west direction of the study area. Relating the transmissivity distribution at Ngor–Okpala to the average hydraulic conductivity of the subsurface, it is evident that in deltaic areas where the recent deposition are underlain by gradually varying sized unconsolidated material, the higher transmissivity are expected close to the initiation of Delta as the coarse grained materials with higher thickness predominate.
The application of resistivity exploration technique permits the extrapolation of the aquifer parameter distributions (George et al., 2011). Results of the resistivity soundings were used to create a resistivity contour map. The 2- and 3-dimensional aquifer thickness maps are diagnostic of the saturated and potential groundwater reserve in the area. The Dar Zarouk parameters were mapped to show lateral and longitudinal distributions of resistivities and thicknesses within the water bearing geomaterials. The directions of increasing values of these parameters indicate how they prograde in the study area and these tools can be found useful in resolving groundwater problems associated with flow rate, flow direction and aquifer boundaries. The aquifer thicknesses calculated from the interpreted resistivity soundings were used to construct transmissivity distribution ranges based on the inferred hydraulic conductivity of the study area. The transmissivity of the geologic formation which was estimated and displayed in a classed post map shows three ranges of transmissitivity values which are wide, indicating high inhomogeneity of the sedimentary formation. The areas represented by triangles in the classed post map are considered to have high usable aquifer capacities due to their high transmissivity values. The kσ-values of the aquifer show relatively low values in most of the study area. This is an indication of fresh water aquifer units (George et al., 2011). However, there are few patches of white zones (high kσ-values) observed from the image map of the kσ-values, which is indicative of possible brackish or contaminated water and calls for carrying out groundwater geochemical and microbial analyses for the purpose of monitoring the rate of contaminations and possible contaminants in the areas represented by the white patches.
Based on our results, the contribution of VES coupled with the widely acceptable average permeability for fine–coarse sandy formation has proved to be significant in the quantitative estimation of aquifer parameters. The estimated secondary parameter distributions show a wide range due to the high inhomogeneity of the sedimentary formation and the observed irregular topography.
Several hydrological/hydrogeological maps have been created from the calculated hydraulic parameters of the shallow aquifers in Ngor–Okpala. These maps presented in Figs 9–15 are very useful for further studies of the groundwater regime in the study area. The maps could also be used to derive input parameters for contamination migration modelling and to improve the quality of groundwater flow model in the area.
www.ccsenet.org/apr Applied Physics Research Vol. 3, No. 2; November 2011
ISSN 1916-9639 E-ISSN 1916-9647 72
References
Arogunjo, A. M. (2002). Ground electrical conductivity for medium wave link. Global Journal of Pure and Applied Science, 8(3), 411-413.
Choudhury, K. D. K. (2004). Integrated geophysical and chemical study of saline water intrusion. GROUNDWATER, 42, 671-677. http://dx.doi.org/10.1111/j.1745-6584.2004.tb02721.x
deLima, O. A. L. & Niwas, S. (2000). Estimation of hydraulic parameters of shaly sandstone aquifers from geological measurements. Journal of hydrology, 235, 12-26. http://dx.doi.org/10.1016/S0022-1694(00)00256-0
deLima, O. A. L. & Sharma, M. M. (1990). A grain conductivity approach to shaly sands. Geophysics, 50, 1347-1356. http://dx.doi.org/10.1190/1.1442782
Edet, A. E. & Okereke, C. S. (2002). Delineation of shallow groundwater aquifers in the coastal plain sands of Calabar area using surface resistivity and hydro-geological data. Journal of African Earth Sciences, 35, 433-443. http://dx.doi.org/10.1016/S0899-5362(02)00148-3
George, N., Obianwu, V. & Udofia, K. (2011). Estimation of aquifer hydraulic parameters via complementing surfacial geophysical measurement by laboratory measurements on the aquifer core samples. IREPHY,5(2), 88-97.
Hubbard, S. H. & Rubin, Y. (2002). Hydrogeological parameter estimation using geophysical data. Journal of Contaminant Hydrology, 45; 3 -34. http://dx.doi.org/10.1016/S0169-7722(00)00117-0
Kelly, W. (1977). Geoelectric soundind for estimating aquifer hydraulic conductivity. Groundwater, 15 (6), 420-425. http://dx.doi.org/10.1111/j.1745-6584.1977.tb03189.x
Kogbe, C. A. & Obiolo, A. U. (1998). Geology of Nigeria. Jos: Rock view Nigeria limited.
Mbipom, E. W., Okwueze, E. E. & Onwuegbuche, A. A. (1996). Estimation of aquifer transmissivity using VES data from the Mbaise area of Nigeria. Nigerian Journal of Physics, 3,82.
Mbonu, D. D. C., Ebeniro, J. O., Ofoegbu, C. O. & Ekine, A. S. (1991). Geoelectrical sounding for determination of aquifer characteristics in parts of Umuahia area of Nigeria. Geophysics, 56 (5), 284-291. http://dx.doi.org/10.1190/1.1443042
McNeill, J. D. (2003). Electrical conductivity of soil and rocks.TN-5, Geonics Limited Hydrol Process Korea, 17, 1197-1211.
Niwas. S & deLima, O. A. L. (2003). Aquifer parameter estimation from surface resistivity data. Groundwater, 41 (1), 94-99. http://dx.doi.org/10.1111/j.1745-6584.2003.tb02572.x
Niwas, S. & Singhal, D. C. (2003). Estimation of aquifer transmissivity of porous media from resistivity data. Journal of Hydrology, 50, 393- 399. http://dx.doi.org/10.1016/0022-1694(81)90082-2
Pantelis, M. S., Maria, K., Filippos. V., Antonis, V. & George, S. (2007). Estimation of aquifer hydraulic parametersfrom surficial geophysical methods. Journal of Hydrology, 338, 122-131. http://dx.doi.org/10.1016/j.jhydrol.2007.02.028
Singh. K. P. (2005). Nonlinear estimation of aquifer parameters from surficial resistivity measurements. Journal of Hydrology and Earth System Sciences, 2, 197 – 938.
Short, K. C. & Stuable, A. J. (1967). Outline geology of Niger Delta. American Applied Physical Geology Bulletin. 51, 761 -779.
Vanovemeeren, R. A. (1989). Aquifer boundaries explored by geoelectric measurement in coastal plain of Yemen: A case of equivalence. Geophysics, 54, 38 – 48. http://dx.doi.org/10.1190/1.1442575

www.ccsenet.org/apr Applied Physics Research Vol. 3, No. 2; November 2011
Published by Canadian Center of Science and Education 73
Figure 1. Location map of Ngor-Okpala Local Government Area, Imo State, Nigeria
(Adopted from Ministry of Lands and Survey, Owerri, Imo State)

www.ccsenet.org/apr Applied Physics Research Vol. 3, No. 2; November 2011
ISSN 1916-9639 E-ISSN 1916-9647 74
Figure 2. Geologic map of the study area (Adopted from Ministry of Lands and Survey,
Owerri, Imo State, Nigeria)
Figure 3. Schlumberger electrode configuration used in data acquisition
www.ccsenet.org/apr Applied Physics Research Vol. 3, No. 2; November 2011
Published by Canadian Center of Science and Education 75
Figure 4. KHK group of curves representative
Figure 5. HK group of curves representative
www.ccsenet.org/apr Applied Physics Research Vol. 3, No. 2; November 2011
ISSN 1916-9639 E-ISSN 1916-9647 76
Figure 6. AK group of curves representative
Figure 7. K group of curves representative

www.ccsenet.org/apr Applied Physics Research Vol. 3, No. 2; November 2011
Published by Canadian Center of Science and Education 77
Figure 8. Correlation between borehole lithology log (BH) and geoelectric section at VES 21
Figure 9. Resistivity contour map in the study area

www.ccsenet.org/apr Applied Physics Research Vol. 3, No. 2; November 2011
ISSN 1916-9639 E-ISSN 1916-9647 78
Figure 10. Aquifer thickness maps represented in a 2-D format
Figure 11. Aquifer thickness maps represented in a 3-D format
www.ccsenet.org/apr Applied Physics Research Vol. 3, No. 2; November 2011
Published by Canadian Center of Science and Education 79
Figure 12. A 2-D transverse resistance map in the study area
Figure 13. A 2-D map of longitudinal conductance in the study area
www.ccsenet.org/apr Applied Physics Research Vol. 3, No. 2; November 2011
ISSN 1916-9639 E-ISSN 1916-9647 80
Figure 14. Classed post map showing the three ranges of aquifer transmissivities in the study area
Figure 15. 2-D image map of Κσ-values showing low values (dark zone) and some
moderately high values (white zone)