Ecosystem Services and the Ecological Identity & Ecological Disenfranchisement Discourse

SOCIETY OF ECOLOGICAL CHEMISTRY AND ENGINEERING
ECOLOGICAL CHEMISTRY AND ENGINEERING S
CHEMIA I INŻYNIERIA EKOLOGICZNA S
Vol. 18 No. 3
Opole 2011

EDITORIAL BOARD
Editor-in-Chief Witold Wacławek, Opole University, Opole, PL
Deputy/Managing Editor Maria Wacławek, Opole University, Opole, PL
Editorial Advisory Board Bogusław Buszewski, Nicolaus Copernicus University, Toruń, PL
Milan Kraitr, Western Bohemian University, Plzen, CZ
Editors
Environmental analytical chemistry Jacek Namieśnik, Gdansk University of Technology, Gdańsk, PL
Jíri Ševcik, Charles University, Prague, CZ
Environmental engineering and management Mykhaylo Bratychak, National University of Technology, Lviv, UA
Lucjan Pawłowski, Lublin University of Technology, Lublin, PL
Piotr Tomasik, Agricultural University of Krakow, Kraków, PL Roman Zarzycki, Lodz University of Technology, Łódź, PL
Heavy metals and radionuclides in the environment Marina V. Frontasyeva, Joint Institute for Nuclear Research, Dubna, RU
Manfred Sager, Agency for Health and Food Safety, Vienna, AT
Monitoring and biomonitoring Jerzy Bartnicki, Meteorological Institute - DNMI, Oslo-Blindern, NO
Andrzej Kulig, Warsaw University of Technology, Warszawa, PL
Bernd Markert, International Graduate School [IHI], Zittau, DE
Nelson Marmiroli, University, Parma, IT Mark R.D. Seaward, University of Bradford, Bradford, UK
Renewable energy sources Maria Wacławek, Opole University, Opole, PL
Language Editors
Krzysztof J. Rudziński, Institute of Physical Chemistry PAS, Warszawa, PL
Witold Wacławek, Opole University, Opole, PL
Technical Editors
Zdzisława Tasarz, Czestochowa University of Technology, Częstochowa, PL
Lucyna Żyła, Czestochowa University of Technology, Częstochowa, PL
Secretaries
Agnieszka Dołhańczuk-Śródka, tel. +48 77 401 60 45, email: [email protected]
Małgorzata Rajfur, tel. +48 77 401 60 42, email: [email protected], [email protected]
Copyright © by Society of Ecological Chemistry and Engineering
Wersją pierwotną czasopisma jest wersja papierowa
Wydawnictwo dofinansowane przez
Ministerstwo Nauki i Szkolnictwa Wyższego w Warszawie
ISSN 1898-6196
Dear Readers,
We would like to inform you, that our quarterly Ecological Chemistry and Engineering S/Chemia i Inżynieria Ekologiczna S
has been selected by the Thomson Scientific in Philadelphia for coverage in: Science Citation Index Expanded
Journal Citation Reports/Science Edition. For 2010 its IF is 0.294.
We thank very much all Editorial Board members and Reviewers
for their efforts and also Authors for presenting valuable papers
Editors
Szanowni Czytelnicy,
Miło jest nam poinformować, że kwartalnik Ecological Chemistry and Engineering S/Chemia i Inżynieria Ekologiczna S
został wybrany przez the Thomson Scientific w Filadelfii do umieszczenia w następujących bazach:
Science Citation Index Expanded Journal Citation Reports/Science Edition.
W roku 2010 jego współczynnik IF wyniósł 0,294. Serdecznie dziękujemy Członkom Rady Programowej i Recenzentom
za dokładanie starań o wysoki poziom naukowy czasopisma, a także Autorom za przedstawianie interesujących wyników badań
Redakcja


CONTENTS
Marina V. FRONTASYEVA NAA for Life Sciences at Frank Laboratory of Neutron Physics, Joint Institute for Nuclear Research in Dubna ................................................................ 281
Bogdan ZYGMUNT, Anna BANEL and Marta WASIELEWSKA Increasingly green approaches to the determination of selected trace organics in complex matrices. Short chain carboxylic acids .................................. 305
Ivan DIADOVSKI, Maya ATANASSOVA and Vasil SIMEONOV Risk assessment of extreme events along the transboundary Mesta River in Bulgaria using integral indices .......................................................................... 319
Stanislaw Z. LABUDA and Aleksandr A. VETCHINNIKOV Soil susceptibility on reduction as an index of soil properties applied in the investigation upon soil devastation .................................................................. 333
Barbara GAWDZIK and Jarosław GAWDZIK Impact of pollution with oil derivatives on the natural environment and methods of their removal ....................................................................................... 345
Andrzej JAGUŚ and Mariusz RZĘTAŁA Influence of agricultural anthropopression on water quality of the dam reservoirs ............................................................................................................... 359
Dariusz ŚWIERK and Barbara SZPAKOWSKA Occurrence of heavy metals in aquatic macrophytes colonising small aquatic ecosystems ................................................................................................ 369
VARIA
Invitation for ECOpole’11 Conference .......................................................................... 387 Zaproszenie na Konferencję ECOpole’11 ...................................................................... 391 Guide for Authors on submission of manuscripts .......................................................... 395 Zalecenia dotyczące przygotowania manuskryptów ...................................................... 396


SPIS TREŚCI
Marina V. FRONTASYEVA NAA w naukach o życiu w Laboratorium Fizyki Neutronowej Zjednoczonego Instytutu Badań Jądrowych w Dubnej .......................................... 281
Bogdan ZYGMUNT, Anna BANEL i Marta WASIELEWSKA Oznaczanie śladowych ilości związków organicznych w próbkach o złożonych matrycach zgodnie z regułami „zielonej chemii analitycznej”. Krótkołańcuchowe kwasy karboksylowe ........................................ 305
Ivan DIADOVSKI, Maya ATANASSOVA i Vasil SIMEONOV Ocena ryzyka wystąpienia zjawisk ekstremalnych spowodowanych przez rzekę Mesta w Bułgarii na podstawie analizy wskaźników integralnych ............... 319
Stanislaw Z. LABUDA i Aleksandr A. VETCHINNIKOV Podatność gleby na redukcję jako wskaźnik właściwości gleby zastosowany w badaniach nad dewastacją gleby ................................................... 333
Barbara GAWDZIK i Jarosław GAWDZIK Wpływ zanieczyszczeń substancjami ropopochodnymi na środowisko przyrodnicze i metody ich usuwania ...................................................................... 345
Andrzej JAGUŚ i Mariusz RZĘTAŁA Wpływ działalności rolniczej na jakość wód w zbiornikach zaporowych ............................................................................................................ 359
Dariusz ŚWIERK i Barbara SZPAKOWSKA Występowanie metali ciężkich w hydromakrofitach zasiedlających małe ekosystemy wodne ................................................................................................. 369
VARIA
Invitation for ECOpole’11 Conference .......................................................................... 387 Zaproszenie na Konferencję ECOpole’11 ...................................................................... 391 Guide for Authors on submission of manuscripts .......................................................... 395 Zalecenia dotyczące przygotowania manuskryptów ...................................................... 396


ECOLOGICAL CHEM ISTRY AND ENGINEERING S
Vol. 18, No. 3 2011
Marina V. FRONTASYEVA1
NAA FOR LIFE SCIENCES AT FRANK LABORATORY OF NEUTRON PHYSICS, JOINT INSTITUTE
FOR NUCLEAR RESEARCH IN DUBNA
NAA W NAUKACH O ŻYCIU W LABORATORIUM FIZYKI NEUTRONOWEJ
ZJEDNOCZONEGO INSTYTUTU BADAŃ JĄDROWYCH W DUBNEJ
Abstract: Experience in applying conventional and epithermal neutron activation analysis for some challenging areas of the life sciences is reviewed. For more than 25 years of its operation the radioanalytical complex REGATA at the IBR-2 reactor in Dubna has become a source of analytical data for the environmental studies, marine geology, bio-nano-technology and medicine, etc. In spite of competing non-nuclear analytical techniques (AAS, ICP-ES, ICP-MS, etc), the reactor neutron activation analysis (NAA) as a primary (ratio) method continues to be the most powerful multi-element analytical technique providing quantification of trace elements at ultra low levels. Combined with modern statistical data treatment of large arrays of data, GIS (geographic information system) technologies, electron scanning microscopy, tomography, and others, NAA serves to obtain practical results resumed in the review.
Keywords: epithermal neutron activation analysis, reactor IBR-2, environmental studies, biotechnology
Introduction
This review considers the contribution of a reactor neutron activation analysis (NAA) at Frank Laboratory of Neutron Physics (FLNP) of Joint Institute for Nuclear Research (JINR) to solution of the major problems in the studies of the chemical composition of objects in the biosphere with a view to understanding the role of various elements in the functioning of living organisms and ecosystems under anthropogenic effects on nature, often resulting in irreversible changes in the environment and human health.
These studies are concerned with water, atmosphere, soil, vegetation, microorganisms, animal, and human tissues. Their main goal is to elaborate a metrological and analytical
1 Department of Neutron Activation Analysis and Applied Research, Division of Nuclear Physics, Frank Laboratory of Neutron Physics, Joint Institute for Nuclear Research, Joliot-Curie 6, 141980 Dubna, Moscow Region, Russian Federation, email: [email protected]
Marina V. Frontasyeva
282
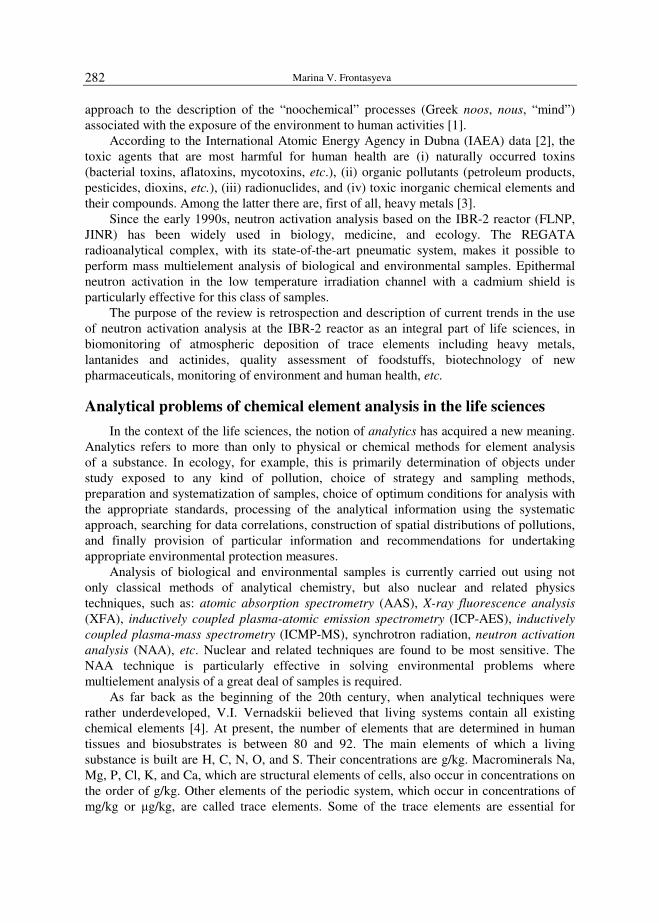
approach to the description of the “noochemical” processes (Greek noos, nous, “mind”) associated with the exposure of the environment to human activities [1].
According to the International Atomic Energy Agency in Dubna (IAEA) data [2], the toxic agents that are most harmful for human health are (i) naturally occurred toxins (bacterial toxins, aflatoxins, mycotoxins, etc.), (ii) organic pollutants (petroleum products, pesticides, dioxins, etc.), (iii) radionuclides, and (iv) toxic inorganic chemical elements and their compounds. Among the latter there are, first of all, heavy metals [3].
Since the early 1990s, neutron activation analysis based on the IBR-2 reactor (FLNP, JINR) has been widely used in biology, medicine, and ecology. The REGATA radioanalytical complex, with its state-of-the-art pneumatic system, makes it possible to perform mass multielement analysis of biological and environmental samples. Epithermal neutron activation in the low temperature irradiation channel with a cadmium shield is particularly effective for this class of samples.
The purpose of the review is retrospection and description of current trends in the use of neutron activation analysis at the IBR-2 reactor as an integral part of life sciences, in biomonitoring of atmospheric deposition of trace elements including heavy metals, lantanides and actinides, quality assessment of foodstuffs, biotechnology of new pharmaceuticals, monitoring of environment and human health, etc.
Analytical problems of chemical element analysis in the life sciences
In the context of the life sciences, the notion of analytics has acquired a new meaning. Analytics refers to more than only to physical or chemical methods for element analysis of a substance. In ecology, for example, this is primarily determination of objects under study exposed to any kind of pollution, choice of strategy and sampling methods, preparation and systematization of samples, choice of optimum conditions for analysis with the appropriate standards, processing of the analytical information using the systematic approach, searching for data correlations, construction of spatial distributions of pollutions, and finally provision of particular information and recommendations for undertaking appropriate environmental protection measures.
Analysis of biological and environmental samples is currently carried out using not only classical methods of analytical chemistry, but also nuclear and related physics techniques, such as: atomic absorption spectrometry (AAS), X-ray fluorescence analysis (XFA), inductively coupled plasma-atomic emission spectrometry (ICP-AES), inductively
coupled plasma-mass spectrometry (ICMP-MS), synchrotron radiation, neutron activation
analysis (NAA), etc. Nuclear and related techniques are found to be most sensitive. The NAA technique is particularly effective in solving environmental problems where multielement analysis of a great deal of samples is required.
As far back as the beginning of the 20th century, when analytical techniques were rather underdeveloped, V.I. Vernadskii believed that living systems contain all existing chemical elements [4]. At present, the number of elements that are determined in human tissues and biosubstrates is between 80 and 92. The main elements of which a living substance is built are H, C, N, O, and S. Their concentrations are g/kg. Macrominerals Na, Mg, P, Cl, K, and Ca, which are structural elements of cells, also occur in concentrations on the order of g/kg. Other elements of the periodic system, which occur in concentrations of mg/kg or µg/kg, are called trace elements. Some of the trace elements are essential for

NAA for Life Sciences at Frank Laboratory of Neutron Physics, Joint Institute for Nuclear Research …
283
functioning of living systems. The criteria according to which trace elements are divided into essential and non-essential have been formulated in [5].
Investigations have shown that, for each trace element, there is a concentration level corresponding to the adequate effect on the living system and that each element, even essential, can be potentially toxic in concentrations above the level of adequate effect [6-9]. The dependence of the biological function of a trace element in a living system on its concentration in the food or medium is schematically shown in the known Bertrand diagram (Fig. 1 [10]).
Heavy metals are believed to be the most active toxicants. They can be supplied to a living organism through food, air, water, and its outer surface. A high concentration of heavy metals in environmental objects, air, soil, vegetation, water bodies, etc., is a serious risk factor for the population’s health. Particularly harmful can be toxicants entering the organism with the air, the uptake of which is 3 × 10⁴ times larger in volume and 20 times larger in mass than that of food and water and which directly affects the lungs and the gastrointestinal tract [11].
Correlations of air pollution and medical statistics confirm the results of investigations [11-14]. Recently, in connection with the development of analytical methods, rare earth elements (lanthanides, Sc, Y), which were earlier beyond the reach of analytical techniques, have been extensively studied in environmental objects from the point of view of their toxicity [15, 16].
Fig. 1. Dependence of the biological function on the concentration of the nutrient in the tissue [10]
(abscissas: concentration or intake of the nutrient)
Most elements associated with various industries belong to group I toxicants and are potentially hazardous for the environment and human beings. Biological research is currently being carried out in many areas with the concentrated efforts of scientists from many countries. The most important of these areas are investigation of environmental objects (soil, water, air, vegetation, etc.); analysis of trace elements in human and animal tissues; and investigation of the elemental composition of foodstuffs. The biomonitoring technique is widely used in various variants in this research. Depending on the character of
Marina V. Frontasyeva
284
the particular investigation, the biomonitors are mosses and lichens, bacteria, fungi, animals, and human and animal tissues and substrates, etc.
The statistical approach to solution of environmental problems using biomonitors requires a multielement analysis of a great deal of samples, and in this respect non-destructive instrumental neutron activation analysis (INAA) surpasses other techniques.
Neutron activation analysis: merits and drawbacks
Powerful reactor fluxes (1012÷1014 neutrons cm–2 s–1); a combination of various versions of the technique (activation with epithermal neutrons, cyclic activation analysis); and the use of modern high-resolution (~2 keV) semiconductor detectors, measuring and computing equipment, and state-of-the-art computer technologies for data processing and interpretation are factors that determine the current level of NAA. Highly accurate determination of the impurity composition in solid matrices allowed NAA to be recognized in 2007 as a primary method of measurement to be used for metrology purposes and for certification of reference materials [17].
NAA features the following merits: high sensitivity to a majority of elements, especially to heavy metals with Z > 10; good selectivity due to specific nuclear physics characteristics of elements; a possibility of simultaneously determining a large number of elements; independence of the results on the form of chemical compounds; a non-destructive nature, which allows avoiding the risk of contamination of samples with reagents or their incomplete dissolution; easy procedure for preparation of samples for analysis; good accuracy, about ±10÷15%, in determination of concentrations of the order of ppm (10–6 g); a possibility of eliminating systematic errors; a possibility of minimizing the effect of matrix elements of samples; ease of preparation of standards for comparison.
The drawbacks of NAA are, first of all, the necessity of using nuclear reactors and the problems arising from storage and disposal of nuclear waste [18].
In the 1980s, certified international standard samples and reference materials appeared especially for analytical purposes. The quality control of analytical measurements allowed the accuracy to be increased and systematic errors to be reduced to minimum. It became possible to perform interlaboratory comparisons of the analysis results and to compare data obtained by different analytical techniques.
Reactor epithermal neutron activation analysis
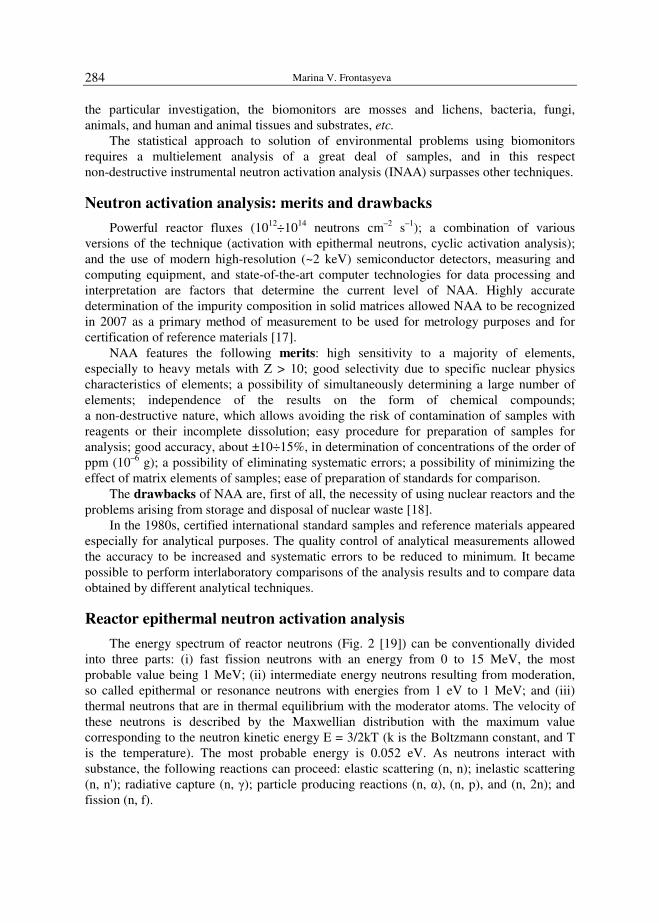
The energy spectrum of reactor neutrons (Fig. 2 [19]) can be conventionally divided into three parts: (i) fast fission neutrons with an energy from 0 to 15 MeV, the most probable value being 1 MeV; (ii) intermediate energy neutrons resulting from moderation, so called epithermal or resonance neutrons with energies from 1 eV to 1 MeV; and (iii) thermal neutrons that are in thermal equilibrium with the moderator atoms. The velocity of these neutrons is described by the Maxwellian distribution with the maximum value corresponding to the neutron kinetic energy E = 3/2kT (k is the Boltzmann constant, and T
is the temperature). The most probable energy is 0.052 eV. As neutrons interact with substance, the following reactions can proceed: elastic scattering (n, n); inelastic scattering (n, n'); radiative capture (n, γ); particle producing reactions (n, α), (n, p), and (n, 2n); and fission (n, f).
NAA for Life Sciences at Frank Laboratory of Neutron Physics, Joint Institute for Nuclear Research …
285
Fig. 2. Schematic representation of the nuclear reactor neutron spectrum [19]
Thermal neutron reactions (n, γ) and (n, n) have large cross sections of 0.1÷100 barn, while fast neutron reactions (n, p), (n, α), (n, n'), and (n, 2n) have cross-sections that are two to three orders of magnitude smaller. The reaction most often used in NAA is radiative
capture, γZZZn 1A*1AA +→→+ ++ , where AZ is the irradiated isotope, A+1Z* is the
compound nucleus in the excited state, and γ is the secondary gamma radiation. In some cases, however, interfering reactions occur, eg, 27Al (n,γ) 28Al; 28Si (n,p) 28Al,
31P (n,α) 28Al or 26Mg (n,γ) 27Mg; 27Al (n,p) 27Mg. These reactions are a source of difficulties for determination of concentrations of elements and appreciably decrease the sensitivity and accuracy of the technique.
The INAA detection limit for some elements strongly depends on the composition of the samples under investigation. High background from Compton radiation of matrix elements often contributes to interference. To decrease this background, measurements are sometimes carried out after an appropriate delay time, which is beneficial if the main interfering radionuclides have relatively short half-lives [20].
In other cases, purely instrumental methods are used to suppress Compton radiation [21]. Practice has shown that the most effective technique for increasing NAA sensitivity is the resonance activation technique. At present, epithermal neutron activation analysis (ENAA) is successfully being used at many reactors, including IBR-2 (FLNP, JINR).
The NAA technique using epithermal neutrons with the energy 0.5÷104 eV is based on selective activation of those isotopes for which the neutron caption cross-section σ does not obey the law 1/v (where v is the neutron velocity) and features pronounced resonance peaks.
The occurrence of resonances is associated with quasi-stationary states in intermediate compound systems (nuclide nucleus + neutron) with lifetimes that are much longer than the time of flight of the neutron through the nucleus. The metastability of these states stems from the Coulomb and centrifugal barriers, which delay decay processes, and from the complexity of the inner structure of the nucleus. If the neutron energy is such that the total energy of the system corresponds to one of the levels of the intermediate nucleus, the probability of its production is much higher than in the case in which the energy

Marina V. Frontasyeva
286
corresponds to the gap between the energy levels. Then a resonance peak may arise on the curve of the energy dependence of the interaction cross section σ(E).
Irradiation of these nuclides by epithermal neutrons allows selective activation to be carried out and specific element determination techniques to be developed. It also becomes possible to effectively suppress the induced activity of some matrix elements in samples of environmental and biological nature (28Al, 56Mn, 24Na, 35Cl, 45Sc, and others) that have large cross-sections for thermal neutron absorption and reduce the number of competing reactions.
Thus, when there are no interfering elements, selectivity, sensitivity, and accuracy of the analysis increase and it becomes possible to determine small concentrations of trace elements and microelements in biological, environmental, geochemical, and other samples.
Epithermal neutrons for ENAA purposes are obtained using filters made of substances that have larger cross-sections for absorption of neutrons with energies below some specified values. In the practice of activation analysis, resonance absorbers are either permanently installed in the reactor irradiation channel or placed into transport containers (capsules) for irradiation of samples. Cadmium and boron are most often used as absorber materials.
In the reviews of ENAA investigations that had been conducted by the mid 1980s, Steinnes highlighted the most important advantage of the technique: the possibility of determining trace elements in environmental, biological, and geochemical samples [22, 23].
Analysis of many trace elements in concentrations down to 10–6 ppm in a large number of samples makes NAA one of the most effective methods in life sciences and determines the scale of its application.
Fig. 3. Elements determined by NAA (����) and ICP-MS (○) in plant and biological samples. Solid
symbols (•, ■) denote the greatly preferable technique [25]
The 2000 review of the uses of NAA in environmental research [24] considers the main lines of this research: study of atmospheric deposition of heavy metals (analysis of aerosols and biomonitors - mosses, lichens, fungi); determination of trace elements in fuel and its refining products; investigation of pollution in soil and water concretions; and determination of trace elements in plants and animals.
NAA for Life Sciences at Frank Laboratory of Neutron Physics, Joint Institute for Nuclear Research …
287
To be effective, NAA requires standard samples and reference materials, and combination of NAA with other analytical techniques, such as AAS and ICP-MS/AES, allows the number of determined trace elements to be increased and fuller information on the state of environment to be obtained.
Figure 3 shows for which elements ENAA is more preferable as compared with the main competing technique, namely, ICP-MS, the major competitor of NAA, the in analysis of plant and biological samples [25].
The methodological NAA studies at the REGATA radioanalytical complex of the IBR-2 reactor using in the course of constructing the NAA and radiation investigations are described elsewhere [21, 26-31]. The questions of analytical quality control (QC) and sources of uncertainties are well summarized in [32, 33] and not considered in this review.
ENAA applications at the IBR-2 reactor (FLNP, JINR) for purposes of the life sciences
Atmospheric air monitoring with aerosol filters
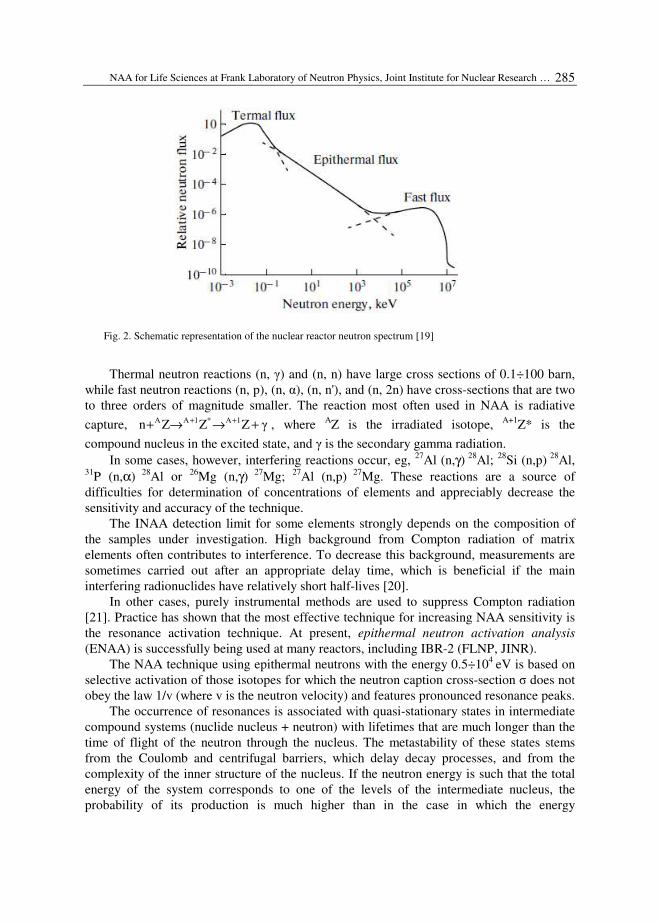
NAA of several hundred micropore aerosol filters taken at various sites in a relatively clean North Polar region and polluted regions of Tyumen, Novosibirsk and Krasnoyarsk territory was used to solve some specific problems of atmospheric air monitoring in Siberia. A total of 39 elements were determined in these filters installed in a cascade impactor for aerosol particles of submicron size [34]. The statistical processing of the entire amount of the data allowed evaluating factors of enrichment of aerosols by particular metals and variations in their concentrations.
Fig. 4. Concentration of elements in the filters along the Greater Cairo Area [35]
Of particular interest is work on aerosol filters [35] carried out in collaboration with the National Center for Nuclear Safety and Radiation Control (Cairo, Egypt). Weekly cycles of pollutant elements in the air of the Greater Cairo Area were studied by NAA. These investigations, like those conducted in the United States and Canada [36], made it possible to reveal the so called Sunday effect, that is, a decrease in emission of air pollutants on the
Marina V. Frontasyeva
288
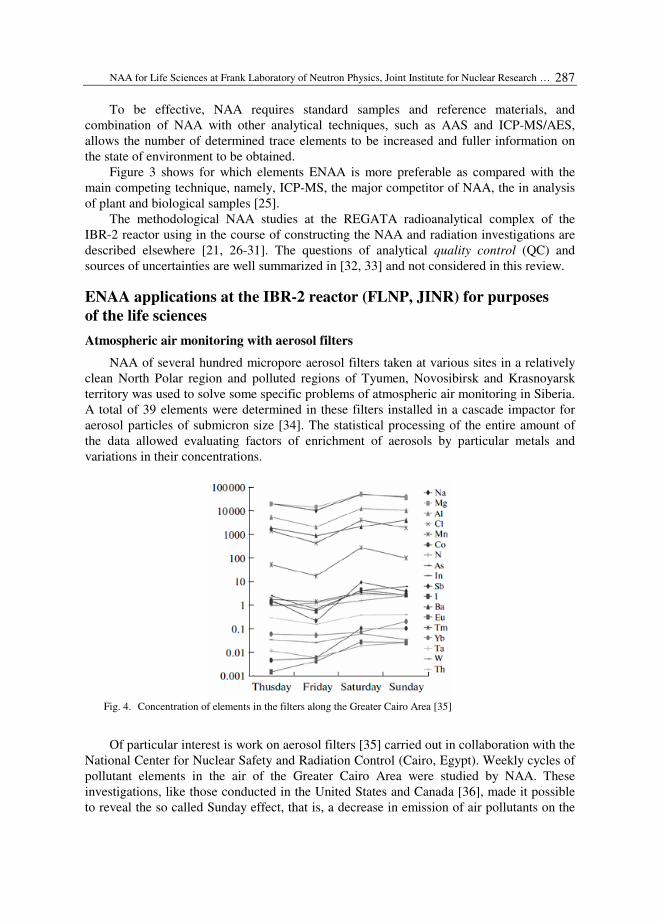
weekends, when many factories were closed for days off and discharges decreased. The results are shown in the form of temporal and spatial distributions in Figures 4 and 5, respectively. It follows from Figure 4 that the minimum concentration of elements in the aerosol filters is observed on Islamic days off, Thursday and Friday, whereas in the aerosols on the Atlantic coast of America the minimum concentrations of elements are observed on Saturday and Sunday. The spatial distribution (Fig. 5) demonstrates a trend for concentrations of heavy metals, rare earth elements, and actinides to increase in the direction from the north to the south, which corresponds to the predominant motion of air streams along the Nile from the Sahara to the Mediterranean Sea.
Fig. 5. Concentration of elements in the filters in relation to the day of the week [35]
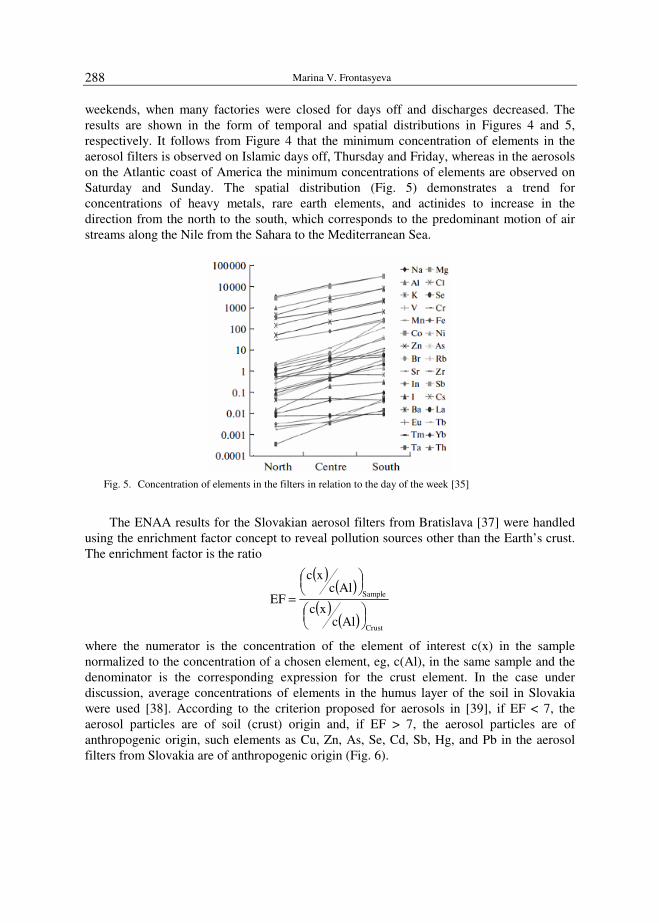
The ENAA results for the Slovakian aerosol filters from Bratislava [37] were handled using the enrichment factor concept to reveal pollution sources other than the Earth’s crust. The enrichment factor is the ratio
( )( )
( )( )
Crust
Sample
Alcxc
Alcxc
EF
=
where the numerator is the concentration of the element of interest c(x) in the sample normalized to the concentration of a chosen element, eg, c(Al), in the same sample and the denominator is the corresponding expression for the crust element. In the case under discussion, average concentrations of elements in the humus layer of the soil in Slovakia were used [38]. According to the criterion proposed for aerosols in [39], if EF < 7, the aerosol particles are of soil (crust) origin and, if EF > 7, the aerosol particles are of anthropogenic origin, such elements as Cu, Zn, As, Se, Cd, Sb, Hg, and Pb in the aerosol filters from Slovakia are of anthropogenic origin (Fig. 6).

NAA for Life Sciences at Frank Laboratory of Neutron Physics, Joint Institute for Nuclear Research …
289
Fig. 6. Enrichment factor calculated for some elements determined by ENAA in the aerosol filters from
Bratislava [36]
Biomonitoring of atmospheric deposition of trace elements
Passive biomonitoring. It is well-known that lichens, mosses, ferns, grass, bark and leaves of trees, conifer needles, etc., are used as biomonitors of atmospheric deposition of trace elements and other organic toxic compounds [40]. In the investigations of atmospheric deposition of heavy metals at the IBR-2 reactor lichens and pine needles were used for biomonitoring in [41, 42]. Peat cores were also studied [43]. However, most of the investigative work was done with moss biomonitors.
Moss biomonitoring has been developing as a method for studying atmospheric deposition of heavy metals since 1960 [44, 45]. Mosses well meet all the requirements imposed on biomonitors. A developed surface of their aboveground parts is in good contact with the atmospheric air, and thus deposition and capture of aerosols is quite probable. In this respect moss biomonitors can be thought of as analogues of air filters. Surface properties of moss cuticles facilitate penetration of metal ions into cells and onto the places in which they are bound [46]. Since mosses have an underdeveloped root system, their contact with soil and, thus, uptake of metal with substrates can be considered negligibly small. Mosses are usually tolerable to even a high pollution level. Some species of mosses, such as Hylocomium splendens and Pleurozium schreberi, are acknowledged as the most suitable monitors for investigation of atmospheric deposition of heavy metals. These species widely occur in the moderate climate zone and can be encountered in the majority of European countries. Since Hylocomium splendens and Pleurozium schreberi have distinct annual growth segments, they can also be employed for studying temporal trends. Moss sampling is not a difficult procedure and can be done in summer over large regions. Mosses effectively concentrate most heavy metals and other microelements from the air and precipitation. Some types of moss (Hylocomium splendens, Pleurozium schreberi, Hypnum
cupressiforme) frequently occur in a wide range of moderate climate zones, and their
Marina V. Frontasyeva
290
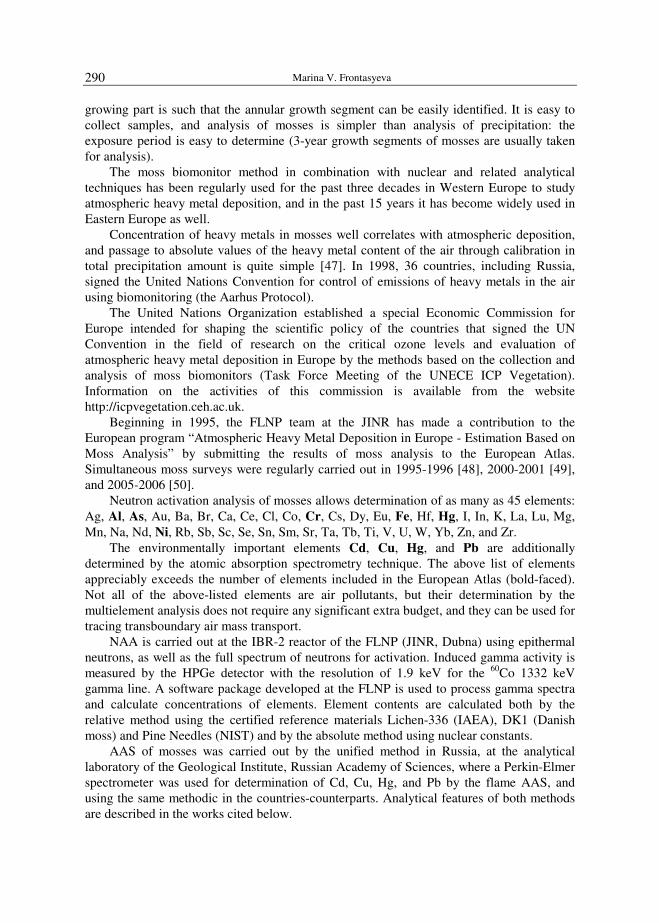
growing part is such that the annular growth segment can be easily identified. It is easy to collect samples, and analysis of mosses is simpler than analysis of precipitation: the exposure period is easy to determine (3-year growth segments of mosses are usually taken for analysis).
The moss biomonitor method in combination with nuclear and related analytical techniques has been regularly used for the past three decades in Western Europe to study atmospheric heavy metal deposition, and in the past 15 years it has become widely used in Eastern Europe as well.
Concentration of heavy metals in mosses well correlates with atmospheric deposition, and passage to absolute values of the heavy metal content of the air through calibration in total precipitation amount is quite simple [47]. In 1998, 36 countries, including Russia, signed the United Nations Convention for control of emissions of heavy metals in the air using biomonitoring (the Aarhus Protocol).
The United Nations Organization established a special Economic Commission for Europe intended for shaping the scientific policy of the countries that signed the UN Convention in the field of research on the critical ozone levels and evaluation of atmospheric heavy metal deposition in Europe by the methods based on the collection and analysis of moss biomonitors (Task Force Meeting of the UNECE ICP Vegetation). Information on the activities of this commission is available from the website http://icpvegetation.ceh.ac.uk.
Beginning in 1995, the FLNP team at the JINR has made a contribution to the European program “Atmospheric Heavy Metal Deposition in Europe - Estimation Based on Moss Analysis” by submitting the results of moss analysis to the European Atlas. Simultaneous moss surveys were regularly carried out in 1995-1996 [48], 2000-2001 [49], and 2005-2006 [50].
Neutron activation analysis of mosses allows determination of as many as 45 elements: Ag, Al, As, Au, Ba, Br, Ca, Ce, Cl, Co, Cr, Cs, Dy, Eu, Fe, Hf, Hg, I, In, K, La, Lu, Mg, Mn, Na, Nd, Ni, Rb, Sb, Sc, Se, Sn, Sm, Sr, Ta, Tb, Ti, V, U, W, Yb, Zn, and Zr.
The environmentally important elements Cd, Cu, Hg, and Pb are additionally determined by the atomic absorption spectrometry technique. The above list of elements appreciably exceeds the number of elements included in the European Atlas (bold-faced). Not all of the above-listed elements are air pollutants, but their determination by the multielement analysis does not require any significant extra budget, and they can be used for tracing transboundary air mass transport.
NAA is carried out at the IBR-2 reactor of the FLNP (JINR, Dubna) using epithermal neutrons, as well as the full spectrum of neutrons for activation. Induced gamma activity is measured by the HPGe detector with the resolution of 1.9 keV for the 60Co 1332 keV gamma line. A software package developed at the FLNP is used to process gamma spectra and calculate concentrations of elements. Element contents are calculated both by the relative method using the certified reference materials Lichen-336 (IAEA), DK1 (Danish moss) and Pine Needles (NIST) and by the absolute method using nuclear constants.
AAS of mosses was carried out by the unified method in Russia, at the analytical laboratory of the Geological Institute, Russian Academy of Sciences, where a Perkin-Elmer spectrometer was used for determination of Cd, Cu, Hg, and Pb by the flame AAS, and using the same methodic in the countries-counterparts. Analytical features of both methods are described in the works cited below.
NAA for Life Sciences at Frank Laboratory of Neutron Physics, Joint Institute for Nuclear Research …
291
The concentration determination uncertainty for most element falls within the range of 5÷10%, amounting to 20÷25% in only a few cases.
The first contribution to the 1995/1996 Atlas [48] was the results obtained from biomonitoring of atmospheric deposition of heavy metals and trace elements in the Eastern Carpathians [51].
Later, these investigations, supported by grants of the Plenipotentiaries of some JINR member states and IAEA programs, were carried out in some industrial regions of Central Russia (Tula region [52, 53], Tver and Yaroslavl regions [54], northeastern parts of Moscow region [55]), the Southern Urals [56-58], the Udmurt Republic [59], Norway [60], Poland [61-64], Bulgaria [65-67], Slovakia [68, 69], Romania [70-74], Western Ukraine [75], Belarus [76], Serbia [77-79], Macedonia [80], Croatia [81], and the European part of Turkey [82] in cooperation with specialists of those countries.
The contribution of the FLNP to the UNECE ICP Vegetation Program has been indicated in large international publications [83-85].
Similar pilot projects have been realized by the FLNP in Asia in cooperation with the scientists from China [86], South Korea [87], Mongolia [88], and Vietnam [89].
Biomonitoring of atmospheric deposition of heavy metals and other trace elements is carried out using not only multivariate statistical analysis (method of principal components, or factor analysis).
Modern GIS technologies allowing analytical information to be represented as geographical color maps of element distributions are also widely used.
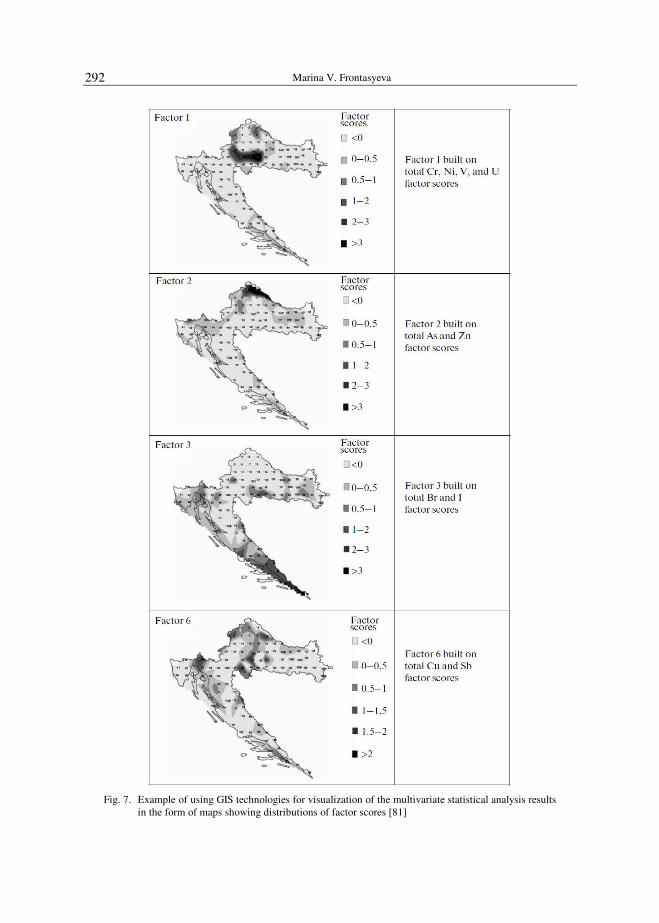
To illustrate, Figure 7 shows black-and-white maps of factor score distributions over the territory of Croatia calculated with the programe STATISTICA-6 (factor analysis) [81].
To make raster contour maps of the distributions, the GRINVIEW program from the GISINTEGRO software package with raster and vector graphics was used. This package has interfaces for all international GIS standards: ARC-info, MAP-info, etc.
Active biomonitoring. An alternative to passive biomonitoring using ground mosses is active biomonitoring using moss transplants (preferably Sphagnum girgensohnii Russow collected in a clean background region) kept under exposure in moss bags for a certain time in areas of interest. This method allows estimation of the air pollution level in those regions where ground mosses do not grow because of heavy technogenic load in large cities and industrial regions, as well as in arid areas where mosses never grow at all. The results obtained by the JINR team from active monitoring in Serbia, Poland, Romania, Bulgaria, and Greece are reported in [90-95]. In [96], where the active biomonitoring method was further developed by employing wet mosses, it was shown that wet mosses, as compared with dry mosses, have a higher ability to accumulate such elements as Sr, Se, As, Zn, Ca, Mg, Te, Al, Cr, Sm, Si, Be, Ce, Co, Mo, Dy, La, Hf, Nb, Ti, and W.
Marina V. Frontasyeva
292
Fig. 7. Example of using GIS technologies for visualization of the multivariate statistical analysis results
in the form of maps showing distributions of factor scores [81]
NAA for Life Sciences at Frank Laboratory of Neutron Physics, Joint Institute for Nuclear Research …
293
Quality and safety of foodstuffs
Participation of the JINR team in the IAEA Coordination Program for the use of nuclear and related analytical techniques to study effect produced on human health by toxic elements taken in with food produced under conditions of industrial pollution (2002-2005) initiated development of a new direction in the investigative work of the team on quality and safety of foodstuff [97, 98]. Within the IAEA Technical Cooperation Project “Investigation of Health Effects on Children from the Consumption of Food Grown in Industrially Contaminated Areas of Russia, the Southern Urals, and Siberia using NAA and AAS” (2003-2005), a great number of food samples were investigated by the neutron activation technique. The work on studying bioaccumulation of chemical elements by vegetables was further continued in the technogenically contaminated area of Tula region [99].
Estimation of the technogenic contamination effect on the microelemental composition of basidial mushrooms in the European part of Russia was performed in [100]. The difference in the microelemental composition of edible wild mushrooms and artificially grown mushrooms was shown. NAA of 12 species of basidial mushrooms and soils on which they grew allowed the conclusion to be drawn that a high concentration of trace elements, including heavy and toxic metals, in mushrooms results from their high concentration in the soil in their mobile forms readily uptaken by mushrooms. In areas with intense technogenic contamination, the factors contributing to an increase in concentrations of mobile forms of metals in the upper soil horizon overlap and are piled up.
Workplace monitoring and personnel health
Due to the use of nuclear and related analytical techniques [101], it was shown for the first time that phosphate fertilizers are a source of contamination of the environment with rare-earth elements [102]. ENAA at the IBR-2 reactor in combination with the AAS and XRF methods made it possible to establish a relation between concentrations of pollutant elements (Cr, Ni, Cu, Zn, As, Se, Sr, Mo, Ag, Cd, Sb, Pb, REEs, Th, U, and others) at workplaces and in the raw material, by-product (phosphogypsum), and substrates (teeth, hair, nails) of the personnel involved in production of phosphate fertilizers at the Mineral fertilizer production association (Voskresensk, Moscow region). Analysis of the biosubstrates of the personnel and local inhabitants was carried out in parallel with a general assessment of environment in the vicinity of these factories using analysis of transporting and depositing natural media (soil, water, air), plants (grain crops), and foodstuffs [103-108]. The results of the studies showed that production of mineral nitrogen-phosphate fertilizers is a source of supplying F, Ca, Sr, and rare earth elements (REEs) to the environment, mainly by emission of these elements into the air. Elevated concentrations of F and REEs were observed in biosubstrates of the personnel and population. Recommendations were worked out for possible recycling of the production waste (compost from the factory’s settling ponds and phosphogypsum) in agriculture to minimize damage inflicted to the environment by the factory.
Use of INAA for assessing negative effect of toxic elements on soil, bottom sediment, and aquatic biota
NAA proved to be good for studying scattered elements in the soil and vegetation of boreal forests in the European part of Russia [109, 110]. Profiles of trace elements in Al-Fe

Marina V. Frontasyeva
294
humus podzolic soils subjected to air pollution from the apatite and nepheline production under varying lithogenic background were studied for the first time [111, 112]. Investigations of heavy metal contamination of soils around the lead-and-zinc works in Veles, Republic of Macedonia [113], carried out by ENAA at the IBR-2 reactor of the FLNP laid the basis for preparing and publishing the Geochemical Atlas of Veles and
Environs [114]. In 2009 the international team of the authors of the Atlas was awarded the State Prize of the Government of Macedonia.
ENAA of the chemical composition of soils near some busy roads in Dubna (tunnel under the Moskva Canal) and Moscow (Shchelkovskoe and Minskoe highways) revealed the highest soil contamination level around the Shchelkovskoe highway [115]. It was shown that concentrations of Fe, Zn, Cr, Sb, and W exponentially decrease with increasing distance from the road. Data on the concentrations of Sb (group I toxicant) and W (hard metal) were obtained for the first time.
To assess the anthropogenic effect on the river Sestra, a tributary of the Volga, samples of water, bottom sediments, and biota were taken near the town of Klin (Moscow region) and investigated by NAA [116]. The results showed substantial technogenic contamination of the bottom sediments by a number of heavy metals (Fe >>> Zr > Mn > Zn > Cr > V > Ni = As > Co), and especially by cadmium, caused by textile and aircraft industry effluents.
Bottom sediment (BS) samples taken in the Danube delta were also investigated [117]. NAA was carried out using both epithermal neutrons (Dubna) and thermal neutrons (Bucharest, Romania).
The distribution of elements in unconsolidated bottom sediments sampled in unique cores from the depth of 600 m in the anoxic Black Sea area was studied [118-120]. Vertical distribution of seven macroelements (Na, Al, Cl, K, Ca, Ti, Fe) and 31 trace elements (Sc, V, Cr, Mn, Co, Ni, Zn, As, Se, Br, Rb, Sr, Zr, Mo, Sn, Sb, I, Cs, Ba, La, Ce, Nd, Sm, Eu, Tb, Yb, Hf, Ta, W, Th, U), including anthropogenic pollutants (Zn, As, Mo, Sn, Sb), was determined in the sediment cores using INAA. The results of the investigations allowed better insight into the dynamics of both the process of environment pollution and the process of sedimentation in the Danube delta under the effect of soil erosion, navigation, and anthropogenic activity in the Danube basin.
The distribution of pollutants in water bodies (as illustrated by the Oka River basin) and their transport by underground waters in the European part of Russia was studied in [121, 122]. ENAA of bottom sediments (BS), bivalve mussels, and fish tissues from different parts of the Rybinsk Reservoir freshwater ecosystem (Central Russia) allowed revealing environment pollution sources, such as Rybinsk and Cherepovets, the town known for Europe’s largest iron-and-steel works [123]. The concentrations of most elements in the BS are an order of magnitude larger than the concentrations of these elements in soft tissues of mussels (dreissena). The opposite trend is found only for calcium, cobalt, nickel, and zinc. Their concentrations in the dreissena body differed from their concentrations in the bottom sediment by no more than a factor of 2, and the concentrations of selenium and bromine in the dreissena body were an order of magnitude larger than in the bottom sediment. This not only means that most elements taken in by mussels are not accumulated, but excreted, from the organism [124], but also points to physiological significance of some essential macro- and microelements in the mussel organism. At the same time, it is known that, under considerable anthropogenic contamination, microelements can be accumulated in the organism in concentrations exceeding the physiologically necessary level. Under

NAA for Life Sciences at Frank Laboratory of Neutron Physics, Joint Institute for Nuclear Research …
295
these conditions the organism is incapable of controlling their uptake and excretion processes. Therefore, it is not impossible that high concentrations of zinc, cobalt, and nickel in the dreissena body are associated in our case with the influence of the Cherepovets iron-and-steel works, which is responsible for anthropogenic pollutants passing into the ecosystem.
ENAA in biotechnology of new pharmaceuticals and sorbents
One of the currently important fields in life sciences is scientific and applied biotechnology using the blue-green microalga Spirulina platensis (S. platensis), which has become one of the widely used objects since the 1990s. Spirulina biomass and products of its processing are used in various fields of the food, pharmaceuticals, and perfumeries industry; agriculture; medicine; and scientific research. This wide use of spirulina is due to its easy assimilation (85÷95%), high protein content (60÷70%), rich amino acid and vitamin composition, and a diversity of biologically active substances [125-127]. Spirulina is thought of as an effective stimulator and is able to produce antiviral and anticarcinogenic effect. It is often used in parallel with medical procedures applied to the organism for strengthening and purification purposes. Study has shown that S. platensis is able to biologically transform and endogenically add some essential trace elements, such as Se, I, Cr, Zn, and others. On the other hand, being a living organism, it accumulates elements in particular amounts depending on their concentration in the nutritional medium where S.
platensis cells grow. Trace elements are important for acid metabolism. Metals like Fe and Cu form free radicals, whereas Zn and Se are able to reduce their effect. Selenium is a normal component of some enzymes, proteins, and nucleic acids. A low Se level causes such diseases as cardiomyopathy, cancer, endemic osteoarthropathy, anemia, vision dysfunction, etc. Added in specified doses to a diet, Se favors treatment of cardiological diseases, lowers the risk of cancer and AIDS, slows down aging processes, etc. [128].
Another important trace element, iodine, is part of all plants and living organisms. It is vitally important for development and growth of an organism, contributing to metabolism and oxidation-reduction processes and influencing the functioning of the thyroid, immune system, etc. Iodine deficiency adversely affects mental, emotional, and some physiological functions of the organism [129]. Chromium is an element that is rather peculiar in its effect on the human organism. It is vitally important, but may be toxic as well. With its differing valence (from +2 to +6), chromium has two stable states, non-toxic Cr(III) and toxic Cr(VI). The toxic form Cr(VI) easily penetrates tissue cells and may produce a carcinogenic and genotoxic effect, participating in oxidation-reduction reactions [130, 131]. The most important function of chromium is sugar blood regulation (glucose tolerance factor). Chromium deficiency may result in lipid and fat metabolism derangement, growth suppression, loss of weight, impaired coordination of movements, etc. ENAA investigations of interaction of trace elements with the blue-green microalga S. platensis were jointly carried out by the scientists of the JINR team and Georgian biophysicists from the E.L. Andronikashvili Institute of Physics, Georgian Academy of Sciences (Tbilisi, Georgia) [132, 133]. The objective of the investigations was to substantiate the possibility of developing new pharmaceuticals and food additives on the basis of the spirulina biomass where vitally important elements (Se, I, Cr, and others) occur in the bioactive form. A wide range of useful substances in the S. platensis biomass combined with the specified elements
Marina V. Frontasyeva
296
in the necessary doses should produce an enhanced effect in prevention and treatment of various diseases. Biochemical experiments were carried at the Institute of Physics (Tbilisi, Georgia). The cultivation conditions and detailed description of the experimental procedure can be found in [134-137].
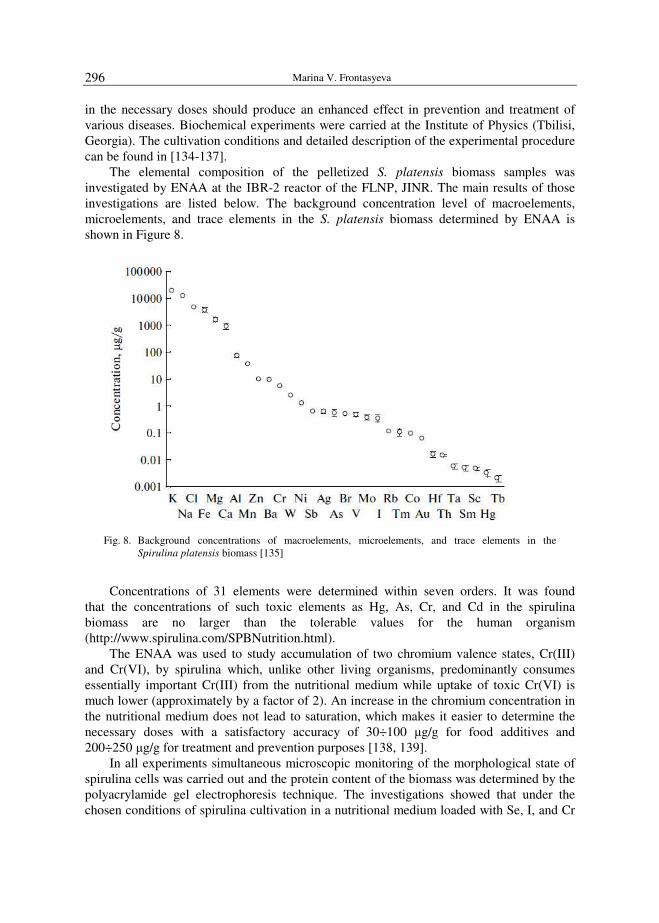
The elemental composition of the pelletized S. platensis biomass samples was investigated by ENAA at the IBR-2 reactor of the FLNP, JINR. The main results of those investigations are listed below. The background concentration level of macroelements, microelements, and trace elements in the S. platensis biomass determined by ENAA is shown in Figure 8.
Fig. 8. Background concentrations of macroelements, microelements, and trace elements in the
Spirulina platensis biomass [135]
Concentrations of 31 elements were determined within seven orders. It was found that the concentrations of such toxic elements as Hg, As, Cr, and Cd in the spirulina biomass are no larger than the tolerable values for the human organism (http://www.spirulina.com/SPBNutrition.html).
The ENAA was used to study accumulation of two chromium valence states, Cr(III) and Cr(VI), by spirulina which, unlike other living organisms, predominantly consumes essentially important Cr(III) from the nutritional medium while uptake of toxic Cr(VI) is much lower (approximately by a factor of 2). An increase in the chromium concentration in the nutritional medium does not lead to saturation, which makes it easier to determine the necessary doses with a satisfactory accuracy of 30÷100 µg/g for food additives and 200÷250 µg/g for treatment and prevention purposes [138, 139].
In all experiments simultaneous microscopic monitoring of the morphological state of spirulina cells was carried out and the protein content of the biomass was determined by the polyacrylamide gel electrophoresis technique. The investigations showed that under the chosen conditions of spirulina cultivation in a nutritional medium loaded with Se, I, and Cr
NAA for Life Sciences at Frank Laboratory of Neutron Physics, Joint Institute for Nuclear Research …
297
the quality and protein content of the biomass did not change. Thus, it was shown that pharmaceuticals could be made without losing the quality of the S. platensis biomass and the main regularities of accumulation of necessary trace elements by cells were determined.
The investigations also resulted in issuing two patents of the Russian Federation for methods for production of selenium- and chromium-containing preparations based on the biomass of the blue-green microalgae S. platensis [140, 141].
Features of the interaction of S. platensis with such a toxic metal as mercury were also investigated by ENAA. It was shown that, when Hg concentrations in the solution were about 100÷150 µg/dm3, the living spirulina biomass was capable of extracting mercury in the course of cultivation with adsorption dominating in a time interval of the order of minutes, being then followed by accumulation [142, 143]. Thus, the Spirulina platensis
biomass can be used as a sorbent of heavy metals. Apart from the Spirulina platensis
microalgae, another microorganism, bacteria Arthrobacter oxydans, was also investigated. The bacteria were isolated from basalt rocks and showed ability to reduce the toxic chromium form Cr(VI) to the non-toxic form Cr(III). It was shown that these bacteria could be successfully used for detoxification or immobilization of toxic agents [144-146]. Accumulation of chromium by bacteria Arthrobacter globiformis 151B in the presence of mercury was investigated in collaboration with the NAA group from Delft University (Netherlands) [147].
NAA in biotechnology for extraction of metals from poor ores, rocks, and production waste
NAA was also used to develop a method for bacterial leaching of some metals from poor ores, production waste, and rocks. As is known, microorganisms take an active part in geochemical processes of mineral formation, mineral diagenesis, and sedimentation both directly, by enzymatic action, and indirectly, by chemical interaction of their metabolism products with minerals. They act as agents favoring concentration, decomposition, or fractioning of mineral substances in natural cyclic processes of formation and destruction of rocks. The main mechanisms for bacterial separation of metals are biooxidation, bioreduction, acidolysis, bioaccumulation, biosorption, and complex formation. For each of these processes, there is a corresponding group of microorganisms capable of interacting in a particular way with some minerals or others. Natural organic mass of plant origin - peat of microbiological composition, including many aerobic and anaerobic forms - was used as a source of microorganisms. Peat suspension with the energy material for microorganisms and various additives stimulating their growth was kept under anaerobic conditions at the temperature 25÷28°C for 15-20 days. This allowed technically simple and economical activation of microorganisms capable of metabolism under oxygen deficiency. The solution obtained after filtration of the conditioned suspension was used in leaching experiments [148, 149]. The bacterial community of the peat suspension consisted of silicate, amonifying, manganese-reducing, spore-forming, and butyric acid bacteria and mold fungi. It was mainly behavior of rare, rare-earth, and radioactive metals that was studied in the leaching processes, but concentrations of such frequently occurring metals as Mn, Cu, Fe, K, Na, and many others were also determined for elucidating the nature and features of microbiological processes. The elemental composition of the samples was investigated by ENAA. The investigations showed that the peat suspension used as a growth solution
Marina V. Frontasyeva
298
contained a variety of active microorganisms capable of interacting with metals. Trends toward removal and concentration of some rare, precious, and radioactive metals in the investigated rocks, ores, and production waste were established, which indicates that the proposed bacterial leaching method is a promising tool for applications with various types of bacteria depending on the particular purpose (waste purification, extraction of scarce metals, enrichment in a required element, etc.).
Conclusions
The review of the studies dealing with the use of neutron activation analysis in the life sciences has shown the performance capability of this technique for solving practical problems that sometimes cannot be solved by other analytical techniques. Commissioning of the upgraded IBR-2M reactor with the improved parameters for INAA and improvement of experimental equipment will allow mass analyses of samples within international projects of the JINR team to be carried out at a new level. Accreditation of the JINR analytical laboratory to the ISO standards will make it one of the world’s best laboratories employing nuclear and related analytical techniques.
References [1] Vernadskii V.I.: Selected Works, in 5 vols. (Akad. Nauk SSSR, Moscow, 1954); vol. 5:
http://ver_nadsky.lib.ru (in Russian). [2] IAEA, NAHRES_75, Technical Report. IAEA, Vienna 2003, pp. 1-174. [3] Allan R.J. and Nriagu J.O. (Eds.): Heavy Metals in the Environment, IX. CEP Consultants. Edinburgh 1993,
1, pp. 1-458; 2, pp. 1-586. [4] Vernadskii V.I.: Biogeochemical Studies of 1922-1932. Akad. Nauk SSSR, Moscow, Leningrad 1940 (in
Russian). [5] Cotzias G.C.: Proc. 1st Ann. Conf. Trace Elements in Environ. Health, 1, D.D. Hemphill (Ed.). Univ.
Missouri, Columbia 1967, pp. 5-12. [6] Walker C.H., Hopkin S.P., Silby R.M. and Peakall D.B. (Eds.): Principles of Ecotoxicology. Taylor and
Francis, London 1997. [7] Anke M., Schneider H.J. and Bruckner C. (Eds.): Spurenelement Symposium: Arsen, East Germany. Jena
1980. [8] Levander O.A. and Cheng L. (Eds.): Micronutrient Interactions: Vitamins, Minerals and Hazardous
Elements. Ann. N.Y. Acad. Sci., New York 1980. [9] National Academy of Sciences, Recommended Dietary Allowances. Nat. Acad. of Sci., Washington, DC,
1980. [10] Mertz W.: Science, 1981, 213, 1332-1338. [11] John W.: Sci. Total Environ., 1983, 27, 21-29. [12] Bode P., De Bruin M. et al: Biol. Trace Element Res., 1990, 26-27, 377-383. [13] Wappelhorst O., Kuhn I., Oehlmann J. and Markert B.: Sci. Total Environ., 2000, 249, 243-256. [14] Wolterbeek H.T. and Verburg T.G.: Sci. Total Environ., 2004, 319, 53-64. [15] Weltje L. et al: Sci. Total Environ., 2002, 286, 191-214. [16] Weltje L.: Bioavailability of Lantanides to Freshwater Organisms. Speciation, Accumulation and Toxicity.
Delft University, the Netherlands, 2003. [17] Greenberg R.R., Bode P. and De Nadai Fernandes E.A.: Neutron activation analysis: A primary method of
measurement. Spectrochimica Acta, 2011, Part B, 66, 193-241. [18] Gaudry A., Joron J.L., Ayrault S., Bertho X. and Piccot D.: The Necessary Role of Neutron Activation
Analysis as a Bulk Multielement Method with Respect to ICP_MS and ICP_OES for Environmental and Earth Sciences Studies. Lab. Pierre Sue, CEA Saclay 2000.
[19] Bode P. and De Coeij J.J.M.: Activation Analysis, [in:] Encyclopedia of Environmental Analysis and Remediation, 1998, pp. 68-84.

NAA for Life Sciences at Frank Laboratory of Neutron Physics, Joint Institute for Nuclear Research …
299
[20] Steinnes E.: Proc. Int. Conf. on Hundred Years of X_Ray and Rod. RON_BEC 100, Feb. 21-24, 1996, India, pp. 157-167.
[21] Lansberger S., Larson S. and Wu D.: Anal. Chem., 1993, 65, 1506-1512. [22] Steinnes E.: Anal. Chim. Acta, 1971, 57, 249-255. [23] Steinnes E.: Some Neutron Activation Methods for the Determination of Minor and Trace Elements in
Rocks. Kjeller, Norway, 1972. [24] Steinnes E.: J. Radioanal. Nucl. Chem., 2000, 243, 235-239. [25] Frontasyeva M.V. and Steinnes E.: [in:] Harmonization of Health Related Environmental Measurements
Using Nuclear and Isotopic Techniques. IAEA, Vienna 1997, pp. 301-311. [26] Nazarov V.M., Pavlov S.S., Peresedov V.F. and Frontasyeva M.V.: Channels of Irradiation and
Pneumotransport Device on IBR-2, Kratk. Soobshch. OIYaI No. 6-85, Dubna 1985. [27] Nazarov V.M. and Frontasyeva M.V.: Proc. the 2nd All Union Workshop on Nuclear Physical Analysis
Methods in Environment Control. Gidrometeoizdat, Leningrad 1985, pp. 156-161. [28] Nazarov V.M., Pavlov S.S., Herrera E. and Frontasyeva M.V.: J. Radioanal. Nucl. Chem. Articles, 1993,
167, 11-21. [29] Peresedov V.F. and Rogov A.D.: J. Radioanal. Nucl. Chem., 1996, 214, 277-283. [30] Frontasyeva M.V. and Pavlov S.S.: [in:] Problems of Modern Physics. A.N. Sisakyan and V.I. Trubetskov
(Eds.). JINR, Dubna 1999, pp. 152-158 (in Russian). [31] Ostrovnaya T.M. et al: [in:] Activation Analysis in Environment Protection. D-14-93-325. Dubna 1993,
pp. 319-326. [32] Kucera J., Bode P. and Stepanek V.: J. Radioanal. Nucl. Chem., 2000, 245, 115-122. [33] Kucera J.: Presentation at IAEA TC Workshop in Dubna. 14-16 Nov., Dubna 2005. [34] Peresedov V.F. et al: Using of Neutron Activation Analyis on IBR 2 Reactor for Solving of Atmospheric
Monitoring Problems. Kratk. Soobshch. OIYaI No. 3 [95]-99, 43-54 (Dubna, 1999). [35] Frontasyeva M.V., Ramadan A.B. and Galinskaya T.E.: [in:] Weekly Cycles of Element Pollutants in Air of
the Greater Cairo Area (Egypt) Studied by Neutron Activation Analysis. Proc. the Intern. Aerosol Conf. Moscow, Russia, 26-30 June, 2000, pp. 136-142.
[36] Cerveny R.S. and Balling R.C. Jr.: Nature, 1998, 394, 561-563. [37] Meresova J., Florek M., Holy K., Ješkovsky M., Sy’kora I., Frontasyeva M.V., Pavlov S.S. and Bujdoš M.:
Atmos. Environ., 2008, 42, 8079-8085. [38] Curlik J. and Šefcik P.: Geochemical Atlas of the Slovak Republic. Soil. Ministry of Environment of Slovak
Republic, 1999. [39] Rahn K.A.: The Chemical Composition of the Atmospheric Aerosols. Technical Report. Graduate School of
Oceanography, Univ. of Rhode Island, 1976. [40] Markert B.A., Breure A.M. and Zechmeister H.G.: Bioindicators & Biomonitors. Principles, Concepts and
Applications. Trace Metals and other Contaminants in the Environment, 6. Elsevier, 2003, 1004 p. [41] Nazarov V.M., Frontasyeva M.V., Peresedov V.P. and Nikonov V.V.: J. Radioanal. Nucl. Chem., 1995,
192, 229-238. [42] Nazarov V.M., Frontasyeva M.V., Peresedov V.P. et al: Epithermal Neutron Activation Analysis of Moss,
Lichen and Pine Needles in Atmospheric Deposition Monitoring, JINR Rapid Commun. No. 3[71]_95, Dubna 1995, pp. 25-34.
[43] Frontasyeva M.V. and Steinnes E.: J. Radioanal. Nucl. Chem., 2005, 265, 11-15. [44] Tyler G.: Proc. the 2nd Intern. Clean Air Congress. Englund H.M. and Berry W.T. (Eds.). Academic Press,
New York 1970. [45] Ruehling Е. and Tyler G.: Bot. Notiser, 1968, 121, 321-342. [46] Puustjarvi V.: Arch. Soc. Zool. Bot. Fenn. Vanamo, 1995, 9 (Suppl.), 257-272. [47] Berg T. and Steinnes E.: Environ. Pollut., 1997, 98, 61-71. [48] Rueling A. and Steinnes E. (Eds.): European Atlas: Atmospheric Heavy Metal Deposition in Europe
1995-1996, Nord 1998, 15. [49] Buse A., Norris D., Harmens H., Buker P., Ashenden T. and Mills G. (Eds.): European Atlas: Heavy Metals
in European Mosses: 2000/2001 Survey, UNECE ICP Vegetation, Centre for Ecology and Hydrology, Univ. of Wales Bangor, UK 2003.
[50] Harmens H. and Norris D. (Eds.): European Atlas: Spatial and Temporal Trends in Heavy Metal Accumulation in Mosses in Europe (1990-2005). UNECE ICP Vegetation, Centre for Ecology & Hydrology, Univ. of Wales Bangor, UK, 2008.
[51] Lucaciu A., Frontasyeva M.V., Steinnes E. et al: J. Radioanal. Nucl. Chem., 1999, 240, 457-458. [52] Ermakova E.V., Frontasyeva M.V. and Steinnes E.: J. Radioanal. Nucl. Chem., 2004, 259, 51-58.

Marina V. Frontasyeva
300
[53] Ermakova E.V., Frontasyeva M.V. and Steinnes E.: Ecologic Chemistry. TEZA, St. Petersburg, 2004, 13(3), 167-180 (in Russian).
[54] Ermakova E.V., Frontasyeva M.V., Pavlov S.S., Povtoreyko E.A., Steinnes E. and Cheremisina Ye.N.: J. Atmos. Chem. 2001, 49, 549-561.
[55] Vergel’ K.N., Frontasyeva M.V., Kamanina I.Z. and Pavlov S.S.: Ekol. Urbaniz. Territorii, 2009, 3, 88-95.
[56] Frontasyeva M.V., Steinnes E., Lyapunov S.M., Cherchintsev V.D. and Smirnov L.I.: Ecol. Industrial Regions in the Beginning of 21st Century. Collected vol., Magnitogorsk 1999, pp. 7-13.
[57] Frontasyeva M.V., Steinnes E., Lyapunov S.M., Cherchintsev V.D. and L.I. Smirnov, J. Radioanal. Nucl. Chem., 2000, 245, 415-420.
[58] Smirnov L.I., Frontasyeva M.V. and Steinnes E.: At. Energ., 2004, 97, 68-74. [59] Pankratova Yu.S., Zel’nichenko N.I., Frontasyeva M.V. and Pavlov S.S.: Probl. Regional. Ekol., 2009, (1),
57-63. [60] Steinnes E., Frontasyeva M.V., Eidkhammer-Sjebak T. and Varskog P.: Ekolog. Khim. (St. Petersburg),
2004, 13, 100-111. [61] Grodzinska K., Szarek-Lukaszewska G., Frontasyeva M.V., Pavlov S.S. and Gundorina S.F.: Polish
J. Environ. Studies, 2005, 14, 171-178. [62] Grodzinska K., Frontasyeva M.V. et al: Env. Mon. Assess., 2003, 87, 255-270. [63] Korzekwa S., Pankratova Yu.S. and Frontasyeva M.V.: Ecol. Chem. Eng., 2007, 1, 43-51. [64] Kłos A., Rajfur M., Wacławek M., Wacławek W., Frontasyeva M.V. and Pankratova Yu.S.: Water, Air, Soil
Pollut., 2008, 191, 345-352. [65] Stamenov J., Iovchev M., Vachev B., Gueleva E., Yurukova L., Ganeva A., Mitrikov M., Antonov A.,
Strentz A., Varbanov Z., Batov I., Damov K., Marinova E., Frontasyeva M.V., Pavlov S.S. and Strelkova L.P.: New Results from Air Pollution Studies in Bulgaria (Moss Survey 2000-2001). JINR Preprint No. E14-2002-204 (Dubna, 2002).
[66] Marinova S.G., Frontasyeva M.V., Yurukova L.D., Strelkova L.P. and Marinov A.T.: Proc. of 6th Int. Conf. the Balkan Physical Union, CP899, Ed. S.A. Cetin and I. Hikmet, vol. 978 (Amer. Inst. of Physics, 2007), p. 740, http://proceedings.aip.org/proceedings/cpcr.jsp.
[67] Marinova S., Yurukova L., Frontasyeva M.V., Steinnes E., Strelkova L.P., Marinov A. and Karadzhinova A.G.: Ecol. Chem. Eng. 2010, 17, 37-52.
[68] Florek M., Mankovska B., Oszlanyi J., Frontasyeva M.V. et al: Ekologia (Bratislava), 2007, 26, 99-114.
[69] Frontasyeva M.V., Meresova J., Holy K. and Sykora I.: Acta Phys. Univ. Comenianae, 2010, L-LI (1-2), 155-161.
[70] Lucaciu А., Frontasyeva M.V., Steinnes E., Cheremisina E.N., Oprea C.D., Progulova T.B., Spiridon S., Staicu L. and Timofte L.: Atmospheric deposition of heavy metals in Romania studied by the moss
biomonitoring technique employing nuclear and related analytical techniques and GIS technology. J. Radioanalyt. Nuclear Chem., 1999, 240(2), p. 457-458.
[71] Culicov O.A., Frontasyeva M.V., Steinnes E., Okina O., Santa Z. and Todoran R.: Radioanal. Nucl. Chem., 2002, 254, 109-115.
[72] Lucaciu A., Timofte L., Culicov O., Frontasyeva M.V., Oprea C., Cucu-Man S., Mocanu R. and Steinnes E.: J. Atm. Chem., 2004, 49, 533-548.
[73] Cucu-Man S., Mocanu R., Culicov O., Steinnes E. and Frontasyeva M.V.: Int. J. Environ. Anal. Chem., 2004, 84, 845-854.
[74] Stihi C., Popescu I.V., Gheboianu A., Frontasyeva M., Ene A., Dima G., Bute O., Cimpoca V., Stihi V., Oros C., Dinu S. and Voicu M.: Mineral content of native vegetables obtained by energy dispersive X-ray
fluorescence spectrometry. J. Sci. Arts, 2008, 2(9), 331-334. [75] Blum O.B., Culicov O. and Frontasyeva M.V.: Bioindication and Environmental Awareness, [in:] Urban
Air Pollution, Proc. the EuroBionet 2002, Stuttgart, Germany, 2-6 Nov., 2002, A. Klumpp, W. Ansel and G. Klumpp (Eds.). Cuvillier, Gottingen 2004, pp. 249-255.
[76] Alekseenok Y.V., Frontasyeva M.V. and Korokin A.Zh.: Proc. 5th Int. Summer School on Nuclear Physics Methods and Accelerators in Biology and Medicine, 6-15 July, 2009, Bratislava, Slovakia (Amer. Inst. Physics, 2009), P. 2.
[77] Frontasyeva M.V., Galinskaya T.Ye., Krmar M., Matavuly M., Pavlov S.S., Povtoreyko E.A., Radnovich D. and Steinnes E.: J. Radioanal. Nucl. Chem., 2004, 259, 141-147.
[78] Krmar M., Radnovi D., Frontasyeva M.V., Pavlov S.S. and Pankratova Yu.S.: [in:] Advances in Environ. Modelling and Measurements. D. Mihailović and B. Lalić (Eds.). Nova Sci. Publishers, New York 2009.

NAA for Life Sciences at Frank Laboratory of Neutron Physics, Joint Institute for Nuclear Research …
301
[79] Krmar M., Radnović D. and Frontasyeva M.V.: Moss biomonitoring technique used to study spatial and
temporal atmospheric deposition of heavy metals and airborne radionuclides. [in:] Advances in Environ. Modeling and Measurement. D. Mihailović and B. Lalić (Eds.). Nova Sci. Publishers, New York 2011.
[80] Barandovski L., Cekova M., Frontasyeva M.V., Pavlov S.S., Stafilov T., Steinnes E. and Urumov V.: Env. Monit. Assess., 2008, 138, 107-118.
[81] Spiric Z., Frontasyeva M.V., Steinnes E. and Stafilov T.: JINR Preprint E18-2009-149 (Dubna, 2009). Int. J. Environ. Analyt. Chem., 2011 (in press).
[82] Mahmut C.K., Frontasyeva M.V., Steinnes E. et al: Bull. Environ. Contamin. Toxicol., 2005, 74, 201-209.
[83] Holy M., Pesch R., Schröder W., Harmens H., Ilyin I., Alber R., Aleksiayenak Yu., Blum O., Coşkun M., Dam M., Temmerman L.De., Frolova M., Frontasyeva M., Miqueo L.G., Grodzińska K., Jeran Z., Korzekwa S., Krmar M., Kubin E., Kvietkus K., Leblond S., Liiv S,, Magnússon S., Maňkovská B., Piispanen J., Rühling Å., Santamaria J., Simoncic P., Steinnes E., Suchara I., Thöni L., Urumov V., Yurukova L. and Zechmeister H.G.: First thorough identification of factors associated with Cd, Hg and Pb
concentrations in mosses sampled in the European Surveys 1990, 1995, 2000 and 2005. J. Atmos. Chem., 2010, 63(2), 109-124.
[84] Harmens H., Norris D.A., Steinnes E., Kubin E., Piispanen J., Alber R., Aleksiayenak Y., Blum O., Coşkun M., Dam M., Temmerman L.De., Fernández Escribano J.A., Frolova M., Frontasyeva M., Gonzalez Miqueo L., Grodzińska K., Jeran Z., Korzekwa S., Krmar M., Kvietkus K., Leblond S., Liiv S., Magnússon S., Maňkovská B., Pesch R., Rühling Å., Santamaria J., Schröder W., Spiric Z., Suchara I., Thöni L., Urumov V., Yurukova L., Zechmeister H.G.: Mosses as biomonitors of atmospheric heavy metal
deposition: spatial and temporal trends in Europe. Environ. Pollut., 2010, 158(10), 3144-3156. [85] Schröder W., Holy M., Pesch R., Harmens H., Ilyin I., Alber R., Aleksiayenak Yu., Blum O., Coşkun M.,
Dam M., Temmerman L.De., Frolova M., Frontasyeva M., Miqueo L.G., Grodzińska K., Jeran Z., Korzekwa S., Krmar M., Kubin E., Kvietkus K., Leblond S., Liiv S., Magnússon S., Maňkovská B., Piispanen J., Rühling Å., Santamaria J., Simoncic P., Spiric Z., Steinnes E., Suchara I., Thöni L., Urumov V., Yurukova L., Zechmeister H.G.: Are cadmium, lead and mercury concentrations in mosses
across Europe primarily determined by atmospheric deposition of these metals? J. Soils and Sediments, 2010, 10, p. 1572-1584. DOI 10.1007/s11368-010-0254-y.
[86] Shao J., Zhang Z., Chai Z., Mao X., Lu Y., Stan O., Frontasyeva M.V. and Wu P.: J. Nucl. Radiochem., 2002, 24(6), 15-27 (in Chinese).
[87] Kang Y., Lee D., Kim G., Frontasyeva M.V., Pavlov S.S. and Galinskaya T.Y.: Proc. the Workshop on Nuclear Data Production and Evaluation, Kaeri/Gp_176/2001, 2001, pp. 141-148.
[88] Baljinnyam N., Gerbish S., Ganbold G., Lodoysamba S. and Frontasyeva M.V.: Proc. 2nd Intern. Conf. on X-Ray Analysis. Ulaanbaatar, Mongolia 2009, pp. 185-193.
[89] Nguyen V.H., Frontasyeva M.V., Trinh T.T., Gilbert D. and Bernard N.: Environ. Sci. Pollut. Res. 2010, 17, 5, 1045-1052.
[90] Anicic M., Tasic M., Frontasyeva M.V. et al: Environ. Pollut., 2009, 157, 673-679. [91] Anicic M., Frontasyeva M.V., Tomaševic M. and Popovic A.: Environ. Mon. Assess., 2007, 129, 207-219. [92] Blaszczak Z., Ciszewska I. and Frontasyeva M.V.: Proc. of the EXON. Dubna 2004, 353-360. [93] Culicov O., Mocanu R., Frontasyeva M.V., Yurukova L. and Steinnes E.: Environ. Mon. Assess., 2005,
108, 229-240. [94] Culicov O. and Yurukova L.: J. Atmos. Chem., 2006, 55, 1-12. [95] Saitanis K., Frontasyeva M.V. and Steinnes E.: Proc. the BioMAP-5, 20-24 Sept. 2009. Buenos Aires,
Argentina 2009, 25. [96] Anicic M., Tomaševic M., Tasic M., Rajšic S., Popovic A., Frontasyeva M.V., Lierhagen S. and Steinnes E.:
J. Hazard. Mater., 2009, 171, 182-190. [97] Gorbunov A.V., Lyapunov S.M., Okina O.I., Frontasyeva M.V. and Gundorina S.F.: Ekolog. Khim.
(St. Petersburg), 2006, 15, 47-59. [98] Gorbunov A.V., Frontasyeva M.V., Kistanov A.A., Lyapunov S.M., Okina O.I. and Ramadan A.B.:
J. Environ. Sci. Health, Part B: Pesticides, Food Contaminants, Agricultural Wastes, 2003, 38, 181-192. [99] Gorelova S.V., Pestsov G.V., Gins M.S., Kononkov P.F., Frontasyeva M.V. et al: Agrokhimiya, 2009, (9),
76-87. [100] Gorbunov A.V., Lyapunov S.M., Okina O.I., Frontasyeva M.V. and Pavlov S.S.: Assessment of Factors
Influencing Trace Element Content of Mushrooms from European Part of Russia. Preprint JINR, D-18-2009-17 (Dubna, 2009) (in Russian).
Marina V. Frontasyeva
302
[101] Gorbunov A.V., Gundorina S.F., Onischenko T.L. and Frontasyeva M.V.: J. Radioanal. Nucl. Chem., 1989, 129, 443-451.
[102] Volokh A.A., Gorbunov A.V., Gundorina S.F., Revich B.A., Frontasyeva M.V. and Pal C.S.: Sci. Total Environ., 1990, 95, 141-148.
[103] Gorbunov V., Golubchikov V.V., Lyapunov S.M., Onishchenko T.L., Okina O.I., Kistanov A.A., Frontasyeva M.V. and Rakcheeva L.V. Ekolog. Khim. (St. Petersburg), 2001, 10, 255-268.
[104] Pantelica A., Oprea C., Frontasyeva M.V. et al: J. Radioanal. Nucl. Chem., 2004, 262, 111-118. [105] Gorbunov A.V., Lyapunov S.M., Okina O.I. and Frontasyeva M.V.: Inzh. Fiz., 2007, 5(6), 113-124. [106] Biziuk M., Astel A., Rainska E., Sukowska Z., Bode P. and Frontasyeva M.: LANL: Anal. Letters, 2010,
43(7), 1242-1256. [107] Rainska E., Biziuk M., Sarbu C., Szczepaniak K., Frontasyeva M.F., Culicov O., Bode P. and Astel A.:
J. Environ. Sci. Health, Part A, 2005, 40, 2137-2152. [108] Szczepaniak K., Sarbu C., Astel A., Rainska E., Buziuk M., Culikov O., Frontasyeva M.V. and Bode P.:
Central Eur. J. Chem., 2006, 4, 29-55. [109] Nikonov V.V., Lukina N.V., Besel’ V.S., Bel’skii E.A., Bespalova A.Yu., Golovchenko A.V.,
Dobrovol’skaya T.G., Dobrovol’skii V.V., Zukert N.V., Isaeva L.G., Lapenis A.G., Maksimova I.A., Marfenina O.E., Panikova A.N., Pinskii D.L., Polyanskaya L.M., Steinnes E., Utkin A.I., Frontasyeva M.V., Tsibul’skii V.V., Chernov I.Yu. and Yatsenko-Khmelevskaya M.A.: Trace Elements in Boreal Forests. A.S. Isaev (Eds.). Nauka, Moscow 2003 (in Russian).
[110] Tyutyunova F.I., Frontasyeva M.V., Grachevskaya E.M. and Shchipakina I.G.: Antropogeneous Scattering of Heavy Metals in Boreal Zone of European Russia. Scientific Aspects of Ecological Problems of Russia. Nauka, Moscow 2001, pp. 307-314 (in Russian).
[111] Nikonov V.V., Lukina N.V. and Frontasyeva M.V.: Pochvovedenie, 1999, (12), 1492-1501. [112] Nikonov V.V., Lukina N.V. and Frontasyeva M.V.: Pochvovedenie, 1999, (3), 370-382. [113] Stafilov T., Šajn R., Panevski Z., Boev B., Frontasyeva M.V. and Strelkova L.P.: J. Hazard. Mater., 2010,
175, 103, 896-914. [114] Stafilov T., Šajn R., Panevski Z., Boev B., Frontasyeva M.V. and Strelkova L.P.: Geochemical Atlas of
Veles and Environs. 2nd Aug., Stip, Macedonia 2008. [115] Sudnitsyn I.I., Krupenina I.I., Frontasyeva M.V., Pavlov S.S. and Gundorina S.F.: Agrokhimiya, 2009, (7),
66-70. [116] Morzhukhina S.V., Uspenskaya V.V., Chermnikh L.P., Khodakovsky I.L., Frontasyeva M.V. and
Gundorina S.F.: Proc. NATO ARW on Man Made Radionuclides and Heavy Metals in the Environment. M.V. Frontasyeva, P. Vater and V.P. Perelygin (Eds.). NATO Science Series, IV: Earth and Environmental Sciences, 2001, 5, pp. 195-200.
[117] Dinescu L.C., Culicov O.A., Duliu O.G., Frontasyeva M.V. and Oprea C.D.: J. Trace Microprobe Tech., 2003, 21, 665-676.
[118] Cristache C., Gmeling K., Culicov O., Frontasyeva M.V., Toma M. and Duliu O.G.: J. Radioanal. Nucl. Chem., 2009, 279, 7-12.
[119] Duliu O.G., Cristache C., Oaie G., Culicov O., Frontasyeva M.V. and Toma M.: Marine Pollut. Bull., 2009, 58, 827-831.
[120] Duliu O.G., Cristache C.I., Culicov O.A., Frontasyeva M.V., Szobotca S.A. and Toma M.: Appl. Radiat. Isotopes, 2009, 67, 939-943.
[121] Frontasyeva M.V.: Using of Nuclear Physics Methods in Pollutant Analysis on Aqueous Objects (on the Example of River Ob’ Basin), [in:] Monitoring of Aqueous Objects. Proc. the 1st Regional School-Seminar, Dubna, Aug. 1996, G.M. Barenboim and E.V. Venitsianov (Eds.). GTsVM, Moscow 1998, pp. 122-135.
[122] Tyutyunova F.I., Frontasyeva M.V. and Shchipakina I.G.: Vodn. Resur., 2006, 33, 484-491 (Water Resource 2006, 33, 446).
[123] Pavlov D.F., Frontasyeva M.V., Pavlov S.S. and Pankratova Yu.S.: Ovidius Univ. Ann. Chem., 2005, 16, 72-75.
[124] Wiesner L., Gnter B. and Fenske C.: Hydrobiologia, 2001, 443, 137-145. [125] Fox D.: Health Benefits of Spirulina. [in:] Spirulina, Algae of Life, Bullet., 1993, (12), 356-390. [126] Belay A., Ota Y., Miykawa K. and Shimamatsu H.: J. Appl. Phycol., 1993, (5), 235-241. [127] Vonshak A. (Ed.): Spirulina Platensis (Arthrospira): Physiology, Cell Biology and Biotechnology. Taylor
and Francis, London 1997. [128] Atkins J.F. and Gestland R.F.: Nature, 2000, 407, 463-464. [129] Voinar A.I.: Trace Elements in Nature. Moscow 1962, pp. 74-92 (in Russian).
NAA for Life Sciences at Frank Laboratory of Neutron Physics, Joint Institute for Nuclear Research …
303
[130] Mosulishvili L.M., Shoniya N.I., Katamadze N.M. and Ginturi E.I.: Med. Radiol., 1990, (1), 42-45. [131] Anderson R.A.: [in:] Essential and Toxic Trace Elements in Human Health and Diseases. A.S. Prasad
(Eds.). Alan R. Liss, New York 1988, pp. 189-197. [132] Mosulishvili L.M., Tsibakhashvili N.Ya., Kirkesali E.I., Tsertsvadze L.A., Frontasyeva M.V.
and Pavlov S.S.: Bull. Georgian Nat. Acad. Sci., 2008, 2(3), 88-95. [133] Frontasyeva M.V., Tsibakhashvili N., Mosulishvili L. and Kirkesali E.I.: Algae for the Production of
Pharmaceuticals, [in:] Bioprocesses Sciences and Technology. F. Columbus (Eds.). Nuovo Publ., New York 2010.
[134] Mosilishvili L.M., Kirkesali Ye.I., Belokobylsky A.I., Khizanishvili A.I., Frontasyeva M.V., Pavlov S.S. and Gundorina S.F.: J. Pharm. Biomed. Anal., 2002, 30, 87-97.
[135] Mosilishvili L.M., Kirkesali Ye.I., Belokobylsky A.I., Khizanishvili A.I., Frontasyeva M.V., Gundorina S.F. and Oprea C.D.: J. Radioanal. Nucl. Chem., 2002, 252, 15-20.
[136] Mosulishvili L.M., Belokobylsky A.I., Kirkesali E.I., Frontasyeva M.V., Pavlov S.S. and Aksenova N.G.: Neutron Res., 2007, 15, 49-54.
[137] Mosulishvili L.M., Kirkesali E.I., Belokobylsky A.I., Khizanishvili A.I., Frontasyeva M.V., Pavlov S.S. and Gundorina S.F.: Pis’ma Fiz. Elem. Chastits At. Yadra, 2001, (4), 110-117.
[138] Frontasyeva M.V., Pavlov S.S., Mosulishvili L.M., Kirkesali E.I., Ginturi E. and Kuchava N.: Ecol. Chem. Eng. S, 2009, 16(3), 277-285.
[139] Frontasyeva M.V., Pavlov S.S., Aksenova N.G., Mosulishvili L.M., Belokobylsky A.I., Kirkesali E.I., Ginturi E.N. and Kuchava N.E.: Zh. Anal. Khim. 2009, 64, 776-789 (J. Anal. Chem. 2009, 64, 746).
[140] Mosulishvili L.M., Belokobylsky A.I., Khizanishvili A.I., Kirkesali E.I., Frontasyeva M.V. and Pavlov S.S.: Method of development of selenium-containing spirulina biomass medication. RF Patent No. 2001106901/14(007221), 2003.
[141] Mosulishvili L.M., Belokobylsky A.I., Kirkesali E.I., Frontasyeva M.V. and Pavlov S.S.: Method of development of cromium-containing spirulina biomass medication. RF Patent No. 2002115679/15(016488), 2003.
[142] Mosulishvili L.M., Belokobylsky A.I., Khizanishvili A.I., Kirkesali E.I., Frontasyeva M.V. and Aksenova N.G.: Ekolog. Khim. (St. Petersburg), 2005, 14, 104-109.
[143] Frontasyeva M.V., Kirkesali E.I., Aksenova N.G., Mosulishvili L.M., Belokobylsky A.I. and Khizanishvili A.I.: J. Neutron Res., 2006, 14, 131-138.
[144] Tsibakhashvili N.Ya., Frontasyeva M.V. et al: Anal. Chem., 2006, 78, 6285-6290. [145] Tsibakhashvili N., Mosulishvili L., Kalabegishvili T., Kirkesali E., Murusidze I., Kerkenjia S.,
Frontasyeva M. and Holman H.Y.: J. Radioanal. Nucl. Chem., 2008, 278, 357-370. [146] Tsibakhashvili N.Ya., Mosulishvili L., Kirkesali E., Kalabegishvili T., Kerkenjia S., Frontasyeva M.V.
and Zinicovscaia I.: Chem. (J. Moldova) Gen., Industr. Ecol. Chem., 2009, 4(2), 8-13. [147] Tsibakhahsvili N., Mosulishvili L., Kirkesali E., Kerkenjia S., Frontasyeva M.V., Pavlov S.S.,
Zinicovscaia I.I., Bode P. and van Meerten Th.G.: NAA for studying detoxification of Cr and Hg
by Arthrobacter globiformis 151B. J. Radioanalytical and Nuclear Chem., 2010, 286(2), 533-537. DOI 10.1007/s10967-010-0815-y.
[148] Tsertsvadze L.A., Dzadzamia T.D., Petreashvili Sh.G., Shutkerashvili G.G., Kirkesali E.I., Frontasyeva M.V., Pavlov S.S. and Gundorina S.F.: [in] Radionuclides and Heavy Metals in Environment. M.V. Frontasyeva, P. Vater and V.P. Perelygin (Eds.). NATO Sci. Series, Ser. IV: Earth and Environ. Sci., 2001, 5, pp. 245-257.
[149] Tsertsvadze L.A., Dzadzamia T.D., Buachidze G.I., Petreashvili Sh.G., Shutkerashvili D.G., Kirkesali E.I., Frontasyeva M.V., Pavlov S.S. and Gundorina S.F.: [in:] Sergeev’ Reading, No. 6, Engineering Geology and Protection of Geologic Media. Modern State and Developments Prospects. Proc. the Annual Session of Sci. Council of RAS on Problems of Geoecology, Eng. Geology and Hydrogeol., 23-24 Mar. 20.
NAA W NAUKACH O ŻYCIU W LABORATORIUM FIZYKI NEUTRONOWEJ
ZJEDNOCZONEGO INSTYTUTU BADAŃ JĄDROWYCH W DUBNEJ
Abstrakt: Omówiono zastosowanie konwencjonalnej i epitermalnej neutronowej analizy aktywacyjnej w niektórych ważnych obszarach nauk przyrodniczych. Przez ponad 25 lat swojej działalności radioanalitycznej kompleks REGATA przy reaktorze IBR-2 w Dubnej stał się źródłem danych analitycznych do badania

Marina V. Frontasyeva
304
środowiska, geologii morskiej, bionanotechnologii i medycyny itd. Mimo wielu konkurencyjnych, niejądrowych technik analitycznych (AAS, ICP-ES, ICP-MS, itp.) neutronowa analiza aktywacyjna (NAA) jest nadal najlepszą, podstawową wielopierwiastkową techniką analityczną zapewniającą ilościowe oznaczenie stężenia pierwiastków śladowych na bardzo niskim poziomie. W połączeniu z nowoczesnymi statystycznymi technikami przetwarzania dużych ilości danych, technologią GIS (system informacji geograficznej), elektronową mikroskopią skaningową, tomografią i innymi NAA pozwala na otrzymywanie ważnych w praktyce wyników, które zostały przedstawione w tym przeglądowym artykule.
Słowa kluczowe: epitermalna neutronowa analiza aktywacyjna, reaktor IBR-2, ochrona środowiska, biotechnologia

ECOLOGICAL CHEM ISTRY AND ENGINEERING S
Vol. 18, No. 3 2011
Bogdan ZYGMUNT1*, Anna BANEL1 and Marta WASIELEWSKA1
INCREASINGLY GREEN APPROACHES TO THE DETERMINATION OF SELECTED TRACE ORGANICS
IN COMPLEX MATRICES. SHORT CHAIN CARBOXYLIC ACIDS
OZNACZANIE ŚLADOWYCH ILOŚCI ZWIĄZKÓW ORGANICZNYCH W PRÓBKACH O ZŁOŻONYCH MATRYCACH ZGODNIE
Z REGUŁAMI „ZIELONEJ CHEMII ANALITYCZNEJ”. KRÓTKOŁAŃCUCHOWE KWASY KARBOKSYLOWE
Abstract: Nowadays the great stress is put on environment protection and the activities to minimize the effect of chemical analyses on the environment are discussed. When environmentally friendly methodologies of analytes determination are applied the term “green analytical chemistry” is used. In general, the determination of organic compounds in complex matrices, which is a frequent analytical task, requires separation of sample components and often analytes enrichment. The latter has often been regarded as responsible for environment damaging effects to a higher degree, and this aspect of analysis was emphasized and characteristics of particular techniques reviewed. Methodologies to determine low molecular organic acids in a variety of sample compositions are comprehensively described and compared with respect to environmental impact and results quality. The trends to make the sample treatment as well as separation increasingly green have been inferred and supported by personal experience and literature evidence.
Keywords: green analytical chemistry (GAC), trace organics, sample preparation, analytical separation, organic acids
Introduction
Nowadays the environmental consciousness of mankind is relatively high and it is still increasing. Care to protect the environment from degradation has resulted in formulation of a set of rules, known as the 12 Principles of Green Chemistry [1, 2]. The very term “green chemistry” was coined by Anastas in 1991 [3]. Environmentally friendly approach is based on, among others, improving process economy, waste reduction, and elimination of risks and hazards in large-scale industrial processes [4], resulting in the environment of better quality, which, certainly should be monitored. One of important elements of quality monitoring of a given environmental compartment is determination of a variety of organic
1 Department of Analytical Chemistry, Chemical Faculty, Gdansk University of Technology, ul. G. Narutowicza 11/12, 80-233 Gdańsk, phone 58 347 23 94, fax 58 347 26 94 * Corresponding author: [email protected]

Bogdan Zygmunt, Anna Banel and Marta Wasielewska
306
compounds. In many samples, the concentration of polluting organics can differ by several orders of magnitude. Some must be determined with high precision and accuracy even if present at very low concentration. The analytical tasks of that kind can be a challenge for many analytical laboratories and need the analytical instrumentation of high separation power, sensitivity and selectivity. Determination of trace organic components in samples of complex matrices must generally be preceded by sample pretreatment consisting in selective analyte isolation and enrichment from a large sample. If this is the case, the monitoring process itself can be a significant source of pollution, unless environmentally friendly or green analytical procedures are employed. For many years attempts have been made to reduce possible impact of analytical activities on the environment. In the process Green
Analytical Chemistry (GAC) emerged, whose methods were first described in 1995 [5-7]. GAC incorporates the activities to develop new analytical technologies and to modify old analytical procedures so as to make chemical analysis less harmful to the environment [8, 9]. Implementation of the principles of green chemistry to analytical chemistry was comprehensively discussed at the Second International Symposium on Green/Sustainable Chemistry and the discussion is continued [10]. Quite a few excellent reviews on different aspects of GAC have been published quite recently [11-16]. Armenta et al [11] discuss the fundamentals of GAC, paying special attention to the strategies and tools to make analytical procedures greener. The current state of green analytical chemistry emphasizing sample preparation methods and progress in miniaturization is summarized in a tutorial review [12]. Reviews on determination of organic pollutants in aquatic environment and preparation of samples of different origin for trace organic analysis were published in 2010 [13] and 2009 [14], respectively. Separate reviews were devoted to greening analytical chromatography [15] and methodologies combining liquid phase microextraction with capillary electrophoresis [16].
Each step of chemical analysis should be taken into consideration in the process of making a given analytical procedure green or clean or environmentally friendly. The great effort has been made to reduce amounts of solvents, reagents, waste, energy and costs as well as to miniaturize analytical equipment. Miniaturization results in drastic reduction of the aforementioned elements. In determination of trace organics in the presence of many other sample components, especially those present at much higher concentrations special attention should be paid to the two basic steps, ie, sample preparation and the analysis proper using efficient separation.
In this paper the discussion of making the chemical analysis greener will be focused on short chain carboxylic acids (SCCA). These organic analytes are of great significance in the case of municipal and dairy farm wastewater, municipal solid waste leachate, animal farming, some food products, etc. SCCAs include volatile monocarboxylic acids or volatile
fatty acids (VFA) containing up to 7-8 carbon atoms in a molecule, dicarboxylic acids, hydroxyacids, ketoacids, etc. The green approach to sample preparation for gas chromatographic determination of VFAs in wastewater was dealt with elsewhere [17]. This paper is focused rather on a separation step of a wider spectrum of organic acids.
Sample preparation
Different aspects of sample preparation for chromatographic analysis were reviewed in many papers [18]. An excellent book dealing with different aspects of sample preparation
Increasingly green approaches to determine selected trace organics in complex matrices. Short …
307
was published in 2010 [19]. The greenest approach to sample preparation for the analysis proper would be excluding this step from the analytical procedure. However, this is a rare case in trace organics determination in real-life samples. The matrices of air samples (indoor, outdoor air, etc) are relatively simple and the organic pollutants present at the highest concentrations can sometimes be determined by injecting an air sample directly into a gas chromatographic column. In most cases organic compounds must be first isolated from an air sample by trapping on a solid sorbent or in liquids coated on a solid support and then extracted with, eg an organic solvent; such approach is unfriendly to the environment. A typical way of making this procedure greener is thermal desorption of organic analytes from the sorbent; in which process an enrichment factor can be considerably higher [20]. This approach has become dominant in air analysis for the contents of trace organics. At higher concentrations some organics can be extracted from the air into a stationary phase coated on a thin fused silica fiber and liberated by thermal desorption in a GC injector. The technique, which is simpler, is solid phase microextraction (SPME) [19, 21-23]; it is also greener and widely used nowadays, to extract organics from aqueous samples. It was used in determination of VFAs, in the air in the vicinity of wastewater treatment plants and municipal solid waste landfills [24].
In analysis of aqueous samples, the direct injection of sample into a chromatograph without any preparation is possible but in limited number of media, eg drinking water [25]. Many aqueous samples can be introduced into a chromatographic column using direct aqueous injection after removal of particulate matter by means of either filtration or centrifuging. This green approach has been applied quite often to determine SCCAs in many different samples by means of different separation techniques, eg VFAs in wastewater and solid waste landfill leachates by gas chromatography [26].
Research activity in the field of sample preparation is very dynamic and is aimed not only at making it greener but also at increasing selectivity and enrichment factors. The most noticeable inventions, which can be considered green at the present state-of-the-art are quite numerous. Extraction using organic solvents has been regarded as very unfriendly to the environment and attempts have been continually made to replace it by so called solventless techniques, in which organic and hazardous inorganic solvents are not used. However, ionic
liquids (ILs) have emerged as a new type of green solvents whose properties can be designed to satisfy assumed requirements [27]. ILs can introduce new dimension in sample preparation techniques. They have been used, for example, in dispersive liquid
microextraction (DLME) and supported liquid membrane extraction (SLME) but the spectrum of applications including new methods can considerably increase. Analytes which are volatile and poorly soluble in water can be effectively isolated and enriched using gas extraction with inert gases which certainly are green extractants. The most important and most often used varieties of gas extraction are static headspace (HS) and purge and trap (PT). In HS analytes undergo partition between an aqueous sample and the gas phase above it (head space) so no additional extractant gas is needed. The example can be determination of VFAs in animal farm waste water by means of GC with a capillary column equipped with an automatic HS sampler [28]. An exemplary chromatogram is presented in Figure 1. The detection limits are on the level of sub mg/dm3 for VFAs with 2-6 carbon atoms in a molecule.
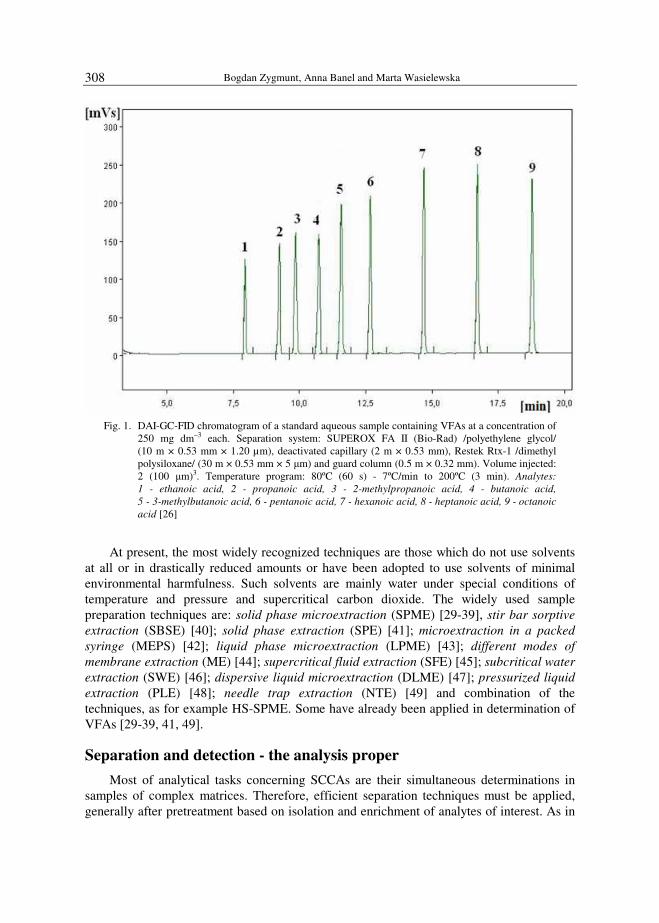
Bogdan Zygmunt, Anna Banel and Marta Wasielewska
308
Fig. 1. DAI-GC-FID chromatogram of a standard aqueous sample containing VFAs at a concentration of
250 mg dm–3 each. Separation system: SUPEROX FA II (Bio-Rad) /polyethylene glycol/ (10 m × 0.53 mm × 1.20 µm), deactivated capillary (2 m × 0.53 mm), Restek Rtx-1 /dimethyl polysiloxane/ (30 m × 0.53 mm × 5 µm) and guard column (0.5 m × 0.32 mm). Volume injected: 2 (100 µm)3. Temperature program: 80ºC (60 s) - 7ºC/min to 200ºC (3 min). Analytes:
1 - ethanoic acid, 2 - propanoic acid, 3 - 2-methylpropanoic acid, 4 - butanoic acid,
5 - 3-methylbutanoic acid, 6 - pentanoic acid, 7 - hexanoic acid, 8 - heptanoic acid, 9 - octanoic
acid [26]
At present, the most widely recognized techniques are those which do not use solvents at all or in drastically reduced amounts or have been adopted to use solvents of minimal environmental harmfulness. Such solvents are mainly water under special conditions of temperature and pressure and supercritical carbon dioxide. The widely used sample preparation techniques are: solid phase microextraction (SPME) [29-39], stir bar sorptive
extraction (SBSE) [40]; solid phase extraction (SPE) [41]; microextraction in a packed
syringe (MEPS) [42]; liquid phase microextraction (LPME) [43]; different modes of
membrane extraction (ME) [44]; supercritical fluid extraction (SFE) [45]; subcritical water
extraction (SWE) [46]; dispersive liquid microextraction (DLME) [47]; pressurized liquid
extraction (PLE) [48]; needle trap extraction (NTE) [49] and combination of the techniques, as for example HS-SPME. Some have already been applied in determination of VFAs [29-39, 41, 49].
Separation and detection - the analysis proper
Most of analytical tasks concerning SCCAs are their simultaneous determinations in samples of complex matrices. Therefore, efficient separation techniques must be applied, generally after pretreatment based on isolation and enrichment of analytes of interest. As in

Increasingly green approaches to determine selected trace organics in complex matrices. Short …
309
the case of most organic analytes, the separation methods generally taken into account are chromatography (gas, liquid, supercritical fluid) and electrophoresis.
Gas chromatography
If a given group of analytes can be analyzed by means of gas chromatography (GC), this technique should be a method of choice, due to a number of reasons. In GC inert gas is a mobile phase called a carrier gas. Its flow rates range from the order of a single cm3/min in capillary gas chromatography (CGC) to tens of cm3/min when packed columns are used. Being inert, carrier gas should not make any harm to the environment and can be regarded as a green mobile phase. Due to much higher separation power and better thermal stability capillary commercial columns have been used for most analytical separations of organics. Inert gases used in GC can be considered completely green as such. However, they must be very clean, especially when used in trace analysis, and their production can directly and indirectly (manufacturing installations for gas production) can add to the total environmental impact. The capillary column generally contains less stationary phase than the packed and has longer lifetime. As a result CGC can be regarded as greener. With packed or with capillary columns, GC instruments are relatively large, especially when coupled with mass spectrometers and their production as well as disposal should be taken into account as well. CGC has been very widely used to determine many volatile and semivolatile organic compounds. Determination of SCCAs in a number of matrices has been comprehensively reviewed by Peldszus [50].
If concentration of VFAs is sufficiently high, then the greenest approach would be the direct injection of an original sample into GC for analysis provided that the chromatographic column is resistant to water and produces peaks of good quality and well separated. Though not easy, good separation of a aqueous solution of 9 VFAs was achieved using an in series connection of separation columns and pieces of empty capillaries in order (starting from the injector): a polar capillary column SUPEROX II FA (10 m × 0.53 mm × 1.20 µm), deactivated capillary (2 m × 0.53 µm), non-polar capillary column Rtx-1 (30 m × 0.53 mm × 5.0 µm), and a short capillary (0.5 m × 0.32 mm) [26]. The chromatogram of standard aqueous sample of volatile fatty acids is presented in Figure 2.
This approach could also be used for the “dirty” samples cleaned up of suspended particular matter, some inorganic compounds and high molecular organics. This has been achieved by sample refluxing in a special apparatus containing a small volume chamber collecting the rectificate. In the process the analytes are separated from column deteriorating sample components. Considering only organic solvent impact, such sample cleanup is green but, if other factors (eg time of analysis, energy consumption) will be taken into consideration it seems not so obvious.
Short chain non-volatile carboxylic acids (oxalic, malonic, etc.) can also be determined by means of GC, but only after analytes are converted to volatile derivatives. In most cases the process is not green, since some extra reagents are used and as such should not be recommended for the routine laboratories performing a lot of analyses.
The great progress in making analytical methods greener can be achieved by miniaturization. The lab-on-a-chip can give analytical instruments which are cheaper, faster and more flexible. The miniature devices consisting of a column, injector and valves can

Bogdan Zygmunt, Anna Banel and Marta Wasielewska
310
separate a mixture of organics within 10 seconds [51]. Nowadays, due to the progress in wafer technology, miniaturized GC-MS coupled systems have been constructed. In such systems, the vacuum requirements are relaxed and carrier gas consumption reduced due to the small size of the unit [52, 53]. This is an inevitable trend which should result in a leap similar to that brought by introduction of PCs.
Fig. 2. HS-GC-FID chromatogram of a cattle farm waste water sample. Chromatographic column:
Stabilwax DA (30 m × 0.25 mm × 0.25 µm). Temperature program: 70°C (1 min), 25°C/min to 160°C (1 min), 10°C/min to 230°C (5 min). Designations as in Figure 1 (Internal Standard (IS) - 2-ethylbutanoic acid) [28]
Liquid chromatography
The spectrum of applications of high performance liquid chromatography to determine SCCA is wider than GC, since not only VFAs but also non-volatile acids can be determined. For many years now RP HPLC with columns of 4.6 mm in inner diameter and 25 cm long, packed with stationary phase particles of 5 µm in diameter has been usually used [54]. For such columns the optimal mobile phase flow rate is of the order of 1÷1.5 cm3/min. Using a Kromasil RP-C18 (250 × 4.6 mm, 5 µm particle) oxalic, tartaric, acetic, succinic, butene dicarboxylic, and glutaric acids [55] were well separated in less than 8 min. A mobile phase was 25 mmol/dm3 aqueous solution of dihydrogenphosphate buffered at pH 2.10 with
Increasingly green approaches to determine selected trace organics in complex matrices. Short …
311
orthophosphoric acid and modified with methanol (11%). At the total mobile phase flow rate of 1.3 cm3/min, methanol consumption was 0.14 cm3/min. This does not seem to do big harm to the environment and the separation procedure was successfully employed to determine the above acids in Bayer liquors. With a UV-Vis detector at λ = 215 nm detection limits ranged from 0.0023 to 10.36 mg/dm3.
However, at round-the-clock operation of many instruments, despite of relatively low flow rate, methanol can make some harm if care is not taken. Generally, if organic solvent is more hazardous as, for example, acetonitrile and its fraction in the mobile phase is high, the system can not be regarded as green by the present day standards. Solvent recycling, one of the ways to make technology greener has not got much attention in analytical separations [56, 57].
One way of decreasing solvent consumption is to use smaller particles which increase separation efficiency and hence analysis can be faster due to possibility of using shorter columns [58]. Quite recently, Stavova et al [59] have applied LC coupled with high resolution MS and tandem MS/MS to determine C1-C18 monocarboxylic acids and C2-C14 dicarboxylic acids. The reverse phase column of 100 mm length and 2.1 mm inner diameter was packed with 3 µm particles. The flow rate was only 200 mm3/min. The optimal separation was obtained using gradient elution of water modified with formic acid (10 mmol/dm3) and acetonitrile, whose content in a mobile phase increased from 0 to 90%. Acetonitrile is not a green solvent but its consumption was low (on average 90 mm3/min) and, in our opinion, the procedure is greener than, eg GC based procedures which would require derivatization of the above acids. The disadvantages of the LC based procedure is that formic acid can not be determined and some correction for the matrix is necessary in the case of real-world samples.
Another way to make LC based analytical procedures greener is application of ultra
high performance liquid chromatography (UHPLC), whose popularity has increased significantly in recent years [58, 60, 61]. In the technique, the use of smaller stationary phase particles is accompanied by increase in pressure which results in higher speed of separation. According to Welch [62], over 92% drop in solvent consumption can be achieved in this way when a 250 × 4.6 mm column packed with 5 µm particles is replaced by a 100 × 2.1 mm column packed with 1.7 mm particles. Quite recently UHPLC with a C-18 reverse phase column (100 × 2.1 mm, 1.7 µm) coupled with an electrospray ionization MS/MS was successfully applied to determine topramezone in soil, corn, wheat, and water [63]. Gradient elution was performed with a mobile phase composed of methanol and a 0.01% aqueous ammonium hydroxide solution. The average methanol content in the mobile phase was 50%. At the applied flow rate of 300 mm3/min the consumption of methanol was 150 mm3/min. Since this is accompanied by short separation time, the procedure may be regarded as being green to some degree. Accordingly, the application of UHPLC is a step towards greening analytical chemistry.
Another strategy to make LC separations greener is replacing classical mobile phases with less harmful alternatives. With respect to separation, acetonitrile was found to be the excellent organic modifier in reverse phase LC due to its advantageous properties. Replacement of acetonitrile with methanol is a step towards greener separation. Recently, the studies have been conducted to introduce even greener solvent, ie, ethanol [64]. In general, it is inferior to acetonitrile as a component of mobile phase but some researches

Bogdan Zygmunt, Anna Banel and Marta Wasielewska
312
have shown that mobile phase modifying properties of ethanol can be improved by increasing temperature [62].
The next step in greening LC separation is the use of water as a mobile phase. Water under conditions of temperature and pressure approaching the supercritical state has quite different solubilizing properties than cold water. At ambient conditions NaCl solubility in water is 37% by weight while it drops to about 100 mg/dm3 at supercritical conditions. The inverse relationship is observed for organic compounds many of which are miscible in supercritical water. For example, benzene is miscible in supercritical water but has a solubility of only 1700 mg/dm3 at ambient temperature and pressure. Critical temperature and pressure of water are very high and it would be technically difficult to apply supercritical water as a mobile phase. However, superheated water (SHW) or pressurized water as an LC mobile phase received a lot of interest and the corresponding research is conducted. SHW is environmentally friendly solvent in the case of analytical chromatography and has real advantages for some analytical tasks. Background of SHWLC has been discussed and applications described in a comprehensive review published recently [65].
Carbon dioxide has the critical temperature and pressure which can be easily accessible and subcritical and supercritical states can be easily maintained. CO2 appears quite a good solvent for organic compounds in a liquid or supercritical state and its solubilizing properties can easily be programmed in a wide range. Due to some specific properties of supercritical fluids supercritical fluid chromatography (SFC) have been developed as a separate chromatographic technique. It has been commercially available since 1982. SFC backgrounds and applications have been discussed in a number of papers and books [66]. Supercritical carbon dioxide is environmentally friendly and has many advantages over gas and liquid chromatography and SFC is the preferred chromatographic technique for many an analytical task, eg chiral separations. Amounts of CO2 used in analytical SFC in comparison with its content in the atmosphere and the emission rate in combustion processes are so small that it can be neglected. CO2 can be regarded as completely green solvent. However, it must be very pure for chromatographic usage and its production can have some environmental impact. Moreover, for some separations, its elution power must be changed by addition of some organic modifiers as methanol or acetonitrile so complete greenness of CO2 as a mobile phase is questionable. The problem how green a solvent CO2 is, has recently been raised [67, 68] and different aspects of SFC with a CO2 mobile phase were thoroughly discussed [62].
Ion chromatography
Carboxylic acids can undergo dissociation and if pH is sufficiently high they are mainly in ionized form and can be separated as carboxylate anions by anion exchange
chromatography (AIC). At low pH they can separated by ion exclusion chromatography (IEC).
In majority of applications of AEC to separate carboxylic acids (monocarboxylic, dicarboxylic, hydroxy- and ketoacids) as carboxylic anions a mobile phase is an aqueous solution containing such anions as of hydroxides, carbonates, bicarbonates, borates, etc. Aqueous samples usually do not require any sample pretreatment other than possible filtration prior to injection. To protect the analytical column from degradation and to
Increasingly green approaches to determine selected trace organics in complex matrices. Short …
313
prolong its life time, guard columns are generally applied in-line prior to the analytical column. Generally, detection is based on conductivity so the mobile phase conductivity is suppressed before the eluate enters the detector. Nowadays the hydrogen cations suppressing the conductivity are generated by electrolysis and determination of carboxylic acids by AEC is of green nature. Of the 21 AEC applications to determine organic acids reviewed by Peldszus [50], only twice methanol and once acetonitrile were used as mobile phase modifiers. Raman and Hopke [69] for example, used AEC to determine water soluble short chain carboxylic acids (acetic, formic, propionic, glutaric, adipic, oxalic, succinic, malic, malonic, maleic) in ambient aerosols. The method was very simple and it allowed for simultaneous detection and quantitation of organic acids and inorganic acids. The mobile phase was aqueous KOH solution at a flow rate of 0.8 cm3/min so it was environmentally friendly. The basic limitation of AEC is lower separation capability than modern LC systems.
The mechanisms of retention are very complex in IEC [69, 70]. They include Donnan exclusion, size exclusion, adsorption, polar interactions, hydrogen bonding, etc. Separation of organic acids in IEC is achieved in cation exchange columns. Eluents applied in IEC are aqueous solutions of mineral acids or organic acids. Organic solvents such acetonitrile and various alcohols are used as mobile phase modifiers to reduce tailing and retention times of more hydrophobic analytes. This can indicate that IEC must be considerably less friendly to the environment than AEC. Generally, conductivity detection is used in IEC but more powerful analytical detection and identification machines are produced by coupling IEC with different types of mass spectrometry [71, 72]. IEC is usually applied to analyse more complex samples and often the analysis proper is preceded by sample pretreatment. The technique was widely used in determination of SCCAs in a variety of samples [50]. In some recent applications, the authors evaluated their procedures with respect to impact on the environment. Dias et al [73] developed a method to determine acetic, propionic and butyric acids in dietary fiber extracts without any derivatization. The separation was shorter than 10 min, the mobile phase flow rate 0.6 cm3/min and no organic solvent modifiers were used. So the environmental impact of the method should be low and the method green.
Applying IEC with a typical column (250 × 7.8 mm, 10 µm particles), solutions of perchloric acid (HClO4), heptafluorobutyric acid (CF3(CF2)2COOH) and sulphuric acid at different concentrations as mobile phases at a flow rate of 0.5 cm3/min and conductivity detection after inverse suppression, 11 saturated and unsaturated low molecular mass organic acids were separated in 22 min [74]. To aid quantification of maleic and oxalic acid, anion exchange chromatography was used. Separation was performed using an anion exchange column (250 × 4 mm, 13 µm particles) and an aqueous solution of Na2CO3 and NaHCO3 as a mobile phase at 0.5 cm3/min.
In ion chromatography (IC), the waste is water containing small amounts of an electrolyte, generally not harmful to the environment, and sometimes also small amounts of organic solvents used as modifiers of mobile phases. The changes of the technique towards increasing green character depend on improvements in separation and suppression systems.
Capillary electrophoresis
Due to low consumption of reagents and solvents and small samples, capillary
electrophoresis (CE) can be regarded as a green analytical technique. The sample injected

Bogdan Zygmunt, Anna Banel and Marta Wasielewska
314
ranges from single pL (10–15 m3) to nL (10–12 m3) and buffer consumption is on the level of µL (10–9 m3) per electrophoretic run [16].
A typical detection system used in CE is a UV-Vis absorption spectrometer, which is of rather low sensitivity especially that the sample injected is small and light path short. SCCAs are characterized by low absorption coefficients and often indirect detection is applied. Such approach was applied to determine oxalic, citric, tartaric, malic, succinic, carbonic, acetic, lactic, aspartic, glutamic, ascorbic and gluconic acids [75]. These acids were well separated using a capillary 75 µm in inner diameter and 70 cm (63 cm to the detector) long. A background modifier was trimellitic acid (TMA). Tetradecyltrimethylammonium bromide (TTAB) was used as an EOF modifier. The method developed is rapid, sensitive and environmentally friendly (the consumption of reagents is small). It is characterized by the detection limits of the order of 2.0·10–6 mol/dm3 and can be applied to determine these acids in real food samples.
Capillary electrophoresis with indirect UV detection was also used to separate nine organic (formate, acetate, propionate, butyrate, oxalate, malonate, succinate, phthalate and maleate) and seven inorganic anions [76]. The detection limits were below 0.5 mg/dm3 for all the analytes mentioned (except for phthalate 1.0 mg/dm3) and the procedure could have been used to analyze waste water samples. The only treatment was filtration through 0.45 µm membrane filter; in some cases dilution was required due to excessive levels of carbonate. The capillary was 60 cm long and 50 µm in I.D. Again EOF modifier was TTAB while pyridine-2,6-dicarboxylic acid was used as electrolyte.
Capillary electrophoresis with both direct (at λ = 185 nm) and indirect (at λ = 254 nm) UV detection was employed to determine carboxylic acids (formic, acetic, propionic, butyric, malonic, lactic) that are relevant for the evaluation and specification of silage quality [77]. It was found that direct UV detection was more suitable for the determination of the above analytes in complex matrices such as silage. The acids were extracted from silage with water and the extract was filtered through a 0.45 µm disposable filter cartridge. Separations were performed using fused-silica capillaries with effective lengths between 50 and 65 cm, an inner diameter of 75 µm and a detection window 8 cm from the capillary end. Aqueous and non-aqueous buffer systems were used. The latter offered unique selectivity and the information obtained with them can be regarded as complementary to that obtained with aqueous electrolytes.
Co-electroosmotic high performance capillary electrophoresis was successfully applied to determine saturated and unsaturated mono- and dicarboxylic acids which are intermediates and reaction products in the conversion of citric and itaconic acid in hot, compressed liquid water and supercritical water [78]. Direct and indirect UV detection at λ = 185 nm, with, respectively, borate-phosphate electrolyte and phthalate as background electrolyte were employed. Fused silica capillaries of 50 mm I.D. and effective length 24.5 cm were used. The CE determination lasting 2-3 min is much faster than when HPLC is used, which could take about 35 min.
A capillary electrophoresis based method was developed to determine short chain organic acids such as oxalic, formic, fumaric, aconic, succinic, malic, glutaric, citric, glycollic, propionic, and quinic in serum of natural latex [79]. The acids were separated using uncoated fused silica capillary (57 cm × 50 mm) and spectrometrically detected at λ = 200 nm. LODs ranged from 2 µmol/dm3 for aconitic acid to 1612 µmol/dm3 for
Increasingly green approaches to determine selected trace organics in complex matrices. Short …
315
formic acid in standards, while in samples from 3 for fumaric acid to 1600 µmol/dm3 for propionic acid. The sample pretreatment was limited to coagulation.
The simple filtration was used to prepare samples of swine manure for determination of volatile fatty acids such as propanoic, butyric, valeric and caproic acids [80]. The analytical conditions were as follows: fused silica capillary of an effective length of 40 cm, 50 mm I.D., 20 mmol/Tris and 10 mmol/dm3 p-anisate buffer; 30 kV voltage and a temperature of 25ºC. VFAs were determined with good accuracy and precision at ppm level using samples as low as nanoliters. The separation complete within 10 min was time-saving as compared with chromatographic methods.
Wines are typically monitored for the content of SCCAs. CE with indirect spectrophotometric detection was used to analyze 23 Brazilian wines [81]. The separation was made using typical fused silica capillary (57 cm × 0.75 µm) and the electrolyte consisting of 10 mmol/dm3 3,5-dinitrobenzoic acid (DNB) at pH 3.6 and cetyltrimethylammonium bromide as flow reverser. DNB has a good effective mobility similar to acids of interest, good buffering capacity and good chromophoric characteristics for indirect detection at λ = 254 nm. The procedure gives good quality results. The detection limits range from 0.64 to 1.55 mg/dm3, sample preparation is simple (dilution and filtration) and separation fast (5.5 min to separate six acids, ie tartaric, malic, lactic, succinic, acetic, citric) and analysis cost is low. So it has a feature of green method.
The limits of detection of SCCAs can be lowered by converting them to derivatives for which the detector is more sensitive and selective. Often it is the conversion of the acids mentioned above to the fluorescent products [82]. Eleven organic acids which can occur in such beverages as wine, beer, vegetable and fruit juices were well separated and detected as their acid hydrazides by means of capillary zone electrophoresis with photodiode array detector [83]. Separation of the acids was achieved within 12 min and detection limits ranged from 2 to 10.0 mg/dm3 at 42 nL (100 µm)3 sample injections. A typical fused silica capillary 40 cm long and 75 µm I.D. was used. The acid hydrazides were detected at λ = 230 nm. The corresponding procedures are less green since additional reagents and processes are applied. However, analytical procedures can still be regarded as green as compared with those based on gas or liquid chromatography since generally samples need only tiny pretreatment and the amounts of samples and reagents used are really very small.
CE can be made even greener by miniaturization. CE microchips are characterized by high degree of integrity, portability, minimal solvent and reagent consumption, high performance and high speed. Applications of microchip CE with electrochemical detection for determination of environmental pollutants including some acidic organics were reviewed by Chen et al [84].
Conclusion
Green analytical chemistry is a very important trend in different areas of analytical chemistry. As far as trace organic determination in complex matrices is concerned the great stress should be put on sample preparation and a lot has been done to make this step of analysis greener. However, to challenge the analytical tasks of that kind, powerful separation systems must be often employed. Nowadays the separation methods are modified to decrease organic solvent consumption and also to replace them with solvents which are less harmful, eg ethanol or totally harmless (water in Reverse Phase Liquid

Bogdan Zygmunt, Anna Banel and Marta Wasielewska
316
Chromatography) for the environment. The other approach is developing analytical procedures based on inherently greener methods, for example, replacing HPLC with SFC or with electrophoresis. The great leap in reduction of consumption of solvents and reagents is development of miniaturized systems. It seems to be the future of analytical chemistry. The above-mentioned activities are observed in determination of traces of short chain carboxylic acids in complex matrices. Many analytical procedures proposed recently are based on capillary electrophoresis. Volatile fatty acids can be separated by gas chromatography which is regarded as a method of choice since it is greener than other separation techniques and is simple and easy to apply. Some GC systems allow for the analysis of aqueous samples and direct aqueous injection is preferred whenever the samples are sufficiently clean. Such approach has been used to determine VFAs in some environmental samples. When analytes must be isolated and enriched prior to GC analysis solventless techniques are frequently applied. All this makes monitoring of short chain carboxylic acids increasingly green.
References [1] Anastas P.T and Warner J.: Green Chemistry Theory and Practice. Oxford University Press, New York
1998. [2] Winterton N.: Green Chem., 2001, 3, G73-G75. [3] http://en.wikipedia.org/wiki/Green_chemistry [4] Lele S. M.: World Dev., 1991, 19, 607-621. [5] Guardia M. and Ruzicka J.: Analyst, 1995, 120, 17N. [6] Guardia M., Khalaf K.D., Carbonell V. and Morales-Rubio A.: Anal. Chim. Acta, 1995, 308, 462-468. [7] Guardia M., Khalaf K.D., Hasan B.A., Morales-Rubio A. and Carbonell V.: Analyst, 1995, 120, 231-235. [8] Guardia M.: J. Chem. Braz. Soc., 1999, 10, 429-437. [9] Namieśnik J.: Environ. Sci. Pollut. Res., 1999, 6, 243-245. [10] Koel M. and Kaljurand M.: Pure Appl. Chem., 2006, 78, 1993-2002. [11] Armenta S., Garrigues S. and Guardia M.: Trends Anal. Chem., 2008, 27, 497-511. [12] Tobiszewski M., Mechlinska A. and Namiesnik J.: Chem. Soc. Rev., 2010, 39, 2869-2878. [13] Farre M., Perez S., Gonzcalves C., Alpendurada M.F. and Barcelo D.: Trends Anal. Chem., 2010, 29,
1347-1362. [14] Tobiszewski M., Mechlinska A., Zygmunt B. and Namiesnik J.: Trends Anal. Chem., 2009, 28, 943-951. [15] Welch C.J., Wu N., Biba M., Hartman R., Brkovic T., Gong X., Helmy R., Schafer W., Cuff J., Pirzada Z.
and Zhou L.: Trends Anal. Chem., 2010, 29, 667-680. [16] Xie H-Y. and He Y-Z.: Trends Anal. Chem., 2010, 29, 629-635. [17] Zygmunt B., Banel A. and Wasielewska M.: Proc. 2nd Int. Conf. on Environ. Sci. Technol., ICEST 2011,
Volume 1, p.VI-5 Singapore 26-28 February 2011. [18] Zygmunt B. and Namieśnik J.: Chromatographia, 2002, 56, S9-S18. [19] Pawliszyn J. and Lord H.L.: Handbook on Sample Preparation. John Willey & Sons, New Jersey 2010. [20] Urbanowicz M., Zabiegała B. and Namieśnik J.: Anal. Bioanal. Chem., 2011, 399, 277-300. [21] Zygmunt B., Namieśnik J. and Jastrzębska A.: J. Chromatogr. A, 2000, 885, 405-418. [22] Zygmunt B., Zaborowska A., Światłowska J. and Namieśnik J.: Curr. Org. Chem., 2007, 11, 241-253. [23] Jakubowska N., Zygmunt B., Polkowska Ż., Zabiegała B. and Namieśnik J.: J. Chromatogr. A, 2008, 1216,
422-441. [24] Davoli E., Gangai M.L., Morselli L. and Tonelli D.: Chemosphere, 2003, 51, 357-368. [25] Biziuk M.: Gas chromatography by direct aqueous injection in environmental analysis.
[in:] M. Encyclopaedia of Analytical Chemistry, ed. R.A. Meyers. John Willey & Sons, Chichester 2000. [26] Banel A., Jakimska A., Wasielewska M., Wolska L. and Zygmunt B.: Anal Chim Acta,
Doi:10.1010/j.aca.2011.02.059 [27] Kokorin A.: Ionic Liquids: Theory, Properties, New Approaches. InTech, Rijeka 2011. [28] Banel A., Wasielewska M., Felchner-Żwirełło M. and Zygmunt B.: Water Sci. Technol., 2011, 63,
2873-2877.
Increasingly green approaches to determine selected trace organics in complex matrices. Short …
317
[29] Abalosa M., Bayona J.M. and Pawliszyn J.: J. Chromatogr. A, 2000, 873, 107-115. [30] Abalosa M. and Bayona J.M.: J. Chromatogr. A, 2000, 891, 287-294. [31] Shao-Pin Y.: Chemosphere, 1999, 38, 823-834. [32] Larreta J., Vallejo A., Bilbao U., Alonso A., Arana G. and Zuloaga O.: J. Chromatogr. A, 2006, 1136, 1-9. [33] Francioso O., Rodriguez-Estrada M.T., Montecchio D., Salomoni C., Caputo A. and Palenzon D.: J. Hazard.
Mater., 2010, 175, 740-746. [34] Feng L., Huang Y. and Wang H.: J. Chromatogr. Sci., 2008, 46, 577-584. [35] Huang Y., Ortiz L., Aguirre P., Garcia J., Mujeriego R. and Bayona J.M.: Chemosphere, 2005, 59, 769-777. [36] Miller D.N. and Woodbury B.L.: J. Environ. Qual., 2006, 35, 2383-2394. [37] Spinhirne J.P., Koziel J.A. and Chirase N.K.: J. Chromatogr. A, 2004, 1025, 63-69. [38] Cai L., Koziel J.A., Lo Y.C. and Hoff S.J.: J. Chromatogr. A, 2006, 1102, 60-72. [39] Razote E.B., Maghirang R.G., Seitz L.M. and Jeon I.J.: Amer. Soc. Agric. Eng., 2004, 47, 1231-1238. [40] Prieto A., Zuloaga O., Usobiaga A., Etxebarria N. and Fernández L.A.: J. Chromatogr. A, 2007, 1174,
40-49. [41] Jurado-Sanchez B., Ballesteros E. and Gallego M.: J. Chromatogr. A, 2010, 1217, 7440-7447. [42] El-Beqqali A., Kussak A. and Abdel-Rehim M.: J. Chromatogr. A, 2006, 1114, 234-238. [43] Ho T.S., Pedersen-Bjergaard S. and Rasmussen K.E.: J. Chromatogr. Sci., 2006, 44, 308-16. [44] Chimuka L., Cukrowskaand E. and Jönsson J.A.: Pure Appl. Chem., 2004, 76, 707-722. [45] Janda V., Bartle K.D. and Clifford A.A.: J. Chromatogr. A, 1993, 642, 283-299. [46] Ramos L., Kristenson E.M. and Brinkman U.A.: J. Chromatogr. A, 2002, 975, 3-29. [47] Rezaee M., Assadi Y., Milani Hosseini M.R., Aghaee E., Ahmadi F., Berijani S.: J. Chromatogr. A, 2006,
1116, 1-9. [48] Schantz M.M.: Anal. Bioanal. Chem., 2006, 386, 1043-1047. [49] Lou D.W., Lee X. and Pawliszyn J.: J. Chromatogr. A, 2008, 1201, 228-234. [50] Peldszus S.: Organic Acids. Chromatographic Analysis of the Environment. [in:] L.M.L. Nollet (ed.).
CRC/Taylor & Francis, Boca Roton 2006. [51] Namieśnik J.: Polish J. Environ. Stud., 2010, 10, 127-140. [52] Hauschild J.P., Wapelhorst and Mueller J.: Int. J. Mass Spectrom., 2007, 264, 53-60. [53] Wapelhorst E., Hauschild J.P. and Mueller J.: Sens. Actuators. A, 2007, 138, 22-27. [54] Majors R.: Trends in HPLC Column Usage, Liquid Chromatography-Gas Chromatography N. Am., 1
November 2009. [55] Chen Q.Y., Xiao J.B. and Chen X.Q.: Miner. Eng., 2006, 19, 1446-1451. [56] Katusz R.M., Bellew L., Mangravite J.A. and Foery R.F.: J. Chromatogr., 1981, 213, 331-336. [57] Welch A.: Amer. Lab., 2006, 38, 44. [58] Wu N. and Clausen A.M.: J. Sep. Sci., 2007, 30, 1167-1182. [59] Stavova J., Beranek J., Nelson E.P., Diep B.A. and Kubatova A.: J. Chromatogr. B, 2011, 879, 1429-1438. [60] Chen H. and Horvath C.: J. Chromatogr. A, 1995, 705, 3-20. [61] Mazzeo J.R., Neue U.D. Kele M. and Plumb R.S.: Anal. Chem., 2005, 77, 460A-467A. [62] Chen S. and Kord A.: J. Chromatogr. A, 2009, 1216, 6204-6209. [63] Li Y., Dong F., Liu X., Xu J., Li J., Lu C., Wang Y. and Zheng Y.: Anal. Bioanal. Chem., 2011, 400,
3007-3107. [64] Welch C.J., Brkovic T., Schafer W. and Gong X.: Green Chem., 2009, 11, 1232-1238. [65] Hartonen K. and Riekkola M.: Trends Anal. Chem., 2008, 27, 1-14. [66] Yarita T.: Chromatography, 2008, 29, 19-23. [67] Van der Vorst G., Van Langenhove H., DePape F., Aelterman W., Dingenen J. and Dewulf J.: Green Chem.,
2009, 11, 1007-1012. [68] Weiss J.: Handbook of Ion Chromatography, Third, completely revised and updated edition. Wiley-VCH
Verlag GmbH, Weinheim, Germany 2008. [69] Raman R.S. and Hopke P.K.: Int. J. Environ. Anal. Chem., 2006, 86, 767-777. [70] Ng K.L., Glóg B.K., Dicinoski G.W. and Haddad P.R.: J. Chromatogr. A, 2001, 920, 41-49. [71] Helaleh M.I.H., Tanaka K., Taoda H., Hu W., Hasebe K. and Haddad P.R.: J. Chromatogr. A, 2002, 956,
201-208. [72] Johson S.K., Houk L.L., Feng J., Johnson D.C. and Houk R.S., Anal. Chim. Acta, 1997, 341, 205-216. [73] Dias J.C., Suzuki E., Albuquerque C.L. and Ferreira A.L.: J. Pharm. Biomed. Anal., 2009, 49, 1128-1132. [74] Chi G.T. and Huddersman K.D.: J. Chromatogr. A, 2007, 1139, 95-103. [75] Wu C.H., Lo Y.S., Lee Y.H. and Lin T.I.: J. Chromatogr. A, 1995, 716, 291-301.
Bogdan Zygmunt, Anna Banel and Marta Wasielewska
318
[76] Pantsar-Kallio M., Kuitunen M. and Manninen P.K.G.: Chemosphere, 1997, 35, 1509-1518. [77] Buchberger W., Klampfl C.W., Eibensteiner F. and Buchgraber K.: J. Chromatogr. A, 1997, 766, 197-203. [78] Volgger D., Zemann A.J., Bonn G.K. and Antal M.J.: J. Chromatogr. A, 1997, 758, 263-276. [79] Galli V., Olmo N. and Barbas C.: J. Chromatogr. A, 2000, 894, 135-144. [80] Chi F.H., Lin H.P. and Leu M.H.: Chemosphere, 2005, 60, 1262-1269. [81] Peres R.G., Moraes E.P., Micke G.A., Tonin F.G., Tavares M.F.M. and Rodriguez-Amaya D.B.: Food
Control, 2009, 20, 548-552. [82] Kibler M. and Bachmann K.: J. Chromatogr. A, 1999, 836, 325-331. [83] Ssantalad A., Teerapornhaist P., Burakham R. and Srijajanai S.: LWT - Food Sci. Technol., 2007, 40,
1741-1746. [84] Chen G., Lin Y. and Wang J.: Talanta, 2006, 68, 497-503.
OZNACZANIE ŚLADOWYCH ILOŚCI ZWIĄZKÓW ORGANICZNYCH W PRÓBKACH O ZŁOŻONYCH MATRYCACH
ZGODNIE Z REGUŁAMI „ZIELONEJ CHEMII ANALITYCZNEJ”. KRÓTKOŁAŃCUCHOWE KWASY KARBOKSYLOWE
Katedra Chemii Analitycznej, Wydział Chemii, Politechnika Gdańska
Abstrakt: Obecnie społeczeństwa kładą duży nacisk na ochronę środowiska. Działania w tym kierunku są prowadzone także w zakresie chemii analitycznej, co określa się terminem „zielona chemia analityczna (GAC)”. W artykule przeanalizowano wprowadzanie nowych metod i technik analitycznych oraz modyfikację już opracowanych metodyk oznaczania w kierunku bardziej przyjaznych środowisku. Konkretne procedury oznaczania krótkołańcuchowych kwasów karboksylowych zostały ocenione pod kątem ich ewentualnego wpływu na środowisko.
Słowa kluczowe: „zielona chemia analityczna”, śladowe ilości związków organicznych, przygotowanie próbek, techniki rozdzielania, kwasy organiczne

ECOLOGICAL CHEM ISTRY AND ENGINEERING S
Vol. 18, No. 3 2011
Ivan DIADOVSKI1, Maya ATANASSOVA1 and Vasil SIMEONOV2*
RISK ASSESSMENT OF EXTREME EVENTS ALONG THE TRANSBOUNDARY MESTA RIVER
IN BULGARIA USING INTEGRAL INDICES
OCENA RYZYKA WYSTĄPIENIA ZJAWISK EKSTREMALNYCH SPOWODOWANYCH PRZEZ RZEKĘ MESTA W BUŁGARII
NA PODSTAWIE ANALIZY WSKAŹNIKÓW INTEGRALNYCH
Abstract: The present work considers the use of an original integral method for evaluation of the climatic and anthropogenic impacts on the average annual water volume and on the maximum and minimum water flow of Mesta River in the Bulgarian territory. The level of impacts and the respective risk assessment is determined by the index Ki flow module, which accounts for the deviation of the average annual water flow Qi from the flow norm Q0. Another index Mmax,i reflects the deviation of the maximum water flow from the maximum flow norm Qmax,0 and the index Mmin,i considers the deviation of the minimum water flow from the minimum flow norm Qmin,0. In order to assess extreme events (floods, droughts) using the dynamics of the integral indices Mmax,i and Mmin,i, histograms to estimate the frequency of appearance of their values in chosen time intervals were constructed. The function adequately describing the distribution of the frequency of appearance of Mmax,i and Mmin,i is a polynomial of third degree. The new approach offered includes an introduction of more specific indicators for assessing the risk of climatic impacts assessment on the river water flow (Ki, Mmin,i and Mmax,i). This is made for the first time in risk assessment of climatic impacts and has been checked at two monitoring sites from the national monitoring net of Mesta River - Yakoruda site (at the spring of the river) and Khadzhidimovo site (at the Bulgarian/Greek border) for the period 1955-2008. It has to be stressed that the indices are integral in their nature because they reflect specific climatically caused events like abundant water years, dry years, floods and droughts.
Keywords: integral indices, climate impact, risk assessment, river flow, extreme event
Introduction
The transboundary Mesta River is located in Western Bulgaria, with catchment area of 2768 km2, at altitude of 1318 m and length of 125.9 km in the Bulgarian part of the river. The catchment of the river follows a mountainous pattern and is characterized by relatively
1 Institute of Biodiversity and Ecosystem Research, Bulgarian Academy of Sciences, 1113 Sofia, 2 Gagarin Str, Bulgaria, email: [email protected] 2 Faculty of Chemistry, St. Kl. Ochridski University of Sofia, 1 J. Boucher Bvld., 1164 Sofia, Bulgaria * Corresponding author: [email protected]
Ivan Diadovski, Maya Atanassova and Vasil Simeonov
320
low forestation level and 693 settlements with 13 500 inhabitants in total. Forests cover 50% of the catchment area.
The EU Water Framework Directive (EU WFD) prescribes good water quality as a goal for all water bodies within a given catchment. To achieve this status, each EU country should develop an optimal management strategy [1-4].
The river rises from the alpine parts of Rila and Pirin mountains and from the lower parts of Rhodopes. The Mesta River flows through Bulgaria and Greece to the Aegean Sea.
The Mesta River catchment area is a part of the region that experiences the influence of the European continental climate over the flow. The southern-most part of the river valley serves as a corridor for the Mediterranean climate.
Two typical periods for the river flow formation are determined: a period of winter-spring (high water) and a period of summer-autumn (low water).
The Mesta River is used for tap water, industrial water supply and for irrigation. The water quantity of the Mesta River is controlled at 22 hydrometric stations: five
of them along the Mesta River and the rest 17 stations along the river feeders. The characteristics of the Mesta River natural flow are basically assessed according to the
information coming from two typical hydrometric stations - the Yakoruda site in the upper river flow and the Khadzhidimovo site in the lower flow at a distance of 23 km from the Greek border.
The relief of the investigated area is diverse: the difference between the highest point (2204 m) and the lowest point at the Greek border (388 m) is significant. Preliminary studies have shown that the natural state of the river flow formation depends on the altitude [5].
The natural conditions of the Mesta River flow formation are due to the climatic impact, while the effect of economic activity is negligible.
In the recent years many researchers focused their attention on the climate changes due to anthropogenic activity [6-8]. Many authors believe that a period of warming will characterise the coming decades. Others are more reserved on the issue [9, 10]. What can be pointed out is that the natural climate dependencies are disturbed by the anthropogenic impacts. Therefore, in our opinion, difficult for prediction climate changes at regional and global level, are possible. The present work considers a particular regional problem and the goal is to manage the waters in a transboundary river basin.
The basic goals of this research are to determine: • the tendency of the annual average value dynamics of the Mesta River water during the
period 1955-2008 with respect to climate impact; • the tendency and the frequency of appearance of the multiannual dynamics of absolute
maximum values of the river flow with respect to the risk assessment of flood events during the 1955-2008 period;
• the tendency and the frequency of appearance of the multiannual dynamics of absolute minimum values of the river flow with respect the risk assessment of drought events for the same period. It is our conviction that principally difficult for prediction of climate changes at
regional or even global level could be assessed. In previous papers, the authors investigate the dynamics of the module coefficients Ki as a background for integral assessment of the climatic impact on the river flow formation [11]. Usually, these module coefficients are applied for calculation of the coefficient of variation of the flow for a certain period. The
Risk assessment of extreme events along the transboundary Mesta River in Bulgaria …
321
risk assessment of flood events is a priority for all EU countries. A special Framework Directive 2007/60/EO of the European Parliament and Council for management of the flood risk has been recently accepted [12].
The main objective of this study is to help in improving the management of the surface water quality in a transboundary river basin. In principle, the results obtained could be used on a more large global scale.
Experimental
The retrospective analysis of the river water flow dynamics is performed on the basis of information collected at the two hydrometric stations. For this purpose the Origin 6.0 software [13] has been applied for data analysis.
Different functions were considered in the trend analysis for certain periods - linear, exponential, second and third degree polynomials. The type of the function describing the trend was determined on the basis of statistical criteria as correlation coefficients and Fisher tests [14, 15]. The function representing the trend can be used for short-term (up to 1 year) prediction of the river flow dynamics, if a statistically significant trend is found.
In principle, statistical methods are often used in hydrological studies for the assessment of climatic and anthropogenic impact on the river flow formation in a specific cross-section of the river basin [13-15]. Usually, a statistical comparison of the natural and disturbed state of the river flow is performed in order to assess the climatic impact on the flow.
In the present work, the integral approach to evaluating the level of climate impact on the river flow formation is applied following earlier studies of Diadovski et al [1, 11, 16]. The proposed approach is based on interpretation of the average multiannual river flow Q0 (flow norm), the ratios between the annual average flow Qi and the flow norm. With respect to the risk assessment of flood or drought events, specific integral indicators are introduced, which are based on the ratios between the highest water discharge for the year Qmax,i to the multiannual-average value of the maximum water discharge Qmax,0 and on the ratio between the minimum water discharge Qmin,i to the multiannual-average value of the minimum water discharge Qmin,0.
These relations form indices used for determination of the effect of climatic and anthropogenic factors on the flow formation. The longer the period of observation, the less the error in calculation of the flow norm. The proposed approach is applied to the Mesta river catchment Bulgarian territory.
The proposed indices are as follows:
Ki = Qi / Q0 (1)
Mmax,i = Qmax,i / Qmax,0 (2)
Mmin,i = Qmin,i / Qmin,0 (3)
The fluctuations of the Ki, Mmax,i and Mmin,i indices for a certain period give the possibility of making integral assessment of the climatic and anthropogenic impact on the river flow formation and risk assessment using extreme events of the past and the integral indices.

Ivan Diadovski, Maya Atanassova and Vasil Simeonov
322
Fig. 1. Mesta River catchment with its monitoring net
Following background considerations were taken into account to construct the hypothesis for risk assessment: • If the maximal water flow values are higher than the norm (Mmax,i > 1), one could
account for extreme events (floods) in the past; the higher the integral indices Mmax,i than 1, the higher the flood risk. It means that the higher the level of deviation of the maximal water flow values from the norm (Qmax,0), the higher gets the risk of flooding (Mmax,i > 2).

Risk assessment of extreme events along the transboundary Mesta River in Bulgaria …
323
• If the minimal water flow values are lower than the norm (Mmin,i < 1) for a certain period one could account for extreme events (droughts) in the past; the lower the integral indices Mmin,i than 1, the higher the drought risk. It means that the higher level of deviation of the minimal water flow values from the norm, the higher gets the risk of drought (Mmin,i < 0.5). This hypothesis was checked using data from the sampling stations: Yakoruda and
Khadzhidimovo. From the data sets, one can calculate the correlation between time and index values.
Based on the results, one can specify different levels of correlation between time and index values. Due to the basic statistics of the input data, the Spearman correlation coefficient was used throughout the study. Although no exact numbers are given, according to different environmetric studies [17-19], the correlation could be interpreted in the following empirical manner: • For 0.1 < r < 0.2, insignificant tendency exists. • For 0.2 < r < 0.3, slight tendency is available. • For 0.3 < r < 0.5, moderate tendency is established. • For 0.5 < r, significant tendency is found.
These values have significance and interpretation only if the number of observations is above 30. In this study it is accepted that the length of the period of observation for calculation of the integral indices is equal to the period used for calculation of the river flow norm. In calculating the coefficient of variation of the hydrological parameters CV, a period of observation n > 30 years is a necessary condition for calculation using the empirical formula:
( )n1
1KC 2iV −= (4)
For small changes in the values of the different hydrological parameters and of the integral indices, a shorter period of observation is needed, and vice versa. In order to check the significance of the correlation coefficient, the calculated value is compared with the theoretical one, which represents in fact the r significance test [17, 18].
In order to assess extreme events (floods, droughts) using the dynamics of the integral indices Mmax,i and Mmin,i histograms, the frequency of their appearance in chosen time intervals were constructed. In dependence of the frequency of appearance of the values Mmax,i > 1.75, the probability for risk of floods could be assessed. The same approach can be used for assessment of the probability for risk of droughts if the frequency of appearance of the values Mmin,i < 0.5 is checked.
The function adequately describing the distribution of the frequency of appearance of Mmax,i and Mmin,i is a polynomial of third degree. No need for special procedures for fitting of a specific calibration curve to the numerical data is necessary.
By the use of the integral indices (Ki, Mmax,i, Mmin,i) for assessment of the climatic factors on the stream dynamics, it could be possible in future studies to estimate the role of climate on formation of high-water and low-water events and, hence, the risk of drought or flood. It might be assumed by our preliminary results that the indices are linked exactly with two latent factors - one explaining flood events and the other - drought events. This idea could find some resemblance with other multivariate statistical studies [19, 20], dealing with river water quality of the Struma River catchment.

Ivan Diadovski, Maya Atanassova and Vasil Simeonov
324
Results and discussion
According to Amoros [6], the fluctuations of climate and physical geographic factors provoke trends, including leap-like (catastrophic) events.
In our study, the trends of the basic characteristics of river flow on the basis of integral parameter (Ki, Mmax,i, Mmin,i indices) at the Yakoruda and Khadzhidimovo sites are determined.
The theoretical correlation coefficient of the trend functions at degrees of freedom 54 and a probability of error α = 5% has a value r = 0.25. The calculated values of correlation coefficients for the investigated period are in the interval 0.2÷0.59. This fact shows that the trend model characterizes adequately slight to significant tendency.
The assessment of the flow change in the hydrometrics stations of Yakoruda and Khadzhidimovo for period of 54 years (1955-2008) is made on the basis of integral parameter dynamics (Table 1).
Table 1
Dynamics of the river flow water characteristics
Site Multiannual average
river flow Q0 [(m3/s]
Multiannual average maximum river flow
Qmax,0 [m3/s]
Multiannual average minimum river flow
Qmin,0 [m3/s] Yakoruda site 3.314 31.408 0.580
Khadzhidimovo site 25.625 253.662 3.564
Yakoruda site
The trend in the dynamics of the Ki index for the Yakoruda point is described by a linear function with r = –0.61 (Fig. 2). The Ki index shows a decreasing significant tendency.
Fig. 2. Dynamics of the Ki index for the Mesta River at the Yakoruda site (r = –0.61)

Risk assessment of extreme events along the transboundary Mesta River in Bulgaria …
325
The influence of climate and physical-geographic factors is determined by retrospective analysis of the Ki index. The dynamics of Ki index for Yakoruda point change from 2.3 to 0.25. Three typical periods are determined for this point: first (1959-1975) - period with years of high water resources (Ki > 1); second (1976-1999) - one with years of low water resources (Ki < 1); and third (2000-2009) - one with years of high water resources (Ki > 1).
The trend in the dynamics of the Mmax,i index (Fig. 3) is described by a linear function with a correlation coefficient r = –0.62. A significant trend towards decreasing of the Mmax,i
index is outlined, which corresponds to the trends towards Qmax,i for the site.
Fig. 3. Dynamics of the Mmax,i index for the Mesta River at the Yakoruda site (r = –0.62)
Fig. 4. Dynamics of the Mmin,i index for the Mesta River at the Yakoruda site (r = –0.25)
The values of Mmax,i for this point varies within the range from 0.25÷2.4, which indicated that in the certain years, the maximum water flow Qmax,i significantly exceeds the
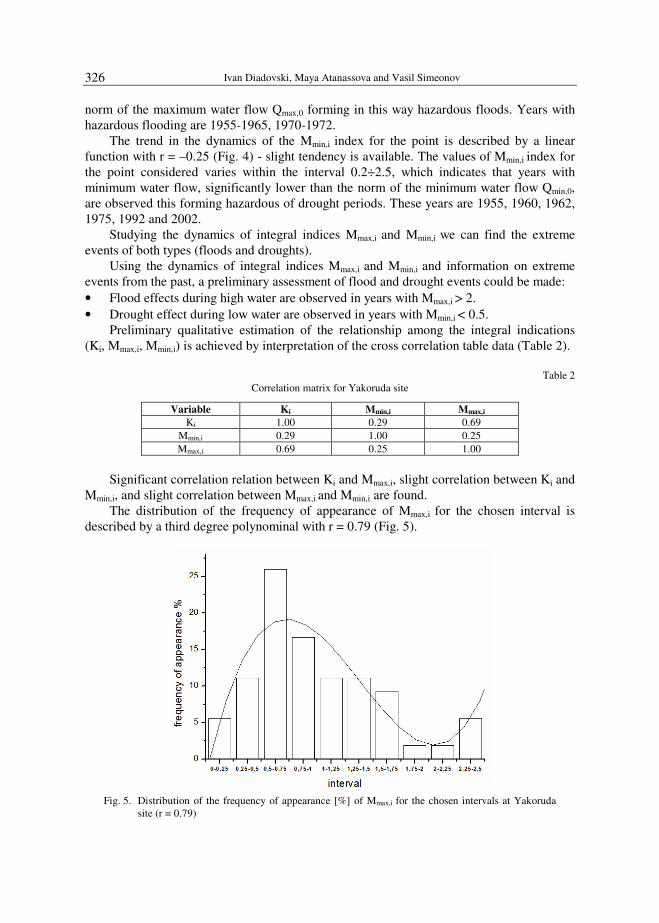
Ivan Diadovski, Maya Atanassova and Vasil Simeonov
326
norm of the maximum water flow Qmax,0 forming in this way hazardous floods. Years with hazardous flooding are 1955-1965, 1970-1972.
The trend in the dynamics of the Mmin,i index for the point is described by a linear function with r = –0.25 (Fig. 4) - slight tendency is available. The values of Mmin,i index for the point considered varies within the interval 0.2÷2.5, which indicates that years with minimum water flow, significantly lower than the norm of the minimum water flow Qmin,0, are observed this forming hazardous of drought periods. These years are 1955, 1960, 1962, 1975, 1992 and 2002.
Studying the dynamics of integral indices Mmax,i and Mmin,i we can find the extreme events of both types (floods and droughts).
Using the dynamics of integral indices Mmax,i and Mmin,i and information on extreme events from the past, a preliminary assessment of flood and drought events could be made: • Flood effects during high water are observed in years with Mmax,i > 2. • Drought effect during low water are observed in years with Mmin,i < 0.5.
Preliminary qualitative estimation of the relationship among the integral indications (Ki, Mmax,i, Mmin,i) is achieved by interpretation of the cross correlation table data (Table 2).
Table 2
Correlation matrix for Yakoruda site
Variable Ki Mmin,i Mmax,i Ki 1.00 0.29 0.69
Mmin,i 0.29 1.00 0.25 Mmax,i 0.69 0.25 1.00
Significant correlation relation between Ki and Mmax,i, slight correlation between Ki and
Mmin,i, and slight correlation between Mmax,i and Mmin,i are found. The distribution of the frequency of appearance of Mmax,i for the chosen interval is
described by a third degree polynominal with r = 0.79 (Fig. 5).
Fig. 5. Distribution of the frequency of appearance [%] of Mmax,i for the chosen intervals at Yakoruda
site (r = 0.79)
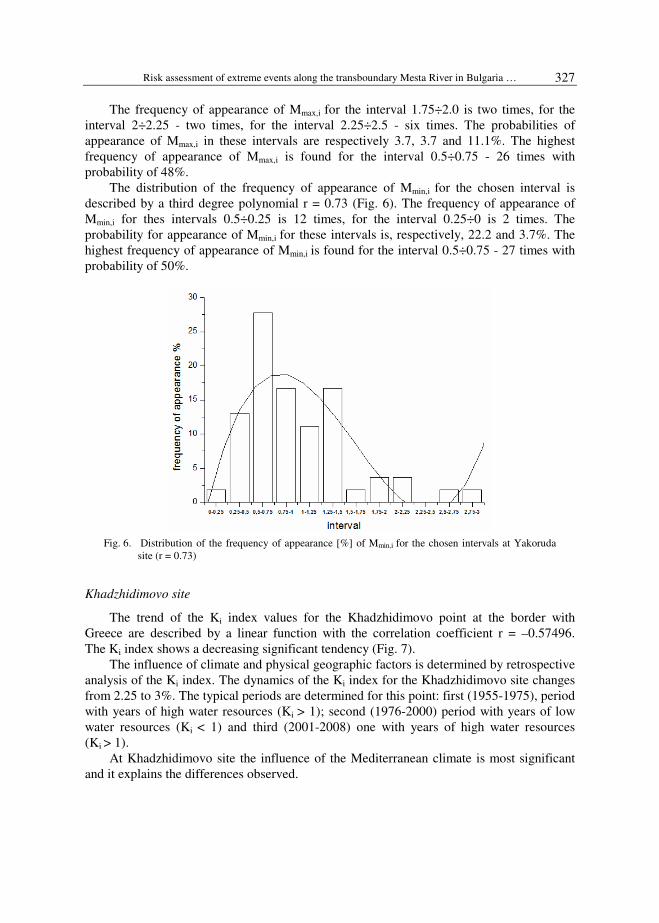
Risk assessment of extreme events along the transboundary Mesta River in Bulgaria …
327
The frequency of appearance of Mmax,i for the interval 1.75÷2.0 is two times, for the interval 2÷2.25 - two times, for the interval 2.25÷2.5 - six times. The probabilities of appearance of Mmax,i in these intervals are respectively 3.7, 3.7 and 11.1%. The highest frequency of appearance of Mmax,i is found for the interval 0.5÷0.75 - 26 times with probability of 48%.
The distribution of the frequency of appearance of Mmin,i for the chosen interval is described by a third degree polynomial r = 0.73 (Fig. 6). The frequency of appearance of Mmin,i for thes intervals 0.5÷0.25 is 12 times, for the interval 0.25÷0 is 2 times. The probability for appearance of Mmin,i for these intervals is, respectively, 22.2 and 3.7%. The highest frequency of appearance of Mmin,i is found for the interval 0.5÷0.75 - 27 times with probability of 50%.
Fig. 6. Distribution of the frequency of appearance [%] of Mmin,i for the chosen intervals at Yakoruda
site (r = 0.73)
Khadzhidimovo site
The trend of the Ki index values for the Khadzhidimovo point at the border with Greece are described by a linear function with the correlation coefficient r = –0.57496. The Ki index shows a decreasing significant tendency (Fig. 7).
The influence of climate and physical geographic factors is determined by retrospective analysis of the Ki index. The dynamics of the Ki index for the Khadzhidimovo site changes from 2.25 to 3%. The typical periods are determined for this point: first (1955-1975), period with years of high water resources (Ki > 1); second (1976-2000) period with years of low water resources (Ki < 1) and third (2001-2008) one with years of high water resources (Ki > 1).
At Khadzhidimovo site the influence of the Mediterranean climate is most significant and it explains the differences observed.

Ivan Diadovski, Maya Atanassova and Vasil Simeonov
328
Fig. 7. Dynamics of the Ki index for the Mesta River at the Khadzhidimovo site (r = – 0.57)
The trend in the dynamics of the Mmax,i index is described by a linear function with a correlation coefficient r = –0.57 (Fig. 8).
Fig. 8. Dynamics of the Mmax,i index for the Mesta River at the Khadzhidimovo site (r = –0.57)
A significant trend toward decreasing of the Mmax,i is outlined, which corresponds to the trend of Mmax,i at the Yakoruda site.
The values of Mmax,i for Khadzhidimovo site vary with the range 0.25÷3.2, which indicates that in certain years the maximum water flow Qmax,i significantly exceeds the norm of the maximum water flow Qmax,0, forming in this way hazardous floods.
Years with hazardous flooding are 1955, 1960, 1962, 1965, 1970, 1972 and 1975. The trend in the dynamics of Mmin,i index is described by a polynomial third degree
with r = 0.10 insignificant tendency (Fig. 9).

Risk assessment of extreme events along the transboundary Mesta River in Bulgaria …
329
Fig. 9. Dynamics of the Mmin,i index for the Mesta River at the Khadzhidimovo site (r = 0.10)
The values of Mmin,i index for the Khadzhidimovo point considered varies within the interval 1.6÷0.5, which indicates that years with minimum water flow, significantly lower than the norm of the minimum water flow (Qmin,0), are observed, thus forming hazardous drought periods. These years are 1965-1967, 1982-1988, 1992-1994.
Studying the dynamics of the Mmax,i and Mmin,i we can found that extreme events of both types (floods and droughts) are observed. This situation could be explained by the climate changes and the physical geographical conditions in the Mesta River catchment.
Preliminary qualitative estimation of the relationship among the integral indicators (Ki, Mmax,i and Mmin,i ) is achieved by interpretation of the cross correlation table data (Table 3).
Table 3
Correlation matrix for Khadzhidimovo site
Variable Ki Mmin,i Mmax,i Ki 1.00 0.38 0.66
Mmin,i 0.38 1.00 –0.02 Mmax,i 0.66 –0.02 1.00
Significant correlation between Ki and Mmax,i, and moderate correlation between Ki and
Mmin,i are established. Using the dynamics of integral indices Mmax,i and Mmin,i and information on extreme events from the past, a preliminary risk assessment of future extreme events such as floods and droughts could be made: flood effects during high water are observed in years with Mmax,i > 2 and drought effect during low water are observed in years with Mmin,i < 0.5.
The distribution of the frequency of appearance of Mmax,i for the chosen interval is described by a third degree polynomial (r = 0.82) (Fig. 10).

Ivan Diadovski, Maya Atanassova and Vasil Simeonov
330
Fig. 10. Distribution of the frequency of appearance [%] of Mmax,i for the chosen intervals at
Khadzhidimovo site (r = 0.82)
The frequency of appearance of Mmax,i for the interval 1.75÷2 is 2 times, for interval 2.25÷2.5 is 4 times, for interval 2.75÷3 is 2 times and for interval 3÷3.25 is 2 times.
The probability of appearance of Mmax,i in these intervals is respectively 3.7, 7.4, 2 and 2%.
The highest frequency of appearance of Mmax,i is found for the interval 0.5 ÷ 0.75 - 23 times with probability of 42%.
The frequency of appearance of Mmin,i for chosen interval is described by a third degree polynomial r = 0.79 (Fig. 11).
Fig. 11. Distribution of the frequency of appearance [%] of Mmin,i for the chosen intervals
at Khadzhidimovo site (r = 0.79)

Risk assessment of extreme events along the transboundary Mesta River in Bulgaria …
331
The frequency of appearance of Mmin,i for the interval 0.5÷0.25 is 17 times, for interval 0.25÷0 - is 3 times. The probability of appearance of Mmin,i in these intervals is respectively, 31 and 5.5%.
The highest frequency of appearance of Mmin,i is found for the interval 0.5÷0.75 - 20 times with probability of 37%.
Using the dynamics of integral indices Ki, Mmax,i and Mmin,i, and information on extreme events and climate changes from the past, a preliminary risk assessment of future extreme events could be made.
Conclusion
The character of the changes of annual-average water flow at two river sites with respect to the average multiannual value of river flow Q0 is the one and the same. The character of the changes in the maximum water flow at the river sites with respect to the average multiannual value of the maximum water flow Qmax,0 is the same. The character of the changes in the minimal water flow at the same sampling points with respect to the average multiannual value of the minimum water flow Qmin,0 is one and the same, too.
The proposed integral indices provide the possibility of evaluating the climate impact on the Mesta River flow formation but they may also be applied for other rivers on regional, national and transboundary level.
Using integral indicators, high water years, dry years, flood and drought effects are identified which is a preliminary estimation of the risk assessment of flood events and drought events.
With proposed integral indicators it is possible to investigate the influence of climate on the formation of the average annual maximum-minimum water flow and to establish and predict possible hazardous events along the river catchment.
Acknowledgement
The authors would like to express their sincere gratitude for the financial support (project DO-02-352) by the National Science Fund of Bulgaria.
References [1] Diadovski I., Petrov M., Brankova L. and Bournaski E.: J. Environ. Protect. Ecol., 2004, 5, 487-494. [2] Diadovski I., Petrov M., Ilkova T. and Ivanov I.: Chem. Biochem. Eng. Q., 2005, 19, 291-296. [3] Meybeck M. and Fustec G.: La Seine et son bassin. Elsevier, Paris 1998. [4] European Parliament and Council: Water Framwork Directive, 2000/60/ EU. Brussels 2000. [5] Bratanova-Doncheva S. and Chipev N.: Ecol. Eng. Environ. Protect., 2004, 2, 25-35. [6] Amoros C. and Tetts G.: Hydrosysteme fluvieux. Masson, Paris 1993. [7] Bilger B.: Global Warming: Earth at Risk. Chelsea House Publishers, New York 1992. [8] McGuen R.H.: Hydrologic analysis and design. Prentice Hall, New York 1989. [9] Anderson M.G. and Burst T.P.: Hydrological forecasting. John Willey and Sons, Chichester 1985. [10] Tardy Y.: Le cicle de l’eau, climates, paleoclimats et geochemie global. Masson, Paris 1986. [11] Diadovski I., Atanassova M. and Ivanov I.: Environ. Monit. Assess., 2007, 127, 383-388. [12] EU Commission: Framework Directive 2007/60/EO. Brussels 2007. [13] Microcal Software Inc.: Origin 6.0. Getting Started Manual, v. 7. Copyright by Origin Lab Corporation,
Northampton, MA, USA, 2002. [14] Sachs L.: Angewandte Statistik. Anwendung Statistischen Methoden. Springer Verlag, Berlin 1971. [15] Stegmann R., Ehring J. and Lien P.: Wasser und Boden, 1978, 3, 50-54.

Ivan Diadovski, Maya Atanassova and Vasil Simeonov
332
[16] Diadovski I., Atanassova M. and Simeonov V.: Guide for Application to the Program for Statistical Analysis from Monitoring Data, Modeling and Water Quality Assessment on the Struma River. PublishScieSet-Eco, Sofia 2008.
[17] Simeonov V.: Principles of Data Treatment of Analytical Results. University Press, Sofia 1997. [18] Simeonova P., Simeonov V. and Andreev G.: Centr. Eur. J. Chem., 2003, 2, 121-136. [19] Fikova R. and Ignatova N.: Ekológia (Bratislava), 2002, 21, 283-297. [20] Astel A., Tsakovski S., Barbieri P. and Simeonov V.: Water Res., 2007, 41, 4566-4578.
OCENA RYZYKA WYSTĄPIENIA ZJAWISK EKSTREMALNYCH SPOWODOWANYCH PRZEZ RZEKĘ MESTA W BUŁGARII
NA PODSTAWIE ANALIZY WSKAŹNIKÓW INTEGRALNYCH
Abstrakt: Przedstawiono zastosowanie oryginalnej metody oceny wpływu czynników klimatycznych i antropogennych na średni roczny, maksymalny i minimalny przepływ wody w rzece Mesta, płynącej przez terytorium Bułgarii. Wpływ poziomu przepływu i ocena ryzyka jest określany przez wskaźnik Ki modułu przepływu, który uwzględnia odchylenie wartości średniego rocznego przepływ wody Qi od normy przepływu Q0. Indeks Mmax odzwierciedla odchylenie maksymalnego przepływu wody od normy maksymalnej Qmax,0, natomiast indeks Mmin,i określa odchylenie minimalnego przepływ wody od normy minimalnego przepływu Qmin,0. Do oceny częstości występowania zjawisk ekstremalnych (powodzie, susze) w wybranych przedziałach czasu za pomocą indeksów integralnych Mmax,i i Mmin,i, zastosowano histogramy. Funkcją opisującą rozkład częstotliwości występowania Mmax,i i Mmin,i jest wielomian trzeciego stopnia. Proponowane nowe podejście zakłada wprowadzenie bardziej szczegółowych wskaźników oceny ryzyka oddziaływania czynników klimatycznych na przepływ wody w rzece (Ki, Mmin,i i Mmax,i). Metoda została po raz pierwszy wykorzystana do oceny wpływu warunków klimatycznych na przepływ wód rzeki Mesta w punkcie pomiarowym Yakoruda (przy źródle rzeki) oraz w punkcie Khadzhidimovo (na granicy bułgarsko-greckiej). Badania prowadzono w latach 1955-2008. Należy podkreślić, że wskaźniki mają naturę integralną, ponieważ są one wyrazem szczególnych warunkach klimatycznych powodujących lata wilgotne, lata suche, powodzie oraz susze.
Słowa kluczowe: wskaźniki integralne, wpływ klimatu, oceny ryzyka, przepływ rzeki, zjawisko ekstremalne
ECOLOGICAL CHEM ISTRY AND ENGINEERING S
Vol. 18, No. 3 2011
Stanislaw Z. LABUDA1* and Aleksandr A. VETCHINNIKOV2
SOIL SUSCEPTIBILITY ON REDUCTION AS AN INDEX OF SOIL PROPERTIES APPLIED IN THE INVESTIGATION UPON SOIL
DEVASTATION
PODATNOŚĆ GLEBY NA REDUKCJĘ JAKO WSKAŹNIK WŁAŚCIWOŚCI GLEBY ZASTOSOWANY W BADANIACH NAD DEWASTACJĄ GLEBY
Abstract: The investigations were conducted on the soil samples taken from two localities on two objects: the cultivated soils and the devastated soils caused by building of oil pipelines near Nizhniy Novgorod, Russia. Measurements of redox potential were conducted in soil suspension at the soil to water ratio as 1:1 under the standard laboratory conditions. The soil susceptibility on reduction (SSR) index define the decrease of redox potential in time on one day of incubation and expressed in mV per day. Conducted investigations showed the soil susceptibility on reduction indices had been counted in three ways were significantly diverse, both between studied soils as also between the soils devastation. The soil susceptibility on reduction index can be considered as the useful and universal index of soil fertility or soil quality, too. Determination of the soil susceptibility on reduction can be the easy and practically useful method in the investigations of soils, because the simple measurements of redox potential may be execute two times only, the first measurement after preparing the soil suspension and the second measurement in the last day of incubation accepting, at the first day of soil suspension preparation and the last day of measurements enough just a week.
Keywords: Russian Federation, soil redox potential, soil susceptibility on reduction, soil devastation
Measurements of soil redox potential, besides soil reaction and electrolytic conductivity there are the three main indices of a soil solution that depends on temperature. These indices determination is helpful in evaluating the extremely complex transformations within the soil. It is characteristic that the indices cannot be determined directly in natural soil, because to measurements an appropriate soil moisture is required, as at any electrolytic measurements, and such determination describe current soil status. These indices can also be used to evaluate constant soil properties, and the determinations can be performed using a simulated soil solution prepared from a dry soil material. The practical advantage of these
1 Department of Agricultural and Environmental Chemistry, Lublin University of Natural Sciences, ul. Akademicka 15, 20-033 Lublin 2 Department of Agricultural Chemistry and Agroecology, Nizhniy Novgorod State Agricultural Academy, Nizhniy Novgorod, Russian Federation, email: [email protected] * Corresponding author: [email protected]
Stanislaw Z. Labuda and Aleksandr A. Vetchinnikov
334
measurements carried out using various methods, there is the easiness of the realization of measurements, but this is also the dangerous defect, because the scientist has to be really sure that the measurement is appropriate indeed. The soil redox potential phenomenon is extremely important in science, however it is a complex problem in soil science, too, especially in the range of practical interpretation.
Measurements of pH index in the soil are often made and other indices based on soil redox potential measurements are used in soil investigations. That, chemical transformation of various compounds and elements in the soil are based upon reactions of redox indeed, and the microorganisms are a main force of transformations of the majority chemical reactions in the soil [1-9]. Most often, redox potential measurements are used to describe the chemical environment of chemical compounds transformation within a soil, mainly in the flooded soils [10-20], and also transformations and the changes of air-water ratios in the soils as a measuring of soil aeration conditions [21-24]. Characteristic environmental indices can be used to evaluate specific factors of a human influence on an natural environment [25] however, it can be referred to as pressure, it means indeed anthropopressure, and in English it may be named as anthropopression [26].
When considering redox potential (Eh) in the soil, a thesis can be put on, that the phenomenon assume many aspects of soil properties both physical, chemical, and biological and can be practically useful to evaluate the fertility or quality of soils. Such useful role may be made by an index based on measurements of redox potential in a soil, it was named susceptibility soil on reduction (SSR) index, which was proposed by Labuda [27], the SSR index express the decrease of redox potential in time. Measurements of redox potential to evaluate the soil susceptibility to reduction are carried out in soil water suspension in the standard laboratory conditions and are expressed in mV per day. Studies upon the SSR index were carried out both during considerations on agrisystem and natural environment quality assessment [28-32].
Soil fertility, as a complex notion, may be in general defined as interactions between soil properties and soil conditions [33], and the soil quality is much more complex notion, because it is formed from wide range of notions and definitions derived and based on the soil functions and most often refer to a cultivated field, but also to natural environment, thus appropriate soil quality indices are searched for in the wide review [34]. Degradation of soils and ways to its quantifing by various soil quality indices is considered as important scientific aim [35]. Destructing of soils, especially such caused by physical factors, named devastation of soils, create the serious agricultural and environmental problems [36, 37].
Methods
Soil samples were collected from 0÷25 cm layer of two soils near Nizhniy Novgorod, Russia in October 2008: 1. Locality Nizhegorodets, latitude 56ºN and longitude 43ºE on gray wooded soil. 2. Locality Inyutino, latitude 55ºN and longitude 43ºE on turf-podzolic soil. According to assumptions as 6 representative average soil samples from the cultivated field and 6 representative average soil samples from devastated soil caused by building of oil pipelines were collected in each locality. The statistical design of the experiment for the Eh and pH measurements included 2 soils, 2 treatments in 6 replications, and 7 measurement times in the six day experimental period.
Soil susceptibility on reduction as an index of soil properties applied in the investigation …
335
Soil samples were dried out under normal conditions at about 20ºC and sieved through 1 mm mesh. The soil particle size distribution were made with the Casagrande aerometric method, pH in 1 mol KCl solution at soil:water as 1:1 ratio, exchangeable cations, potassium, calcium, magnesium, sodium were determined in 1 mol ammonium acetate solution, and total exchangeable bases (TEB) were calculated, exchangeable hydrogen ions determined in 1 mol sodium acetate at pH 7, and cation exchangeable capacity (CEC) were calculated, next base saturation (BS) were calculated as ratio of TEB/CEC and expressed in [%], calculating too cation saturation state (CSS) index as total exchangeable bases (TEB) to exchangeable hydrogen ions ratio (H), it means the CSS = TEB/H [38, 39].
Four varied-valence elements in soil were determined, organic carbon by Tiurin’s method, total nitrogen by Kjeldahl's method, iron and manganese contents were determined in 1 mol HCl solutions, Mn and the Fe elements concentrations in soil extracts were measured by atomic absorption spectrophotometry methods using apparatus the Hitachi Z-8200. Ratios of elements were calculated on a base of amount of substance as sequence of given element to next ones, such ratios can be define as molar element ratios. The chemical analysis in each experimental treatments were made six times and then the data of all soil analyses were statistically processed applying analysis of variance and the Tukey's significance test, moreover, confidence intervals for arithmetic
mean LyµLy +<<− were calculated and expressed as ±L at significance level
of α = 0.05. The redox potential and pH values measurements were made in soil suspension, it
means as simulated soil solution at soil to water ratio as 1:1. The suspensions were made from amounts of 50 g soil and added 50 cm3 distilled water. All measurements were performed at ambient temperature 25ºC. Redox potential determinations were made using platinum an electrode: size of 5 mm length and 0.5 mm diameter, the calomel electrode EK-602 was applied as reference. Polarization time for measuring electrode was 180 seconds. The pH measurements were made using glass-calomel combined electrode. The Eh and pH determinations were carried out in subsequent time in 1 hour and then in 1, 2, 3, 4, 5, and 6 days in each analytical samples in accordance with the statistical design of the laboratory experiment. Both Eh and pH measurements were carried out with a help of ELSTER Microcomputer pH Meter P731. Potential of calomel electrode +245 was added to every redox potential Eh reading value and the results of Eh were expressed in mV. The pH data were recalculated onto hydrogen ions concentration as [H+] = 10–pH and expressed in µmol [H+] dm–3. The electron activity (the pe value) was calculated as pe = Eh/59. Experimental data were presented on graph with linear equations y = bxyx + c at sample size n = 168. Correlation coefficients rxy and coefficients of determination R2 were also counted. Smaller sample size were taken into counts when relationships between examined features for four objects of the statistical design were calculated in the case the sample size for n = 42. Taking into account that the real relationships between measurement data and redox potential values was not linear, thus regression coefficients bxy were calculated within line sections for 1 hour to 3 day period and the sample size then was n = 24. To compare variability of experimental data expressed in different statistical characteristics as coefficient
of variability (CV) expressed in [%], which was calculated as ratio of standard deviation to arithmetic mean.

Stanislaw Z. Labuda and Aleksandr A. Vetchinnikov
336
Results
The main environmental factor in present study was soil devastation during building the oil pipelines and its influence on examined soil properties both physical and chemical features was very diverse (Table 1).
Table 1 Some physical and chemical properties of examined soils as affected by soil devastation
Sample size n = 24 Nizhegorodets Inyutino
Specification Index or unit Soil Devastation Soil Devastation
Sand* [%] 58 36 74 77
Silt* [%] 38 50 24 19
Clay* [%] 4 14 2 4
pH** 5.7 6.9 6.6 4.9
BS*** [%] 77 ±1 b 98 ±1 d 86 ±2 c 58 ±6 a
CSS**** 3 ±1 a 42 ±10 b 6 ±1 a 1 ±1 a
C/N# 11 ±4 ns 17 ±11 ns 8 ±2 ns 5 ±1 ns
C/Fe# 39 ±1 ns 19 ±7 ns 46 ±5 ns 29 ±4 ns
C/Mn# 236 ±7 a 224 ±107 a 197 ±17 a 394 ±35 b
N/Fe# 4 ±1 ns 1 ±1 ns 6 ±2 ns 6 ±2 ns
N/Mn# 24 ±6 a 18 ±9 a 26 ±6 a 80 ±24 b
Fe/Mn# 6 ±1 a 11 ±2 b 4 ±1 a 14 ±2 b
CaCO3 [mg kg–1] 80 ±30 a 8020±3420 b 450 ±460 a 70 ±30 a
* Soil particle size distribution. ** Statistical counts are not permitted for pH values. *** Base saturation index. **** Cation saturation state index. # The element ratios were calculated on molar basis. ± Values of confidence interval for arithmetic mean at α = 0.05. The same letters in the same rows indicate no significant differences between mean values. ns - not significant.
The soil properties as relatively constant soil features including chemical, physical, and biological properties, and in general the properties of soil can be determined in dry soil samples. However, the important indices of soil solution are determined usually in a soil suspension, but if in the soil samples will be more of water and time of measurements will be longer then both the pH and the Eh values indicates quick changes.
Soil redox potential as the Eh index was the main measurements subject of present study. However, the great differentiation within pH values in soil suspension confirm, that pH index should be appropriately interpreted because the pH index it is the special index indeed [40].
Measurements of the pH value were changed only slightly and calculated values of hydrogen ions concentration decreased by 0.1 µmol [H+] dm–3 per day. Measurements of the Eh values for the whole experiment indicate that the Eh decreased by 51 mV per day, while calculated values of electron activity (pe) decreased by 0.9 per day (Fig. 1).
Comparing the measured and calculated features between values of pH and Eh, pH and pe, as well as between hydrogen ions concentration and Eh and pe values indicates that Eh

Soil susceptibility on reduction as an index of soil properties applied in the investigation …
337
increased by 110 mV when hydrogen ions concentration in soil suspension increased by 1 µmol [H+] dm–3, pe increased by 1.9, hydrogen ions concentration increased by 1 µmol [H+] dm–3.
1A The pH measurements
5
6
7
8
0 1 2 3 4 5 6
Day
pH
1B The pH recounted into [H+]
y = -0.099x + 0.678
rxy = -0.372** R2 = 0.138
0
1
2
3
0 1 2 3 4 5 6
Dayu
mol [H
+] d
m-3
1C The Eh measuermants
y = -51.081x + 455.14
rxy = -0.791** R2 = 0.626
0
200
400
600
0 1 2 3 4 5 6
Day
mV
1D The pe as counted values
y = -0.866x + 7.714
rxy = -0.791** R2 = 0.626
0
2
4
6
8
10
0 1 2 3 4 5 6
Day
pe
Fig. 1. Graph 1A - dependences between measurement time since 1st hour till 6th day and pH values.
Graph 1B - relationships between measurement time since 1st hour till 6th day and pH values recounted onto [H+] values. Graph 1C - relationships between measurement time since 1st hour till 6th day and measured redox potential values. Graph 1D - relationships between measurement time since 1st hour till 6th day and pe as counted values. Sample size n = 168
It is also easy to see, that the distribution of measured dependencies between pH and Eh as well as pH and calculated pe values is identical, which in addition is confirmed by correlation and determination coefficients for relationship between [H+] and Eh, as well as [H+] and pe. Therefore, the thesis can be put that measured Eh or recalculated features [H+] may be of a practical significance, while calculated variables such as pe are of negligible theoretical and practical importance (Fig. 2). Study results of all pH and Eh measurements along with pH values recalculated onto hydrogen ions concentration and calculated pe values indicate that all studied features oscillated within very wide range and were characterized by great variability, which was confirmed by all statistical indices (Table 2).

Stanislaw Z. Labuda and Aleksandr A. Vetchinnikov
338
2A The pH & Eh dependences
0
200
400
600
0 2 4 6 8 10
pH
mV
2B The [H+] & Eh relationships
y = 110.653x + 259
rxy = 0.455** R2 = 0.207
0
200
400
600
0 1 2 3
u mol [H+] dm
-3
mV
2C The pH & pe dependences
0
2
4
6
8
10
0 2 4 6 8 10
pH
pe
2D The [H+] & pe relationships
y = 1.875x + 4.390
rxy = 0.455** R2 = 0.207
0
2
4
6
8
10
0 1 2 3
u mol [H+] dm
-3
pe
Fig. 2. Graph 2A - dependences between measured pH values and measured redox potential values.
Graph 2B - relationships between hydrogen ions concentration [H+] values and measured redox potential values. Graph 2C - dependences between measured pH values and pe values. Graph 2D - relationships between hydrogen ions concentration [H+] values and pe values. Sample size n = 168
Table 2 The general results of measurement features in simulated soil solution of the examined soils
Measured or calculated indices Sample size
n = 168 Values of
pH index
Concentration of [H+]
[µmol [H+] dm–3]
Redox potential Eh
[mV]
Values of pe
Maximum1 5.61* 2.454709 575.6 9.7 Minimum2 7.53* 0.029512 114.8 1.9
Range3 2.425 460.8 7.8 Deviation4 0.527 128.1 2.2
Mean5 0.381 301.1 5.1 Interval6 ±0.080 ±19.5 ±0.3 Median7 0.150 259.9 4.4
Skewness8 2.081 0.722 0.721 Variation9 [%] Above 100% 43% 43%
* The values are correct because the pH -5.61 > pH -7.53, and statistical counts are not permitted for pH values. 1 Maximum value, 2 Minimum value, 3 Range of values, 4 Standard deviation, 5 Arithmetic mean, 6 Confidence interval at α = 0.05, 7 Value of median, 8 Coefficient of skewness, 9 Coefficient of variation
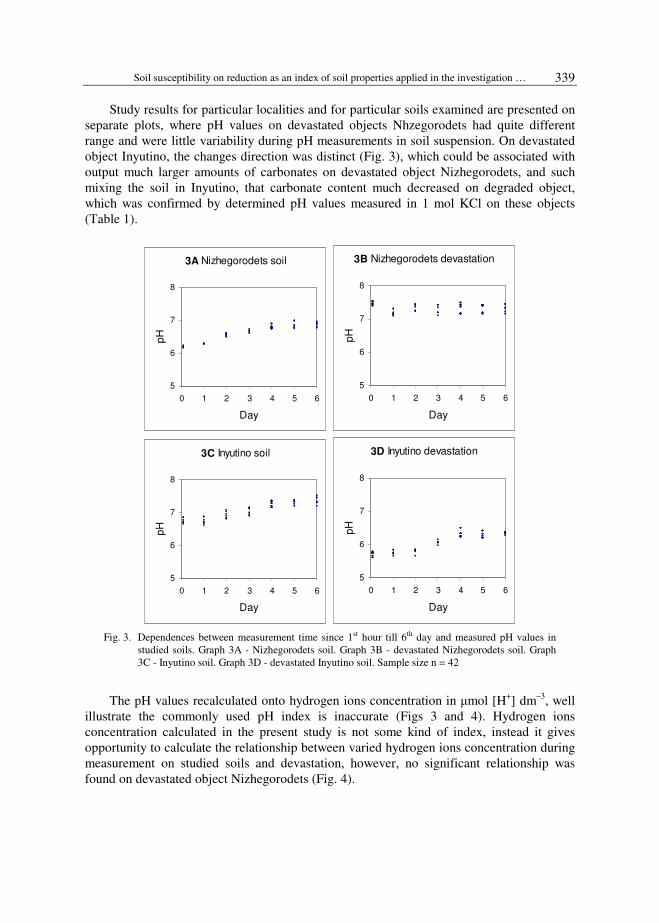
Soil susceptibility on reduction as an index of soil properties applied in the investigation …
339
Study results for particular localities and for particular soils examined are presented on separate plots, where pH values on devastated objects Nhzegorodets had quite different range and were little variability during pH measurements in soil suspension. On devastated object Inyutino, the changes direction was distinct (Fig. 3), which could be associated with output much larger amounts of carbonates on devastated object Nizhegorodets, and such mixing the soil in Inyutino, that carbonate content much decreased on degraded object, which was confirmed by determined pH values measured in 1 mol KCl on these objects (Table 1).
3A Nizhegorodets soil
5
6
7
8
0 1 2 3 4 5 6
Day
pH
3B Nizhegorodets devastation
5
6
7
8
0 1 2 3 4 5 6
Day
pH
3C Inyutino soil
5
6
7
8
0 1 2 3 4 5 6
Day
pH
3D Inyutino devastation
5
6
7
8
0 1 2 3 4 5 6
Day
pH
Fig. 3. Dependences between measurement time since 1st hour till 6th day and measured pH values in
studied soils. Graph 3A - Nizhegorodets soil. Graph 3B - devastated Nizhegorodets soil. Graph 3C - Inyutino soil. Graph 3D - devastated Inyutino soil. Sample size n = 42
The pH values recalculated onto hydrogen ions concentration in µmol [H+] dm–3, well illustrate the commonly used pH index is inaccurate (Figs 3 and 4). Hydrogen ions concentration calculated in the present study is not some kind of index, instead it gives opportunity to calculate the relationship between varied hydrogen ions concentration during measurement on studied soils and devastation, however, no significant relationship was found on devastated object Nizhegorodets (Fig. 4).
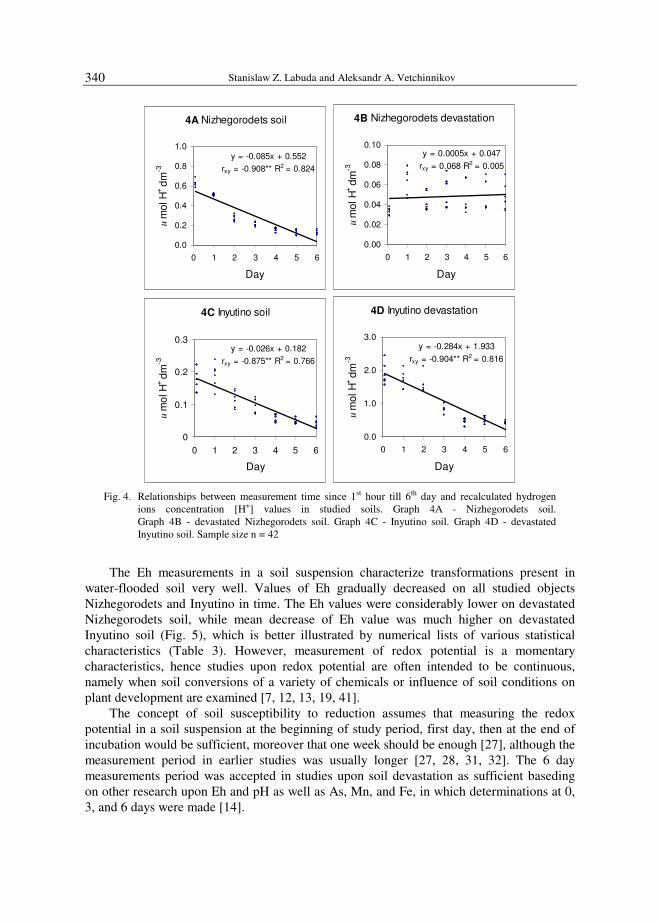
Stanislaw Z. Labuda and Aleksandr A. Vetchinnikov
340
4A Nizhegorodets soil
y = -0.085x + 0.552
rxy = -0.908** R2 = 0.824
0.0
0.2
0.4
0.6
0.8
1.0
0 1 2 3 4 5 6
Day
um
ol H
+ d
m-3
4B Nizhegorodets devastation
y = 0.0005x + 0.047
rxy = 0.068 R2 = 0.005
0.00
0.02
0.04
0.06
0.08
0.10
0 1 2 3 4 5 6
Day
um
ol H
+ d
m-3
4C Inyutino soil
y = -0.026x + 0.182
rxy = -0.875** R2 = 0.766
0
0.1
0.2
0.3
0 1 2 3 4 5 6
Day
um
ol H
+ d
m-3
4D Inyutino devastation
y = -0.284x + 1.933
rxy = -0.904** R2 = 0.816
0.0
1.0
2.0
3.0
0 1 2 3 4 5 6
Day
um
ol H
+ d
m-3
Fig. 4. Relationships between measurement time since 1st hour till 6th day and recalculated hydrogen
ions concentration [H+] values in studied soils. Graph 4A - Nizhegorodets soil. Graph 4B - devastated Nizhegorodets soil. Graph 4C - Inyutino soil. Graph 4D - devastated Inyutino soil. Sample size n = 42
The Eh measurements in a soil suspension characterize transformations present in water-flooded soil very well. Values of Eh gradually decreased on all studied objects Nizhegorodets and Inyutino in time. The Eh values were considerably lower on devastated Nizhegorodets soil, while mean decrease of Eh value was much higher on devastated Inyutino soil (Fig. 5), which is better illustrated by numerical lists of various statistical characteristics (Table 3). However, measurement of redox potential is a momentary characteristics, hence studies upon redox potential are often intended to be continuous, namely when soil conversions of a variety of chemicals or influence of soil conditions on plant development are examined [7, 12, 13, 19, 41].
The concept of soil susceptibility to reduction assumes that measuring the redox potential in a soil suspension at the beginning of study period, first day, then at the end of incubation would be sufficient, moreover that one week should be enough [27], although the measurement period in earlier studies was usually longer [27, 28, 31, 32]. The 6 day measurements period was accepted in studies upon soil devastation as sufficient baseding on other research upon Eh and pH as well as As, Mn, and Fe, in which determinations at 0, 3, and 6 days were made [14].

Soil susceptibility on reduction as an index of soil properties applied in the investigation …
341
5A Nizhegorodets soil
y = -66.622x + 489.8
ry x = -0.884** R2 = 0.781
0
200
400
600
0 1 2 3 4 5 6
Day
mV
5B Nizhegorodets devastation
y = -43.344x + 425.9
rxy = -0.725** R2 = 0.526
0
200
400
600
0 1 2 3 4 5 6
Day
mV
5C Inyutino soil
y = -36.864x + 405.6
rxy = -0.689** R2 = 0.474
0
200
400
600
0 1 2 3 4 5 6
Day
mV
5D Inyutino devastation
y = - 57.494x + 499.3
rxy = -0.874** R2 = 0.764
0
200
400
600
0 1 2 3 4 5 6
Day
mV
Fig. 5. Relationships between measurement time since 1st hour till 6th day and measured redox potential
values. Graph 5A - Nizhegorodets soil. Graph 5B - devastated Nizhegorodets soil. Graph 5C - Inyutino soil. Graph 5D - devastated Inyutino soil. Sample size n = 42
Table 3 Redox potential values in simulated soil solution as affected by soil devastation
Nizhegorodets Inyutino Soil Devastation Soil Devastation
Sample size n = 42
[mV] Maximum1 554.4 519.8 508.8 575.6 Minimum2 114.8 137.6 133.1 167.2
Range3 439.6 382.2 375.7 408.4 Deviation4 150.9 119.7 107.2 131.7
Mean5 288.9 295.2 294.5 326.0 Interval6 ±47.0 ±37.3 ±33.4 ±41.0 Median7 223.1 269.0 261.8 273.1
Skewness8 0.768 0.530 0.775 0.837 Variation9 [%] 52% 41% 36% 40%
1 Maximum value, 2 Minimum value, 3 Range of values, 4 Standard deviation, 5 Arithmetic mean, 6 Confidence interval at α = 0.05, 7 Value of median, 8 Coefficient of skewness, 9 Coefficient of variation.
It was confirmed by the fact that linear dependence of Eh decrease during measurements in studies upon Nizhegorodets and Inyutino soil devastation occurred up to

Stanislaw Z. Labuda and Aleksandr A. Vetchinnikov
342
the 3rd day, and for sample size n = 24 correlation coefficients were as follows: Nizhegorodets soil rxy = –0.935, and Nizhegorodets devastation rxy = –0.963, while Inyutino soil rxy = –0.978, and Inyutino devastation rxy = –0.970, corresponded values were much lower when taken during 6 day period (Fig. 5).
Indices of soil susceptibility to reduction were determined using three ways. Taking into account all measured Eh values firstly, as values of the first and last measurement, secondly, as maximum and minimum values, thirdly, as values of regression coefficient for linear dependence. It can be assumed that in the case of studies upon susceptibility to reduction, considering all measurements made in subsequent days of the whole period would be appropriate, although the period should not be longer than one week, because the solution volume in vessels filled with soil suspension much decreases for a longer time. Performed study revealed values of SSR for measurements since 1 hour to 3 days and for sample size n = 24 as 109 mV/day redox potential decrease of Nizhegorodets soil, while 106 mV/day for Inyutino soil and 111 mV/day for devastated soil, which means that in Nizhegorodets, soil devastation affected the higher soil susceptibility to reduction, whereas in Inyutino, it had an effect of improving the soil susceptibility to reduction (Table 4).
Table 4 The ways of defines of soil susceptibility on reduction for two examined soils as affected by soil devastation
Nizhegorodets Inyutino The way
Soil Devastation Soil Devastation For all data of the Eh of measurements period since 1 hour till 6 days* Sample size
n = 42* Soil susceptibility on reduction it means decrease of Eh in mV per day First and last1 63.9 45.1 38.0 58.5 Max and min2 73.2 63.7 62.6 68.0
Coefficient byx3 66.6 43.3 36.8 57.4
Mean 67.9 50.7 45.8 61.3 For data parts of the Eh of measurements period since 1 hour till 3 days** Sample size
n = 24** Soil susceptibility on reduction it means decrease of Eh in mV per day First and last1 109.0 101.1 101.5 106.3 Max and min.2 134.5 77.5 81.2 48.7 Coefficient byx
3 100.7 109.2 106.4 111.5 Mean 114.7 95.9 96.3 88.8
1 The first way for first and last values of measurements of redox potential. 2 The second way for maximum and minimum values of measurements of redox potential. 3 The third way by counts of coefficient of regression byx for all data of measurements of redox potential or for the range data of the linear dependences only. * The counts for all data. See Figure 5. ** The counts for linear data dependences. See Figure 5.
Conclusions
1. Soil devastation diversified many properties of examined soils, which greatly affected the values of measured pH and Eh, as well as calculated features such as hydrogen ions concentration in the soil [H+] and electron activity pe.
2. Studies performed upon soil susceptibility to reduction on two soils and two devastated objects indicate that calculated susceptibility indices were significantly differentiated, and devastated soils in Nizhegorodets and Inyutino were more susceptible to reduction, ie faster decrease of redox potential during measurement period.
3. Practical calculating the appropriate index of soil susceptibility to reduction as an index of soil properties or its quality may be performed applying the easy way, ie by
Soil susceptibility on reduction as an index of soil properties applied in the investigation …
343
measuring the redox potential at the first day of soil suspension preparation and the last assumed measuring day.
References [1] Bartlett R.J. and James B.R.: Redox chemistry in soils. Adv. Agron., 1993, 10, 151-208. [2] Bohn H.L.: Redox potentials. Soil Sci., 1971, 112(1), 39-45. [3] Fiedler S., Vepraskas M.J. and Richardson J.L.: Soil redox potential, importance, field measurements, and
observations. Adv. Agron., 2007, 94, 1-54. [4] Jeffery J.W.O.: Measuring the state of reduction of a waterlogged soil. J. Soil Sci., 1961, 12(2), 317-325. [5] Patrick W.H. and Fontenot W.J.: Growth and mineral composition of rice at various soil moisture tensions
and oxygen levels. Agron. J., 1976, 68(2), 325-329. [6] Patrick Jr., W.H.: Extractable iron and phosphorus in a submerged soil at controlled redox potentials.
Proc. the 8th Int. Congress of Soil Sci., Bucharest, Romania 1964, 4, 605-609. [7] Rabenhorst M.C., Hively W.D. and James B.R.: Measurements of soil redox potential. Soil Sci. Soc.
Amer. J., 2009, 73(2), 668-674. [8] Sommers L.E. and Lindsay W.L.: Effect of pH and redox on predicted heavy metal-chelate equilibria in
soils. Soil Sci. Soc. Amer. J., 1979, 43(1), 39-47. [9] Tabatabai L.B. and Walker H.W.: Oxidation-reduction potential and growth of Clostridium perfringens
and Pseudomonas fluorescens. Appl. Microbiol., 1970, 20(3), 441-446. [10] Bartlett R.J. and James B.R.: System for categorizing soil redox status by chemical field testing. Geoderma,
1995, 68(3), 211-218. [11] David R.: Determining redox system in lakes and rivers; thermodynamic interpretation of insitu
measurements with a platinum electrode. Radiat. Environ. Biophys., 1986, 25(3), 219-229. [12] Gao S., Tanji K.K., Scardaci S.C. and Chow A.T.: Comparison of redox indicators in paddy soil during
rice growing season. Soil Sci. Soc. Amer. J., 2002, 66(3), 805-817. [13] Herbel M.J., Suarez D.L., Goldberg S. and Gao S.: Evaluation of chemical amendments for pH and redox
stabilization in aqueous suspensions of three California soils. Soil Sci. Soc. Amer. J., 2007, 71(3), 927-939.
[14] Masscheleyn P.H., Delaune R.D. and Patrick W.H., Jr.: Effect of redox potential and pH on arsenic
speciation and solubility in a contaminated soil. Environ. Sci. Technol., 1991, 25(8), 1414-1419. [15] Patrick W.H. and Turner F.T.: Effect o redox potential on manganese transformation in waterlogged soil.
Nature, 1968, 220(5166), 476-478. [16] Smith J.H. Gilbert R.G. and Miller J.B.: Redox potentials and denitrification in a cropped potato
processing waste water disposal field. J. Environ. Qual., 1976, 5(4), 397-399. [17] Snakin V.V. and Prisyazhnaya A.A.: Quantitative assessment of the degree of anthropogenic changes in
soil by analyzing the in situ composition of the soil liquid phase. Geoderma, 1997, 75(¾), 279-287. [18] Tanji K.K., Gao S., Scardaci S.C. and Chow A.T.: Characterizing redox status of paddy soils with
incorporated rice straw. Geoderma, 2003, 114(¾), 333-353. [19] Unger I.M., Muzika R.M., Motavall, P.P. and Kabrick J.: Evaluation of continuous in situ monitoring of
soil changes with varying flooding regimes. Commun. Soil Sci. Plant Anal., 2008, 39(11&12), 1600-1619. [20] Yamane I. and Sato K.: Initial rapid drop of oxidation-reduction potential in submerged air-dried soils.
Soil Sci. Plant Nutr., 1968, 14(2), 68-72. [21] Carter C.E.: Redox potential and sugarcane yield relationship. Trans. ASAE, 1980, 23(4), 924-927. [22] Labuda S.: Plant elemental compositions as affected by the soil oxygen stress. Probl. Agrofizyki, 1987, 52,
1-84 (in Polish). [23] Meek D.B. and Grass L.B.: Redox potential in irrigated desert soils as in indicator of aeration status. Soil
Sci. Soc. Amer. Proc., 1975, 39(5), 870-875. [24] Stolzy L.H., Focht D.D. and Fluhler H.: Indicators of soil aeration. Flora, 1981, 171, 236-265. [25] Labuda S.Z.: Element ratios in soil on traffic circles as indices of environmental hazards. Chem. Inż. Ekol.,
2005, 12(½), 93-100. [26] Labuda S.Z.: Trace element ratios in plants as indicators of environmental hazards. Ecol. Chem. Eng. A,
2009, 16(3), 271-276. [27] Labuda S.: Suppleness of soil on reduction as suggestion of a new index of soil fertility. Zesz. Probl. Post.
Nauk Roln., 1995, 421a, 253-259 (in Polish).
Stanislaw Z. Labuda and Aleksandr A. Vetchinnikov
344
[28] Labuda S.: Suppleness on soil reduction as affected by soils chemical properties. Zesz. Probl. Post. Nauk Roln., 1998, 456, 83-87 (in Polish).
[29] Labuda S.: Pliability of soil on reduction in the agronomic assessment soil properties. Proc. Sci. Conf. in the Belarusian State Agricultural Academy. Gorki, Belarus, 1999, pp. 154-157 (in Russian).
[30] Labuda S.Z.: Soil redox potential in urban environmental studies. Proc. Sci. Conf. in the Czech University of Agriculture. Prague, Czech Republic, 2006, 137-142.
[31] Labuda S., Mackowiak C. and Mazurkiewicz I.: Influence of organic matter and nitrogen fertlization on
redox potential in the soil. Folia Univ. Agric. Stetin. 211 Agricultura, 2000, 84, 245-249 (in Polish). [32] Labuda S.Z., Mazurkiewicz I.. and Mackowiak C.: Redox potential in soil as affected by many years of
fertilization. Chem. Inż. Ekol., 2002, 9(4), 419-429. [33] Labuda S.Z.: An essay on the fertilization. Ann. UMCS, Sectio E, Agricultura, 2006, 61, 1-8. [34] Karlen D.L., Ditzler C.A. and Andrews S.S.: Soil quality, why and how? Geoderma, 2003, 114(¾),
145-156. [35] Snakin V.V., Krechetov P.P. Kuzovnikova T.A., Alyabina I.O. Gurov A.F. and Stepichev A.V.: The system
of assessment of soil degradation. Soil Technol., 1996, 8(4), 331-343. [36] Vetchnnikov A.A.: The influence of petroleum trunk-line building on dernovo-podzolic and brightly-grey
forest soils. Proc. Sci. Conf. in the Nizhniy Novgorod State Agricultural Academy. Nizhniy Novgorod, Russia, 2008, 3, 10-13 (in Russian).
[37] Vetchnnikov A.A.: The effect of liming and mineral and organic fertilizers applied on the yielding
of vetch-oats intercropping with mixture mustard cultivated on the gray forest devastated soil. Plodorodie 2010, 3, 4-5 (in Russian).
[38] Labuda S.: A new index of cation saturation state in soil. Commun. Soil Sci. Plant Anal., 1993, 24(13&14), 1603-1608.
[39] Labuda S.: Relationship between cation saturation stage index and hydrogen ions in soil. Zesz. Probl. Post. Nauk Roln., 1994, 413, 205-207.
[40] Covington A.K., Bates R.G. and Durst R.A.: Definition of pH scales, standard reference values,
measurement of pH and related terminology. Pure & Appl. Chem., 1985, 57(3), 531-542. [41] Rabenhorst M.C.: Making soil oxidation-reduction potential measurements using multimeters. Soil Sci.
Soc. Amer. J., 2009, 73(6), 2198-2201.
PODATNOŚĆ GLEBY NA REDUKCJĘ JAKO WSKAŹNIK WŁAŚCIWOŚCI GLEBY ZASTOSOWANY W BADANIACH NAD DEWASTACJĄ GLEBY
1 Katedra Chemii Rolnej Środowiskowej, Uniwersytet Przyrodniczy w Lublinie
Abstrakt: Badania przeprowadzono na próbkach glebach pobranych w dwóch miejscowości na dwóch obiektach gleb uprawnych i gleb zdewastowanych przez budowę rurociągów koło Niżnego Nowgorodu w Rosji. Pomiary potencjału redoks zostały wykonane w wodnej zawiesinie glebowej przy stosunku gleba:woda jak 1:1 w standardowych warunkach laboratoryjnych. Wskaźnik podatności gleby na redukcję (SSR) określa spadek potencjału redoks w czasie na jeden dzień inkubacji i wyrażony był w mV na dobę. Przeprowadzone badania wykazały, że podatność gleby na redukcję obliczona trzema sposobami była znacząco zróżnicowana zarówno między badanymi glebami, jak też między glebami zdewastowanymi. Wskaźnik podatności gleby na redukcję może być rozważany jako przydatny i uniwersalny wskaźnik żyzności gleby lub jakości gleby. Określanie podatności gleby na redukcję może być łatwą i praktycznie przydatną metodą w badaniach gleb, gdyż pomiary potencjału redoks w wodnej zawiesinie glebowej przeprowadza się tylko dwa razy, pierwszy raz po sporządzeniu zawiesiny glebowej i drugi raz w ostatnim dniu inkubacji, przyjmując, że te pomiary można wykonać w jednym tygodniu.
Słowa kluczowe: Federacja Rosyjska, potencjał redoks w glebie, podatność gleby na redukcję, dewastacja gleby
ECOLOGICAL CHEM ISTRY AND ENGINEERING S
Vol. 18, No. 3 2011
Barbara GAWDZIK1 and Jarosław GAWDZIK2
IMPACT OF POLLUTION WITH OIL DERIVATIVES ON THE NATURAL ENVIRONMENT AND METHODS
OF THEIR REMOVAL
WPŁYW ZANIECZYSZCZEŃ SUBSTANCJAMI ROPOPOCHODNYMI NA ŚRODOWISKO PRZYRODNICZE
I METODY ICH USUWANIA
Abstract: The paper presents the characteristics of threats due to petroleum products and its consequences as well as the source of these pollutants. Toxicity of petroleum products is due to their physical and chemical properties. Oil pollution threaten both fauna and flora of contaminated land and underground waters. The paper presents the negative impacts of hydrocarbons on the man and the methods of their removal from the groundwater environment.
Keywords: oil pollution, ground water environment, hydrocarbons, biodegradation
Over a last few years much progress has been made in assessing the impact of chemical contamination on human organism. That results from raised awareness of the effect which extensive industrialisation-induced environmental changes produce on the population health, the frequency of occurrence of specific diseases, and also increased morbidity as regards diseases of civilisation [1, 2].
The report issued by the Government Population Council, entitled Health Safety of
Poland’s Population, of 20th Nov. 2008 indicates that the hazard of developing a disease of civilisation (mainly malignant neoplasm and poisoning) tends to grow in Poland. Oil and its derivatives, which constitute a major source of water and soil pollution, are responsible for heightening the hazard.
Crude oil is a liquid fossil fuel, a mixture of hydrocarbons that have specific smell and range from yellow-brown to black in colour. Crude oil contains hydrocarbons, heteroorganic compounds and inorganic components. Hydrocarbons comprise paraffins,
1 Jan Kochanowski University of Humanities and Sciences in Kielce, ul. Świętokrzyska 15G, 25-406 Kielce, phone 41 349 70 16, fax 41 349 70 19, email: [email protected] 2 Kielce University of Technology, al. Tysiąclecia Państwa Polskiego 7, 25-314 Kielce, phone 41 342 45 71, fax 41 342 45 35 * Corresponding author: [email protected]
Barbara Gawdzik and Jarosław Gawdzik
346
aromatic compounds, naphthenes and olefins. Due to the type of chemical compounds, waxfree, paraffin-base, naphthenic-base and aromatic crude oils are differentiated. Paraffin hydrocarbons are chain saturated hydrocarbons (alkanes) of straight chain (n-paraffins) or branched chain (isoparaffins), which occur in all oil fractions and whose summary content ranges from 70 to 80%. Olefin hydrocarbons (alkenes) are chain unsaturated hydrocarbons, found in small amounts in crude oil, whose concentration increases during thermal treatment. Naphthenic hydrocarbons are cycloalkanes, five- and six-member cyclic compounds. The amount of aromatic hydrocarbons, also known as arenes, depends on the boiling point of a given fraction and ranges from 10 to 15% in petrols, and from 30 to 40% in fractions with a higher boiling point. Single-ring aromatic hydrocarbons are those the most frequently found. They are represented by a group of compounds termed BTEX, an acronym that stands for benzene, toluene, ethylbenzene, and xylenes. Multi-ring aromatic hydrocarbons are represented by: naphthalene, phenanthrene and anthracene. Heteroorganic compounds contain mainly sulphur, nitrogen and oxygen. Sulphuric components comprise sulphides, hydrogen sulphide, mercaptans and thiophenes. Nitric components mainly include pyridine, amides, pyrrole, and also their derivatives. Oxygen containing compounds are carboxylic acids, furanes, phenols, ethers and esters. All fractions, except for non-volatile ones, are primarily used as a fuel. In order to obtain a greater amount of petrols in crude oil processing, hydrocarbon cracking and reforming processes are used. Main crude oil components are shown in Table 1 [3].
Table 1
Crude oil components
Fraction Distillation temp. [°°°°C] Number of carbon atoms
Gas below 20 C1-C4
Petroleum benzin 20÷60 C5-C6
Ligroin (light kerosene) 60÷100 C6-C7
Crude gasoline (petrol) 40÷205 C5-C10 and cycloalkanes
Kerosene 175÷325 C12-C18 and aromatic compounds
Gas oil above 275 C12 and higher
Lubricating oil non-volatile liquid presumably long chains attached to cyclic structures
Asphalt or petroleum coke non-volatile solid polycyclic structures
Sources of contamination by oil derivatives
Generally, oil derivatives (except for BTX) are slightly soluble in water (Table 2), yet even their low content can be sensed, thus making the water non-consumable [4].
Highly industrialised countries were the first to start works on technical means of protecting soils against contamination by oil-derived products. In Poland, thousands of facilities, to a larger or lesser extent, are the source of the pollution of soil and subterranean waters by oil derivatives.
The above-mentioned facilities include: ♦ refineries, ♦ railway rolling stock repair shops,

Impact of pollution with oil derivatives on the natural environment and methods of their removal
347
♦ air, inland and sea transport, ♦ military objects, ♦ oil storing facilities, ♦ oil-transporting vessels, ♦ automotive vehicles, ♦ intermediate pumping stations and filling stations, ♦ power industry, industrial and municipal facilities, ♦ refinery waste and other waste treatment works, ♦ home appliances.
Table 2
Water solubility of selected hydrocarbons (T = 298 K)
Hydrocarbon Molecular formula Water solubility [mg/dm3] n-pentane C5H12 40.7 n-hexane C6H14 9.5 n-octane C8H18 0.68
cyclohexane C6H12 55 benzene C6H6 1780 toluene C7H8 515
p-xylene C8H10 220 m-xylene C8H10 160 o-xylene C8H10 175
Aromatic hydrocarbons constitute an important group in oil-derived substances. They
demonstrate relative volatility and are widely applicable in chemical and petroleum industries. The content of aromatic compounds in diesel oil approximates 25%, whereas in “Super” petrol, it ranges 30÷50% [5].
The potential sources of pollution by BTX group substances (benzene, toluene, xylenes) include refineries, oil storing facilities, filling stations, coke plants, pulp and paper works, clothes dry cleaning shops, chemical and pharmaceutical plants, metal works.
The penetration of the substances mentioned above into the environment results from neglecting safety standards which must be observed while dealing with hydrocarbons, in particular that refers to: ♦ road and rail disasters, in which tanks filled with oil-derived substances are involved, ♦ tank overfilling, ♦ industrial pipelines and tanks leaks, ♦ improper storage of spent solvents.
Characteristics of oil derivatives hazards and their consequences
Natural leaks of crude oil commonly occur in all parts of the world. Leaks of oil products are usually smaller-scale incidents. Virtually all components of crude oil can migrate to soil and groundwaters, yet they are oil-derived fuels that most frequently penetrate into the environment. That results from the highest participation of those fractions in the petroleum product market. Oil leaks are classified as dangerous wastes (classification code 050105) [6].

Barbara Gawdzik and Jarosław Gawdzik
348
Oil infiltrating into the soil causes the gluing of spaces via which water and air are transported. That results in soil caking leading to changes in its physical, chemical and biological properties, and also to the worsening of soil productivity. In the soil, hydrocarbon components of oil cover the surface of soil particles with an insulation film and, forming chemical bonds, they combine with organic components of soil humus. Consequently, hydrocarbons are primarily deposited in upper soil horizon. Thus the more humus a soil contains, the stronger it absorbs the oil-derived pollutants. Oil contamination by crude oil and its derivatives results in the following [7]: ♦ dramatic changes in the quantities and composition of soil organic components, ♦ diminished soil water-holding capacity and hampered air exchange due to the filling
of soil pores, and at the same time, increased oxygen demand, ♦ disturbed ratio of organic carbon to nitrogen and phosphorus, which makes it
impossible for biological life to develop correctly, ♦ disturbed properties of soil colloids, including ion exchange and pH value (mainly soil
acidification). Oil-derived products spilt over the soil surface can penetrate to a great depth. Soluble
components of those fluids become a source of pollution and can be transferred far enough to reach the table of subterranean waters. The presence of hydrocarbons in water alters its organoleptic features already at low concentrations of the order of 0.01 g/m3. Pollution of this type is dangerous for biological life due to the formation of surficial emulsified layers that cut off the atmospheric oxygen supply, and also to the sedimentation of heavier water-insoluble fractions and a toxic action of dissolved components [8].
Oil-derived contaminants pose a threat to both fauna and flora of the polluted area, and also to subterranean waters, which are a reservoir of drinking water. The toxicity of oil-derived products results from their physical and chemical properties. Because of their physical parameters, thick hydrophobic oils block soil pores thus restricting the air supply to deeper soil strata. The oils also impede, to a great extent, the supply of water to plant roots. Additionally, they glue the surfaces of leaves thus obstructing the passage of light, air and water. Consequently, plants die, which leads to a drop in vegetal productivity. Chemical properties of hydrocarbons, on the other hand, are responsible for their toxicity to higher organisms, including humans [9].
Hydrocarbons are capable of penetrating into and cumulating in living organisms. They enter organisms through the respiratory tract, in the form of inhaled vapours, skin and the alimentary canal with food and water uptake. Some oil is accumulated in fatty tissue, where because of their hydrophobic character, hydrocarbons readily dissolve in fats and migrate to the nervous system producing a toxic effect on it. Aliphatic hydrocarbons exert a paralysing effect on the central nervous system and have a narcotizing action (benzene, an aromatic hydrocarbon demonstrates a similar action) [10]. Lipophilic hydrocarbon components of oil migrate into human cells also by infiltrating lipoprotein cell membranes. Hydrocarbon biotransformation occurs mainly in the liver and kidneys. Their metabolic path for degradation involves an oxidation process resulting in the formation of neuro-, hepato- and nephrotoxic alcohols. For instance, in hexane oxidation, hexane-2,5-dione is formed which produces a greater devastation in the organism than hexane substrate. Epoxides derived from hydrocarbons adversely affect cell mitosis, destabilize and distort the structure of nucleic acids and proteins, and also cause mutations in the genetic material [11, 12].

Impact of pollution with oil derivatives on the natural environment and methods of their removal
349
Oil-derived hydrocarbons, such as benzene, toluene and xylenes, are substances classified as dangerous, which through direct absorption, especially by consuming contaminated water, can cause acute poisoning or chronic diseases. Those can produce skin and eye irritation, damage kidneys, liver or even the central nervous system. Research has proved that group of compounds pose a danger of producing mutagenic and cancerogenic effect for human organisms [13-15].
Prolonged exposure to benzene and its homologues damages bone marrow leading to the development of aplastic anaemia and the induction of leukaemia (especially an acute form of the disease) and lymphoma [16-18].
Benzene, a major component of engine oils, is a strong toxin that affects the hematopoietic system. Long-lasting action of the compound can produce pancytopenia, ie diminished formation of all types of blood cells. Benzene degradation, on the other hand, leads to the formation neurotoxic phenol [11, 19, 20].
Following epoxidation or hydroxylation, a majority of hydrocarbons leave the body with the urine. Some oil-derived hydrocarbons are excreted from the body via the lungs with exhaled air. Some hydrocarbons, however, accumulate in the fatty tissue and damage internal organs, which is manifested with inflammatory states, serous exudates, ecchymoses and degenerations. Prolonged exposure to the action of oil-derived contaminants (eg by consuming contaminated food and water) leads to hematopoeitic process disturbances, namely low blood haemoglobin levels, a decline in erythrocyte numbers, granulocytopenia or thrombocytopenia. Bone marrow becomes fibrotic and shows steatosis while the movement of the muscles is weakened. As many components of oil-derived products form complex compounds with lipid hormones, hormonal disorders are also frequently found. People suffering light or chronic poisoning with oil-derived hydrocarbons develop headaches, albuminuria, cough, tinnitus, nervous irritability, insomnia, light pulmonary oedema. All the symptoms mentioned above are non-specific, therefore it is difficult to relate them to actual causes.
Adverse action of oil-derived hydrocarbons can be linked to the occurrence of the following mechanisms: ♦ physical, that involves blocking food supply for plants in the soil environment and
depriving the root system of oxygen supply, ♦ pharmacologic, related to the direct toxic action on the living organism, ♦ histopathologic.
Table 3
Admissible values of selected oil-derived substances in soil and subterranean water in accordance with the so-called Dutch List
Soil [mg/kg] Subterranean water [µµµµg/dm3] Substance
A B C A B C
Benzene 0.01 0.50 5.00 0.20 1.00 5.00
Toluene 0.05 3.00 30.00 0.50 15.00 50.00
Xylene 0.05 5.00 50.00 0.50 20.00 60.00
Aliphatic hydrocarbons 0.10 5.00 50.00 1.00 10.00 50.00
Toxic hazards following oil-derived substances leaks increase with lower temperatures.
The phenomenon is connected with the lowering of vapour pressure and a fall in the system

Barbara Gawdzik and Jarosław Gawdzik
350
capability of contaminant biodegradation. The dynamics of physical and chemical processes and microbiological changes in the presence of oil-derived hydrocarbons depends on environmental factors [21].
In order to protect public health in the EU countries, the so-called Dutch List was compiled, which specifies reference values for oil-derived hydrocarbons in the soil and water environments. The major items from the list are presented in Table 3 [22].
As regards potential environmental hazards, three areas are differentiated while taking into account sozology and urban development [23]: a) A area:
♦ statutory protected areas (nature reserves, national parks and special protection zones),
♦ medicinal waters areas, ♦ basins of underground water reservoirs and water intake zones,
b) B area: ♦ food crops areas, ♦ forests, ♦ residential areas, ♦ recreation and leisure areas, community facilities, ♦ storage sites for communal and industrial wastes,
c) C area: ♦ industrial crops areas, ♦ airports and military training grounds, ♦ liquid and solid fuel storing facilities, ♦ industrial works, ♦ transportation routes.
Methods of removal of oil-derived contaminants from soil and water environments
The assessment of a potential environmental pollution can be made after carrying out thorough investigations that combine aspects of geology, microbiology and chemistry.
Soil cleaning technologies are, as a rule, multi-stage. The most important action to be taken is to restrict the spreading of pollution and then to remove the contaminant from the surface of the affected area with mechanical means.
From the technical standpoint, the possibilities of confining hydrocarbon spreading in the soil are limited. Piezometers and systems of wells from which fuel is pumped out are commonly used.
In order to limit hydrocarbon migration, hydraulic barriers can also be employed. When skilfully used, they make it possible to direct the flow. In this method, the phenomenon of petroleum products and water parallel current travelling is relied on. That makes it possible to further separate petroleum products from well water with the use of hydrophobic filters. Hydraulic barrier is made by forcing a local depression around the protected area. The contaminated zone is surrounded by girdling ditches, in which water becomes depressed. Banks and girdling ditches are constructed using earthwork equipment [24].

Impact of pollution with oil derivatives on the natural environment and methods of their removal
351
In open reservoirs, all kinds of floating barriers are constructed. Contaminants are collected with pumps or skimmers. It often happens that because of the lack of specialist equipment, the work is done with the simplest tools.
As regards the site of decontamination performed, the methods are classified as: ♦ in situ - when the clean-up takes place at the site of the leak, ♦ ex situ - when the clean-up is done elsewhere, off the site of the leak.
Taking into account the mechanism of decontamination, soil cleaning can be accomplished by physical, chemical and biological processes. Each of those has some advantages, yet the main drawback shared by all the approaches lies in high costs they generate.
Physical methods, the most frequently used, involve the use of mechanical energy to separate soil grains from oil-derived products. Those rely on destabilising the hydrocarbons - soil system. The following methods can be differentiated: ♦ pumping, ♦ blowdown, ♦ desorption with steam, ♦ rinsing with surface-active agents, ♦ extraction.
The methods mentioned above can be applied both in situ and ex situ. The pumping method is usually an introduction that precedes more costly operations. The advantage of the method lies in the possibility of recovering some fuel [25, 26].
For conducting the clean-up of soils contaminated with low-boiling hydrocarbons, including BTX, bio-ventilation methods are considered the most suitable. They include SVE (Soil Vapour Extraction) techniques that draw out the air contained in the soil pores. The procedure employs a typical vacuum pump equipped with a manometer, flowmeter, air sampling inlet and adsorber filled with active carbon.
A similar principle is applied in bio/de-aeration, in which the sorbent is enriched with biopreparation containing aerobic bacteria. The process aims at stimulating the natural processes of petroleum product biodegradation. The contaminated zone is ventilated with fresh air, rich in oxygen. The ventilation is optimised depending on oxygen demand on the part of microorganisms [27].
Air-dispergation is another method classified as a bio-ventilation process. Atmospheric air is pumped into the aquifer below the contaminated zone using low-pressure compressor. Travelling upwards, the air is capable of small-bubble penetration of the contaminant spillage. The condition for the system to act adequately is good air permeability of the geological stratum [28].
Steam soil desorption methods are the cheapest. Soil blowdown with steam is performed with injection pipes, into which 130÷180ºC steam is forced. Steam heats the soil zone that is being cleaned and causes an increase in pressure. Under such conditions, the mixture of steam and gaseous contaminants is quickly driven from the soil to vapour condenser with using vacuum well system. In the condenser, it condenses and is cleaned with filtration or adsorption on active carbon methods. The method has been applied to the remediation of soils polluted with aromatic hydrocarbons.
Soil rinsing with water is aimed to move the pollutants trapped in it. Water is enriched with surfactants and emulgators. Contaminated water is collected in wells or subsurface
Barbara Gawdzik and Jarosław Gawdzik
352
drainpipes from where it is pumped onto the surface and then treated. Water is forced into the soil via high-pressure (50 MPa) nozzles. Water jet velocity at the outflow is close to sound speed [29].
Chemical methods are not widely used. The difficulty lies in the reaction that would have to be used to achieve a degradation of a liquid which is a mixture of many chemical compounds. Relatively most frequently, the oxidizing action of hydrogen peroxide (H2O2) is employed.
Biodegradation methods could be effective for heavier hydrocarbons such as diesel and heating oils. Those provide an alternative for physical and chemical methods. Biological remediation, to put it very simply, involves microorganisms using oil-derived products as a food source. This group of methods is widely applicable. A number of bioremediation types can be differentiated [28, 30]: ♦ agricultural, ♦ based on native strains, ♦ with the use of biopreparations.
Agricultural bioremediation relies on the assumption that microorganisms which decompose oil-derived hydrocarbons are commonly found in the natural environment, thus also in the contaminated soil. In natural soils, the amount of bacteria decreases with the depth below the ground surface. In the soil surface layer, the number of bacteria ranges 106÷3.7·109 cells per 1 g of soil, at the depth of approx. 1 m, however, they are usually not found [31].
The essential aspect of the method involves providing the ground with fertilisers (nitrogen and phosphorus) and oxygen. Analogously to farming procedures, the soil is fertilised and ploughed.
The method of agricultural bioremediation is effective in the following instances: ♦ shallow deposited contaminants, ♦ ex situ pile remediation, where piles are stored at the same site, ♦ pollutions and the ground lack bacteriostatics.
The group of bacteriostatic substances includes: chlorine and compounds that release available chlorine, atomic oxygen and compounds generating O2 oxygen, heavy metal ions (Hg2+, Pb2+, Cd2+), formaldehyde and others.
Bioremediation based on native strains consists in collecting soil samples from the contaminated site, selecting bacterial strains capable of decontamination and cultivating them. Preparations thus developed are delivered to the site of contamination. Such a procedure is effective and, additionally, it offers an advantage of protecting the cleaned ground against an invasion of new strains. Because of difficulties that occur while selecting strains, methods based on ready-made biopreparations are used in many countries. Those have the optimal compositions and each batch is fabricated with consistent repeatable properties. Additionally, the bacteria used in biodegradation are non-pathogenic.
For the sake of biodegradation, it is necessary to create the optimum conditions for bacteria to develop [30, 31]: ♦ temperature 10÷50°C - at the temperature below 6°C processes of life functions cease
to operate in a majority of bacteria and they produce spore forms; at temperatures above 50°C, thermal resistance of the bacteria protein material constitutes a limitation on their expansion,

Impact of pollution with oil derivatives on the natural environment and methods of their removal
353
♦ pH value - for a majority of biodegradation processes including that of oil-derived hydrocarbons, the optimum pH value is in the range 6.5÷8.0. Acid soils are not advantageous to bacteria,
♦ feeding with biogenic substances (nitrogen N, phosphorus P). In order to build protein matter, in addition to carbon (C), bacteria need an additional source of biogenic substance. Nitrogen and phosphorus should be supplied in proportion to the conventional indicator of organic substance content, following the formula: BOD5 : N :
P = 100 : 7 : 1, ♦ inflow of molecular oxygen (O2). A majority of known processes of oil-derived
hydrocarbons biodegradation are oxygen processes. Under specified conditions, anaerobic bacteria obtain oxygen from chemically bound oxygen compounds (eg:
),NO,SO 324
−−
♦ water environment - as the whole living matter, bacteria have to be continuously in contact with water. Without that, they die or convert to spores. Biodegradation processes do not always turn out to be successful, especially if the
concentration of the organic waste is too high, the toxification of microorganisms occurs. Additionally, the compounds that are the products of initial stages of biodegradation could be much more toxic than the input contaminants. Therefore, it is necessary to monitor and check on the biological decomposition of contaminants. It must be also possible to intervene, applying microbiological and biochemical means, in order to introduce additional strains of microorganisms that have appropriate biological activity.
Biodegradation mechanism of oil-derived substances
Bacteria’s capability of decomposing oil-derived substances has been developing for hundreds of years. Bacterial strains that possess such properties are found particularly at palaces, where crude oil occurs naturally. The appearance of enzymes comes as the reaction of microorganisms to the presence of certain chemical compounds. As hydrocarbons, in the majority, do not dissolve in water, microorganisms produce exoenzymes, which make it possible to form hydrofoil structure.
Biodegradation processes of oil-derived substances usually result in the formation of products that are environmentally less harmful.
Crude oil is a mixture of compounds of diversified composition. Hydrocarbons can be arrayed in the descending order of biodegradability: chain alkanes, branched alkanes, low molecular weight aromatic hydrocarbons, polycyclic aromatic hydrocarbons [32]. As the biodegradation kinetics is the fastest for saturated alkanes, they are the most easily hydroxylated, for instance by Nocardia bacteria. The hydroxylation reaction results in the transformation of aliphatic hydrocarbons to corresponding alcohols (Scheme 1) [30]:
C7H15CH3
2NADH + H+ + O2
_ 2NAD+ _ H2OC7H15CH2OH
octane octane-1-ol Scheme 1
Alcohols obtained at the first stage of hydroxylation are then oxidized to aldehydes and
fatty acids in accordance with Scheme 2 [33]:

Barbara Gawdzik and Jarosław Gawdzik
354
C7H15CH3 + O2 C7H15COOH
octane octane acid
R-CH2CH3
alkane alcohol
R-CH2CH2OH
aldehyde
R-CH2CHO
acid
R-CH2COOH
Scheme 2
Alkenes, after the double bond hydrolysis reaction, are metabolised during a process analogous to that of alkanes. Both long-chained alkanes and alkenes undergo biodegradation by many bacteria of the following genera: Pseudomonas, Acinetobacter, Arthrobacter, Corynebacterium, Nocardia, Mycobacterium, Geobacilus, and many yeasts mostly of Candida species [33, 34].
Branched aliphatic hydrocarbons undergo biodegradation at each of terminal chains. The reaction can proceed with bacteria of Pseudosomonas propanica systematic group.
Hydrocarbons classified as cycloalkanes are relatively the slowest to be affected by biochemical changes. Those undergo biodegradation to a much lesser extent than aliphatic hydrocarbons. The first stage of cyclohexane degradation involves hydroxylation reaction that results in the formation of cyclohexanol. At the subsequent stage, cyclohexanol is converted to cyclohexanone and caprolactone, and then under the influence of lactose hydrolase, the ring opens to form adipic acid (Scheme 3) [33]:
OH O
HOOCCOOH
cyclohexane cyclohexanol cyclohexanone adipic acid
Scheme 3
Table 4 Bacterial strains decomposing selected oil-derived hydrocarbons
Item Hydrocarbon Microorganism 1. Benzene Pseudosomonas putida, Dechloromonas (β-Proteobacteria)
2. Toluene
Nocardia corallina, Bacilus sp., Geobacter metallidurus, Geobacter grbicium, Thauera aromatic (strains K172 I I1), Azoarcus sp. (strain T), Azoarcus
tolulyticus (strains To14 and Td15), Dechloromonas (strains RCB i JJ), Desulfobacterium cetonicum, Desulfobacula toluica
3. Xylene Pseudosomonas
4. Cresols Nocardia, Candida tropicalis
Cycloalkanes make structural building material in many microorganisms, therefore
those are cautious reducing the production of enzymes which might lead to the degradation of the cell material. No strain decomposing cycloalkanes has been discovered, and biodegradation of those compounds proceeds very slowly. It relies on the ability of a consortium of microorganisms to degrade pollutants using co-metabolism [30, 33].

Impact of pollution with oil derivatives on the natural environment and methods of their removal
355
Aromatic hydrocarbons that contain in their structure two or three phenyl rings are decomposed by both many strains of soil bacteria and many kinds of fungi, yet those rely on different processes of oxygen biodegradation. Table 4 presents examples of strains that decompose aromatic hydrocarbons contained in oil-derived products [35].
First bacteria oxidize aromatic rings using multicomponent dioxidase to cis-dihydrodiol. At the subsequent stage, the latter, due to cis-dihydrodiol dehydrogenase, undergoes re-aromatization to appropriate dihydroxyl derivatives. The products of further oxidation reaction are catechol (1,2-dihydroxybenzene) or protocatechuic acid (3,4-benzoic acid). As a result of successive oxidation reactions, catalysed by dioxygenases, the opening of the aromatic ring of catechol or protocatechuic acid at ortho or para position takes place (Scheme 4) [33].
R
dioxygenaseR OH
OH
_ H2 R OH
OH
catecholcis-dihydroxydiol
COOH
COOHR
COOH
CHOR
OH
Scheme 4
Aromatic hydrocarbons built of four or greater number of phenyl rings are rarely affected by bacteria - caused biodegradation, their decomposition most frequently takes place due to the action of ligninolytic fungi such as: Phanaerochaete chrysosporium, Trametes versicolor, Bjerkanadera sp., Pleurotus ostreatus. Also non-ligninolytic fungi, for instance the following species: Cunninghanella elegant, Penicillium janthinellum, Syncephalastrum sp., are capable of decomposing high molecular weight polycyclic aromatic hydrocarbons to carbon dioxide (CO2). Using cytochrome P-450 mono-oxidase, non-ligninolytic and ligninolytic fungi oxidise aromatic rings to epoxy arenes. The so-obtained oxides can isomerise to phenols, or convert to trans-dihydrodiols as a result of enzymatic hydroxylation proceeding with the participation of epoxide hydrolase. However, a decided majority of fungi that cut and mineralise aromatic rings are ligninolytic ones. The bacteria, whose enzymes decompose high molecular weight polycyclic aromatic hydrocarbons and their derivatives, include those of Pseudomonas and Sphingomonas strains, also strains of Mycobacterium genus of Mycobacterium flavescens and Mycobacterium vanbaalenii species, and the following strains: AP-1, PYR-1, BB-1, KR-2, GTI- 23, RJGII-135, BG1, CH1 [35].
Environmental pollution by oil-derived products found in crude oil, gasoline, diesel oils, heating oils, lubricants, waxes, solvents, also resins and asphalts, constitutes a major environmental hazard. A decided majority of those shows a strong toxic action towards

Barbara Gawdzik and Jarosław Gawdzik
356
living organisms, whereas some (especially aromatic hydrocarbons and high molecular weight polycyclic aromatic hydrocarbons), even in small concentrations, produce cancerogenic effect and play a significant role in neoplasm etiology. It is therefore necessary to raise the awareness of how harmful those are and try to prevent the occurrence of environmental contamination with oil-derived products.
References [1] Indulski J., Lutz W. and Krajewska B.: Biomarkers of health risks in people living in areas of high hazard
from cancerogenic chemical substances. Med. Pracy, 1996, 13, 7-15 (in Polish). [2] Andryszek C. and Indulski J.: Developing criteria and determining areas of the population’s highest health
hazard from chemical substances found in the natural environment. I. Proposal of health markers selection
criteria. Med. Pracy, 1996, 4, 521-523 (in Polish). [3] Morrison R.T. and Boyd R.N.: Organic Chemistry (in Polish). Wyd. Nauk. PWN, Warszawa 2003. [4] Gierak A., Charmas B. and Leboda R.: Chromatographic determination of water volatile pollutants with Purge
and Trap Injection method. Ochr. Środow., 1993, 1, 27-39 (in Polish). [5] Surygała J.: Petroleum today and tomorrow. Przem. Chem., 1999, 78, 123-135 (in Polish). [6] Douaud A.: Tomorrow’s engines and fuels. Hydrocarbon Proc., 1995, 2, 55-56. [7] Namieśnik J. and Jaśkowski J.: Outline of Ecotoxicology. Eco-pharma, Gdańsk 1995 (in Polish). [8] Surygała J. and Śliwka E.: Characteristics of petroleum products with respect to environmental impact
(in Polish). Chem. Inż. Ekol. (Ecol. Chem. Eng.), 1999, 6, 2-14. [9] Seńczuk W.: Toxicology. PZWL, Warszawa 2002 (in Polish). [10] Różański H. and Włodkówic D.: Effects of the action of oil-derived pollution on the natural environment.
Wszechświat. Pismo przyrodnicze, 2002, 7, 7-9 (in Polish). [11] Minta M.: Dangerous compounds. Przegl. Komun., Gospodarka Komunalna i Ochrona Środowiska, 2000, 10,
24-33 (in Polish). [12] Bąkowski W. and Bodzek M.: Multiring aromatic hydrocarbons in man’s natural environment - origin,
occurrence, toxicity, emission assessment in Poland. Arch. Ochr. Środow., 1988, 3, 197-211 (in Polish). [13] Hotz P., Carbonnelle P., Haufroid V., Tschopp A., Buchet J.P. and Lauwerys R.: Biological monitoring of
vehicle mechanics and other workers exposed to low concentrations of benzene. Int. Arch. Occup. Environ. Health, 1997, 70, 29-44.
[14] Infante P.F.: Benzene and leukemia: The 0.1 ppm ACGIH proposed threshold limit value for benzene. Appl. Occup. Environ. Hyg., 1992, 7, 253-267.
[15] Nilsson R., Nordlinder R., Högstedt B., Karlsson A. and Järvholm B.: Symptoms, lung and liver function,
blood counts, and genotoxic effect in coastal tanker crews. Int. Arch. Occup. Environ. Health, 1997, 69, 392-404.
[16] Hallenbeck W.H. and Flowers R.E.: Evaluation of worker exposure to benzene. Bull. Environ. Contamin. Toxicol., 1992, 48, 327-331.
[17] Lisiewicz J. and Moszczyński P.: Benzene and human hematopoietic system. Post. Hig. Med. Dośw., 1986, 40, 45-51 (in Polish).
[18] Schimming E., Levsen K., Kölme C. and Schürmann W.: Biomonitoring of benzene and toluene in human
blood by headspace-solid-phase microextraction. Fresenius J. Anal. Chem., 1999, 363, 88-94. [19] Brugnone F., Perbellini L., Romeo L., Bainchin M., Tonello A., Pianalto D., Zambon D. and Zanon G.:
Benzene in environmental air and human blood. Int. Arch. Occup. Environ. Health, 1998, 71, 554-563. [20] Moolenaar R.L., Hefflin B.J., Ashleh D.L., Middaugh J.P. and Etzel R.A.: Blood benzene concentrations in
workers exposed to oxygenated fuel in Fairbanks, Alaska. Int. Arch. Occup. Environ. Health, 1997, 69, 139-147.
[21] Sabbah I., Rebhun M. and Gerstl Z.: An independent prediction of the effect of dissolved organic matter on
the transport of the polycyclic aromatic hydrocarbons. J. Contam. Hydrol., 2004, 75, 55-70. [22] Kościelniak S.: Guidelines for the assessment of soil and subterranean water contamination with oil-derived
products and other chemical substances in reclamation processes. PIOŚ, Warszawa 1995 (in Polish). [23] Zieńko J.: Oil-derived substances in the natural environment. Assessment of the level of pollution in the soil
and water environment. Ekol. i Technika, 1999, 7, 89-98 (in Polish). [24] Czarnomski K.: Soil and subterranean water pollution with oil-derived products. Removal of environmental
contaminants. EKO-Problemy, 1994, 4, 14-23 (in Polish).

Impact of pollution with oil derivatives on the natural environment and methods of their removal
357
[25] Leśkiewicz J.: Soil and water contamination with oil-derived products. Aura, 1995, (11), 6-12 (in Polish). [26] Malicka M.: Review and analysis of recent results of reclamation processes involving bioreclamation
methods. IV Międzynarod. Symp. Szkol., Efekty Likwidacji Zanieczyszczeń Naftowych, Ustronie Morskie 1996, 40-47 (in Polish).
[27] Ciesielczyk E., Demczak M., Biber E. and Piwowarczyk J.: Effectiveness of desorption method in soil cleaning
from oil-derived products. Ochr. Pow. i Probl. Odpad., 1994, 4, 105-114 (in Polish). [28] Wesołowski A.: Remediation of soils contaminated by toxic substances. Aura, 1996, (6), 19-26 (in Polish). [29] Tavassoli Z. and Rodgers G.J.: Diffusive growth of single droplet with tree different boundary conditions.
Eur. Phys. J. B, 2000, 14, 139-149. [30] Malicka M.: Biotechnology methods in cleaning soils contaminated by oil-derived products and other toxic
organic compounds. Gaz, Woda Techn. Sanit., 1994, 2, 40-52 (in Polish). [31] Łomotowski J. and Szpindor A.: Modern Systems of Sewage Treatment. Arkady, Warszawa 1999 (in
Polish). [32] Hamme J.D., Singh A. and Ward O.P.: Recent advances in petroleum microbiology. Microbiol. Mol. Biol.
Rev., 2003, 67, 503-519. [33] Baj J. and Markiewicz Z.: Molecular Biology of Bacteria. Wyd. Nauk. PWN, Warszawa 2006 (in Polish). [34] Meintanis C., Chalkou K.I., Kormas K.A. and Karagolini A.D.: Biodegradation of crude oil by thermophilic
bacteria isolated from a volcano island. Biodegradation, 2006, 17, 105-111. [35] Nowak J.: Bioremediation of soil from petroleum and oil-derived products. Biotechnologia, 2008, 80,
97-112. (in Polish)
WPŁYW ZANIECZYSZCZEŃ SUBSTANCJAMI ROPOPOCHODNYMI NA ŚRODOWISKO PRZYRODNICZE
I METODY ICH USUWANIA
1 Instytut Chemii, Uniwersytet Humanistyczno-Przyrodniczy Jana Kochanowskiego w Kielcach
2 Katedra Inżynierii i Ochrony Środowiska, Politechnika Świętokrzyska, Kielce
Abstrakt: W pracy przedstawiono charakterystykę zagrożeń substancjami ropopochodnymi i ich konsekwencje, a także źródła tych zanieczyszczeń. Toksyczność produktów ropopochodnych wynika z ich właściwości fizycznych i chemicznych. Zanieczyszczenia ropopochodne zagrażają zarówno faunie, jak i florze skażonego terenu oraz wodom podziemnym. W pracy zaprezentowano negatywne oddziaływanie węglowodorów na organizm człowieka oraz najważniejsze metody ich usuwania ze środowiska gruntowo-wodnego.
Słowa kluczowe: zanieczyszczenia ropopochodne, węglowodory, środowisko gruntowo-wodne, biodegradacja

ECOLOGICAL CHEM ISTRY AND ENGINEERING S
Vol. 18, No. 3 2011
Andrzej JAGUŚ1* and Mariusz RZĘTAŁA2
INFLUENCE OF AGRICULTURAL ANTHROPOPRESSION
ON WATER QUALITY OF THE DAM RESERVOIRS
WPŁYW DZIAŁALNOŚCI ROLNICZEJ NA JAKOŚĆ WÓD W ZBIORNIKACH ZAPOROWYCH
Abstract: The research evaluated the quality of surface waters subject to agricultural anthropopressure. The authors analyzed river water feeding dam reservoirs and water in reservoirs. The research covered the catchment areas of reservoirs Kozlowa Gora, Przeczyce and Laka, located in the Upper-Silesian region (southern Poland). The dominating form of land management in the catchments is agriculture. The reservoirs were found to be often fed with running waters whose parameters suggested eutrophication, especially with regard to the concentration of
nitrates (mean yearly concentration of −3NO > 10 mg/dm3). Eutrophication also concerned reservoir water, which
could be seen in frequent water blooming. The reaction of water in the reservoirs happened to increase up to strongly alkaline (pHmax > 8.5). The highest fertility of waters was that of reservoir Laka, mainly alimented from agricultural lands (77% of the catchment area) also situated within its direct catchment. This was reflected in high
phosphate concentrations in the water of the reservoir (average 0.389 mg −34PO /dm3). The research showed that
agricultural anthropopressure is a significant threat to functioning of dam reservoirs because it fosters the process of eutrophication and thus affects the quality of disposable water resources.
Keywords: land use, agricultural anthropopression, water quality, dam water reservoir, eutrophication
In multidirectional management of dam reservoirs, it is necessary to maintain high ecological values of their ecosystems, especially good quality of water. That quality depends on environmental and anthropogenic influences in the feeding areas of the catchment. Recognition of relations and influence between the catchment and the reservoir makes it possible to determine optimum forms of land management which would foster protection of collected water resources. The factor that severely restricts the use of reservoirs is eutrophication, which is the result of increased discharge of organic and
1 Institute of Environmental Protection and Engineering, University of Bielsko-Biala, ul. Willowa 2, 43-309 Bielsko-Biała, phone 33 827 91 87 2 Faculty of Earth Sciences, University of Silesia, ul. Będzińska 60, 41-200 Sosnowiec, phone 32 368 93 60, email: [email protected] * Corresponding author: [email protected]
Andrzej Jaguś and Mariusz Rzętała
360
mineral matter into water [1, 2]. The process concerns many lakes and water reservoirs all over the world which are subject to anthropopressure [3-7]. The trophic condition of reservoir water is mainly determined by phosphorus; its concentrations reaching as low as 20÷30 µg P/dm3 are sufficient to cause algal blooms [8]. The following limit values of indexes of eutrophication of still waters have been introduced in Poland [9]: total
phosphorus (P) - over 0.1 mg/dm3, total nitrogen (TN) - over 1.5 mg/dm3, chlorophyll a - over 25 µg/dm3, transparency - below 2 m. These values are comparable to reports from researchers in other countries [10, 11]. Other important indexes of eutrophication include growth of aerophytic algae, deoxidation of the hypolimnion, reduction in biodiversity and the mentioned algal blooms. Eutrophication of lakes and water reservoirs also brings about unfavorable consequences of socioeconomic nature. That mainly results from contamination of water with organic matter, with consequent deterioration of its taste, smell and color. Use of such quality water leads to corrosion of waterpipes, clogging of filtrating devices and poor heat exchange in exchangers. Eutrophicated water bodies lose their recreational and aesthetic values and may even create a sanitary threat because of anaerobic decomposition of organic matter and toxicity of algae [12, 13].
Processes of eutrophication are typical of watercourses and reservoirs located in catchments which are used for agricultural purposes. That results from increased migration of biogenic substances and organic matter (eg from fertilizing material, or in erosion rainwash) to surface and underground water [14-18]. Farming activities should therefore be carried out in a way which would limit migration of soil nutrients outside farmlands [19, 20]. The basic European document which determines the directions of protection of water quality from farming-related contaminations is “Council Directive 91/676/EEC of 12 December 1991 concerning the protection of waters against pollution caused by nitrates from agricultural sources”. Its provisions are adapted for the conditions in particular countries and taken into consideration in legal acts. They are also referred to in numerous scientific publications and guidebooks for farmers [21-23]. However, introduction of protective actions requires monitoring of water quality, which was taken up by the authors of this paper in the Upper-Silesian region - in southern Poland. The aim of the proceedings was to diagnose the water quality in selected dam reservoirs operating under agricultural anthropopressure.
Objective and methods of research
Three dam reservoirs, situated in the Upper-Silesian region, were selected for the research - Kozlowa Gora on the Brynica River, Przeczyce on the Czarna Przemsza and Laka on the Pszczynka [24]. Field observations and indoor studies (cartographic materials, ortophotographs and satellite imagery) showed that farmlands are the main serious source of environmental pollution in the catchment areas of these reservoirs. They cover at least half of the area of the catchment in the profile of land use (Fig. 1).
Reservoir Kozlowa Gora was built in 1935-1939. Its maximum area is 587 ha and total volume 15.3 mln m3. The catchment area of the reservoir takes 206.14 km2. Agrarian land covers 48.6% and forested land 43.8% of this area. Urban areas are located in the central and lower parts of the catchment over the total area of 10.99 km2. Reservoir Przeczyce has been in use since 1963. It covers the area of 470 ha, and its basin can retain up to 20.7 mln m3 of water. The reservoir is alimented with water flowing from the area of
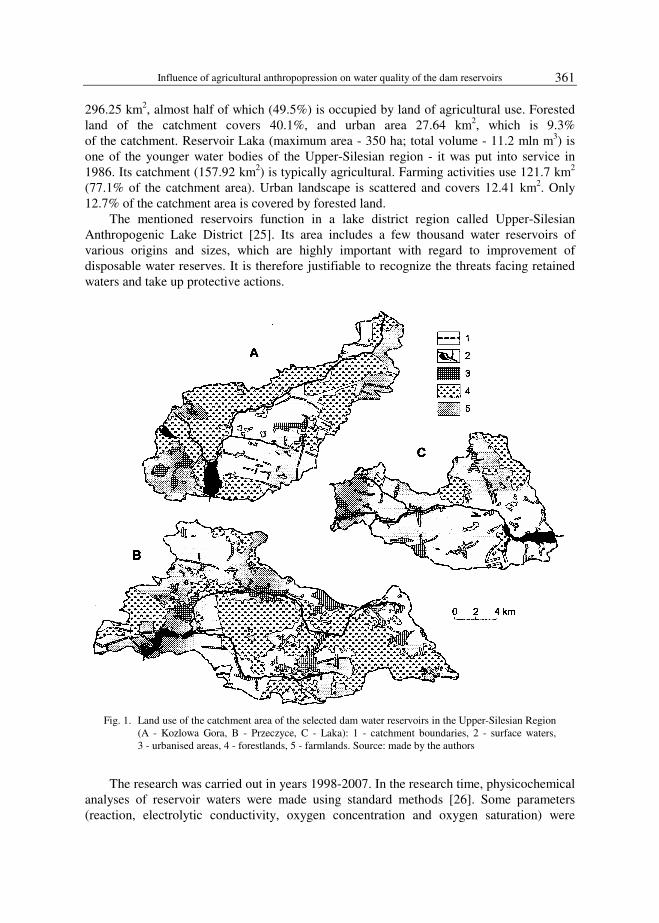
Influence of agricultural anthropopression on water quality of the dam reservoirs
361
296.25 km2, almost half of which (49.5%) is occupied by land of agricultural use. Forested land of the catchment covers 40.1%, and urban area 27.64 km2, which is 9.3% of the catchment. Reservoir Laka (maximum area - 350 ha; total volume - 11.2 mln m3) is one of the younger water bodies of the Upper-Silesian region - it was put into service in 1986. Its catchment (157.92 km2) is typically agricultural. Farming activities use 121.7 km2 (77.1% of the catchment area). Urban landscape is scattered and covers 12.41 km2. Only 12.7% of the catchment area is covered by forested land.
The mentioned reservoirs function in a lake district region called Upper-Silesian Anthropogenic Lake District [25]. Its area includes a few thousand water reservoirs of various origins and sizes, which are highly important with regard to improvement of disposable water reserves. It is therefore justifiable to recognize the threats facing retained waters and take up protective actions.
Fig. 1. Land use of the catchment area of the selected dam water reservoirs in the Upper-Silesian Region
(A - Kozlowa Gora, B - Przeczyce, C - Laka): 1 - catchment boundaries, 2 - surface waters, 3 - urbanised areas, 4 - forestlands, 5 - farmlands. Source: made by the authors
The research was carried out in years 1998-2007. In the research time, physicochemical analyses of reservoir waters were made using standard methods [26]. Some parameters (reaction, electrolytic conductivity, oxygen concentration and oxygen saturation) were
Andrzej Jaguś and Mariusz Rzętała
362
determined directly on the site using appropriate equipment. Macro-ionic composition of collected samples was determined in the laboratory of the Faculty of Earth Sciences of the University of Silesia. Data was also collected regarding the quality of water in rivers flowing into the researched reservoirs. The data was obtained from the archives of the Environmental Research and Control Center (OBiKS) in Katowice and refers to years 2005-2008. Continuous monitoring of land management in the catchments was also carried out as part of the research.
Results and discussion
Physiochemical properties of waters in main rivers feeding the researched reservoirs (determined within the inflow zones of these reservoirs) reflected the impact of agricultural anthropopressure (Table 1). The water contained excessive amounts of nitrates, that is more
than the eutrophication threshold for running waters (average yearly concentration of −
3NO
> 10 mg/dm3), but it was not considered sensitive water [9]. Relatively high were also concentrations of total nitrogen (TN), which were below the eutrophication level only in case of the Czarna Przemsza. Total phosphorus (P) was generally within 0.1÷0.2 mg/dm3, but reached a few tenths of mg/dm3 at maximum, which suggested periodical excessive fertilization of water. With regard to phosphorus concentrations, running waters are classified as eutrophicated when the average yearly concentration of P exceeds 0.25 mg/dm3 [9]. Concentrations of total phosphorus did not generally exceed that level in the researched rivers - which mostly results from the ability of compounds of this element to be fixed and accumulated in the ground [27]. Waters of all rivers were characterized by high contents of
nitrates(III) (over 0.1 mg −
2NO /dm3), which disqualified them as potable water [28]. Also,
ammonia concentrations (especially in waters of the Czarna Przemsza and the Pszczynka)
exceeded the level acceptable for drinking water - 0.5 mg +
4NH /dm3 [28], or even for water
which can be used in potable water treatment processes - 2.0 mg +
4NH /dm3 [29]. The
reaction of the researched waters was generally neutral and periodically alkaline. Also, heavy load of organic substances was periodically reported in the water - BOD5 reached up to 8÷11 mg O2/dm3.
Particularly unfavorable parameters were those of the water in the Pszczynka (Table 1), which drains the catchment with the highest share of farmlands. Compared to the Brynica and the Czarna Przemsza, it was characterized by lower concentrations of dissolved oxygen and simultaneously, higher pollution with organic substances - expressed by high BOD5 and total Kjeldahl nitrogen (TKN), as well as noticeably higher concentrations of ammonia and nitrates(III). This data reflects occurrence of conditions which are unfavorable for oxidation processes, and use of the waters may involve sanitary threats.
The research showed that the quality of water in the reservoirs is a derivative of the influence of the main feeding river, influence of the direct catchment and the processes occurring in the environment of still waters. At the same time, retaining river water in reservoirs results in changes in its quality which is reported not only in the conditions of agricultural anthropopressure, but also in quasi-natural or urban-industrial catchments [24, 25, 30, 31]. The limnic environment, characterized by periodic stagnation of water, has

Influence of agricultural anthropopression on water quality of the dam reservoirs
363
limited possibilities of neutralization of contaminants flowing from the catchment, which are usually accumulated in reservoir basins.
Table 1 Physiochemical properties of river waters flowing to the dam reservoirs in the years 2005-2008
2005 2006 2007 2008 average max average max average max average max Parameter
The Brynica river (reservoir Kozlowa Gora) Reaction pH 7.3 7.9 7.3 7.5 7.3 7.6 7.3 7.7
Oxygen [mg O2/dm3] 9.8 12.7 9.1 11.5 10.1 10.9 9.0 11.0 BOD5 [mg O2/dm3] 2.5 8.4 2.4 10.8 1.9 3.4 1.8 2.6
+4NH [mg/dm3] 0.31 0.81 0.15 0.45 0.13 0.23 0.08 0.16 −2NO [mg/dm3] 0.16 0.91 0.09 0.23 0.08 0.26 0.09 0.29 −3NO [mg/dm3] 18.0 28.0 20.1 24.0 19.0 24.0 15.4 18.6
TKN [mg/dm3] 1.9 2.7 1.6 3.0 1.0 2.7 1.4 6.7 TN [mg/dm3] 6.82 14.60 6.14 7.74 5.33 7.23 4.91 10.56 P [mg/dm3] 0.21 1.10 0.13 0.24 0.09 0.19 0.08 0.18
The Czarna Przemsza river (reservoir Przeczyce) Reaction pH 7.5 7.7 7.5 7.9 7.5 7.7 7.5 7.8
Oxygen [mg O2/dm3] 10.3 12.4 9.5 12.0 9.9 11.9 9.8 11.1 BOD5 [mg O2/dm3] 2.0 3.9 1.7 2.8 2.5 6.2 2.4 8.0
+4NH [mg/dm3] 0.60 1.93 0.74 3.20 0.64 2.80 0.25 0.57 −2NO [mg/dm3] 0.12 0.32 0.15 0.27 0.15 0.53 0.12 0.26 −3NO [mg/dm3] 12.6 20.0 13.3 18.0 13.0 23.0 12.3 20.8
TKN [mg/dm3] 1.6 2.7 1.5 3.6 1.3 4.4 1.7 5.3 TN [mg/dm3] 4.46 5.91 4.59 6.16 4.31 6.91 4.48 7.98 P [mg/dm3] 0.19 0.54 0.20 0.57 0.18 0.49 0.18 0.67
The Pszczynka river (reservoir Laka) Reaction pH 7.3 7.4 7.4 7.6 7.3 7.5 7.3 7.4
Oxygen [mg O2/dm3] 6.7 10.5 5.8 9.2 5.8 9.9 5.5 9.4 BOD5 [mg O2/dm3] 4.0 5.6 4.8 6.8 4.4 6.0 4.0 4.9
+4NH [mg/dm3] 1.62 3.76 2.35 3.71 2.65 6.85 3.77 8.04 −2NO [mg/dm3] 0.33 0.82 0.48 1.14 0.45 0.78 0.31 0.55 −3NO [mg/dm3] 12.3 38.3 10.4 17.8 15.5 40.9 10.7 34.6
TKN [mg/dm3] 2.1 4.1 2.5 3.5 2.9 6.1 3.8 6.7 TN [mg/dm3] 4.96 10.50 5.04 6.58 6.53 11.10 6.30 9.72 P [mg/dm3] 0.17 0.29 0.20 0.34 0.18 0.29 0.26 0.43
Source: made on the base of data taken from OBiKS in Katowice The diversity of physiochemical parameters of reservoir waters (determined
in near-dam zones) corresponded with observations regarding river waters - water parameters were relatively similar in reservoirs Kozlowa Gora and Przeczyce, whereas noticeably worse in case of reservoir Laka (Table 2). The reasons for that situation were inflow of large amounts of contaminants into the latter reservoir and the agricultural use of the area of the direct catchment. Water in reservoir Laka was characterized by higher electrolytic conductivity than water in Kozlowa Gora or Przeczyce, which suggested the

Andrzej Jaguś and Mariusz Rzętała
364
presence of significant amounts of mineral substances. Among them, sodium is worth paying attention to; its high concentration (usually about 50 mg/dm3) - exceeding the level of the geochemical background, was probably related to washing out from the fertilizing materials. That is supported by the absence of other identified sources of contamination with this element, and particularly lack of discharge of mining water into the Pszczynka river. Water in reservoir Laka also contained higher amounts of phosphates (on average
0.389 mg −34PO /dm3), which can be related not only to external inflow, but also to
phosphates being released from bottom deposits in conditions of progressive eutrophication.
Table 2 Water physiochemical properties of the dam reservoirs - average values 1998-2007
Kozlowa Gora Przeczyce Laka Parameter
min. average max min. average max min. average max Reaction pH 7.38 8.17 9.81 7.35 7.96 8.66 7.20 7.62 8.90
Conductivity [µS/cm] 274.9 364.2 410.0 418.0 462.1 521.0 476.0 588.0 719.0 Oxygen [mg O2/dm3] 9.6 12.4 15.1 7.4 10.5 12.3 9.0 9.6 11.9
Oxygen [%] 79.1 113.0 151.5 79.7 89.9 101.1 88.2 88.8 141.0 −3HCO [mg/dm3] 92.0 141.7 179.0 174.0 209.8 397.0 134.8 152.2 162.0
Ca2+ [mg/dm3] 46.0 63.3 84.0 44.0 71.9 104.0 37.1 43.1 62.0 Mg2+ [mg/dm3] 1.2 20.8 36.0 9.6 25.1 39.6 7.6 10.6 12.1 Na+ [mg/dm3] 6.4 8.1 10.7 9.5 11.9 14.5 40.2 52.2 74.3 K+ [mg/dm3] 2.6 3.0 3.3 2.8 4.1 4.7 3.9 6.5 8.8 Cl– [mg/dm3] 16.0 27.9 64.0 17.7 27.2 38.0 41.7 89.2 94.2
−24SO [mg/dm3] 27.9 40.1 60.1 42.3 53.0 68.6 26.8 68.5 76.5 −
3NO [mg/dm3] 1.0 7.6 17.7 1.0 7.5 14.0 0.9 10.4 12.6
−34PO [mg/dm3] 0.004 0.062 0.141 0.006 0.075 0.197 0.079 0.389 0.421
Source: made by the authors The studies showed that agricultural anthropopressure is characterized by loads of
biogenic substances, organic compounds and some substances used in fertilizing (eg sodium, sulfur), whose concentrations in water often exceed the natural geochemical background. Hence, agricultural anthropopressure fosters eutrophication, which was remarkable in all researched reservoirs. This was particularly reflected in the maximum values of analyzed water parameters (Table 2) and algal blooms often observed during field studies. The research shows that the most intense process of eutrophication should be associated with reservoir Laka, which is subject to the strongest anthropogenic influences.
Eutrophication processes led to increased reaction of river waters while they were retained in the reservoirs. Water reaction in all the reservoirs was alkaline, or periodically strongly alkaline, which suggests intensive use of CO2 by phytoplankton organisms. This kind of alkalization cannot be regarded as a favorable result even in the context of the described issues regarding acidification of limnic environments [32, 33]. Increased reaction resulted from water fertilization stimulated by contaminants. The growth of phytoplankton, and consequent intensive photosynthesis, also resulted in frequent supersaturation of the reservoir waters with oxygen. No significant contamination with nitrates was reported in the
researched reservoirs - maximum concentrations were at over ten mg −
3NO /dm3. Nitrates
Influence of agricultural anthropopression on water quality of the dam reservoirs
365
are very mobile substances in the environment [34] which are not subject to sorption in grounds and sediments, but are used by vegetation in production of organic matter. In this form, they create a reserve of periodically unavailable nitrogen. Relatively low
concentrations of phosphates - below 0.2 mg −34PO /dm3 - were also detected in waters of
Kozlowa Gora and Przeczyce. They do not guarantee low fertility of water in those reservoirs, though, as large amounts of phosphorus might be accumulated and kept in bottom deposits.
With regard to concentrations of macro-ions analyzed in the research, waters of all reservoirs could be classified as usable for consumption [28]. However, directly on the site, the water was frequently classified as unusable for consumption because of its color, taste or smell, that is properties which become unfavorable in eutrophic conditions. Use of these waters for production of potable water would require more detailed studies aimed at evaluation of their usability for treatment [29].
Conclusions
1. River waters in farmlands are a serious source of biogenic contaminations discharged to retaining reservoirs.
2. Agricultural anthropopressure has an impact on the process of eutrophication of water in dam reservoirs and consequently deterioration of the quality of disposable water reserves.
3. The degree of eutrophication of the reservoir waters is a derivative of distribution of farmlands within the catchment area.
4. Monitoring of parameters of river and reservoir waters subject to agricultural anthropopressure may facilitate appropriate protective measures in terms of improvement of their quality as well as renaturization of environments.
References [1] Vollenweider R.A.: Scientific fundamentals of the eutrophication of lakes and flowing waters with
particular references to nitrogen and phosphorus as factors in eutrophication. OECD Technical Report DAS/CSI/68.27. Paris 1968.
[2] Kajak Z.: Eutrofizacja jezior. PWN, Warszawa 1979. [3] Lugo A., Bravo-Incla L.A., Alcocer J., Gaytan M.L., Oliva M.G., Sanchez M.R., Chavez M. and Vilaclara
G.: Effect on the planktonic community of the chemical program used to control water hyacinth
(Eichhornia crassipes) in Guadalupe Dam, Mexico. Aquat. Ecosyst. Health Manage., 1998, 1(3-4), 333-343.
[4] Recknagel F., Burch M., Jablonskas G., Minney J. and Schofs S.: Combined effects of organic pollution
and eutrophication in the South Para Reservoirs, South Australia. Water Sci. Technol., 1998, 37(2), 113-120.
[5] Kim B., Park J.H., Hwang G., Jun M.S. and Choi K.: Eutrophication of reservoirs in South Korea. Limnology, 2001, 2(3), 223-229.
[6] Håkanson L., Blenckner T., Brynh A.C. and Hellström S.: The influence of calcium on the chlorophyll-
phosphorus relationship and lake Secchi depths. Hydrobiologia, 2005, 537(1-3), 111-123. [7] Petrucio M.M., Barbosa F.A.R. and Furtado A.L.S.: Bacterioplankton and phytoplankton production in
seven lakes in the Middle Rio Doce basin, south-east Brazil. Limnologica, 2006, 36(3), 192-203. [8] Kajak Z.: Eutrofizacja nizinnych zbiorników zaporowych. [in:] Procesy biologiczne w ochronie
i rekultywacji nizinnych zbiorników zaporowych. Bibl. Monit. Środow. PIOŚ, WIOŚ, ZES UŁ, Łódź 1995, 33-41.
Andrzej Jaguś and Mariusz Rzętała
366
[9] Rozporządzenie Ministra Środowiska z dnia 23 grudnia 2002 r. w sprawie kryteriów wyznaczania wód wrażliwych na zanieczyszczenie związkami azotu ze źródeł rolniczych. DzU 2002, Nr 241, poz. 2093.
[10] Carlson R.: A trophic state index for lakes. Limnol. Oceanogr., 1977, 22(1), 61-69. [11] Vollenweider R.A. and Kerekes J.J.: Eutrophication of waters - monitoring, assessment and control. OECD,
Paris 1982. [12] Maršálek B. and Bláha L.: Comparison of 17 biotests for detection of cyanobacterial toxicity. Environ.
Toxicol., 2004, 19, 310-317. [13] Pawlik-Skowrońska B., Skowroński T., Pirszel J. and Adamczyk A.: Relationship between cyanobacterial
bloom composition and anatoxin-a and microcystin occurrence in the eutrophic dam reservoir (SE
Poland). Polish J. Ecol., 2004, 52(4), 479-490. [14] Hill A.R. and McCague W.P.: Nitrate concentrations in streams near Alliston, Ontario, as influenced by
nitrogen fertilization of adjacent fields. J. Soil Water Conservat., 1974, 29(5), 217-220. [15] Mrkvička J. and Velich J.: Leaching of nitrogen and of other nutrients at different levels of long-term
fertilization of grassland. Zesz. Nauk. Akad. Roln. w Krakowie, 1989, 229, 245-259. [16] Sapek B.: Farm as a source of soil, water and air pollution with nitrogen, phosphorus and potassium.
Bibliot. Fragm. Agron., 1998, 3, 124-144. [17] Sapek A. and Sapek B.: Assumed non-point water pollution based on the nitrogen budget in Polish
Agriculture. Water Sci. Technol., 1993, 28(3-5), 483-488. [18] Sapek A. and Sapek B.: Strategia gospodarowania azotem i fosforem w rolnictwie w aspekcie ochrony wód
Morza Bałtyckiego. Zesz. Eduk. IMUZ, 2005, 10, 27-38. [19] Pedersen C.A.: Practical measures to reduce nutrient losses from arable land. Annual Crops - Proc. no.
300. The Fertilizer Society, London 1990. [20] Bogdewicz J.: System zaleceń nawożenia fosforem na Białorusi. Zesz. Eduk. IMUZ, 2002, 7,
73-83. [21] Schulz D.: Potencjalne możliwości zmniejszenia emisji azotu z rolnictwa do środowiska. Program
ograniczenia emisji azotu w Niemieckiej Republice Federalnej. Zesz. Eduk. IMUZ, 2002, 7, 37-46. [22] Zwykła Dobra Praktyka Rolnicza. Ministerstwo Rolnictwa i Rozwoju Wsi, Fundacja Programów Pomocy
dla Rolnictwa, Warszawa 2003. [23] Svedinger I.: Wdrażanie Dyrektywy Azotanowej w Szwecji. Zeszyty Edukacyjne IMUZ, 2005, 10, 92-96. [24] Jaguś A. and Rzętała M.: Znaczenie zbiorników wodnych w kształtowaniu krajobrazu (na przykładzie
kaskady jezior Pogorii). WNoMiŚ ATH, WNoZ UŚ, Bielsko-Biała - Sosnowiec 2008. [25] Rzętała M.: Funkcjonowanie zbiorników wodnych oraz przebieg procesów limnicznych w warunkach
zróżnicowanej antropopresji na przykładzie regionu górnośląskiego. Wyd. Uniwersytetu Śląskiego, Katowice 2008.
[26] Hermanowicz W., Dojlido J., Dożańska W., Koziorowski B. and Zerbe J.: Fizyczno-chemiczne badanie wody i ścieków. Arkady, Warszawa 1999.
[27] Steineck S., Jakobsson C. and Carlson G.: Fosfor - stosowanie, wykorzystanie przez rośliny uprawne
i nagromadzenie w glebach użytków rolnych. Zesz. Eduk. IMUZ, 2002, 7, 25-36. [28] Rozporządzenie Ministra Zdrowia z dnia 29 marca 2007 r. w sprawie jakości wody przeznaczonej do
spożycia przez ludzi. DzU 2007, Nr 61, poz. 417. [29] Rozporządzenie Ministra Środowiska z dnia 27 listopada 2002 r. w sprawie wymagań, jakim powinny
odpowiadać wody powierzchniowe wykorzystywane do zaopatrzenia ludności w wodę przeznaczoną do spożycia. DzU 2002, Nr 204, poz. 1728.
[30] Jaguś A. and Rzętała M.: Transformacja parametrów fizykochemicznych wód płynących w zbiornikach
przepływowych. Ochr. Środow. Zasob. Natural., 2009, 38, 115-122. [31] Rzętała M.: Purification of surface waters flowing in transfer reservoirs. Series of Monographs, Polish
J. Environ. Stud., 2009, 3, 43-50. [32] Newell A.D. and Skjelkvale B.L.: Acidification trends in surface waters in the International Program on
Acidification of Rivers and Lakes. Water, Air, Soil Pollut., 1997, 93, 27-57. [33] Mannio J.: Recovery pattern from acidification of headwater lakes in Finland. Water, Air, Soil Pollut.,
2001, 130, 1427-1432. [34] Sapek B.: Wymywanie azotanów oraz zakwaszenie gleby i wód gruntowych w aspekcie działalności
rolniczej. Mat. Infor. IMUZ, 1995, 30, 1-31.
Influence of agricultural anthropopression on water quality of the dam reservoirs
367
WPŁYW DZIAŁALNOŚCI ROLNICZEJ NA JAKOŚĆ WÓD W ZBIORNIKACH ZAPOROWYCH
1 Instytut Ochrony i Inżynierii Środowiska, Akademia Techniczno-Humanistyczna w Bielsku-Białej
2 Wydział Nauk o Ziemi, Uniwersytet Śląski
Abstrakt: W badaniach oceniano jakość wód powierzchniowych w warunkach antropopresji rolniczej. Analizowano wody rzeczne zasilające zbiorniki zaporowe oraz wody w zbiornikach. Do badań wytypowano zlewnie zbiorników Kozłowa Góra, Przeczyce i Łąka, położonych w regionie górnośląskim (południowa Polska). Dominującą formą użytkowania terenu w zlewniach jest działalność rolnicza. Stwierdzono, że zbiorniki były często zasilane wodami płynącymi o parametrach wskazujących na ich eutrofizację, zwłaszcza w odniesieniu do
zawartości azotanów (średnie roczne stężenie −3NO > 10 mg/dm3). Proces eutrofizacji dotyczył także wód
zbiornikowych, a jego przejawem były częste zakwity glonów. W zbiornikach dochodziło do wzrostu odczynu wód do silnie alkalicznego włącznie (pHmax > 8,5). Największą żyznością wód charakteryzował się zbiornik Łąka zasilany głównie z terenów rolniczych (77% powierzchni zlewni), położonych także w jego zlewni bezpośredniej.
Odzwierciedlały to m.in. duże stężenia fosforanów w wodach tego zbiornika (średnio 0,389 mg −34PO /dm3).
Badania wykazały, że antropopresja rolnicza stanowi zagrożenie dla funkcjonowania zbiorników zaporowych ze względu na generowanie procesu eutrofizacji i przez to pogarszanie jakości dyspozycyjnych zasobów wodnych.
Słowa kluczowe: użytkowanie terenu, antropopresja rolnicza, jakość wód, zbiornik zaporowy, eutrofizacja

ECOLOGICAL CHEM ISTRY AND ENGINEERING S
Vol. 18, No. 3 2011
Dariusz ŚWIERK1 and Barbara SZPAKOWSKA1*
OCCURRENCE OF HEAVY METALS IN AQUATIC MACROPHYTES COLONISING SMALL AQUATIC ECOSYSTEMS
WYSTĘPOWANIE METALI CIĘŻKICH W HYDROMAKROFITACH ZASIEDLAJĄCYCH MAŁE EKOSYSTEMY WODNE
Abstract: Concentration of heavy metals in plant tissues results from the total level of contamination of the ecosystem and the degree of development of a species, ecological form and phenophase. Some aquatic plants have a particularly great capacity to accumulate heavy metals and may be classified as hyperaccumulators. The studies of accumulation intensity of heavy metals by macrophytes in five water reservoirs situated in the General Dezydery Chlapowski Landscape Park indicated great variability of Al, Cu, Pb and Zn in both underground and aboveground plant organs. Most plants accumulated elements in surface layers of the rhizomes, mainly in the epidermis and in the cortex mesophyll. The greatest amounts of the analysed elements were found in rhizomes of Oenanthe aquatica (L.).
Keywords: water ecosystems, macrophyte, accumulation, heavy metals
In the recent decades natural element cycles are being influenced to an increasing degree by processes connected with anthropogenic activity. With the development of industry, agriculture, transport or mining a growing number of trace elements is activated.
Plants absorb elements and chemical compounds most commonly in the ionic form from the soil solution, bottom deposits, water and air. Some plants (including aquatic macrophytes) together with micro- and macroelements absorb also considerable amounts of toxic ions, which are accumulated in tissues of roots, stems or leaves. Plants absorb ions mainly from the soil solution through roots via active transport at the expense of energy accumulated in ATP or via passive transport by facilitated diffusion [1]. Ion uptake depends on external environmental conditions, mainly on the type of substrate and its reaction and temperature, but also on salinity, which as a consequence may cause acidification or alkalization of the medium (eg the introduction of KCl results in acidification of the substrate, since K+ ions may be more readily absorbed by plants, in case of the introduction
1 Department of Landscape Architecture, Faculty of Horticulture and Landscape Architecture, Poznań University of Life Sciences, ul. J.H. Dąbrowskiego 159, 60-594 Poznań, fax 61 848 79 59 * Corresponding author: [email protected]
Dariusz Świerk and Barbara Szpakowska
370
of NaNO3, the −
3NO ion is absorbed in greater amounts, while its ion exchanger is OH– or −
3HCO , causing alkalization of the substrate).
Hydrophytes, ie aquatic plants, are specific ecological forms. These plants, in order to survive in the aquatic environment, had to adapt by modifying both their anatomical and morphological structure.
In most immersed species we observe an increased sorption surface of submerged leaves, a reduced mesophyll tissue or atrophy of the cuticle. All plants connected with the aquatic environment are characterized by the development of air spaces in all organs, which facilitate gas exchange with the surrounding environment [2].
Evolutionary modifications of organs in aquatic plants to a considerable degree influence uptake of heavy metal ions. Tissues of aquatic macrophytes exhibit a certain tolerance to elevated concentrations of heavy metals in environments exposed to the negative action of these elements [3]. Total concentration of heavy metals in plant tissues results from the total level of contamination of the ecosystem and the degree of development of a species, ecological form and phenophase. Some aquatic plants are characterised by slow growth and limited biomass; however, they have a particularly great capacity to accumulate heavy metals, thanks to which they may be classified as hyperaccumulators.
The aim of the presented study was to determine whether plants of aquatic ecosystems may accumulate ions of toxic metals (Al, Pb), as well as those serving physiologically important functions in plant organs (Zn, Cu). Moreover, investigations aimed at the determination of locations in the cross-sections of plant organs (both underground and aboveground), in which absorbed metal ions are accumulated.
Experimental
Material and methods
Analyses were conducted in 2009 in the Gen. D. Chlapowski Landscape Park. Concentrations of elements (Al, Cu, Zn and Pb) were determined in organs of macrophytes (Polygonum hydropiper (L.), Glyceria fluitans (L.) R. Br., Carex acutiformis Ehrh., Phragmites australis (Cav.) Trin. ex Steud., Oenanthe aquatica (L.)) overgrowing aquatic ecosystems differing in terms of their position in the landscape. Moreover, intensity of accumulation was analysed for 4 metals (Al, Cu, Pb and Zn) in cross-sections of leaves or stems and rhizomes of the above-mentioned plants. Plants were selected on the basis of the advantage of a given species in the composition of plants found in the analysed reservoir.
Polygonum hydropiper (L.) and Glyceria fluitans (L.) R. Br. were found to be predominant in reservoirs located in the Rabin-Blociszewo forest complex (Figs 1 and 2).
Carex acutiformis Ehrh. and Phragmites australis (Cav.) Trin. ex Steud. were characteristic of the reservoirs located in agricultural areas (Figs 3 and 4). The surroundings of reservoirs comprised mostly arable fields and agriculturally used meadows.
Oenanthe aquatica (L.) was found in greatest numbers in the reservoir located in the built-up area (the village of Luszkowo). The reservoir is located in a drainless hollow and it has an area of 432 m2 (Fig. 5).

Occurrence of heavy metals in aquatic macrophytes colonising small aquatic ecosystems
371
Fig. 1. A forest reservoir (1) with predominant Polygonum hydropiper (L.)
Fig. 2. A forest reservoir (2) with predominant Glyceria fluitans (L.)
Fig. 3. An agricultural reservoir (3) with predominant Carex acutiformis Ehrh.
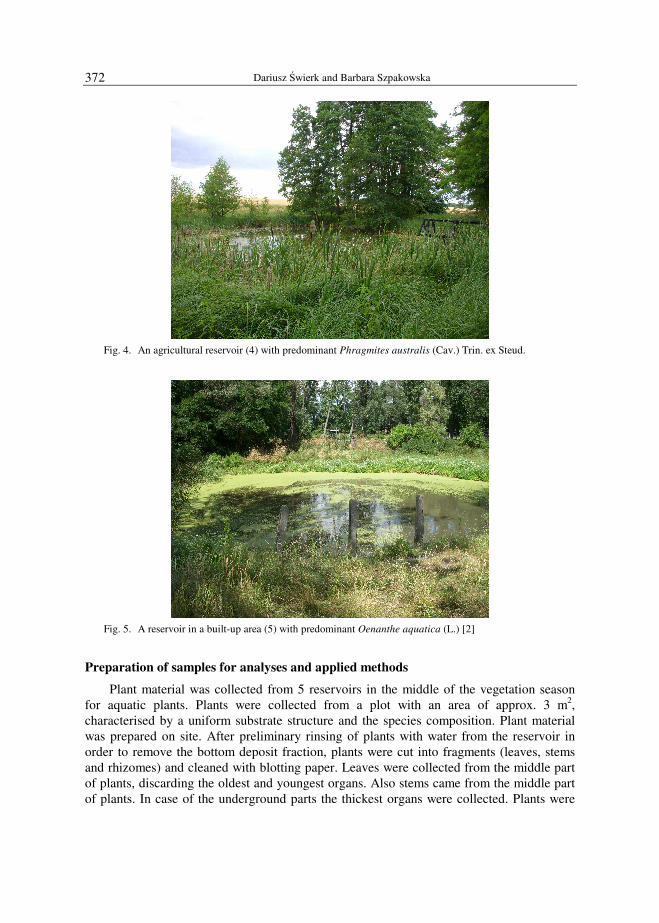
Dariusz Świerk and Barbara Szpakowska
372
Fig. 4. An agricultural reservoir (4) with predominant Phragmites australis (Cav.) Trin. ex Steud.
Fig. 5. A reservoir in a built-up area (5) with predominant Oenanthe aquatica (L.) [2]
Preparation of samples for analyses and applied methods
Plant material was collected from 5 reservoirs in the middle of the vegetation season for aquatic plants. Plants were collected from a plot with an area of approx. 3 m2, characterised by a uniform substrate structure and the species composition. Plant material was prepared on site. After preliminary rinsing of plants with water from the reservoir in order to remove the bottom deposit fraction, plants were cut into fragments (leaves, stems and rhizomes) and cleaned with blotting paper. Leaves were collected from the middle part of plants, discarding the oldest and youngest organs. Also stems came from the middle part of plants. In case of the underground parts the thickest organs were collected. Plants were
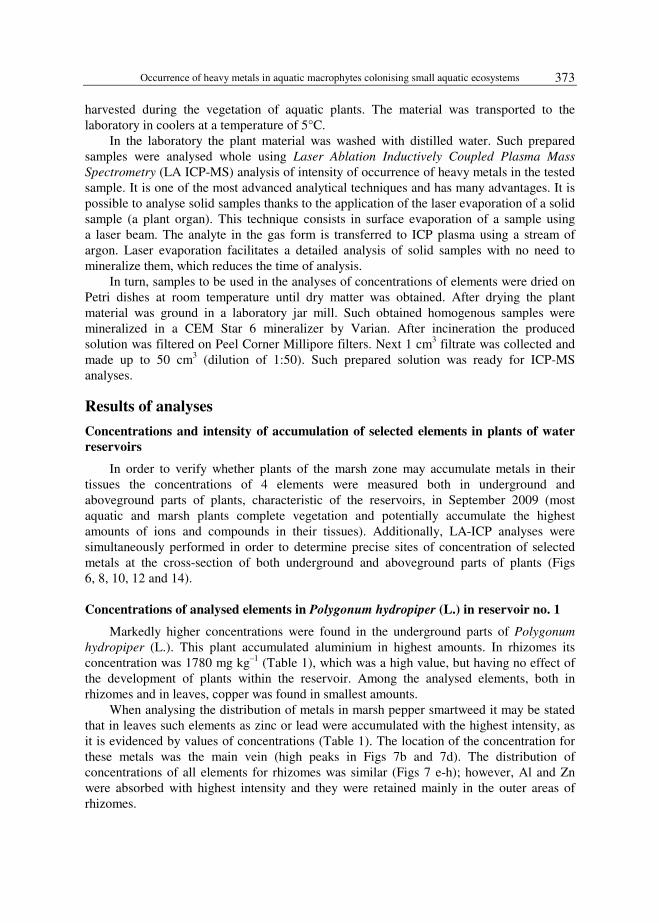
Occurrence of heavy metals in aquatic macrophytes colonising small aquatic ecosystems
373
harvested during the vegetation of aquatic plants. The material was transported to the laboratory in coolers at a temperature of 5°C.
In the laboratory the plant material was washed with distilled water. Such prepared samples were analysed whole using Laser Ablation Inductively Coupled Plasma Mass
Spectrometry (LA ICP-MS) analysis of intensity of occurrence of heavy metals in the tested sample. It is one of the most advanced analytical techniques and has many advantages. It is possible to analyse solid samples thanks to the application of the laser evaporation of a solid sample (a plant organ). This technique consists in surface evaporation of a sample using a laser beam. The analyte in the gas form is transferred to ICP plasma using a stream of argon. Laser evaporation facilitates a detailed analysis of solid samples with no need to mineralize them, which reduces the time of analysis.
In turn, samples to be used in the analyses of concentrations of elements were dried on Petri dishes at room temperature until dry matter was obtained. After drying the plant material was ground in a laboratory jar mill. Such obtained homogenous samples were mineralized in a CEM Star 6 mineralizer by Varian. After incineration the produced solution was filtered on Peel Corner Millipore filters. Next 1 cm3 filtrate was collected and made up to 50 cm3 (dilution of 1:50). Such prepared solution was ready for ICP-MS analyses.
Results of analyses
Concentrations and intensity of accumulation of selected elements in plants of water reservoirs
In order to verify whether plants of the marsh zone may accumulate metals in their tissues the concentrations of 4 elements were measured both in underground and aboveground parts of plants, characteristic of the reservoirs, in September 2009 (most aquatic and marsh plants complete vegetation and potentially accumulate the highest amounts of ions and compounds in their tissues). Additionally, LA-ICP analyses were simultaneously performed in order to determine precise sites of concentration of selected metals at the cross-section of both underground and aboveground parts of plants (Figs 6, 8, 10, 12 and 14).
Concentrations of analysed elements in Polygonum hydropiper (L.) in reservoir no. 1
Markedly higher concentrations were found in the underground parts of Polygonum
hydropiper (L.). This plant accumulated aluminium in highest amounts. In rhizomes its concentration was 1780 mg kg–1 (Table 1), which was a high value, but having no effect of the development of plants within the reservoir. Among the analysed elements, both in rhizomes and in leaves, copper was found in smallest amounts.
When analysing the distribution of metals in marsh pepper smartweed it may be stated that in leaves such elements as zinc or lead were accumulated with the highest intensity, as it is evidenced by values of concentrations (Table 1). The location of the concentration for these metals was the main vein (high peaks in Figs 7b and 7d). The distribution of concentrations of all elements for rhizomes was similar (Figs 7 e-h); however, Al and Zn were absorbed with highest intensity and they were retained mainly in the outer areas of rhizomes.
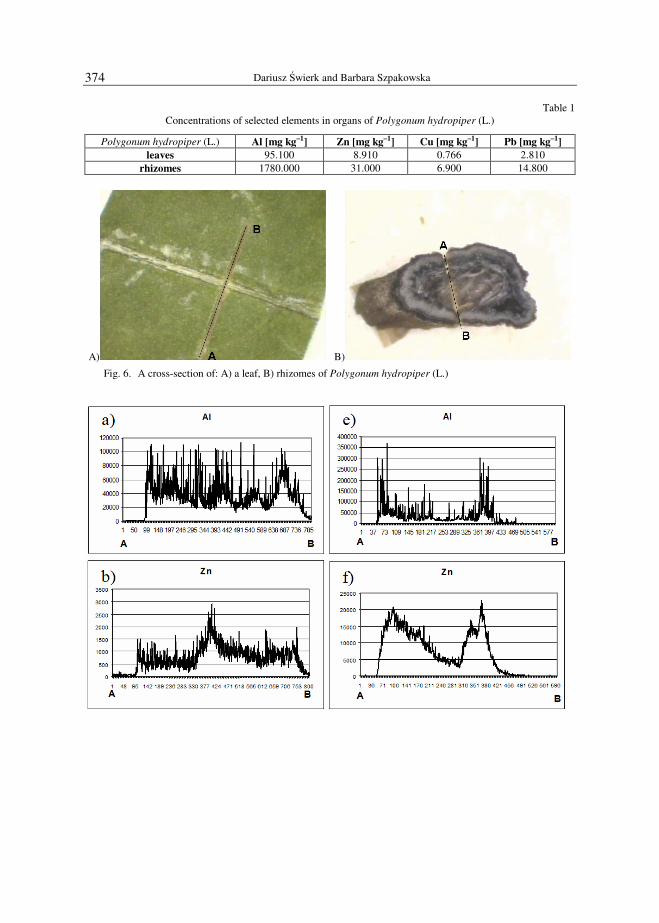
Dariusz Świerk and Barbara Szpakowska
374
Table 1 Concentrations of selected elements in organs of Polygonum hydropiper (L.)
Polygonum hydropiper (L.) Al [mg kg–1] Zn [mg kg–1] Cu [mg kg–1] Pb [mg kg–1] leaves 95.100 8.910 0.766 2.810
rhizomes 1780.000 31.000 6.900 14.800
A) B)
Fig. 6. A cross-section of: A) a leaf, B) rhizomes of Polygonum hydropiper (L.)
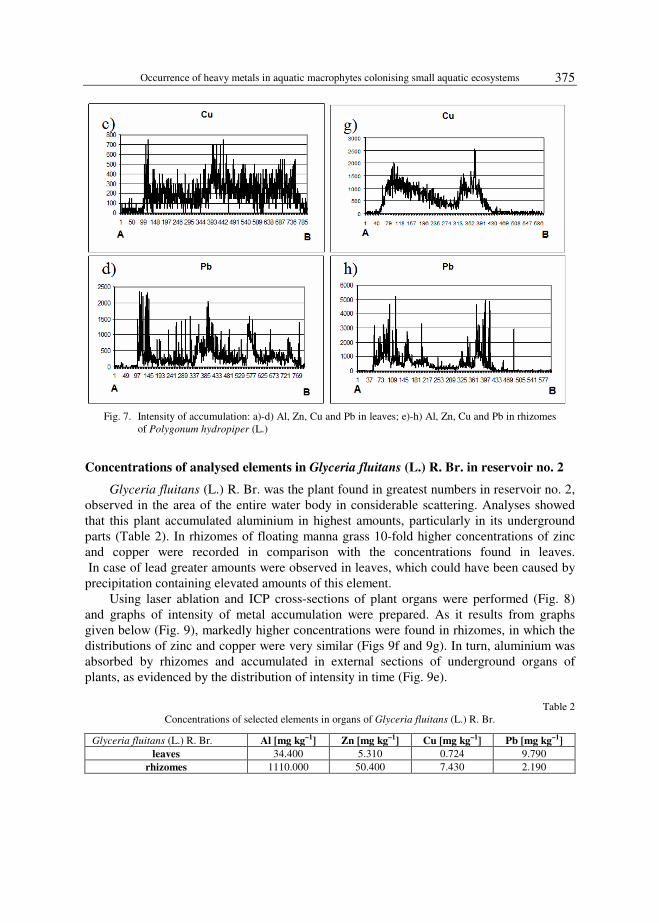
Occurrence of heavy metals in aquatic macrophytes colonising small aquatic ecosystems
375
Fig. 7. Intensity of accumulation: a)-d) Al, Zn, Cu and Pb in leaves; e)-h) Al, Zn, Cu and Pb in rhizomes
of Polygonum hydropiper (L.)
Concentrations of analysed elements in Glyceria fluitans (L.) R. Br. in reservoir no. 2
Glyceria fluitans (L.) R. Br. was the plant found in greatest numbers in reservoir no. 2, observed in the area of the entire water body in considerable scattering. Analyses showed that this plant accumulated aluminium in highest amounts, particularly in its underground parts (Table 2). In rhizomes of floating manna grass 10-fold higher concentrations of zinc and copper were recorded in comparison with the concentrations found in leaves. In case of lead greater amounts were observed in leaves, which could have been caused by precipitation containing elevated amounts of this element.
Using laser ablation and ICP cross-sections of plant organs were performed (Fig. 8) and graphs of intensity of metal accumulation were prepared. As it results from graphs given below (Fig. 9), markedly higher concentrations were found in rhizomes, in which the distributions of zinc and copper were very similar (Figs 9f and 9g). In turn, aluminium was absorbed by rhizomes and accumulated in external sections of underground organs of plants, as evidenced by the distribution of intensity in time (Fig. 9e).
Table 2
Concentrations of selected elements in organs of Glyceria fluitans (L.) R. Br.
Glyceria fluitans (L.) R. Br. Al [mg kg–1] Zn [mg kg–1] Cu [mg kg–1] Pb [mg kg–1] leaves 34.400 5.310 0.724 9.790
rhizomes 1110.000 50.400 7.430 2.190
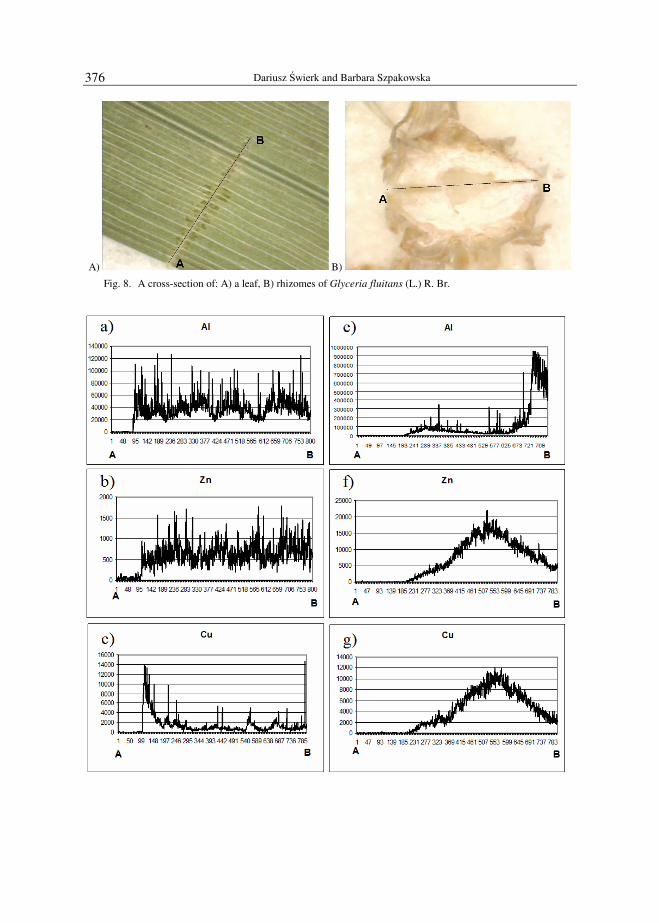
Dariusz Świerk and Barbara Szpakowska
376
A) B)
Fig. 8. A cross-section of: A) a leaf, B) rhizomes of Glyceria fluitans (L.) R. Br.
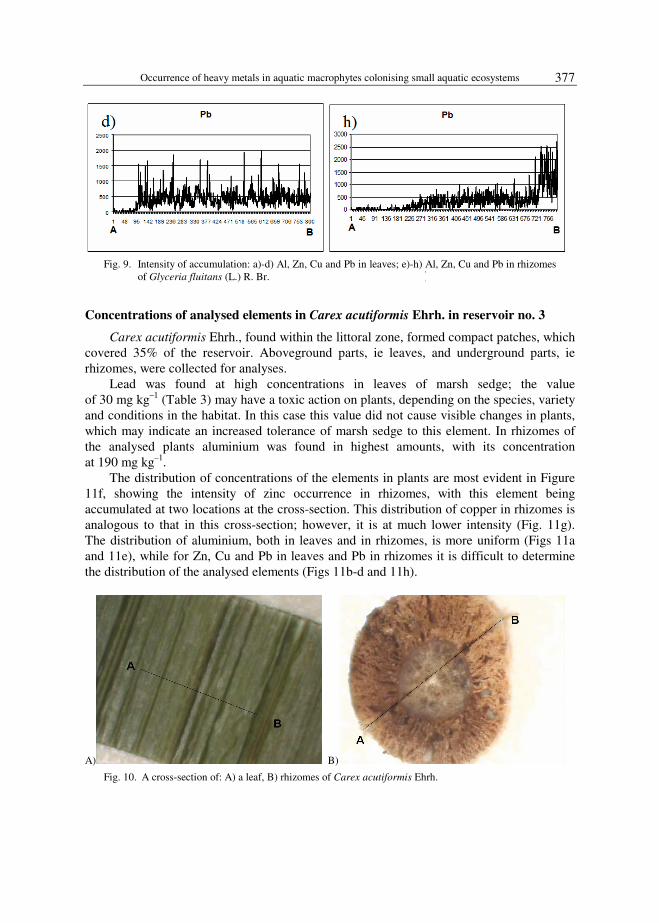
Occurrence of heavy metals in aquatic macrophytes colonising small aquatic ecosystems
377
Fig. 9. Intensity of accumulation: a)-d) Al, Zn, Cu and Pb in leaves; e)-h) Al, Zn, Cu and Pb in rhizomes
of Glyceria fluitans (L.) R. Br.
Concentrations of analysed elements in Carex acutiformis Ehrh. in reservoir no. 3
Carex acutiformis Ehrh., found within the littoral zone, formed compact patches, which covered 35% of the reservoir. Aboveground parts, ie leaves, and underground parts, ie rhizomes, were collected for analyses.
Lead was found at high concentrations in leaves of marsh sedge; the value of 30 mg kg–1 (Table 3) may have a toxic action on plants, depending on the species, variety and conditions in the habitat. In this case this value did not cause visible changes in plants, which may indicate an increased tolerance of marsh sedge to this element. In rhizomes of the analysed plants aluminium was found in highest amounts, with its concentration at 190 mg kg–1.
The distribution of concentrations of the elements in plants are most evident in Figure 11f, showing the intensity of zinc occurrence in rhizomes, with this element being accumulated at two locations at the cross-section. This distribution of copper in rhizomes is analogous to that in this cross-section; however, it is at much lower intensity (Fig. 11g). The distribution of aluminium, both in leaves and in rhizomes, is more uniform (Figs 11a and 11e), while for Zn, Cu and Pb in leaves and Pb in rhizomes it is difficult to determine the distribution of the analysed elements (Figs 11b-d and 11h).
A) B)
Fig. 10. A cross-section of: A) a leaf, B) rhizomes of Carex acutiformis Ehrh.
f)
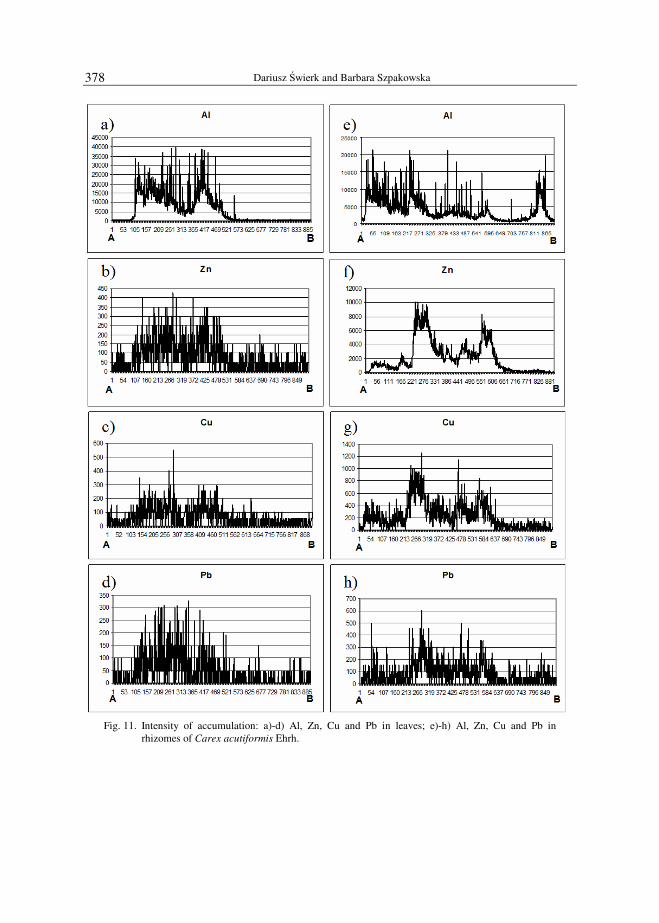
Dariusz Świerk and Barbara Szpakowska
378
Fig. 11. Intensity of accumulation: a)-d) Al, Zn, Cu and Pb in leaves; e)-h) Al, Zn, Cu and Pb in
rhizomes of Carex acutiformis Ehrh.

Occurrence of heavy metals in aquatic macrophytes colonising small aquatic ecosystems
379
Table 3 Concentrations of selected elements in organs of Carex acutiformis Ehrh.
Carex acutiformis Ehrh. Al [mg kg–1] Zn [mg kg–1] Cu [mg kg–1] Pb [mg kg–1]
leaves 13.500 9.560 1.160 31.200
rhizomes 190.000 15.900 2.450 0.598
Concentrations of analysed elements in Phragmites australis (Cav.) Trin. ex Steud. in reservoir no. 4
Phragmites australis (Cav.) Trin. ex Steud. was collected for chemical analyses from reservoir no. 4; this plant was found in the littoral zone as a predominant species and covered 82% area of the entire reservoir.
Similarly as marsh sedge, common reed accumulated lead in leaves in amounts of more than 30 mg kg–1, while in rhizomes only 0.18 mg kg–1 Pb were detected (Table 4). Much higher concentrations of the other elements were recorded in rhizomes.
In graphs showing the intensity of occurrence for all the analysed elements in leaves we may clearly see that their higher concentration was found in living tissues (darker colour - Fig. 12A), which is manifested in graphs given below (Figs 13a-d). Graphs of distributions for the elements in rhizomes show in detail in which locations aluminium, zinc and copper were accumulated (high peaks in Figs 13e-g), while slight concentrations of lead in rhizomes hinder its analysis (intensity of accumulation was very low, below 500 units).
Table 4
Concentrations of selected elements in organs of Phragmites australis (Cav.) Trin. ex Steud.
Phragmites australis (Cav.) Trin. ex Steud. Al [mg kg–1] Zn [mg kg–1] Cu [mg kg–1] Pb [mg kg–1]
leaves 8.980 5.320 0.783 30.500
rhizomes 54.400 19.500 2.6900 0.180
A) B)
Fig. 12. A cross-section of: A) a leaf, B) rhizomes of Phragmites australis (Cav.) Trin. ex Steud.

Dariusz Świerk and Barbara Szpakowska
380
Fig. 13. Intensity of accumulation: a)-d) Al, Zn, Cu and Pb in leaves; e)-h) Al, Zn, Cu and Pb in
rhizomes of Phragmites australis (Cav.) Trin. ex Steud.
Concentrations of analysed elements in Oenanthe aquatica (L.) in reservoir no. 5
Oenanthe aquatica (L.) is a plant, which appeared in reservoir no. 5. In the structure of fine-leaved water dropwort the rhizome and the lower section of the stem are predominant,

Occurrence of heavy metals in aquatic macrophytes colonising small aquatic ecosystems
381
characterised by a large diameter at the cross-section in comparison with the other organs of the plant. Due to the complex structure of leaves the stem was collected for analyses as the aboveground part, while the rhizome was collected as the underground part.
In rhizomes of this plant the highest concentrations of the elements were recorded from among all the plants found in the reservoirs. Aluminium concentration in this part of the plant exceeded 2.5 g kg–1, also concentrations of zinc, copper and lead were high, amounting to 0.31, 0.098 and 0.091 g kg–1 d.m., respectively (Table 5). Concentrations of metals in the stem of this plant were much lower, which shows that this plant accumulates mainly ions of the elements in the rhizome and transports them to the aboveground parts in slight amounts.
The distribution of metals, both in stems and rhizomes, is clearly manifested for Al, Zn and Cu. Distributions of these elements show in which locations in the stem and rhizomes the analysed elements are accumulated (Figs 15a-c and Figs 15e-g). We need to stress here similar distributions of copper and zinc, which may indicate similar mechanisms of uptake for these elements.
Table 5
Concentrations of selected elements in organs of Oenanthe aquatica (L.)
Oenanthe aquatica (L.) Al [mg kg–1] Zn [mg kg–1] Cu [mg kg–1] Pb [mg kg–1] stems 4.480 3.950 0.479 7.000
rhizomes 2570.000 310.000 98.700 90.900
A) B)
Fig. 14. A cross-section of: A) a stem, B) rhizomes of Oenanthe aquatica (L.)

Dariusz Świerk and Barbara Szpakowska
382
Fig. 15. Intensity of accumulation: a)-d) Al, Zn, Cu and Pb in stems; e)-h) Al, Zn, Cu and Pb in rhizomes
of Oenanthe aquatica (L.)
Discussion
Analyses conducted in Poland and abroad confirm the accumulation capacity of hydrophytes. It results from analyses conducted on plants in the reservoirs of the city of Poznan that macrophytes, such as Typha latifolia (L.) and Phragmites australis Cav. Trin. ex Steud., may accumulate heavy metals (Cu, Pb, Cd, Zn), while Zn and Cu, as less mobile elements, were accumulated in greater amounts by the underground organs. An opposite situation was observed in case of Cd and Pb, where higher concentrations were recorded in aboveground parts of the analysed plants [4, 5]. Analyses conducted in the Leszno Lake District showed that leaves of Phragmites australis Cav. Trin. ex Steud. may accumulate Mn and Cr at concentrations exceeding physiological levels for most plants [6].
Analyses concerning bioaccumulation of heavy metals by aquatic plants are conducted in many parts of the world. In China eg concentrations of Cd, Pb, Cu, Zn and Mn were
Occurrence of heavy metals in aquatic macrophytes colonising small aquatic ecosystems
383
analysed in two species of pondweed (Potamogeton sp.) [7]. Water hyacinth (Eichhornia
crassipes) was the object of investigations in India [8], Pistia stratiotes (L.) was examined under hydroponic conditions in Nigeria [9], while plants from genera Typha sp. and Persicaria sp. were studied in Australia [10].
Analyses concerning concentrations of metal ions in aquatic macrophytes are conducted on a broad scale in Poland, focusing on the most common species, predominant in the littoral zone. In literature most frequently studies have investigated two macrophytes considered the best hyperaccumulators, ie Phragmites australis Cav. Trin. ex Steud. and Typha sp.
Very interesting results were presented by Cardwell et al [10], who analysed 15 species of aquatic and marsh plants overgrowing watercourses in Brisbane. They recorded much higher concentrations of heavy metals in rhizomes of plants in comparison with concentrations found in leaves mainly in case of Typha domingensis Pers. and Schoenoplectus validus (Vahl) A.&D. Löve. The concentration in rhizomes was so high that it exceeded values recorded in the adjacent bottom deposits. Such a situation was explained by the higher accumulation of ions of these elements by plants and the contamination of urban areas with these metals mainly by sewage discharges and leaching of metal ions from urban and industrial areas. The authors stated that the elements are accumulated in the epidermis and mesophyll of the cortex in greater amounts than in the pith of the mesophyll (a section of the central cylinder).
It results from the analyses conducted in the Gen. D. Chlapowski Landscape Park that most plants accumulate elements in surface layers of the rhizomes, mainly in the epidermis and in the cortex mesophyll. In leaves of Phragmites australis (Cav.) Trin. ex Steud the physiological level was exceeded for lead. Values in leaves were higher than those recorded for rhizomes, which may indicate that lead to a considerable degree was absorbed by leaves from dry or wet depositions. Definitely highest concentrations of zinc, copper and lead were found for rhizomes of Oenanthe aquatica (L.). Recorded concentrations of lead and copper fluctuated around the toxic content level, while zinc concentration exceeded the physiological level. This suggests that plants may accumulate in their underground parts considerable amounts of noxious elements, with no simultaneous inhibition of the basic physiological processes. Macrophytes may accumulate considerable amounts of toxic elements in their tissues (mainly in stolons and rhizomes) - with the exception of lead, which was accumulated primarily in leaves. As it was shown by the analyses conducted in different areas, aquatic and marsh plants may not only be good bioindicators of water cleanliness, but first of all be effective in the purification of surface waters and serve the function of the biogeochemical barrier.
Conclusions
1. Analysed plants turned out to be good accumulators of micropollutants (Al, Zn, Cu and Pb). The greatest amounts of the analysed elements were found in rhizomes of Oenanthe aquatica (L.).
2. Higher concentrations of Al, Zn and Cu were recorded in rhizomes of the analysed plants, while Pb predominated in aboveground parts of analysed macrophytes.
3. Marsh plants accumulate toxic ions of the elements mainly in the epidermal layer and the cortex mesophyll, as it is indicated by analyses conducted using one of the most

Dariusz Świerk and Barbara Szpakowska
384
advanced analytical analyses, ie Laser Ablation Inductively Coupled Plasma Mass Spectrometry (LA ICP-MS).
4. Some aquatic macrophytes may accumulate in their organs considerable amounts of noxious elements, with no simultaneous inhibition of the basic physiological processes.
5. Aquatic and marsh plants, particularly Oenanthe aquatica (L.), may be used not only as bioaccumulators of pollutants, but first of all as an effective element in hydrophytic treatment plants.
Acknowledgements
This work was financially supported by grant N N 305 085635.
References [1] Kopcewicz J. and Lewak S.: Fizjologia roślin (Plant physiology). Wyd. Nauk. PWN, Warszawa 2002. [2] Kłosowski S. and Kłosowski G.: Rośliny wodne i bagienne (Aquatic and marsh plants). Wyd. Multico,
Warszawa 2007. [3] McCabe O., Baldwin J.L. and Otte M.L.: Metal tolerance in wetland plants. Minerva Biotechnol., 2001, 13,
141-149. [4] Szpakowska B., Goliński P., Karlik B., Kaczmarek Z. and Szczepańska M.: Distribution of selected heavy
metals (Zn, Cd, Pb, Cu) in different elements of urban water reserviors. Polish J. Environ. Stud., 2005, 14(5), 13-17.
[5] Szpakowska B., Karlik B., Goliński P., Kaczmarek Z. and Świerk D.: Variation in heavy metal content in
recreational reservoirs in a conurbation. Polish J. Environ. Stud., 2009, 18(3A), 436-444. [6] Klink A. Krawczyk J. and Wisłocka M.: The content of heavy metals in leaves of Phragmites australis Cav.
Trin. ex Steud. and bottom sediments from lakes of Pojezierze Leszczyńskie. Ochr. Środow. Zasob. Natural., 2009, 39, 60-66.
[7] Kejian P., Chunling L., Laiqing L., Xiangdong L. and Zhenguo Sh.: Bioaccumulation of heavy metals by
the aquatic plants Potamogeton pectinatus L. and Potamogeton malaianus Miq. and their potential use for
contamination indicators and in wastewater treatment. Sci. Total Environ., 2008, 392, 22-29. [8] Tiwari S., Dixit S. and Verma N.: An effective means of biofiltration of heavy metal contaminated water
bodies using aquatic weed Eichhornia crassipes. Environ. Monit. Assess., 2007, 129, 253-256. [9] Odjegba V.J. and Fasidi I.O.: Accumulation of trace elements by Pistia stratiotes: implications for
phytoremediation. Ecotoxicology, 2004, 13, 637-646. [10] Cardwell A.J., Hawker D.W. and Greenway M.: Metal accumulation in aquatic macrophytes from southeast
Queensland, Australia. Chemosphere, 2002, 48, 653-663.
WYSTĘPOWANIE METALI CIĘŻKICH W ORGANACH HYDROMAKROFITÓW ZASIEDLAJĄCYCH MAŁE EKOSYSTEMY WODNE NA TERENIE PARKU KRAJOBRAZOWEGO IM. GEN. D. CHŁAPOWSKIEGO
Wydział Ogrodnictwa i Architektury Krajobrazu, Uniwersytet Przyrodniczy w Poznaniu
Abstrakt: Koncentracja metali ciężkich w tkankach roślin jest wypadkową ogólnego poziomu zanieczyszczenia ekosystemu i stopnia rozwoju gatunku, formy ekologicznej oraz fazy fenologicznej. Niektóre rośliny wodne mają dużą zdolność do gromadzenia metali ciężkich, pełniąc funkcję hiperakumulatorów. Badania nad intensywnością akumulacji metali ciężkich przez makrofity, zasiedlające pięć zbiorników wodnych na terenie Parku Krajobrazowego im. gen. Dezyderego Chłapowskiego, wykazały duże zróżnicowanie stężeń Al, Cu, Pb i Zn w częściach nadziemnych i podziemnych roślin. Większość roślin gromadziła pierwiastki w wierzchnich warstwach kłącza, głównie skórki, oraz w miękiszu kory pierwotnej. Największe ilości analizowanych pierwiastków stwierdzono w kłączu Oenanthe aquatica (L.).
Słowa kluczowe: ekosystemy wodne, makrofity, akumulacja, metale ciężkie

VARIA

INVITATION FOR ECOpole’11 CONFERENCE
CHEMICAL SUBSTANCES IN ENVIRONMENT
We have the honour to invite you to take part in the 20th annual Central European Conference ECOpole'11, which will be held in 13-15 X 2011 (Thursday-Saturday) at the Conference Center „Rzemieślnik" in Zakopane, PL.
The Conference Programme includes oral presentations and posters and will be divided into five sections:
• SI Chemical Pollution of Natural Environment and its Monitoring • SII Environment Friendly Production and Use of Energy • SIII Risk, Crisis and Security Management • SIV Forum of Young Scientists and Environmental Education in Chemistry • SV Impact of Environment Pollution on Food and Human Health
The Conference language is English. The Conference Opening Lecture:
”Atmospheric Chemistry and Climate in the Anthropocene”
will be delivered by the Nobel Prize Winner Professor Dr. Paul Jozef CRUTZEN. Contributions to the Conference will be published as: • abstracts on the CD-ROM (0.5 page of A4 paper sheet format) • extended Abstracts (4-6 pages) in the semi-annual journal Proceedings of
ECOpole • full papers will be published in successive issues of the Ecological Chemistry and
Engineering/Chemia i Inżynieria Ekologiczna (Ecol. Chem. Eng.) ser. A or S. Additional information one could find on Conference website
ecopole.uni.opole.pl
The deadline for sending the Abstracts is 31.08.2011 and for the Extended Abstracts: 1.10.2011. The actualized list (and the Abstracts) of the Conference contributions accepted for presentation by the Scientific Board, one can find (starting from 15.07.2011) on the Conference website.

388
The papers must be prepared according to the Guide for Authors on Submission of Manuscripts to the Journals.
The Conference fee is 400 € (covering hotel, meals and transportation during the Conference). It could be reduced (to 220 €) for young people actively participating in the Forum of Young Scientists. But the colleague has to deliver earlier the Extended Abstract (4-6 pages) of his/her contribution (deadline is on 15.08.2011), and a recommendation of his/her Professor.
Fees transferred after 13.09.2011 are 10% higher. Please, fill in the Registration Form and send it via email or fax. At the Reception Desk each participant will obtain a CD-ROM with abstracts of the
Conference contributions as well as Conference Programme (the Programme will be also published on this site).
Further information is available from: Prof. dr hab. inż. Maria Wacławek Chairperson of the Organising Committee of ECOpole'11 Conference University of Opole email: [email protected] and [email protected] phone: +48 77 455 91 49 and +48 77 401 60 42 fax +48 77 401 60 51
Conference series
1. 1992 Monitoring '92 Opole 2. 1993 Monitoring '93 Turawa 3. 1994 Monitoring '94 Pokrzywna 4. 1995 EKO-Opole '95 Turawa 5. 1996 EKO-Opole '96 Kędzierzyn Koźle 6. 1997 EKO-Opole '97 Duszniki Zdrój 7. 1998 CEC ECOpole '98 Kędzierzyn Koźle 8. 1999 CEC ECOpole '99 Duszniki Zdrój 9. 2000 CEC ECOpole 2000 Duszniki Zdrój 10. 2001 CEC ECOpole'01 Duszniki Zdrój 11. 2002 CEC ECOpole'02 Duszniki Zdrój 12. 2003 CEC ECOpole'03 Duszniki Zdrój 13. 2004 CEC ECOpole'04 Duszniki Zdrój 14. 2005 CEC ECOpole'05 Duszniki Zdrój 15. 2006 CEC ECOpole'06 Duszniki Zdrój 16. 2007 CEC ECOpole'07 Duszniki Zdrój 17. 2008 CEC ECOpole'08 Piechowice 18. 2009 CEC ECOpole'09 Piechowice 19. 2010 CEC ECOpole'10 Piechowice
389
REGISTRATION FORM for the ECOpole'11 CONFERENCE
Surname and First Name ........................................................................................................................ Scientific Title/Position .......................................................................................................................... Affiliation ............................................................................................................................................... Address ................................................................................................................................................... Phone/fax .............................................................. email ..................................................................... Authors and title of presentation ............................................................................................................ ................................................................................................................................................................. ................................................................................................................................................................. ................................................................................................................................................................. KIND of PRESENTATION YES NO Oral Poster Taking part in discussion
ACCOMODATION
12/13 X 13/14 X 14/15 X
Yes No Yes No Yes No
MEALS
Date Breakfast Lunch Dinner
12 X --- ---
13 X
14 X
15 X ---
�

ZAPRASZAMY DO UDZIAŁU W ŚRODKOWOEUROPEJSKIEJ KONFERENCJI
ECOpole’11 W DNIACH 13-15 X 2011
SUBSTANCJE CHEMICZNE W ŚRODOWISKU PRZYRODNICZYM
Będzie to dwudziesta z rzędu konferencja poświęcona badaniom podstawowym oraz działaniom praktycznym dotycząca różnych aspektów ochrony środowiska przyrodniczego. Odbędzie się ona w Ośrodku Konferencyjno-Wypoczynkowym „Rzemieślnik” w Zakopanem. Doroczne konferencje ECOpole mają charakter międzynarodowy i za takie są uznane przez Ministerstwo Nauki i Szkolnictwa Wyższego. Obrady konferencji ECOpole'11 będą zgrupowane w pięciu Sekcjach:
• SI Chemiczne substancje w środowisku przyrodniczym oraz ich monitoring • SII Odnawialne źródła energii i jej oszczędne pozyskiwanie oraz użytkowanie • SIII Zarządzanie środowiskiem w warunkach kryzysowych • SIV Forum Młodych (FM) i Edukacja prośrodowiskowa • SV Wpływ zanieczyszczeń środowiska oraz żywności na zdrowie ludzi
Pan Profesor dr Paul Jozef CRUTZEN - Laureat Nagrody Nobla wygłosi referat inauguracyjny pod tytułem:
”Atmospheric Chemistry and Climate in the Anthropocene”
Materiały konferencyjne będą opublikowane w postaci: • abstraktów (0,5 strony formatu A4) na CD-ROM-ie; • rozszerzonych streszczeń o objętości 4-6 stron w półroczniku Proceedings of
ECOpole; • artykułów: w abstraktowanych czasopismach: Ecological Chemistry and
Engineering/Chemia i Inżynieria Ekologiczna (Ecol. Chem. Eng.) ser. A i S oraz w półroczniku Chemia-Dydaktyka-Ekologia-Metrologia.
Termin nadsyłania angielskiego i polskiego streszczenia o objętości 0,5-1,0 strony (wersja cyfrowa + wydruk) planowanych wystąpień upływa w dniu 31 sierpnia 2011 r. Lista prac zakwalifikowanych przez Radę Naukową Konferencji do prezentacji będzie sukcesywnie publikowana od 15 lipca 2011 r. na stronie webowej.

392
ecopole.uni.opole.pl
Aby praca (dotyczy to także streszczenia, które powinno mieć tytuł w języku polskim i angielskim, słowa kluczowe w obydwu językach) przedstawiona w czasie konferencji mogła być opublikowana, jej tekst winien być przygotowany zgodnie z wymaganiami stawianymi artykułom drukowanym w czasopismach Ecological Chemistry and
Engineering ser. A oraz S, które jest dostępne w wielu bibliotekach naukowych w Polsce i zagranicą. Są one takie same dla prac drukowanych w półroczniku Chemia-Dydaktyka-
-Ekologia-Metrologia. Zalecenia te są również umieszczone na stronie webowej konferencji.
Po konferencji zostaną wydane 4-6-stronicowe rozszerzone streszczenia wystąpień w półroczniku Proceedings of ECOpole. Artykuły te winny być przesłane do 1 października 2011 r. Wszystkie nadsyłane prace podlegają zwykłej procedurze recenzyjnej.
Koszt uczestnictwa w całej konferencji wynosi 1300 zł (w tym 23% VAT) i pokrywa opłatę za udział, koszt noclegów i wyżywienia oraz rocznej prenumeraty Ecol. Chem. Eng. (razem blisko 2000 ss.) łącznie z materiałami Konferencji. Jest możliwość udziału tylko w jednym wybranym przez siebie dniu, wówczas opłata wyniesie 950 zł i będzie upoważniała do uzyskania wszystkich materiałów konferencyjnych, jednego noclegu i trzech posiłków (śniadanie, obiad, kolacja), natomiast osoby zainteresowane udziałem w dwóch dniach, tj. w pierwszym i drugim lub drugim i trzecim, winny wnieść opłatę w wysokości 1100 zł. Opłata dla magistrantów i doktorantów oraz młodych doktorów biorących aktywny udział w Forum Młodych może być zmniejszona do 750 zł (w tym 23% VAT), przy zachowaniu takich samych świadczeń. Osoby te winny dodatkowo dostarczyć: rozszerzone streszczenia (4-6 stron) swoich wystąpień (do 15.08.2011 r.). Jest także wymagana opinia opiekuna naukowego.
Opłaty wnoszone po 13 września 2011 r. są większe o 10% od kwot podanych powyżej. Wszystkie wpłaty powinny być dokonane na konto Towarzystwa Chemii i Inżynierii Ekologicznej w Banku Śląskim:
BSK O/Opole Nr 65 1050 1504 1000 0005 0044 3825
i mieć dopisek ECOpole'11 oraz nazwisko uczestnika konferencji. Prosimy o wypełnienie Formularza zgłoszeniowego i przesłanie go emailem.
Wszystkie streszczenia oraz program Konferencji zostaną wydane na CD-ROM-ie, który otrzyma każdy z uczestników podczas rejestracji. Program będzie także umieszczony na tej stronie.
Prof. dr hab. inż. Maria Wacławek Przewodnicząca Komitetu Organizacyjnego Konferencji ECOpole'11 Wszelkie uwagi i zapytania można kierować na adres: [email protected] lub [email protected] tel. 77 401 60 42 tel. 77 455 91 49 fax 77 401 60 51

393
Kalendarium 1. 1992 Monitoring '92 Opole 2. 1993 Monitoring '93 Turawa 3. 1994 Monitoring '94 Pokrzywna 4. 1995 EKO-Opole '95 Turawa 5. 1996 EKO-Opole '96 Kędzierzyn-Koźle 6. 1997 EKO-Opole '97 Duszniki Zdrój 7. 1998 ŚEK ECOpole '98 Kędzierzyn-Koźle 8. 1999 ŚEK ECOpole '99 Duszniki Zdrój 9. 2000 ŚEK ECOpole 2000 Duszniki Zdrój 10. 2001 ŚEK ECOpole '01 Duszniki Zdrój 11. 2002 ŚEK ECOpole '02 Duszniki Zdrój 12. 2003 ŚEK ECOpole '03 Duszniki Zdrój 13. 2004 ŚEK ECOpole '04 Duszniki Zdrój 14. 2005 ŚEK ECOpole '05 Duszniki Zdrój 15. 2006 ŚEK ECOpole '06 Duszniki Zdrój 16. 2007 ŚEK ECOpole '07 Duszniki Zdrój 17. 2008 ŚEK ECOpole '08 Piechowice 18. 2009 ŚEK ECOpole '09 Piechowice 19. 2010 ŚEK ECOpole '10 Piechowice

394
ZGŁASZAM UCZESTNICTWO W KONFERENCJI ECOpole’11 (prosimy o wypełnienie zgłoszenia drukowanymi literami)
Nazwisko i imię ...................................................................................................................................... Tytuł (stopień) naukowy/stanowisko ...................................................................................................... Miejsce pracy ......................................................................................................................................... Adres ...................................................................................................................................................... tel./fax..................................................................... , email .................................................................... Autorzy i tytuł wystąpienia ..................................................................................................................... ................................................................................................................................................................. ................................................................................................................................................................. ................................................................................................................................................................. Dane instytucji (nazwa, adres, NIP), dla której ma być wystawiona faktura: ................................................................................................................................................................. ................................................................................................................................................................. ................................................................................................................................................................. ................................................................................................................................................................. RODZAJ PRZEWIDYWANEGO WYSTĄPIENIA
TAK NIE
Referat
Poster
Głos w dyskusji
ZAMAWIAM NOCLEG
12/13 X 13/14 X 14/15 X
TAK NIE TAK NIE TAK NIE
ZAMAWIAM POSIŁKI
Data Śniadanie Obiad Kolacja
12 X --- ---
13 X
14 X
15 X ---

GUIDE FOR AUTHORS ON SUBMISSION OF MANUSCRIPTS
A digital version of the Manuscript addressed:
Professor Witold Wacławek Editor-in-chief
Ecological Chemistry and Engineering (Ecol. Chem. Eng.) Uniwersytet Opolski
ul. kard. B. Kominka 6, 45-032 Opole, Poland phone +48 77 401 60 42, fax +48 77 401 60 51
email: [email protected], [email protected]
should be sent by email to the Editorial Office Secretariat - [email protected] The Editor assumes, that an author submitting a paper for publication has been authorised to do
that. It is understood the paper submitted to be original and unpublished work, and is not being considered for publication by another journal. After printing, the copyright of the paper is transferred to Towarzystwo Chemii i Inżynierii Ekologicznej (Society for Ecological Chemistry and
Engineering). In preparation of the manuscript please follow the general outline of papers published in the most recent issues of Ecol. Chem. Eng., a sample copy can be sent, if requested. Papers submitted are supposed to be written in English language and should include an abstract and keywords, if possible also in Polish language. If not then the Polish abstract and keywords will be provided by the Editorial Office. All authors are requested to inform of their current addresses, phone and fax numbers and their email addresses.
It is urged to follow the units recommended by the Systéme Internationale d'Unites (SI). Graph axis labels and table captions must include the quantity units.
Symbols recommended by the International Union of Pure and Applied Chemistry (Pure and Appl. Chem. 1979, 51, 1-41) are to be followed. Graphics (drawings, plots) should also be supplied in the form of digital vector - type files, eg CorelDraw, Grapher for Windows or at least in a bitmap format (TIF, JPG, PCX, BMP). In the case of any querry please feel free to contact with the Editorial Office. Footnotes, tables and graphs should be prepared as separate files. References cited chronologically should follow the examples given below: [l] Kowalski J. and Malinowski A.: Polish J. Chem., 1990, 40(3), 2080-2085. [2] Nowak S.: Chemia nieorganiczna. WNT, Warszawa 1990.
Journal titles should preferably follow the Chem. Abst. Service recommended abbreviations. Receipt of a paper submitted for publication will be acknowledged by email. If no acknowledgement has been received, please check it with the Editorial Office by email, fax, letter or phone.

396
ZALECENIA DOTYCZĄCE PRZYGOTOWANIA MANUSKRYPTÓW
Praca przeznaczona do druku w czasopiśmie Ecological Chemistry and Engineering S/Chemia
i Inżynieria Ekologiczna S (Ecol. Chem. Eng. S) powinna być przesłana na adres Redakcji:
Profesor Witold Wacławek Redakcja
Ecological Chemistry and Engineering/Chemia i Inżynieria Ekologiczna Uniwersytet Opolski
ul. kard. B. Kominka 4, 45-032 Opole tel. 77 401 60 42, fax 77 401 60 51
email: [email protected], [email protected]
w postaci cyfrowej w formacie Microsoft Word (ver. XP dla Windows) emailem ([email protected]). Redakcja przyjmuje, że autor, przesyłając artykułu do druku, w ten sposób oświadcza, że jest
upoważniony do tego, oraz zapewnia, że artykuł ten jest oryginalny i nie był wcześniej drukowany gdzie indziej i nie jest wysłany do druku gdzie indziej oraz że po jego wydrukowaniu copyright do tego artykułu uzyskuje Towarzystwo Chemii i Inżynierii Ekologicznej. W przygotowaniu manuskryptu należy przede wszystkim wzorować się na postaci artykułów w możliwie najnowszych zeszytach Ecol. Chem. Eng. Prace przesyłane do publikacji winny być napisane w języku angielskim lub polskim oraz zaopatrzone w abstrakty i słowa kluczowe w obydwu tych językach. Zalecamy, aby artykuł zawierał adresy i emaile oraz numery telefonów i faksów wszystkich autorów danej pracy, szczególnie głównego autora, którego nazwisko wyróżniamy gwiazdką.
Usilnie prosimy o stosowanie układu jednostek SI. Zwracamy uwagę, że osie wykresów oraz główki tabel powinny bezwzględnie zawierać jednostki stosownej wielkości. W przypadku artykułów pisanych po polsku podpisy tabel i rysunków powinny być podane w językach polskim i angielskim.
Polecamy symbolikę zalecaną przez PTChem (Symbole i terminologia wielkości i jednostek stosowanych w chemii fizycznej, Ossolineum, Wrocław 1989; Pure Appl. Chem., 1979, 51, 1-41).
Materiał graficzny (rysunki, wykresy), obok wersji na papierze, powinien również być dostarczony w postaci cyfrowych plików wektorowych, np. za pomocą programów: CorelDraw wersja 9.0, Grafer dla Windows lub przynajmniej bitowe (TIF, JPG, PCX, BMP).
Przypisy i tabele, podobnie jak rysunki, zapisujemy jako osobne pliki. Literaturę prosimy zamieszczać wg poniższych przykładów:
[1] Kowalski J. i Malinowski A.: Polish J. Chem., 1990, 40(3), 2080-2085. [2] Nowak S.: Chemia nieorganiczna. WNT, Warszawa 1990.

397
Tytuły czasopism należy skracać zgodnie z zasadami przyjętymi przez amerykańską Chemical
Abstracts Service, a w przypadku polskich publikacji niepodawanych przez CAS należy stosować skrót zgodnie z zaleceniami Biblioteki Narodowej. Autor może, jeżeli uważa to za wskazane, podawać też tytuł cytowanych artykułów z czasopism (który będzie składany kursywą) oraz numer zeszytu danego woluminu (w nawiasie, po numerze woluminu).
Redakcja potwierdza emailem otrzymanie artykułu do druku. W przypadku braku potwierdzenia prosimy o interwencję: emailem, faksem, listem lub telefonicznie.

EDITORIAL OFFICE
Opole University ul. kard. B. Kominka 6, 45-032 OPOLE
phone +48 77 455 91 49 email: [email protected], [email protected]
http://tchie.uni.opole.pl
LAYOUT
Zdzisława Tasarz
Lucyna Żyła
Aleksander Zaremba
COVER DESIGN
Marian Wojewoda
Printing house: „Drukarnia Smolarski”, Józef Smolarski ul. Sandomierska 1, 45-326 Opole
Objętość: ark. wyd. 10,26, ark. druk. 8 Nakład: 350 egz. + 5 nadb. aut.