Draft - University of Toronto T-Space€¦ · Draft 24 studies of the impacts of fireworks. These...
88
Draft Review on physicochemical properties of pollutants released from fireworks: environmental and health effects and preventions Journal: Environmental Reviews Manuscript ID er-2017-0063.R1 Manuscript Type: Review Date Submitted by the Author: 14-Nov-2017 Complete List of Authors: Cao, Xinyuan; The Northeast Institute of Geography and Agroecology, Chinese Academy of Sciences, Regional Atmospheric Environment Zhang, Xuelei; The Northeast Institute of Geography and Agroecology, Chinese Academy of Sciences, Regional Atmospheric Environment Daniel, Q.Tong; Center for Spatial Information Science and Systems, George Mason University Chen, Weiwei; The Northeast Institute of Geography and Agroecology, Chinese Academy of Sciences, Regional Atmospheric Environment Zhang, Shichun; The Northeast Institute of Geography and Agroecology, Chinese Academy of Sciences, Regional Atmospheric Environment Zhao, Hongmei; The Northeast Institute of Geography and Agroecology, Chinese Academy of Sciences, Regional Atmospheric Environment Xiu, Aijun; The Northeast Institute of Geography and Agroecology, Chinese Academy of Sciences, Regional Atmospheric Environment Keyword: Fireworks, Atmospheric pollutants, Physicochemical characteristics, Environmental effects, Management and preventation https://mc06.manuscriptcentral.com/er-pubs Environmental Reviews
Transcript of Draft - University of Toronto T-Space€¦ · Draft 24 studies of the impacts of fireworks. These...

Draft
Review on physicochemical properties of pollutants
released from fireworks: environmental and health effects
and preventions
Journal: Environmental Reviews
Manuscript ID er-2017-0063.R1
Manuscript Type: Review
Date Submitted by the Author: 14-Nov-2017
Complete List of Authors: Cao, Xinyuan; The Northeast Institute of Geography and Agroecology,
Chinese Academy of Sciences, Regional Atmospheric Environment Zhang, Xuelei; The Northeast Institute of Geography and Agroecology, Chinese Academy of Sciences, Regional Atmospheric Environment Daniel, Q.Tong; Center for Spatial Information Science and Systems, George Mason University Chen, Weiwei; The Northeast Institute of Geography and Agroecology, Chinese Academy of Sciences, Regional Atmospheric Environment Zhang, Shichun; The Northeast Institute of Geography and Agroecology, Chinese Academy of Sciences, Regional Atmospheric Environment Zhao, Hongmei; The Northeast Institute of Geography and Agroecology, Chinese Academy of Sciences, Regional Atmospheric Environment Xiu, Aijun; The Northeast Institute of Geography and Agroecology, Chinese
Academy of Sciences, Regional Atmospheric Environment
Keyword: Fireworks, Atmospheric pollutants, Physicochemical characteristics, Environmental effects, Management and preventation
https://mc06.manuscriptcentral.com/er-pubs
Environmental Reviews
Draft
Review on physicochemical properties of pollutants released from 1
fireworks: environmental and health effects and preventions 2
Xinyuan Cao, Xuelei Zhang, Daniel Q.Tong, Weiwei Chen, Shichun Zhang, Hongmei 3
Zhao, and Aijun Xiu 4
5
Xinyuan Cao. Key Laboratory of Wetland Ecology and Environment, Northeast Institute of Geography and 6
Agroecology, Chinese Academy of Sciences, Changchun 130102, China; University of Chinese Academy of 7
Sciences, Beijing, 100049, China. 8
Xuelei Zhang. Key Laboratory of Wetland Ecology and Environment, Northeast Institute of Geography and 9
Agroecology, Chinese Academy of Sciences, Changchun 130102, China; Center for Spatial Information Science and 10
Systems, George Mason University, Fairfax, VA 22030, USA. 11
Daniel Q.Tong. Center for Spatial Information Science and Systems, George Mason University, Fairfax, VA 22030, 12
USA; U.S. NOAA Air Resources Laboratory, College Park, MD 20740, USA. 13
Weiwei Chen, Shichun Zhang, Hongmei Zhao and Aijun Xiu. Key Laboratory of Wetland Ecology and 14
Environment, Northeast Institute of Geography and Agroecology, Chinese Academy of Sciences, Changchun 15
130102, China. 16
Corresponding author: Xuelei Zhang (e-mail: [email protected]) 17
18
Abstract 19
The pollutants released from fireworks may seriously deteriorate air quality and 20
adversely impact on human health. In order to aid in obtaining comprehensive 21
observations and in the establishment of effective legislation aimed at controlling the 22
short-term effects of fireworks, we systematically reviewed the findings of previous 23
Page 1 of 87
https://mc06.manuscriptcentral.com/er-pubs
Environmental Reviews

Draft
studies of the impacts of fireworks. These studies, primarily located in Asia (more than 24
70% studies), Europe and North America, considered particle concentrations, size 25
distribution, morphology, noise and chemical composition (including water-soluble ions, 26
elements, carbonaceous material, organic matter and trace gases), along with the 27
associated human health effects during fireworks display. 41% studies suggested that 28
the concentrations of firework particles were reported to be 1 - 5 times higher than the 29
respective background values. And the mean ratios PM10/TSP, PM2.5/PM10 and 30
PM1.0/PM2.5 were 0.64, 0.72 and 0.65, respectively. During festivals, the 31
concentrations of SO42- and K+ were the highest of the water-soluble ions. For major 32
elements and gaseous pollutants, K, S and CO, SO2 had the highest concentrations, 33
respectively. The health effects of particles and gaseous pollutants, including metals, 34
emitted from fireworks need further epidemiological study to aid in the prevention of 35
health problems and the treatment of patients. Fireworks industries should technical 36
innovation to reduce pollutants emissions. Emissions inventories of fireworks display 37
should be compiled and used in Eulerian models, to forecast the spatiotemporal 38
distribution of pollutants and to further assistant the government in establishing 39
appropriate restriction levels and legislation which balance environmental protection 40
and festive spirit. 41
Key words: fireworks, atmospheric pollutants, physicochemical characteristics, 42
environmental effects, management and prevention 43
44
1 Introduction 45
Page 2 of 87
https://mc06.manuscriptcentral.com/er-pubs
Environmental Reviews
Draft
Fireworks are generally used to celebrate special events like festivals and/or 46
official celebrations, and thus become one of the most unusual sources of air pollution. 47
Traditional festivals which are characterized by the burning of fireworks include 48
Independence Day in the US (Wang et al. 2012), France's Commemoration of the 49
French Revolution (Bastille day in France), the Las Fallas in Spain (Moreno et al. 2007), 50
the Lantern Festival and Spring Festival in China (Wang et al. 2007; Tian et al. 2014 ), 51
Diwali Festival in India (Prakash et al. 2013), Guy Fawkes Day (or Bonfire Night) in the 52
UK (Agus et al. 2008), and New Year's Eve celebrations across the world (Drewnick et 53
al. 2006; Burkart et al. 2010; Licudine et al. 2011; Kwasny et al. 2009). Some typical 54
official celebrations include the Busan Culture in Korea (Shon et al. 2015), the 55
Millennium celebrated in Germany (Wehner et al. 2000), the celebration of the 2006 56
FIFA World Cup Championship in Italy (Vecchi et al. 2008) and the International 57
Fireworks Competition in Canada (Joly et al. 2010). 58
Apart from the excitement of continuous and spectacular firework displays, and the 59
visual feast of colorful lights in the sky, the burning of fireworks is a source of noise and 60
atmospheric pollutants. Fireworks have variable and heterogeneous chemical 61
compositions. Normally, fireworks contain chemicals such as sodium oxalate, charcoal, 62
sulfur, manganese, aluminum, iron, potassium chlorate, potassium perchlorate, 63
strontium nitrate, potassium nitrates and barium nitrate, etc. (Mclain 1980; Ravindra et 64
al. 2003; Wang et al. 2007). In order to enhance display effects, specific elements are 65
also added into pellets of fuel, such as strontium (Sr), copper (Cu), iron (Fe), Barium 66
(Ba), etc. Ignited fireworks in the air release gaseous and ambient particulate pollutants 67
Page 3 of 87
https://mc06.manuscriptcentral.com/er-pubs
Environmental Reviews

Draft
like carbon monoxide, nitrogen oxide, sulfur dioxide, suspended particles, 68
water-soluble ions and trace metals. The burning of fireworks may release dense 69
clouds of smoke, often degrading regional air quality to the detriment of human health 70
and the ecological environment (Clark 1997; Vecchi et al. 2008). As surface water can 71
be polluted by the deposited heavy metals from fireworks, they may also cause 72
extensive damage to vegetation. Moreover, human health, especially mortality and 73
morbidity, can also be affected by pollutants released from firework burning. 74
Due to these issues, recently the pollution caused by fireworks burning has 75
received much attention amongst the scientific community. Verma et al. (2014) 76
reviewed existing studies focusing on the effects of fireworks on air quality during the 77
Diwali festival in India, in an effort to summarize the pollution characteristics in terms of 78
their chemical components and related health effects. Another review paper focused on 79
the environmental effects of perchlorate emitted from the burning of fireworks, and 80
identified fireworks as one of the main contributors to increasing environmental 81
perchlorate contamination (Sijimol and Mohan 2014). To date, we still know little about 82
the pollution characteristics of other chemical components and the emissions from 83
fireworks in other festivals across the world. Therefore, we have conducted a 84
systematic review of past research results, focusing on emitted concentrations of 85
pollutant gases, physical and chemical characteristics of particulate pollutants, the 86
effects on human health, and the emissions levels and significance of different 87
governmental policies towards fireworks across the world. 88
In the regions suffering severe air pollution, some local governments have 89
Page 4 of 87
https://mc06.manuscriptcentral.com/er-pubs
Environmental Reviews
Draft
forbidden the burning of fireworks for festivals: for example in North Carolina (USA), 90
and Guangzhou, Shenzhen, Nanjing, Wuhan and Changchun (China). Some cities 91
have restricted firework use in their surrounding areas. Here we examine the best 92
policies that balance environmental protection and continuity of traditional culture. 93
94
2 Methodology 95
2.1 Method of analysis and synthesis 96
We conducted a comprehensive search of available literature (published before 97
June 2016) on pollutants from fireworks and their ecological and health effects, 98
considering atmospheric environmental, toxicological, epidemiological and human 99
exposure studies. The search tools of Google scholar, PubMed and China National 100
Knowledge Infrastructure (CNKI) were used in this study. The search terms included 101
various combinations of firework”, “firecracker”, “cracker”, “sparkler”, “festival”, “holiday”, 102
“celebration”, “pollution”, “air quality”, “aerosol”, “component”, “size”, “concentration”, 103
“particulate”, “particle”, “PM”, “gas”, “metal”, “ion”, “health” and “effect”. 104
When more than one paper addressed analyses of the same or a similar dataset, 105
we presented all of them in the summary tables, but considered only the most 106
comprehensive or most recent published paper in our study. For example, both Liu et al. 107
(2014) and Zhao et al. (2014) studied ambient particle concentrations affected by 108
firework displays during the Spring Festival in China, but the later paper was referred in 109
our study due to its more detailed analysis of different sizes of particulates. Both Kong 110
et al. (2015) and Li et al. (2008) studied the water-soluble ions emitted from crackers 111
Page 5 of 87
https://mc06.manuscriptcentral.com/er-pubs
Environmental Reviews

Draft
during the Chinese New Year, but only the latest paper was referred in this study. 112
A total of 145 studies matched the search criteria and were included for further 113
statistical analyses. All references were further classified according to their study period, 114
geographical location, festival, pollutant type and chemical components. Further details 115
are summarized in supplement database of fireworks references. 116
117
2.2 Statistics of published literature 118
2.2.1 Temporal and spatial patterns of publications 119
There are over 140 papers concerning particle emissions from fireworks during 120
festivals and celebration events since 1995. From 1995 to 2005, there was no more 121
than one paper per year was published, showing that people paid little attention to the 122
atmospheric pollution caused by fireworks. Since the year 2006, the frequency of 123
relevant studies has increased year by year to about 20 papers per year during 2012 - 124
2014 (Figure 1a). Thus, it is timely to conduct a systematic review of pollutant 125
emissions from fireworks to enhance our knowledge of the environmental and health 126
effects of fireworks. 127
Figure 1b illustrates the spatial distribution of the published literature, revealing 128
that 70 percent of studies were carried out in China and India, which have higher 129
population densities and poor air quality. The other 30 percent were located in Europe 130
(Spain, Germany and UK) and America (the USA and Canada). 131
132
2.2.2 Festivals studied in previous publications 133
Page 6 of 87
https://mc06.manuscriptcentral.com/er-pubs
Environmental Reviews

Draft
A total of 18 festivals and celebration events were studied in previous publications 134
(Figure 2a). The New Year on January 1st of every year is celebrated in many countries 135
with fireworks, bonfires and sparkler displays during the days before and after New 136
Year’s Eve. Fireworks are used as a means of praying for luck and happiness. In China, 137
Spring Festival, Lantern Festival and New Year are the most mentioned festivals 138
(Figure 2b). The Spring Festival, on the Chinese lunar January 1st, is the most 139
important festival celebrated across the whole country. All family members get together 140
on this day, similarly to Christmas in Western countries. They eat dumplings together 141
and celebrate the new year by burning fireworks on the New Year’s Eve, the following 142
first day of the lunar year and the fifth day of the lunar year. The Lantern Festival is 143
another important traditional Chinese festival celebrated on the fifteenth day of the 144
lunar year in the Chinese calendar. It is a mark of the final day in the Chinese New Year 145
celebrations. During the Lantern Festival, people go out at night to enjoy the sight of 146
lanterns and fireworks displays. 147
The most important festivals in India (in published papers) are Diwali and Vishu 148
(Figure 2c). Diwali is a festival of light, celebrated with great enthusiasm throughout 149
India during the month of October or November and is the biggest and the brightest of 150
Indian festivals (Barman et al. 2008; Ambade et al. 2013). Vishu is another major 151
festival celebrated in parts of the adjoining state of Tamil Nadu and throughout the state 152
of Kerala during the first day of Medam, in the Malayalam calendar, which usually falls 153
during the months of April or May. This happens to coincide the beginning of the 154
Page 7 of 87
https://mc06.manuscriptcentral.com/er-pubs
Environmental Reviews
Draft
Malayalam New Year. It is celebrated irrespective of creed, religion or caste all over the 155
State (Nishanth et al. 2012). 156
In the USA, Independence Day is celebrated with centralized and intensive 157
fireworks displays on the 4th of July (Moreno et al. 2007) (Figure 2e). Las Fallas is a 158
traditional celebration held in commemoration of Saint Joseph in the city of Valencia, in 159
Spain, and also in Germany (Figure 2d). The term Fallas refers to both the celebration 160
and the monuments burnt during the celebration. A number of towns in the Valencian 161
Community have similar celebrations inspired by the original Fallas de Valencia 162
celebration. 163
Four specific celebration events have also been addressed in former studies. They 164
are the Olympic Games, the World Cup, the Millennium and the Busan National 165
Fireworks Competition. 166
Among these previous publications, the Spring Festival and Diwali are the most 167
studied festivals. 168
169
2.2.3 Geographic distribution of studied firework events 170
Fireworks displays studied in the 145 reviewed articles occurred in 67 cities 171
distributed across 14 countries. As depicted in Figure 3 (red stars), the studied cities 172
were mainly located in Asia (India, China, Korea and Iran), Europe (Spain, Malta, 173
Germany, the UK, Switzerland, Austria, Hungary and Italy) and North America (the USA 174
and Canada). 175
In particular, there were 24 and 18 cities with studies on the effects of fireworks in 176
Page 8 of 87
https://mc06.manuscriptcentral.com/er-pubs
Environmental Reviews
Draft
China and India, respectively. Most of the studies in China were located in eastern 177
China which has 73 percent of the resident population and a more advanced economy. 178
In the areas of Sinkiang and Tibet in western China, there were no studies on the 179
effects of fireworks. The geographical distribution within the territory of India is more 180
uniform. The states located in western and northeastern India, such as Gujarat, Bihar 181
and Jharkhand, should pay more attention to fireworks pollution. 182
In European countries, the Nordic regions closer to the Arctic have a cleaner 183
atmospheric background than the rest of Europe and are ideal places to study the 184
environmental effects of fireworks. Unfortunately, no studies were reported from this 185
region. Throughout North America, only five cities (4 from the USA, 1 from the Canada) 186
have studied on the emission characteristics and effects of fireworks. However, as the 187
largest fireworks consuming country, more works should be conducted in the USA to 188
protect the domestic environment and residential health. There were limited studies 189
from South America and Africa. 190
Figure 3 (yellow circles) also illustrates firework-related injuries studied during 191
fireworks burning. The studied countries were also mainly in Asia (India, China, Iran 192
and Israel), Europe (the UK, France, Denmark, Northern Ireland, Sweden, Norway, 193
Austria and Hungary) and America (the USA). Other countries like Australia, New 194
Zealand and South Africa also had studies on injuries resulting from fireworks. Overall, 195
50 percent of studies on firework-related injuries were located in Europe. 196
197
2.3 Data quality control assurance 198
Page 9 of 87
https://mc06.manuscriptcentral.com/er-pubs
Environmental Reviews

Draft
Only two research papers focused on condition-controlled pure fireworks 199
emissions in laboratory experiments (Perry et al. 1999; Betha et al. 2014). The majority 200
of reviewed data are obtained from outside monitoring. As well-known that bonfires and 201
biomass burning activities are always simultaneously conducted during the fireworks 202
display time in festival days. Moreover, due to the close distance between the 203
measurement sites to the street or residential areas, a significant influence from local 204
traffic and human beings on the measurements can be expected (Liu et al. 2014). Thus, 205
we must keep in mind that all reviewed physiochemical data in this paper are including 206
the background emissions from biomass burning and other anthropogenic sources. 207
208
3 Physical characteristics of pollutants emitted from fireworks 209
3.1 Emission strength and ambient concentration 210
Emissions of particles depended on the quantity of fireworks burnt, frequency of 211
burning, type of fireworks and quality of fireworks (Majumdar et al. 2011). Concentration 212
is a physical property quantifying the abundance of particles per unit volume of air, 213
normally expressed as the mass or number concentration. Most of the studies included 214
in this review adopted filter sampling methods to obtain the mass concentration and 215
reported the particle concentrations based on the normal aerosol size classification (i.e. 216
TSP, PM10, PM2.5 and PM1.0). Sixty out of the 145 included studies mentioned one or 217
more concentrations of TSP, PM10, PM2.5, PM1.0, and even the ratios among them, from 218
fireworks. In this section, we want to state the relative pollution intensity due to 219
fireworks in different countries, by comparing concentrations in different size bins. 220
Page 10 of 87
https://mc06.manuscriptcentral.com/er-pubs
Environmental Reviews
Draft
Furthermore, in order to assess the contribution of fireworks to regional atmospheric 221
pollution, further comparisons between particle concentrations during fireworks burning 222
and background conditions (the pre-festival days or/and post-festival days) were also 223
conducted. This section will be organized following the sequence of aerosol size 224
divisions from the coarse to fine fractions. 225
The results from 10 previous studies reporting the concentrations of TSP from 3 226
countries (China, India and Germany) during different festivals or events are 227
summarized in Table 1. However, these studies only covered 8 cities. The highest 228
concentration of TSP observed during fireworks burning was 39800 µg/m3 before the 229
year 1994 in China (Sun et al. 1995). The reasonable explanation for this abnormally 230
high value is that the authors only monitored one location for a very short time (50 231
minutes from 23:40 to 00:30 on New Year’s Eve) during the highest emission intensity 232
of fireworks. Another reason is that the Chinese government had not banned fireworks 233
during festivals, and cheap, poor quality sparklers were available for sale before 1994. 234
The mean concentration of TSP during fireworks events was 489.6 µg/m3, with a range 235
from 330.5 µg/m3 to 670.8 µg/m3 in China and India. An exceptional study from Wehner 236
et al. (2000) only reported 40.5 µg/m3 of TSP during the celebration of the Millennium in 237
Germany which has a lower population density compared to China and India. The 238
mean mass concentrations of particles during festivals were 1.05 - 2.84 times higher 239
than those of the background values (459 µg/m3 vs. 437 µg/m3 in Lanzhou and 670.8 240
µg/m3 vs. 235.9 µg/m3 in Jhansi). Only one paper monitored the number concentration 241
of TSP, which was 1.2×10⁵ particles/cm3 during the Diwali festival, which was almost 242
Page 11 of 87
https://mc06.manuscriptcentral.com/er-pubs
Environmental Reviews

Draft
1.6 times higher than the concentrations before and after Diwali Festival. 243
Another important particle size fraction emitted from fireworks is PM10. Results of 244
PM10 concentrations during different firework events were compiled in Table 2, 245
revealing that the highest mean concentration of PM10 was 2237.3 µg/m3 in Salkia (a 246
slum in Howrah, India) during Diwali Festival (Thakur et al. 2010). This value was 247
almost 110 times higher than the lowest mean concentration of PM10 of 20.5 µg/m3 248
reported in Malta (Camilleri et al. 2010). The highest background concentration of PM10 249
was also observed in Salkia, at 538 µg/m3, which is even higher than the concentration 250
in the capital city of Delhi (122.1 µg/m3 - 167.8 µg/m3). Although Malta has the lowest 251
concentration, this study also concluded that fireworks play a remarkable negative 252
effect on air quality, especially with respect to PM10, during the summer-long religious 253
Feast festival (Camilleri et al. 2010). The mean concentration of PM10 during festivals 254
was 218.4 µg/m3, ranging from 25.4 µg/m3 to 469.3 µg/m3 in China. The mean value 255
was 479.8 µg/m3, ranging from 46 µg/m3 to 2237.3 µg/m3 in India, more than 4 times 256
than the National Ambient Air Quality Standard of PM10 (100 µg/m3) in India (Verma et 257
al. 2014). Furthermore, the mass concentration of PM10 during festivals was about 1.5 258
times and 2.3 - 4.2 times than that on non-festival days in China and India, respectively. 259
The difference in concentration, of more than a factor of 2, between China and India 260
may reflect in the different management policies on fireworks burning. Only two papers 261
mentioned the concentration of PM10 in European countries (Spain and Italy), where 262
the mean PM10 concentration was only 71.5 µg/m3 and ranging from 63.9 µg/m3 - 79 263
µg/m3; this is 1.4 times higher than the PM10 concentration (50 µg/m3) accepted by the 264
Page 12 of 87
https://mc06.manuscriptcentral.com/er-pubs
Environmental Reviews

Draft
Air Quality Standard of the European Union. 265
The finer size fraction of PM2.5 means it is harder to scavenge and has a longer 266
residence time in the atmosphere. It can also travel deep into the lungs, causing 267
damage to the human respiratory system. Therefore, greater attention needs to be paid 268
to the concentrations of PM2.5 released from fireworks (Table 3). The highest mean 269
mass concentration of PM2.5 shown in Table 3 was 6378.6 µg/m3 during the 270
international fireworks competition, 212 times higher than the standard for PM2.5 (30 271
µg/m3) in Canada (Raizenne et al. 2003). This was the result of nine 40-minute 272
fireworks displays from June to July (Joly et al. 2010). The mean concentration of PM2.5 273
was 516.1 µg/m3 (ranging from 61 µg/m3 to 6378.6 µg/m3) among 6 countries 274
comprising China, India, Canada, the USA, Spain and Germany. These countries 275
reported PM2.5 levels 1 - 4 times higher than the background concentration during 276
non-firework days. Meanwhile, the lowest mean PM2.5 concentration, of 61 µg/m3, 277
occurred in the USA and was as attributed to the greater distance between the 278
monitoring site and the fireworks burning locations (Seidel et al. 2015). However, only 279
one paper monitored the number concentration of PM2.5, in Nagpur (India) during 280
fireworks events, where the mean PM2.5 was nearly 4.5×10⁶ particles/L: 3 - 4 times 281
higher than the background values (pre-days and post-days). A similar result was 282
reported by Majumdar et al. (2011), who also monitored the number concentrations of 283
PM1 during a fireworks display in Nagpur. During this event, the mean number 284
concentration of PM0.25-1.0 was 4,451,136 particles/L and the maximum was 8,957,897 285
particles/L. The mean number concentrations exceeded 3 times and 5 times than those 286
Page 13 of 87
https://mc06.manuscriptcentral.com/er-pubs
Environmental Reviews

Draft
in the periods before and after the event, respectively. 287
The ratios of TSP、PM10、PM2.5、PM1.0 were further analyzed in this section to 288
evaluate the size enrichment characteristics of particles emitted from fireworks. Results 289
for the different ratios of particles at each studied festival are listed in Table 4. Among 290
the compiled studies, 64% (range 38% - 86%) of the TSP (by mass) was distributed in 291
PM10. Therefore, over half of the total suspended particulate was PM10. Most of the 292
previous studies focused on the ratio between PM2.5 and PM10 (Wang et al. 2007; Xu et 293
al. 2006; Wang et al. 2014; He et al. 2014; Han et al. 2014; Shi et al. 2014; Lin et al. 294
2014; Nirmalker et al. 2013; Srivastava et al. 2015; Thakur et al. 2010). The mean ratio 295
between PM2.5 and PM10 was 0.72 (ranging from 0.60 to 0.76), indicating that the main 296
aerosol emissions from fireworks are fine particles (Huang et al. 2012). Three papers 297
studied the mass concentration ratio between PM1.0 and PM2.5 and found a mean ratio 298
of about 0.65. Only one paper reported the ratio between PM1.0 and PM2.5 in number 299
concentration, finding it to be 0.99, which means that the number percentage of 300
PM1.0-2.5 was only 1%. This further supports the findings that most particle sizes are 301
smaller than 1 µm, consistent with the conclusions of Section 3.3. 302
303
3.2 Size distribution 304
Ten papers studied the size distribution of particles emitted from fireworks, most of 305
which were published after the year 2010. Study areas were located in China 306
(Shanghai, Lanzhou and Nanjing), India (Delhi and Nagpur), Germany (Leipzgi) and 307
Spain (Alicante). 308
Page 14 of 87
https://mc06.manuscriptcentral.com/er-pubs
Environmental Reviews

Draft
In order to help scholars to better conduct future monitoring of the size distribution 309
of particles from fireworks, we firstly summarized the sampling instruments and their 310
specific models along with their output data types in Table 5. Based on their working 311
principle, the instruments were divided into 2 types, either aerosol multi-stage sampler 312
or online particle size spectrometer. The Anderson (8-stages) and DLPI (13-stages) 313
were the most widely used filter samplers in aerosol multi-stage sampling, and the 314
reported data were mass concentrations (M) of particles or elements in different size 315
bins. 316
The online particle size spectrometers are instruments capable of real-time 317
analysis of size distributions (the number size (N), surface size (S) and volume size (V)) 318
of particles ranging in size from nanometer to micrometer. Their high reliability, 319
long-term stability and performance characteristics make them suitable for long-term 320
monitoring of firework particles at atmospheric research stations. Instruments 321
combining a Differential Mobility Analyzer (DMA) and Condensation Particle Counters 322
(CPC), termed a twin differential mobility particle sizer (TDMPS) by the Leibniz Institute 323
for Tropospheric Research or so-called scanning mobility particle sizer (SMPS) by 324
GRIMM Corporation, are used to continuously measure the mobility size distributions of 325
ultrafine and fine particles. The SMPS systems from TSI Corporation, GRIMM 326
Corporation and MSP Corporation were most used in studies of online monitoring size 327
distribution of particles emitted from fireworks (Wehner et al. 2000; Remškar et al. 2014; 328
Jing et al. 2014; Joshi et al. 2015; Wang et al. 2014). More detailed comparisons of 329
different products from the above 3 corporations were provided by Watson et al. (2011), 330
Page 15 of 87
https://mc06.manuscriptcentral.com/er-pubs
Environmental Reviews
Draft
who reported differences of about 25 percent between instruments due to differences in 331
particle charging efficiency. Only one paper adopted the APS (a double-crest optical 332
particle sizer) with sub-micrometer bottom limit to study the size distribution of fireworks 333
(Zhao et al. 2012). ELPI can be used for real-time particle charge distribution and for 334
gravimetric impactor measurements. Another advantage of the impactor technology is 335
that it also enables post-measurement chemical analysis of size-classified 336
particles. This enhances our knowledge of the size distribution of enriched or toxic 337
elements, e.g. K, S, Cu and Ca (Crespo et al. 2012) and Ba (Khaparde et al. 2012), 338
thereby providing data that are useful for protection human health. The size-resolved, 339
non-refractory chemical composition of the sub-micron aerosol particles combined with 340
time-related mass concentrations can also be measured with an aerosol time-of-flight 341
mass spectrometer (ATOFMS) during fireworks in festivals or celebration events (Liu et 342
al. 1997; Drewnick et al. 2006). 343
In Figure 4, we further summarized and compared the same size attributes from 344
different studies on identical axes to capture the key characteristic of spectral size 345
distributions. This clearly shows that the number concentrations of particles were high 346
in the submicrometer size fraction, with a dominant peak located around 100 nm. The 347
six studies were conducted on Feb 3rd 2011 (Spring Festival), Nov 13th 2012 (at 50 m 348
height on a high rise building), Jan 1st 2000 (Millennium), Jan 22nd 2012 (Spring 349
Festival), New Year and Feb 10th 2013 (Spring Festival), respectively. Time periods of 350
0:00-1:00 or 0:00-4:00 were chosen to represent the effects of fireworks. It is also 351
evident in Figure 4a that an accumulation mode between around 1 µm and 3 µm was 352
Page 16 of 87
https://mc06.manuscriptcentral.com/er-pubs
Environmental Reviews

Draft
present in addition to the main peak. The volume size distribution is shown in Figure 4b. 353
Wehner et al. (2000) selected volume size distributions to highlight the increasing finer 354
particle volume in the size range of 3 nm - 800 nm during the Millennium firework 355
displays. Another study from Zhao et al. (2012) reported a clearly bimodal lognormal 356
volume size distribution of particles during the time period of concentrated fireworks 357
burning. The authors explained the dominant peak in coarse particles (centered at 5 - 6 358
µm) as the small distance (only 10 meters) between the instrument and burning 359
location, leading to the presence of undeposited coarse particles from the launch 360
process, and resuspension of road dust. However, more studies need to be conducted 361
to further verify this viewpoint. 362
Figure 4c and 4d compare time series of number size distributions of graded 363
particles from the only two relevant papers. The two studies were conducted in 364
Shanghai and Nanjing during the Spring Festival in 2009 and 2012, respectively. Wang 365
et al. (2011) monitored 12 size distributions of particles emitted from fireworks; Wang et 366
al. (2014) measured the size distribution of aerosol particles in 7 size intervals, which 367
were 10 - 30 nm, 30 - 50 nm, 50 - 100 nm, 100 - 200 nm, 200 - 500 nm, 500 - 1000 nm 368
and 1 - 10 µm. In order to facilitate the comparison between the two studies, we picked 369
out the data for size diameters of 60 nm, 170 nm, 400 nm, 650 nm and 6800 nm 370
reported by Wang et al. (2011) which lay close to the size intervals in Wang et al. (2014). 371
The main features of Figure 4c and Figure 4d are that particles with diameters of 30 - 372
50 nm, 50 - 100 nm and 100 - 200 nm had the highest number concentrations, followed 373
by 200 - 500 nm particles. Particles with diameters of 500 - 1000 nm had moderate 374
Page 17 of 87
https://mc06.manuscriptcentral.com/er-pubs
Environmental Reviews

Draft
number concentrations. These characteristics persisted throughout the events. The 375
coarser particles (> 1 µm) had the lowest number concentrations and stronger temporal 376
variability. The highest number concentration of finer particles reached 10000 cm-3. 377
These studies demonstrated that fireworks can contribute fine particles (around 30 - 378
500 nm) into our atmospheric environment. 379
What is the relationship between chemical elements and particulate sizes? Only 380
two papers focused on this issue: Crespo et al. (2012) and Khaparde et al. (2012). 381
Crespo et al. (2012) measured the aerosol elemental mass-size distributions of K, S, 382
Cu and Ca both during the Mascletà and background days using a 12-stages cascade 383
low pressure impactor (SDI). The mass size distributions of K and S, which are 384
presented as typical gunpowder elements of fireworks, were characterized by 3-modes. 385
Two equivalent dominant peaks were centered at 200 nm and 700 nm during the 386
Mascletà. Meanwhile, on the background day, both the mass size distributions of K and 387
S showed single primary peaks centered on 3 µm and 200 nm, respectively. The 388
element Cu emitted from fireworks is harmful to human health, and shows a similar to 389
the patterns of K and S in the Mascletà. However, Cu tended to be concentrated in finer 390
particles (250 nm and 500 nm) in contrast to the background pattern dominated by 4 391
µm. The typical crustal element Ca, shown in Figure 5, displayed no obvious change of 392
mass size distribution between the Mascletà and background days; mass size 393
distributions on both days were enriched in sizes 2 - 4 µm. A three-peak-curve in the 394
size distribution of Ba was also observed during fireworks burning on Indian Diwali days 395
(Khaparde et al. 2012). Thus, there are still knowledge gaps regarding the mass 396
Page 18 of 87
https://mc06.manuscriptcentral.com/er-pubs
Environmental Reviews

Draft
concentrations of enriched elements / heavy metals and the size distributions of 397
particles released from fireworks. 398
399
3.3 Morphology 400
Only 6 studies have addressed the morphology of firework particles. To identify 401
and characterize individual particulate matters, scanning electron microscopy coupled 402
with energy dispersive X-ray spectrometer (SEM-EDX) has often been used (Witt et al. 403
2010; Agrawal et al. 2011). The morphology of particles before and after combustion is 404
shown in Figure 6. Particles emitted from fireworks have regular and irregular spherical 405
shapes (Agrawal et al. 2011; Azhagurajan et al. 2014). The spherical particles are 406
formed by high temperatures and are termed fly ash particles. Analysis revealed that 407
the spherical particles were mainly composed of Al, Fe, K and Sr emitted from fireworks 408
during festivals (Witt et al. 2010), providing further evidence that the higher 409
concentrations of Al, Fe, K and Sr result from high-temperature combustion during 410
fireworks burning (Li et al. 2013). 411
412
4 Chemical compositions 413
The main ingredient of fireworks is black powder, comprised primarily of charcoal 414
powder, potassium nitrate and potassium chlorate. To improve the visual impact, 415
aluminum, iron, antimony and inorganic salts are also added. When the fireworks are 416
burning, the sulfur, charcoal powder and metal powder rapidly combust with the 417
oxidizer and large amounts of heat and light are released. This produces carbonaceous 418
Page 19 of 87
https://mc06.manuscriptcentral.com/er-pubs
Environmental Reviews

Draft
gases containing nitrogen and sulfur, as well as numerous particles (such as metal 419
oxides) (Xu et al. 2006). In this part, we will exhaustive review the chemical 420
composition of fireworks according to water-soluble ions, custal elements and trace 421
metals, carbonaceous and organic matter and trace gas emitted from fireworks. 422
423
4.1 Water-soluble ions 424
Some 23 of the 145 included papers focused on the concentrations of 425
water-soluble ions in particles during festivals. Normally, ions in ambient pollutants 426
reach the Earth surface via wet deposition, when they can cause human health 427
problems and even enter into the hydrological cycle. Thus, chemical composition is a 428
critical aspect of the laboratory analysis of particles. A total of 13 water-soluble ions 429
were analyzed in 23 published papers, and comprise 5 cations (Na+, Mg2+, K+, Ca2+ and 430
NH4+) and 8 anions (F-, Cl-, ClO4
-, NO2-, NO3
-, SO32-, SO4
2- and CO32-). Only 8 papers 431
reported on NO2-, SO3
2-, and CO32-. An overall comparison of the concentrations of 13 432
reported water-soluble ions is illustrated in Figure 7. 433
The concentrations of SO42- and K+ were greatest during festivals, when they 434
reached 23 µg/m3 and 13 µg/m3, respectively. These levels are 38.3 times and 2.7 435
times higher than the concentrations on background days (Moreno et al. 2010; Kong et 436
al. 2015). This is because sulfur and potassium are the two major components in 437
fireworks, where they act as the main oxidizer in black powder (commonly in the form of 438
perchlorate or chlorate) during fireworks burning. The fireworks release SO2 which can 439
be rapidly converted to SO42- either by oxidation catalysed by metals or by 440
Page 20 of 87
https://mc06.manuscriptcentral.com/er-pubs
Environmental Reviews

Draft
photochemical oxidation (Cheng et al. 2014). The burning of potassium follows two 441
corresponding chemical reactions, which are 2KClO3=2KCl+3O2 and KClO4=KCl+2O2 442
(Tian et al. 2014). The concentrations of other water-soluble ions during festivals were 443
observed to decrease in the order CO32- > NO3
- > Cl- > NH+ > Ca2+ > Mg2+ > Na+ > 444
NO2- > SO3
2- > F-, indicating that the secondary aerosol components (including CO32-, 445
NO3-, NH4
+) also increased gradually and became major components during festival 446
days (Chatterjee et al. 2013). The mean concentrations of CO32-, NO3
-, NH4+ were 15 447
µg/m3, 14 µg/m3 and 8.7 µg/m3 during fireworks burning, respectively; the respective 448
ratios between fireworks displays and background days were 30.3, 2.2 and 4.0, which 449
can be used as indicators of fireworks burning. Furthermore, Cl- released by chlorate 450
and/or perchlorate (e.g. potassium chlorate) present in fireworks lead to an observed 451
average Cl- concentration of 11 µg/m3. 452
453
4.2 Crustal elements and trace metals 454
Specific elements are added to fireworks to enhance the visual impact and 455
ornamental effects (Grima et al. 2012). Sr, Ba, Sb, Pb, Na, K and Cu are effective in 456
producing red, yellow-green, light green, green, yellow, violet and blue fireworks, and it 457
is therefore unsurprised to find higher concentrations of these elements following 458
fireworks displays. Ca chlorides and sulphates are used to generate orange flames and 459
to deepen fireworks colors. Most fireworks use Zn to generate smoke. Mn and its 460
oxides are also used as a fuel and oxidizer to produce brighter lights (Swanepoel et al. 461
2010). K compounds in black powder mainly work as oxidation agents during burning, 462
Page 21 of 87
https://mc06.manuscriptcentral.com/er-pubs
Environmental Reviews

Draft
and Cr is a catalyst to increase burn rate (Do et al. 2012). As a metallic fuel, Mg plays 463
an important role in generating sparks and crackling stars. Al as also contributes part 464
the part of the fuel, sparks and glitter effects. More detailed information on these 465
aspects can be found in Table 2 of Martín-Alberca and García-Ruiz (2014). In total, 47 466
elements (Na, Mg, Al, Si, P, S, Cl, K, Ca, Ti, Fe, Zn, Ba, Pb, Cr, Sr, As, Mn, Cu, Cd, Li, 467
Ni, Co, Br, Rb, Se, Sn, Pt, B, W, Tl, Th, U, V, Bi, Be, Mo, Sb, Cs, Zr, Ge, Ga, La, Ce, Eu, 468
Y, Sc) had been analyzed in 32 previous published papers; these elements include the 469
crustal elements, trace elements and rare earth elements. We selected 18 470
frequently-used metals emitted from sparklers and classified them into 3 categories (K, 471
S, Ca, Al, Si, Mg, Na; Fe, Ba, Zn, Pb, Cu; Ti, Sr, Mn, Cr, As, Cd) to conduct further 472
quantitative comparisons between previous studies (Figure 8). 473
The concentrations of major elements during festivals were observed to decrease 474
in the order K > S > Ca > Al > Si > Mg > Fe > Na > Ba > Zn > Pb > Cu > Ti > Sr > Mn > 475
Cr > As. K and S had the highest average concentrations, which were 9637.3 ng/m3 476
and 9681.9 ng/m3, owing to the highest concentrations of K+ and SO42- ions. The high 477
concentration of K may be attributed to potassium salts like nitrates, chlorates and 478
perchlorates, which are the basic materials in firework manufacturing (Grima et al. 479
2012). Meanwhile, S is always used as propellant/fuel. Additionally, the crustal 480
elements Si, Al, Ca, Mg and Na were also present at high concentrations: those of Si, 481
Al and Ca were 4678.5 ng/m3, 2488.7 ng/m3 and 2481.9 ng/m3, respectively. These 482
elements are added to fireworks in powder form to increase the burning temperature 483
and darken the color. In the 27 studies which analyzed Cu, Zn, Fe, and their mean 484
Page 22 of 87
https://mc06.manuscriptcentral.com/er-pubs
Environmental Reviews
Draft
respective concentrations were 103.0 ng/m3, 511.3 ng/m3 and 1263.7 ng/m3. These 485
elements are used to create a blue color, smoke effect and sparks. Cd and As were 486
also found in the particles released from fireworks, at mean concentrations of 179.3 487
ng/m3 and 21.5 ng/m3, which are lower than those of the other selected elements in this 488
review. This suggests that Cd and As are impurities associated with the industrial 489
process of adding specific metals (such as Pb or Zn) into fireworks (Licudine et al. 490
2012). 491
It should be noted that emission sources besides fireworks also contributed to the 492
reported concentrations of elements. K was additionally emitted from biomass burning 493
during festivals; Fe is associates with Zn suggesting that pollution emissions, in 494
particular incineration and fossil fuel combustion, may contribute to Fe during fireworks 495
burning, in addition to crustal soil. A variety of pollution sources including coal 496
combustion (As, Zn, S), waste incinerators (Sb, Cd, Cr, Zn), motor vehicles incineration 497
(Pb) and sewage sludge incineration also influenced the results (Xu et al. 2006; Ye et al. 498
2010; Shon et al. 2015). All of above were the major emission sources of Pb, besides, 499
the high background lead content had higher contribution from cement, metallurgic and 500
oil combustion dust, motor vehicles incineration and soil dust (the possible secondary 501
source) (Wang et al. 2002; Zheng et al. 2004). In addition, the major source of As with 502
toxic was industrial waste gas except coal burning. And the average background 503
concentrations of carcinogens Pb, Ba, As were 192 ng/m3, 22 ng/m3 (ranged from 1 to 504
70 ng/m3) and 15 ng/m3 (ranged from 7 to 29 ng/m3), respectively (detailed information 505
is provided in elements concentrations of the supplemental database). These sources 506
Page 23 of 87
https://mc06.manuscriptcentral.com/er-pubs
Environmental Reviews

Draft
could contribute significantly to the loadings of the elements during fireworks burning 507
and it is difficult to separate these complex pollution sources from fireworks sources. 508
For the online measurement of chemical components in fireworks, a compact509
time of flight Aerosol Mass Spectrometer (cToF-AMS) was firstly apply to perfor510
m measurements of organic aerosols (OA), sulfate (SO42-), nitrate (NO3
-), ammon511
ium (NH4+) and chloride (Cl-) (Drewnick et al. 2005). A High Resolution Time of 512
Flight Chemical Ionization Mass Spectrometer (HR-ToF-CIMS) was also used to 513
measure gas phase concentrations, using iodide as a reagent (Lee et al. 2014; 514
Reyes-Villegas et al. 2017). Once the original data were online obtained the AM515
S data would be further were post-processed by using the Igor-based standard T516
oF-AMS Analysis Toolkit SQUIRREL and PIKA, available at http://cires1.colorado.517
edu/jimenez-group/ToFAMSResources/ToFSoftware/index.html (Faber et al. 2013; 518
Drewnick et al. 2015;Wang et al. 2016). 519
According to Drewnick et al. (2015), a number of metals (mainly the alkali metals) 520
Cd, Cs, Hg, K, Na, Rb, Se in group I and Al, Ba, Bi, In, Li, Mg, Pb, Te, Tl, Sn, Sr, Zn in 521
group II. Due to very high melting point of metal oxides, they can not be measured with 522
the AMS. Thus, theoretically, the added pure metals for colorful displays in fireworks 523
after incomplete combustion which is likely to vaporize slowly but can probably still be 524
measured with AMS (McGuire et al. 2011). These metals can be used as tracers of 525
fireworks. Several studies had validated that strontium (88Sr+), barium (138Ba+, 526
154BaO+) can be used to distinguish the fireworks particles by TOF-AMS (Liu et al. 527
1997; McGuire et al. 2011; Li et al. 2017). Although Li et al. (2017) also mentioned that 528
Page 24 of 87
https://mc06.manuscriptcentral.com/er-pubs
Environmental Reviews

Draft
more species of metals of lead (206/207/208Pb+), copper (63/65Cu+) and aluminum 529
(27Al+) could be classified as fireworks-metal particles, the application of these metals 530
as tracers of fireworks should cautious. Actually, the sources of Pb, Cu and Al were 531
various, including bonfires (Vassura et al. 2014), traffic, soil dust etc. (Wang et al. 2002; 532
Zheng et al. 2004). Moreover, Drewnick et al. (2006) mentioned that potassium 533
(39/41K+) can be used as tracers of fireworks. Thus, the single application of K+ for 534
tracing of fireworks will also be affected by bonfires and other biomass burning. 535
In conclusion, we strongly recommend that potassium (39/41K+), strontium (88Sr+), 536
barium (138Ba+, 154BaO+) and their combinatory are reprehensive tracers of fireworks 537
in data post-processing of TOF-MS. 538
539
4.3 Carbonaceous and organic matter 540
Among the 145 articles, 19 papers reported the concentrations of organic carbon 541
(OC), elemental carbon (EC) and polycyclic aromatic hydrocarbons (PAHs) in particles 542
during fireworks burning (Table 6). Carbonaceous particles are important components 543
in the chemical composition of fireworks. Twelve studies suggested that OC increased 544
significantly during the fireworks burning, and that the OC originated from the 545
combustion of black powder with added charcoal along with the burning of external 546
encysted shell. The mean concentration of OC was 32.1 µg/m3 (ranging from 5.1 µg/m3 547
to 80.4 µg/m3), which is 1.5 - 6.3 times higher than the background value (pre-festival, 548
post-festival or normal day). The burning of different types of fireworks, made variously 549
from colorful papers and wool or other fibers, also contributed significantly to OC in the 550
Page 25 of 87
https://mc06.manuscriptcentral.com/er-pubs
Environmental Reviews

Draft
atmosphere (Pachauri et al. 2013). Although EC only represented a small proportion of 551
the aerosol mass concentration, it contributed more to the aerosol extinction and had 552
significant radiative forcing effects (Huang et al. 2012). The mean concentration of 553
reported EC was 9.6 µg/m3 during fireworks burning, which is 1.1 - 15 times higher than 554
the background values. The particulate OC / EC ratio peaked during festivals (ranging 555
from 1.3 to 7.9), and has been adopted as an indicator of fireworks burning in 556
atmospheric monitoring (Feng et al. 2012). 557
Eleven studies reported the levels of organics, most notably PAHs (7 studies in all). 558
Sixteen PAHs including naphthalene (Nap), acenaphthylene (Acy), acenaphthene 559
(Ace), fluoranthene (Flu), phenanthrene (Phe), anthracene (Ant), fluorantene (Fluor), 560
pyrene (Pyr), benz[a]anthracene (BaA), Chrysene (Chry), benzo[b]fluoranthene (BbF), 561
benzo[k]fluoranthene (BkF), benzo[a]pyrene (BaP), indeno[cd]pyrene (IcdP), 562
dibenzo[ah]anthracene (DahA) and benzo[ghi]perylene (BghP) were measured in 563
previous studies (Li et al. 2009; Croteau et al. 2010; Sarkar et al. 2010; Feng et al. 2012; 564
Shi et al. 2014; Kong et al. 2015). The mean concentration of PAHs was 82.0 ng/m3 565
and showed no obvious change from the background value of 56.7 ng/m3 during 566
fireworks event. Therefore, it has been demonstrated by several studies that PAHs are 567
not directly sourced from fireworks burning; instead, emissions from cooking, industry 568
and vehicles might be the principal contributors to PAHs during festivals (Shi et al. 569
2014). Betha et al. (2014) used an experimental steel chamber to collect PM2.5 emitted 570
from sparklers, and quantified the PAHs in fine particles released from three commonly 571
used sparklers (low smoke sparklers (LSS), Colored sparklers (CS), Whistling 572
Page 26 of 87
https://mc06.manuscriptcentral.com/er-pubs
Environmental Reviews
Draft
sparklers (WS)). Levels of PAHs in particles emitted from LSS were found to be 573
relatively higher (by 2.6 - 3.4 times) compared to those from CS and WS. 574
Other kinds of organics were also measured in previous studies, including 575
secondary organic aerosol (SOA), hydrocarbon-like organic aerosol (HOA) and 576
oxygenated organic aerosol (HOA) (such as aliphatic compounds and derivatives, 577
halogenated aliphatic compounds, organic acids, alcohols/ketones, caprolactam, 578
chlorobenzenes, chlorophenols and dioxins) (Drewnick et al. 2006; Nishanth et al. 2012; 579
Schmid et al. 2014; Jiang et al. 2015). It was observed that the concentrations of 580
hexachlorobenzene, pentachlorophenol and PCDD/Fs during festivals were of the 581
order of 10 times above the background value (before or after festival events). This 582
indicated that the higher levels of organics found in the particles were associated with 583
the fireworks burning (Nishanth et al. 2012). 584
585
4.4 Trace gas emissions from fireworks 586
By acting as the major atmospheric constituents affecting solar and thermal 587
radiative transfer, trace gases (O3, NOx, CO, SO2, CH4, etc.) can impact the 588
atmospheric chemistry and climate (Pathak et al. 2013). In addition, these gaseous 589
pollutants from fireworks also affect human health (which will be further discussed in 590
Section 5.2). The concentrations of gaseous pollutants during festivals in previous 591
studies were systemically compiled in Table 7. Mean concentrations were found to 592
decrease in the order CO > SO2 > NO > NO2 > O3. 593
There were 29 studies focusing on gaseous pollutants emitted from fireworks 594
Page 27 of 87
https://mc06.manuscriptcentral.com/er-pubs
Environmental Reviews
Draft
during festivals or celebration events. Only 8 papers reported the concentrations of CO, 595
overall reporting an obvious increase in mean concentration from the background value 596
(pre and post days) of 264 µg/m3 to 1298.9 µg/m3 (5 times) during fireworks burning. 597
CO is usually a product of the incomplete combustion of carbon in fireworks (He et al. 598
2014). The mean concentration of SO2 was 217.6 µg/m3, some 9.2 times higher than 599
the background value (23.7 µg/m3). The reported highest concentration of SO2 was 600
3470 µg/m3 (before 1995) in China, which is almost 44 times higher than the average 601
value of reported concentrations from studies that excluded the above highest value 602
(78.4 µg/m3). This steep decline shows the effectiveness of the policy of banning 603
fireworks, as well as improvements in the quality of fireworks and adopting the correct 604
method of sampling. 605
The average concentrations of NO2 and NO during fireworks burning were 46.2 606
µg/m3 and 99.9 µg/m3, respectively. This was 1.3 times higher than the background 607
value for NO2 (34.6 µg/m3). Note that the peak concentrations of NO and NO2 also 608
reflected the contribution of traffic sources during fireworks burning. Meanwhile, the 609
concentration of O3 showed smooth variations during fireworks burning, and only one 610
study reported a notable increase, to 1.4 times higher than the background value (30 611
µg/m3) (Attri et al. 2001). 612
613
5 Environmental effects 614
5.1 Noise 615
The noise made by fireworks contributes to their festive character (Betha et al. 616
Page 28 of 87
https://mc06.manuscriptcentral.com/er-pubs
Environmental Reviews
Draft
2014), but also to noise pollution, and may be detrimental to human hearing. Seven of 617
the included 145 papers focused on noise quality during festivals, most of which took 618
place in commercial zones (expect Ambade et al. (2013) in a residential zone). The 619
mean noise level was 90 dB (92 dB in the daytime and 78 dB at night), which is 1.2 620
times higher than background value (78 dB) in commercial areas. The ambient noise 621
level was also above the permissible limit in China (60 dB in the daytime and 78 dB at 622
night), India (65 dB in the daytime and 55 dB at night) and Spain (30 dB) in commercial 623
areas (Sun et al. 1995; Mahecha et al. 2012). The mean ambient noise level in the 624
residential zone was 97 dB (ranging from 89 dB to105 dB) during Diwali but was 86 dB 625
(ranging from 72 dB to 98 dB) on normal days. Compared to Central Pollution Control 626
Board (CPCB) in India, it was 1.7 times higher than the noise level in residential areas 627
where the mean noise level was 50 dB (Mandal et al. 2012). These figures suggest that 628
there was a high noise pressure caused by fireworks burning during festivals, and that 629
firework designs need to be modified to avoid nose pollution (Lad et al. 2012). 630
631
5.2 Health effects 632
The health effects from fireworks during festivals can be divided into physical 633
explosion injuries (Berger et al. 1985) and chemical pollutants exposure (Gouder et al. 634
2014). The explosion of fireworks often causes extensive trauma and burns (to areas 635
such as skin, eyes and hands), and even noise-induced hearing loss (Brookhouser et al. 636
1992; van Kamp et al. 2005). Ocular firework injuries cover a wide spectrum of types 637
and degrees, with injuries ranging from intrusions to loss of the eye (Sacu et al. 2002). 638
Page 29 of 87
https://mc06.manuscriptcentral.com/er-pubs
Environmental Reviews

Draft
Chan et al. (2004) reported serious fireworks-related eye and adnexal injuries in 639
Northern Ireland. There have also been studies of these eye injuries in Denmark, with a 640
mean of 0.012 cases of eye lesions per ton of fireworks (Thygesen et al. 2000), and in 641
Sweden where 38% patients had permanent damage to the eyes (Sundelin et al. 2000). 642
Many males reported eyes injured by fireworks on New Year’s Eve until the year 2002 643
in Norway (Bull et al. 2011). There were also studies focused on ocular injuries due to 644
fireworks explosions in the United States (Walton et al. 1996; Wilson 1982; Canner et al. 645
2010; Tu and Granados 2015), UK (Knox et al. 2008), France (Marsal et al. 2010), 646
Austria (Sacu et al. 2002), New Zealand (Clarke et al. 1994), China (Wang et al. 2014), 647
India (Kumar et al. 2010; Elangovan et al. 2016) and Iran (Mansouri et al. 2007; Saadat 648
et al. 2010; Vaghardoost et al. 2013; Hatamabadi et al. 2013). These studies found that 649
over 80% patients were males and 70% patients were younger than 18 years, 650
indicating that ocular injuries resulting from fireworks are significantly a male and a 651
paediatric problem (Sundelin et al. 2000). Injuries to the hand, face and mouth were 652
also reported by clinical researchers (Dhir et al. 1991; Moore et al. 2000; Di Benedetto 653
et al. 2009; Al-Qattan and Al-Tamimi 2009). 654
The burning of fireworks may generate considerable amounts of sparks. These 655
sparks may drop on peoples’ clothes or combustible belongings, leading to a risk of 656
burns (Li et al. 2009). Noise pollution is another source of significant physical damage 657
caused by fireworks during festivals, leading to fatigue, increased psychological stress 658
(such as anxiety and depression), insomnia, raised cholesterol level and even the risk 659
of heart attacks. The most damaging result caused by fireworks was loss of hearing 660
Page 30 of 87
https://mc06.manuscriptcentral.com/er-pubs
Environmental Reviews
Draft
(Mandal et al. 2012; Mahecha et al. 2012). 661
Gaseous and particulate pollutants, including metals, emitted by fireworks are 662
expected to affect human health owing to their chemical properties (Ambade et al. 2013; 663
Baranyai et al. 2015). These pollutants may cause mobility and mortality, such as 664
respiratory and cardiovascular system diseases, cancer and even death (Curtis et al. 665
2006). The short-term health effects are mainly expressed as the inhalation of smoke 666
which contributes to coughs, fever and dyspnea, and even acute eosinophilic 667
pneumonia (AEP) (Hirai et al. 2000). Effects of PM10 emitted from fireworks were 668
reported to include acute lower respiratory symptoms (Hoek et al. 1998; Beig et al. 669
2013). Gouder et al. (2014) systematically reviewed the potential effect of fireworks on 670
asthma and chronic obstructive pulmonary disease (COPD). SO2 can be slowly 671
absorbed into fine particles and transported deeply into the lungs, thereby causing 672
long-term health effects. NO2 emitted from fireworks can generate biochemical 673
alterations and histological demonstrable lung damage leading to both acute and 674
chronic exposure (Bull et al. 2001; Ambade et al. 2013). The higher concentrations of 675
O3 and CO also may cause dyspnea (severe asthma) and lung diseases (such as 676
pneumonia) (Ganguly et al. 2009; Gouder et al. 2014). It has also been suggested that 677
elements like chlorine contained in fumes emitted by fireworks may cause mucosal 678
irritation and acute respiratory distress syndrome when inhaled into the respiratory 679
system (Babu et al. 2008). Health risks studies indicated that the carcinogenic potential 680
of whistling sparklers (WS) emissions were higher than it from low smoke sparklers and 681
colored sparklers and the carcinogenicity of emissions from WS was caused by metals 682
Page 31 of 87
https://mc06.manuscriptcentral.com/er-pubs
Environmental Reviews

Draft
(Betha et al. 2014). The metals in particles (such as Cd, Pb, Cr and Ni) have been 683
identified as human carcinogens and also have severe effects on asthmatics; they may 684
be associated with deaths caused by lung cancer (Verougstraete et al. 2003; Pearson 685
et al. 2005; Wang et al. 2006; Moreno et al. 2010). Only limited 4 papers focused on the 686
quantities evaluation for the health effects of heavy metals or PAHs in our compiled 687
database (Yang et al. 2014; Feng et al. 2016; Hamad et al. 2016; Harrison et al. 2017). 688
Heavy metals and polycyclic aromatic hydrocarbon (PAHs) in PM2.5 released from 689
fireworks burning can raise non-carcinogenic risks and cancer risks to human health 690
through the respiratory system and dermal contact. Here, we only calculated the 691
inhalation risks because of the highly uncertainty of dermal contact area from fireworks. 692
The average exposure amount of heavy metals from fireworks by inhalation (Dinh) for 693
children and adults in a given time frame could be calculated using Eq. (1): 694
D��� =������
��� (1) 695
where Dinh is the heavy metals exposure from inhalation, mg kg-1 day-1; C is heavy 696
metal concentration, mg m-3. InhR is inhalation rate, 20 and 7.6 m3 day-1 for adult and 697
children, respectively; EF is exposure frequency, 2.1 day year-1; ED is exposure 698
duration for year, 24 and 6 year for adult and children, respectively; BW is average 699
body weight, 70 and 15 kg for adult and children; AT is the averaging time, AT(days) = 700
ED × 365. 701
However, the above formula recommended from (EPA) had been error applied to 702
evaluate the health risks of heavy metals in Feng et al. (2016), as the parameter of 703
exposure frequency (EF) of fireworks had been set to 180 days per year which 704
Page 32 of 87
https://mc06.manuscriptcentral.com/er-pubs
Environmental Reviews
Draft
obviously contrary to the objective facts. We slightly modify the Eq. (1) to represent the 705
effects of fireworks more reasonable as: 706
D��� =��������
��� (2) 707
Where, exposure time (ET) is assumed to 8 hours for each day with fireworks 708
displays, which could expressed as 0.3 days; EDY is the number of days with fireworks 709
display in each year, we set it to 7 days according to the duration of Diwali Festival and 710
Spring Festival. 711
The lifetime average daily dose (LADD) of heavy metals exposure by inhalation 712
could be used to assess health risks by the following equation: 713
LADD =��
��× (
����������������
������+
����������������
������) (3) 714
where InhR$��%& and InhR'&(%) are inhalation rate for children (7.6 m3 day-1) and 715
for adults, respectively; EDY$��%& and EDY'&(%) is exposure duration, 24 and 6 year for 716
adults and children, respectively; BW$��%& and BW'&(%) are average body weight, 70 717
and 15 kg for adults and children, respectively. 718
The cancer risk can be calculated by following equations: 719
R = LADD × SF' (4) 720
R) = ∑ R (5) 721
where SF' is slope factor, which are 42, 15.1, 9.8, 0.84 and 6.4mg kg−1 day−1 for 722
Cr, As, Co, Ni and Cd (Feng et al. 2012; Wang et al. 2007). The concentrations of Co, 723
Ni and Cd were not enough to study their cancer risks, so that we only calculated the 724
cancer risk of Cr and As in this study. 725
The results of the average amount, daily exposure values and health risks of heavy 726
Page 33 of 87
https://mc06.manuscriptcentral.com/er-pubs
Environmental Reviews

Draft
metals are shown in Table 9. It indicated that it may ranged from 1.85 × 10⁻⁸ to 8.09 × 727
10−7 for adults and from 3.28 × 10⁻⁸ to 1.15 × 10⁻⁶ for children of the non-carcinogenic 728
heavy metals risk for exposure through the respiratory system. Here is the order of the 729
risk levels for the non-carcinogenic heavy metals: Pb>Zn>Sr>Cu>Mn>Ba>As>Cr. 730
Meanwhile, the carcinogenic risk for Cr is above 10-6 which showed an 731
unacceptable risk, while the carcinogenic risks for As (9.16 × 10⁻⁷) is almost lower than 732
10-6 which risks could be considered negligible by the US EPA. It indicated that Cr (the 733
carcinogenic heavy metal) is more dangerous than As and Cr is identified as the most 734
possible carcinogenic compound in fireworks, the result has been also verified in Betha 735
et al. (2014). 736
Although firework-related injuries have been studied both in terms of physical 737
injuries (29 papers) and chemical injuries (15 papers), the more explicit health effects of 738
particulate and gaseous pollutants (including metals) emitted from fireworks still need 739
further study to aid in the prevention and treatment of injuries caused by fireworks. 740
741
6 Emission control and management 742
Although festivals have a short duration, the use of fireworks creates a non-trivial, 743
unusual and serious impact on atmospheric pollution and human health (Moreno et al. 744
2007; Liu et al. 2014). Therefore, measures adopted to control and manage the burning 745
of fireworks are of considerable importance. 746
Preventative measures such as banning fireworks have been shown to be effective 747
in reducing the number of injuries resulting from fireworks. Wilson et al. (1982) 748
Page 34 of 87
https://mc06.manuscriptcentral.com/er-pubs
Environmental Reviews

Draft
compared the ocular trauma resulting from fireworks in three states in the United States, 749
finding that the number of physical injuries in Arkansas was ten times higher than in 750
Georgia and West Virginia: this showed that while banning fireworks had not been 751
totally effective (there were still injuries caused by fireworks), there was nevertheless 752
an important reduction in such injuries. Sheller et al. (1993) and D’Argenio et al. (1996) 753
reported a successful preventive measure in Denmark and Italy which roughly halved 754
the number of fireworks-related physical injuries. Chan et al. (2014) revealed an 755
increase in ocular trauma caused by fireworks burning after the lifting of the legislative 756
ban on fireworks in 1996 in Northern Ireland, followed by a reduction in the number of 757
injuries under measures reintroduced in 2002. Edwin et al. (2008) reported that the UK, 758
one of many countries introducing legislation on fireworks, banned banger fireworks 759
under the Firework Regulations of 1996/1997 and limited the sale of fireworks in 2003 760
(the Firework Act) and 2004 (the Fireworks Regulations). While these measures all 761
reduced injuries to children caused by fireworks, there remain a large number of cases 762
each year. Galea and Powles (2010) suggested that, in order to reduce the frequency 763
of firework injuries, it was necessary to burn fireworks in designated places and to only 764
sell fireworks on licensed premises in the UK. Fireworks were also regulated in South 765
Africa by Act 26 of 1956, requiring that retailers must sell fireworks with grant licenses 766
and banning the sale of fireworks to children younger than 16 years (Smittenberg et al. 767
2010). This legislation has an obvious impact on reducing children’s firework injuries, 768
similarly to the effect of legislation in the USA (Smith et al. 1996) and Hungary (Kuhn et 769
al. 2000). 770
Page 35 of 87
https://mc06.manuscriptcentral.com/er-pubs
Environmental Reviews
Draft
The environmental consequences of fireworks burning have been reported in771
previous studies and include adverse effects on air quality owing to the release772
of particulates and metals. This shows that banning fireworks is necessary to a773
void high levels of air pollution, especially the suffocating smog problem. The US774
A has already adopted measures to ban the use and sale of fireworks, or there 775
would be stricter controls on the sales and discharge period, following the State 776
Fireworks Law RCW 70.77.395 (http://www.wsp.wa.gov/fire/docs/fireworks/firework_777
bans_and_restrictions.pdf). In an attempt to limit air pollution, the Italian governm778
ent elected to limit or completely ban fireworks across all major cities ahead of 779
New Year’s Eve because of smog (http://www.dailymail.co.uk/wires/ap/article-33801780
49/Italian-cities-ban-New-Years-Eve-fireworks-smog.html). South Africa also banned781
the use and sales of fireworks during festivals in Cape Town (http://www.thepetit782
ionsite.Com/582/068/331/ban-fireworks-in-cape-town-south-africa/), and fireworks ar783
e now banned in Delhi because of severe air pollution (http://www.djvshow.com/h784
ome/fireworks-are-now-banned-in-delhi-thanks-to-air-pollution). In China, preventive 785
measures regarding fireworks have been implemented including banning fireworks786
and restricting the sale and use of fireworks (Jing et al. 2010). These measure787
s are often divided into two approaches: one is the conditional burning of firewor788
ks, involving regulated fireworks burning in designated places and times (such as789
permitted fireworks burning during the whole day of the Chinese New Year’s Ev790
e) such as the case in Beijing and Songyuan; the second is banning fireworks u791
se and sales in urban areas like Changchun and Hangzhou. 792
Page 36 of 87
https://mc06.manuscriptcentral.com/er-pubs
Environmental Reviews

Draft
In order to evaluate the effectiveness of preventive measures, we selected the 793
above four cities to conduct a comparison of hourly pollutant concentrations during the 794
Spring Festival of 2016 (Feb 7 - 8) (Figure 9a - 9d). There were obvious differences 795
between these cities because of the different regulations during Spring Festival. There 796
was a clear pollutants peak in cities adopting conditional burning (Figure 9a - 9b), with 797
the concentration of particles exceeding 600 µg/m3 (4 - 6 times higher than it in the 798
cities that banned burning) (Figure 9c - 9d). The high concentrations of particles lasted 799
for less than 6 hours during New Year’s Eve. The results clearly showed the strong 800
impact of fireworks, leading to severe air pollution, and demonstrate how the 801
implementation of strategies to control the use of fireworks can be effective in achieving 802
definite improvements during festivals. 803
The above discussion demonstrates the importance of implementing control 804
strategies to avoid the severe detrimental impacts of fireworks described in previous 805
studies. Firstly, close supervision and management of the fireworks industry is needed, 806
with the phasing-out of highly polluting models. Secondly, tight control is needed over 807
the time and location of fireworks displays. Thirdly, fireworks designs need to reduce 808
pollution emissions and explosion power (Han et al. 2007; Yan et al. 2011). 809
810
7 Summary and perspectives 811
According to our statistics, most of the papers were based on studies in Asia 812
(especially in China and India), with a few in America and Europe. However, only a few 813
of the studies in Asia focused on the health effects of fireworks. Further studies are 814
Page 37 of 87
https://mc06.manuscriptcentral.com/er-pubs
Environmental Reviews

Draft
needed in this respect to assess the occurrence of firework-related injuries and deaths 815
throughout the world. The ATOFMS should be used to study the chemical composition 816
along with the study of the size distribution of particles, and to identify correlations 817
between different types of particles released from fireworks, such as Faber et al. (2013), 818
this will help us to further evaluate the health risks of chemical in fireworks. 819
Furthermore, studies on the number concentration of particles are needed, and the 820
emission levels of particles should be monitored to establish an emissions inventory of 821
fireworks for use in numerical model-based forecasts of the burning of fireworks during 822
festivals and celebration events. 823
Very few of the studies focused on particle morphology (6/146) or noise generated 824
from fireworks (7/146). The following observations for future research are suggested to 825
study the morphology of particles resulting from fireworks, in order to better estimate 826
the shape correction factor and aerosol diameter. Noise quality also needs further 827
studies to provide recommendations to the fireworks industry with regard to reducing 828
noise pollution caused by fireworks burning. Meanwhile, some studies only focused on 829
ocular injuries and acute diseases associated with fireworks, yet injuries to the ear, face 830
and chronic diseases have received little attention, the risk levels for the 831
non-carcinogenic heavy metals in PM2.5 emitted from fireworks were observed in the 832
order Pb>Zn>Sr>Cu>Mn>Ba>As>Cr. Meanwhile, Cr (the carcinogenic heavy metal) 833
is identified as the most possible carcinogenic compound in fireworks. Additional 834
toxicological and epidemiological studies of fireworks addressing the health effects 835
from exposure to various chemical components of pollutants are also needed. 836
Page 38 of 87
https://mc06.manuscriptcentral.com/er-pubs
Environmental Reviews

Draft
Usually, fireworks only have short-term effects during festivals, and the 837
concentrations of pollutants decrease quickly after the end of the fireworks display. It is 838
still necessary to monitor the pollution caused by fireworks during this short-term period 839
and it must useful for the relevant departments to prevent and control air pollution 840
problems and human health effects resulting from fireworks displays during festivals. 841
842
Acknowledgements 843
This work was financially supported by the National Natural Science Foundation of 844
China (NSFC) (No. 41571063, 21407148 and 41771071) and National key R&D Plan 845
(No. 2017YFC0212304). 846
847
Reference 848
Agrawal A., Upadhyay V K., and Sachdeva K. 2011. Study of aerosol behavior on the basis of 849
morphological characteristics during festival events in India. Atmospheric Environment, 45(21): 850
3640-3644. 851
Agus E L., Lingard J J N., and Tomlin A S. 2008. Suppression of nucleation mode particles by 852
biomass burning in an urban environment: A case study. Journal of Environmental Monitoring, 853
10(8): 979-988. 854
Al-Qattan M M., and Al-Tamimi A S. 2009. Localized hand burns with or without concurrent blast 855
injuries from fireworks. Burns, 35(3): 425-429. 856
Ambade B., and Ghosh S. 2013. Characterization of PM10 in the ambient air during Deepawali 857
festival of Rajnandgaon District, India. Natural Hazards, 69(1): 589-598. 858
Page 39 of 87
https://mc06.manuscriptcentral.com/er-pubs
Environmental Reviews
Draft
Attri A K., Kumar U., and Jain V K. 2001. Microclimate: Formation of ozone by fireworks. Nature, 859
411(6841): 1015-1015. 860
Azhagurajan A., Selvakumar N., and Suresh A. 2014. Environment friendly fireworks manufacturing 861
using nano scale flash powder. Journal of Scientific and Industrial Research, 73: 479-484. 862
Babu R V., Cardenas V., and Sharma G. 2008. Acute respiratory distress syndrome from chlorine 863
inhalation during a swimming pool accident: A case report and review of the literature. Journal 864
of Intensive Care Medicine, 23:275-280. 865
Bai X L., Zhang G N., Wang D., Guo S F., and Zhu X G. 2014. Influence of festival celebration on 866
concentrations of PM2.5, PM10, SO2 and NO2 in Shenyang City. Advanced Materials Research. 867
955: 1452-1455. 868
Baranyai E., Simon E., Braun M., Tóthmérész B., Posta J., and Fábián I. 2015. The effect of a 869
fireworks event on the amount and elemental concentration of deposited dust collected in the 870
city of Debrecen, Hungary. Air Quality, Atmosphere and Health, 8(4): 359-365. 871
Barman S C., Singh R., Negi M P S., and Bhargava S K. 2008. Ambient air quality of Lucknow City 872
(India) during use of fireworks on Diwali Festival. Environmental Monitoring and Assessment, 873
137(1-3): 495-504. 874
Barman S C., Singh R., Negi M P S., and Bhargava S K. 2009. Fine particles (PM2.5) in ambient air 875
of Lucknow City due to fireworks on Diwali festival. Journal of Environmental Biology, 876
30(5):625-632. 877
Becker J M., Iskandrian S., and Conkling J. 2000. Fatal and near-fatal asthma in children exposed 878
to fireworks. Annals of Allergy, Asthma and Immunology, 85(6): 512-513. 879
Beig G., Chate D M., Ghude S D., Ali K., Satpute T., Sahu S K., Parkhi N., and Trimbake H K. 2013. 880
Page 40 of 87
https://mc06.manuscriptcentral.com/er-pubs
Environmental Reviews
Draft
Evaluating population exposure to environmental pollutants during Deepavali fireworks 881
displays using air quality measurements of the SAFAR network. Chemosphere, 92(1): 116-124. 882
Benoff S., Jacob A., and Hurley I R. 2000. Male infertility and environmental exposure to lead and 883
cadmium. Human Reproduction Update, 6(2): 107-121. 884
Berger L R., Kalishman S., and Rivara F P. 1985. Injuries from fireworks. Pediatrics, 75(5): 877-882. 885
Betha R., and Balasubramanian R. 2014. PM2.5 Emissions from hand-held sparklers: chemical 886
characterization and health risk assessment. Aerosol and Air Quality Research, 14: 1477-1486. 887
Boyle M D., Payne-Sturges D C., Sangaramoorthy T., Wilson S., Nachman K E., Babik K., Jenkins 888
C C., Trowell J., Milton D K., Sapkota A. 2016. Hazard ranking methodology for assessing 889
health impacts of unconventional natural gas development and production: The Maryland case 890
study. PloS one, 11(1): e0145368. 891
Bull M J., Agran P., Gardner H G., Laraque D., Pollack S H., Smith G A., Spivak H R., Tenebein M., 892
Brenner R A., Bryn S., Neverman C., Schieber R A., Stanwick R., Tinsworth D., Garcia V., Tanz 893
R., Katcher M L., and Newland H. 2001. Lawn mower-related injuries to children. Pediatrics, 894
107(6): 1480-1481. 895
Bull N. 2011. Legislation as a tool to prevent firework-related eye injuries. Acta Ophthalmologica, 896
89(8): e654-e655. 897
Burkart J., Steiner G., Reischl G., Moshammer H., Neuberger M., and Hitzenberger R. 2010. 898
Characterizing the performance of two optical particle counters (Grimm OPC1.108 and 899
OPC1.109) under urban aerosol conditions. Journal of Aerosol Science, 41(10): 953-962. 900
Caballero S., Galindo N., Castañer R., Giménez J., and Crespo J. 2015. Real-Time measurements 901
of ozone and UV radiation during pyrotechnic displays[J]. Aerosol and Air Quality Research, 15: 902
Page 41 of 87
https://mc06.manuscriptcentral.com/er-pubs
Environmental Reviews

Draft
2150-2157. 903
Camilleri R., and Vella A J. Effect of fireworks on ambient air quality in Malta. 2010. Atmospheric 904
Environment, 44(35): 4521-4527. 905
Canner J K., Haider A H., Selvarajah S., Hui X., Wang H., Efron D T., Haut E R., Velopulos C G., 906
Schwartz D A., Chi A., and Schneider E B. 2014. US emergency department visits for fireworks 907
injuries, 2006–2010. Journal of Surgical Research, 190(1): 305-311. 908
Chan W C., Knox F A., McGinnity F G., and Sharkey J A. 2004. Serious eye and adnexal injuries 909
from fireworks in Northern Ireland before and after lifting of the firework ban-an ophthalmology 910
unit’s experience. International Ophthalmology, 25(3): 167-169. 911
Chang S C., Lin T H., Young C Y., and Lee C T. 2011. The impact of ground-level fireworks (13 km 912
long) display on the air quality during the traditional Yanshui Lantern Festival in Taiwan. 913
Environmental Monitoring and Assessment, 172(1-4): 463-479. 914
Chatterjee A., Sarkar C., Adak A., Mukherjee U., Ghosh S K., and Raha S. 2013. Ambient air quality 915
during Diwali festival over Kolkata–a mega-city in India. Aerosol and Air Quality Research, 916
13(13): 1133-1144. 917
Chauhan V S., Singh B., Ganesh S., and Zaidi J. 2014. Status of air pollution during festival of lights 918
(Diwali) in Jhansi, Bundelkhand Region, India. Asian Journal of Science and Technology, 5(3): 919
187-191. 920
Chelani A B., Gajghate D G., ChalapatiRao C V., and Devotta S. 2010. Particle size distribution in 921
ambient air of Delhi and its statistical analysis. Bulletin of Environmental Contamination and 922
Toxicology, 85(1): 22-27. 923
Cheng Y., Engling G., He K B., Duan F K., Du Z Y., Ma Y L., Liang L L., Lu Z F., Liu J M., Zheng M., 924
Page 42 of 87
https://mc06.manuscriptcentral.com/er-pubs
Environmental Reviews
Draft
and Weber R J. 2014. The characteristics of Beijing aerosol during two distinct episodes: 925
Impacts of biomass burning and fireworks. Environmental Pollution, 185: 149-157. 926
Clarke J A., and Langley J D. 1994. Firework related injury in New Zealand. The New Zealand 927
Medical Journal, 107(988): 423-425. 928
Crespo J., Yubero E., Nicolás J F., Lucarelli F., Nava S., Chiari M., and Calzolai G. 2012. High-time 929
resolution and size-segregated elemental composition in high-intensity pyrotechnic exposures. 930
Journal of Hazardous Materials, 241: 82-91. 931
Crespo J., Yubero E., Nicolás J F., Caballero S., Galindo N. 2010. Time evolution of atmospheric 932
particle number concentration during high-intensity pyrotechnic events.Atmospheric 933
Environment, 96: 20-26. 934
Croteau G., Dills R ., Beaudreau M., and Davis M. 2010. Emission factors and exposures from 935
ground-level pyrotechnics. Atmospheric Environment, 44(27):3295-3303. 936
Curtis L., Rea W., Smith-Willis P., Fenyves E., and Pan Y. 2006. Adverse health effects of outdoor 937
air pollutants. Environment International, 32(6): 815-830. 938
De Q., Luo B., Ge Y., and Yu Z S. 2009. Analysis on Influence of Fireworks Burning on Lhasa Urban 939
Air Quality. Journal of Tibet University, 29(6): 29-33. 940
Deka P., and Hoque R R. 2014. Diwali fireworks: Early signs of impact on PM10 properties of rural 941
Brahmaputra Valley. Aerosol Air Quality Research, 14: 1752-1762. 942
Deng Q F., Yin A J., Cao X H., and Shi P P. 2011. Research of concentration distribution of air 943
pollutants and its causes in Dongsheng District Erdos City during the Spring Festival 2011. 944
Northern Environment, 8: 036. 945
Devara P C S., Vijayakumar K., Safai P D., Raju M P., Rao P S P. 2015. Celebration-induced air 946
Page 43 of 87
https://mc06.manuscriptcentral.com/er-pubs
Environmental Reviews

Draft
quality over a tropical urban station, Pune, India. Atmospheric Pollution Research, 6(3): 947
511-520. 948
Dhir S P., Shishko M N., Krewi A., and Mabruka S. 1991. Ocular fireworks injuries in children. 949
Journal of Pediatric Ophthalmology and Strabismus, 28(6): 354-355. 950
Di Benedetto G., Grassetti L., Forlini W., and Bertani A. 2009. An explosion in the mouth caused by 951
a firework. Journal of Plastic, Reconstructive and Aesthetic Surgery, 62(6): e145-e146. 952
Diab E., and Hatzopoulou M. 2013. Investigating the air pollution impacts of major events: A study of 953
the effects of Montreal’s largest festivals on downtown air quality. Transportation/ Land Use 954
Planning and Air Quality Conference, 1-11. 955
Do T M., Wang C F., Hsieh Y K., and Hsieh H F. 2012. Metals present in ambient air before and after 956
a firework festival in Yanshui, Tainan, Taiwan. Aerosol Air Quality Research, 12: 981-993. 957
Dong D B., Chu R., and Rui B. 2014. Evolution characteristics of PM2.5 mass concentration during 958
2013 Spring Festival in Hefei. Journal of Atmospheric and Environmental Optics, 9(4) 268-274. 959
Drewnick F., Diesch J M., Faber P., and Borrmann S. 2015. Aerosol mass spectrometry: 960
particle–vaporizer interactions and their consequences for the measurements. Atmospheric 961
Measurement Techniques, 8(9): 3811-3830. 962
Drewnick F., Hings S S., Curtius J., Eerdekens G., and Williams J. 2006. Measurement of fine 963
particulate and gas-phase species during the New Year's fireworks 2005 in Mainz, Germany. 964
Atmospheric Environment, 40(23): 4316-4327. 965
Drewnick F., Hings S S., DeCarlo P., Jayne J T., Gonin M., Fuhrer K., Weimer S., Jimenez J L., 966
Demerjian K L., Borrmann S., and Worsnop D R. 2005. A new time-of-flight aerosol mass 967
spectrometer (TOF-AMS)—Instrument description and first field deployment. Aerosol Science 968
Page 44 of 87
https://mc06.manuscriptcentral.com/er-pubs
Environmental Reviews

Draft
and Technology, 39(7): 637-658. 969
Dutschke A., Lohrer C., Kurth L., Seeger S., Barthel M., Panne U. 2011. Aerosol emissions from 970
outdoor firework displays. Chemical Engineering and Technology, 34(12): 2044-2050. 971
Edwin A F L., Cubison T C S., and Pape S A. 2008. The impact of recent legislation on paediatric 972
fireworks injuries in the Newcastle upon Tyne region. Burns, 34(7): 953-964. 973
Elangovan S., Rajalakshmi A R., Velayutham V., and Prabhu D R. 2016. An analysis of ocular 974
firecracker injuries in five consecutive years during a festive season in a tertiary eye care 975
hospital in South India. Expert Review of Ophthalmology, 11(3):235-240. 976
Faber P., Drewnick F., Veres P R., et al. Anthropogenic sources of aerosol particles in a football 977
stadium: Real-time characterization of emissions from cigarette smoking, cooking, hand flares, 978
and color smoke bombs by high-resolution aerosol mass spectrometry[J]. Atmospheric 979
environment, 2013, 77: 1043-1051. 980
Feng J L., Sun P., Hu X L., Zhao W., Wu M H., and Fu J M. 2012. The chemical composition and 981
sources of PM2.5 during the 2009 Chinese New Year's holiday in Shanghai. Atmospheric 982
Research, 118: 435-444. 983
Feng J L, Yu H., Su X F., Liu S H., Li Y., Pan Y P., and Sun J H. 2016. Chemical composition and 984
source apportionment of PM2.5 during Chinese spring festival at Xinxiang, a heavily polluted city 985
in north china: Fireworks and health risks. Atmospheric Research, 182: 176-188. 986
Fromme H., Diemer J., Dietrich S., Cyrys J., Heinrich J., Lang W., Kiranoglu M., and Twardella D. 987
2008. Chemical and morphological properties of particulate matter (PM10, PM2.5) in school 988
classrooms and outdoor air. Atmospheric Environment, 42(27): 6597-6605. 989
Galea A., and Powles O. 2010. A review of firework legislation and acute health effects. Chemical 990
Page 45 of 87
https://mc06.manuscriptcentral.com/er-pubs
Environmental Reviews

Draft
Hazards and Poisons Report, 32-36. 991
Ganguly N D. 2009. Surface ozone pollution during the festival of Diwali, New Delhi, India. Earth 992
Science. India, 2: 224-229. 993
Ganguly N D. 2015. Short term change in relative humidity during the festival of Diwali in India. 994
Journal of Atmospheric and Solar-Terrestrial Physics, 129: 49-54. 995
Godri K J., Green D C., Fuller G W., Dall’Osto M., Beddows D C., Kelly F J., Harrison R M., and 996
Mudway I S. 2010. Particulate oxidative burden associated with firework activity. Environmental 997
Science and Technology, 44(21): 8295-8301. 998
Gouder C., and Montefort S. 2014. Potential impact of fireworks on respiratory health. Lung India: 999
Official Organ of Indian Chest Society, 31(4): 375-379. 1000
Grima M., Butler M., Hanson R., and Mohameden A. 2012. Firework displays as sources of particles 1001
similar to gunshot residue. Science and Justice, 52(1): 49-57. 1002
Gurugubelli B. 2014. Depawali Festival day lead concentration in air-A case study. Journal of 1003
Agriculture and Life Sciences, 1(2): 71-76. 1004
Hamad S., Green D., and Heo J. 2016. Evaluation of health risk associated with fireworks activity at 1005
Central London. Air Quality, Atmosphere & Health, 9(7): 735-741. 1006
Han G., Gong W., Quan J., Li J., and Zhang M. 2014. Spatial and temporal distributions of 1007
contaminants emitted because of Chinese New Year’Eve celebrations in Wuhan. 1008
Environmental Science: Processes and Impacts, 16(4): 916-923. 1009
Han J., and Wang J. 2010. Setting off firecrackers on New Year's Eve of air auality in Hohhot City[J]. 1010
Northern Environment, 22(2):68-70. 1011
Han X D., Liu X H., Chen H., and Cui F Y. 2007. Impact of fireworks to air quality. Heilongjiang 1012
Page 46 of 87
https://mc06.manuscriptcentral.com/er-pubs
Environmental Reviews

Draft
Environmental Journal, 4: 60-68. 1013
Harrison R M., Bousiotis D., Mohoriy A M., Alkhalaf A K., Shamy M., and Alghamdi M. 2017. Health 1014
risk associated with airborne particulate matter and its components in Jeddah, Saudi Arabia. 1015
Science of the Total Environment, 590-591, 531-539. 1016
Hatamabadi H R., Tabatabaey A., Heidari K., and Khoramian M K. 2013. Firecracker injuries during 1017
chaharshanbeh soori festival in iran: A case series study. Archives of Trauma Research, 2(1): 1018
46. 1019
He G Y., Luo B., Chen J W., Zhang W., Liao Q Y., and Liu P C. 2014. The impact of fireworks on air 1020
quality during the Spring Festival in Chengdu downtown area. Sichuan Environment, 33(1): 1021
67-70. 1022
He S J., Wang Y., Li L L., and Jin J. 2012. The influence of the burning of fireworks on air quality 1023
during the Lantern Festival in Beijing. Journal of Minzu University of China (Natural Sciences 1024
Edition), 1: 22-27. 1025
Hirai K., Yamazaki Y., Okada K., Furuta S., and Kubo K. 2000. Acute eosinophilic pneumonia 1026
associated with smoke from fireworks. Internal Medicine, 39(5): 401-403. 1027
Hoek G., Dockery D W., Pope A., Neas L., Roemer W., and Brunekreef B. 1998. Association 1028
between PM10 and decrements in peak expiratory flow rates in children: Reanalysis of data 1029
from five panel studies. European Respiratory Journal, 11(6): 1307-1311. 1030
Hong Y., Zhou D P., Ma Y J., Li C L., Liu N W., and Dong Y M. 2010. Concentration and origin of 1031
atmospheric fine particles in Shenyang urban during the Spring Festival. China Powder 1032
Science and Technology, 1: 23-27. 1033
Huang K., Zhuang G., Lin Y., Wang Q., Fu J S., Zhang R., Li J., Deng C., and Fu Q. 2012. Impact of 1034
Page 47 of 87
https://mc06.manuscriptcentral.com/er-pubs
Environmental Reviews

Draft
anthropogenic emission on air quality over a megacity–revealed from an intensive atmospheric 1035
campaign during the Chinese Spring Festival. Atmospheric Chemistry and Physics, 12(23): 1036
11631-11645. 1037
Isobe T., Ogawa S P., Sugimoto R., Ramu K., Sudaryanto A., Malarvannan G., Devanathan G., 1038
Ramaswamy B R., Munuswamy N., Ganesh D S., Sivakumar J., Sethuraman A., Parthasarathy 1039
V., Subramanian A., Field J., and Tanabe S. 2013. Perchlorate contamination of groundwater 1040
from fireworks manufacturing area in South India. Environmental Monitoring and Assessment, 1041
185(7): 5627-5637. 1042
Jiang Q., Sun Y L., Wang Z., and Yin Y. 2015. Aerosol composition and sources during the Chinese 1043
Spring Festival: fireworks, secondary aerosol, and holiday effects. Atmospheric Chemistry and 1044
Physics, 15(11): 6023-6034. 1045
Jiang X W. 2012. The research on Haikou City fireworks pollution during Spring Festival. Bulletin of 1046
Science and Technology, 28(5): 192-196. 1047
Jin J., Wang Y., Li L J., Li J X., and Wei Q. 2007. Particles pollution and impact caused by fireworks 1048
in Beijing during Spring Festival. Environmental Pollution and Control, 29(3): 229-232. 1049
Jing H., Li Y F., Zhao J., Li B., Sun J L., Chen R., Gao Y X., and Chen C Y. 2014. Wide-range 1050
particle characterization and elemental concentration in Beijing aerosol during the 2013 Spring 1051
Festival[J]. Environmental Pollution, 192: 204-211. 1052
Joly A., Smargiassi A., Kosatsky T., Fournier M., Dabek-Zlotorzynska E., Celo V., Mathieu D., 1053
Servranckx R., D’amours R., Malo A., and Brook J. 2008. Characterisation of particulate 1054
exposure during fireworks displays. Epidemiology, 19(6): S218. 1055
Joshi M., Khan A., Anand S., and Sapra B K. 2016. Size evolution of ultrafine particles: Differential 1056
Page 48 of 87
https://mc06.manuscriptcentral.com/er-pubs
Environmental Reviews
Draft
signatures of normal and episodic events. Environmental Pollution, 208: 354-360. 1057
Keuken M P., Moerman M., Voogt M., Blom M., Weijers E P., Röckmann T., and Dusek U. 2013. 1058
Source contributions to PM2.5 and PM10 at an urban background and a street location. 1059
Atmospheric Environment, 71: 26-35. 1060
Khaparde V V., Pipalatkar P P., Pustode T., Rao C V C., and Gajghate D G. 2012. Influence of 1061
burning of fireworks on particle size distribution of PM10 and associated Barium at Nagpur. 1062
Environmental Monitoring and Assessment, 184(2): 903-911. 1063
Knox F A., Chan W C., Jackson A J., Foot B., Sharkey J A., and McGinnity F G. 2008. A British 1064
Ophthalmological Surveillance Unit study on serious ocular injuries from fireworks in the UK. 1065
Eye, 22(7): 944-947. 1066
Kong S F., Li L., Li X X., Yin Y., Chen K., Liu D T., Yuan L., Zhang Y J., Shan Y P., and Ji Y Q. 2015. 1067
The impacts of fireworks burning at Chinese Spring Festival on air quality and human health: 1068
Insights of tracers, source evolution and aging processes. Atmos. Chem. Phys., 15: 2167-2184. 1069
Kong S F., Li X X., Li L., Yin Y., Chen K., Yuan L., Zhang Y J., Shan Y P., and Ji Y Q. 2015. Variation 1070
of polycyclic aromatic hydrocarbons in atmospheric PM2.5 during winter haze period around 1071
2014 Chinese Spring Festival at Nanjing: Insights of source changes, air mass direction and 1072
firework particle injection. Science of the Total Environment, 520: 59-72. 1073
Kuhn F., Morris R., Witherspoon C D., Mann L., Mester V., Módis L., Berta A., and Bearden W. 2000. 1074
Serious fireworks-related eye injuries. Ophthalmic Epidemiology, 7(2): 139-148. 1075
Kulshrestha U C., Nageswara Rao T., Azhaguvel S., and Kulshrestha M J. 2004. Emissions and 1076
accumulation of metals in the atmosphere due to crackers and sparkles during Diwali festival in 1077
India. Atmospheric Environment, 38(27): 4421-4425. 1078
Page 49 of 87
https://mc06.manuscriptcentral.com/er-pubs
Environmental Reviews
Draft
Kumar R., Puttanna M., Sriprakash K S., Sujatha Rathod B L., and Prabhakaran V C. 2010. 1079
Firecracker eye injuries during Deepavali festival: A case series. Indian Journal of 1080
Ophthalmology, 58(2): 157. 1081
Kwasny F., Madl P., and Hofmann W. 2009. Comparing lung deposition of ultrafine particles caused 1082
by fireworks and traffic. Journal of Aerosol Science, 29: 5-6. 1083
Lee B H., Lopez-Hilfiker F D., Mohr C., Kurtén T., Worsnop D R., and Thornton J A. 2014. An 1084
iodide-adduct high-resolution time-of-flight chemical-ionization mass spectrometer: Application 1085
to atmospheric inorganic and organic compounds. Environmental science & technology, 48(11): 1086
6309-6317. 1087
Li C F. Effect of setting off fireworks for urban environment during Spring Festival. 2009. 1088
Environmental Protection and Circular Economy, 29(1): 45-46. 1089
Li J Y., Xu T T., Lu X H., Chen H., Nizkorodov S A., Chen J M., Yang X., Mo Z Y., Chen Z M., Liu H L., 1090
Mao J Y., and Liang G Y. 2017. Online single particle measurement of fireworks pollution during 1091
Chinese New Year in Nanning. Journal of Environmental Sciences, 53: 184-195. 1092
Li L J., Li J X., Xin L Z., Li H J., and Wei Q. 2006. Analysis of atmospheric air pollution of Beijing City 1093
in Spring Festival period. China Environmental Science, 26(5): 537-541. 1094
Li L P., Zhang N., Wang Z., Wan D., and Zhou W. 2008. Effect of firecracker setting-off on 1095
water-soluble inorganic ions in atmospheric aerosol during Spring Festival. Urban Environment 1096
and Urban Ecology, 5: 37-41. 1097
Li W J., Shi Z B., Yan C., Yang L X., Dong C., and Wang W X. 2013. Individual metal-bearing 1098
particles in a regional haze caused by firecracker and firework emissions. Science of the Total 1099
Environment, 443: 464-469. 1100
Page 50 of 87
https://mc06.manuscriptcentral.com/er-pubs
Environmental Reviews
Draft
Li W Q., Du G J., and Wang M. 2015. Research on characteristics of the temporal and spatial 1101
variation of atmosphere pollutants concentrations during the Spring Festival form 2012 to 2014 1102
in Zhengzhou. Meteorological and Environmental Sciences, 38(4):12-21. 1103
Li X R., Guo X Q., Liu X R., Liu C S., Zhang S S., and Wang Y S. 2009. Distribution and sources of 1104
solvent extractable organic compounds in PM2.5 during 2007 Chinese Spring Festival in Beijing. 1105
Journal of Environmental Sciences, 21(2): 142-149. 1106
Li Y., Cheng S Y., Huang Q., Han L H., Liu C., Wang Z J., and Tian C. 2013. Chemical composition 1107
of the atmospheric particles caused by the burning of fireworks during the Spring Festival. 1108
Journal of Jinan University (Natural Science and Medicine Edition), 3:328-332. 1109
Liang T J. 2010. Setting off firecrackers during the spring festival of air quality in Dandong City. 1110
Northern Environment, 2: 54-59. 1111
Licudine J A., Yee H., Chang W L., and Whelen A C. 2012. Hazardous metals in ambient air due to 1112
New Year fireworks during 2004–2011 celebrations in Pearl City, Hawaii. Public Health Reports, 1113
127(4): 440. 1114
Lin C C., Huang K L., Chen H L., Tsai J H., Chiu Y P., Lee J T., and Chen S J. 2014. Influences of 1115
beehive firework displays on ambient fine particles during the Lantern Festival in the YanShuei 1116
area of southern Taiwan. Aerosol Air Quality Research, 14: 1998-2009. 1117
Liu D Y., Rutherford D., Kinsey M., and Prather K A. 1997. Real-time monitoring of pyrotechnically 1118
derived aerosol particles in the troposphere. Analytical Chemistry, 69(10): 1808-1814. 1119
Liu J., Man Y., and Liu Y. 2014. Temporal variability of PM10 and PM2.5 inside and outside a 1120
residential home during 2014 Chinese Spring Festival in Zhengzhou, China. Natural Hazards, 1121
73: 1-6. 1122
Page 51 of 87
https://mc06.manuscriptcentral.com/er-pubs
Environmental Reviews

Draft
Liu J J., and Zhang T. 2014. The influence of setting off fireworks and firecracker on New Year’s Eve 1123
to air quality in Chongqing. Guangzhou Chemical Industry, 11:156-157. 1124
Liu S L., Krewski D., Shi Y L., Chen Y., and Burnett R T. 2003. Association between gaseous 1125
ambient air pollutants and adverse pregnancy outcomes in Vancouver, Canada. Environmental 1126
Health Perspectives, 111(14): 1773. 1127
Mahecha G S., Bamniya B R., Kapasya V., and Meena R S. 2012. Noise pollution monitoring during 1128
Diwali festival in Golden city Jaisalmer of Rajasthan, India. The Environmentalist, 32(4): 1129
415-419. 1130
Majumdar D., and Nema P. 2011. Assessment of fine particle number profile in fugitive emissions 1131
from firecrackers. Journal Science and Industrial Research, 70: 225-229. 1132
Manalis N., Grivas G., Protonotarios V., and Moutsatsou A., Samara C., and Chaloulakou A. 2005. 1133
Toxic metal content of particulate matter (PM10), within the Greater Area of Athens. 1134
Chemosphere, 60(4): 557-566. 1135
Mandal P., Prakash M., and Bassin J K. 2012. Impact of Diwali celebrations on urban air and noise 1136
quality in Delhi City, India. Environmental monitoring and assessment, 184(1): 209-215. 1137
Mansouri M R., Mohammadi S F., Hatef E., Rahbari H., Khazanehdari M S., Zandi P., Moghimi S., 1138
Piri N., and Fahim A. 2007. The Persian Wednesday Eve Festival “Charshanbe-Soori” 1139
fireworks eye injuries: A case series. Ophthalmic Epidemiology, 14(1): 17-24. 1140
Marsal C., Abry F., Bouyon M., Meyer N., Bourcier T., Speeg-Schatz C. 2010. Serious 1141
fireworks-related eye injuries in Alsace (France). Journal Francais D'ophtalmologie, 33(8): 1142
538-543. 1143
Martín-Alberca C., and García-Ruiz C. 2014. Analytical techniques for the analysis of consumer 1144
Page 52 of 87
https://mc06.manuscriptcentral.com/er-pubs
Environmental Reviews
Draft
fireworks. TrAC Trends in Analytical Chemistry, 56: 27-36. 1145
Maynard A D., and Kuempel E D. 2005. Airborne nanostructured particles and occupational health. 1146
Journal of Nanoparticle Research, 7(6): 587-614. 1147
McGuire M L., Jeong C H., Slowik J G., Chang R Y W., Corbin J C., Lu G., Mihele C., Rehbein P J 1148
G., Sills D M L., Abbatt J P D., Brook J R., and Evans G J. 2011. Elucidating determinants of 1149
aerosol composition through particle-type-based receptor modeling. Atmospheric Chemistry 1150
and Physics, 11(15): 8133-8155 1151
Moore Jr R S., Tan V., Dormans J P., and Bozentka D J. 2000. Major pediatric hand trauma 1152
associated with fireworks. Journal of Orthopaedic Trauma, 14(6): 426-428. 1153
Moreno T., Querol X., Alastuey A., Minguillo´ n M C., Pey J., Rodriguez S., Miro J V., Felis C., and 1154
Gibbons W. 2007. Recreational atmospheric pollution episodes: Inhalable metalliferous 1155
particles from firework displays. Atmospheric Environment, 41(5): 913-922. 1156
Moreno T., Querol X., Alastuey A., Amato F., Pey J., Pandolfi M., Kuenzli N., Bouso L., Rivera M., 1157
and Gibbons W. 2010. Effect of fireworks events on urban background trace metal aerosol 1158
concentrations: Is the cocktail worth the show?. Journal of Hazardous Materials, 183(1): 1159
945-949. 1160
Mu Q., Zhang S Q. 2015. Assessment of the trend of heavy PM2.5 pollution days and economic loss 1161
of health effects during 2001–2013. Acta Scientiarum Naturalium Universitatis Pekinensis, 1162
04(51):694-706. 1163
Munster J., Hanson G N., Jackson W A., and Rajagopalan S. 2009. The fallout from fireworks: 1164
Perchlorate in total deposition. Water, Air and Soil Pollution, 198(1-4): 149-153. 1165
Nasir U P., and Brahmaiah D. 2009. Impact of fireworks on ambient air quality: A case study. 1166
Page 53 of 87
https://mc06.manuscriptcentral.com/er-pubs
Environmental Reviews

Draft
International Journal of Environmental Science and Technology, 12: 1-8. 1167
Nicolás J., Yubero E., Galindo N., Gime´nez J., Castan˜er R., Carratala´ A., Crespo J., and 1168
Pastor C. 2009. Characterization of events by aerosol mass size distributions. Journal of 1169
Environmental Monitoring, 11(2): 394-399. 1170
Nirmalkar J., Deb M K., Deshmukh D K., and Verma S K. 2013. Mass loading of size-segregated 1171
atmospheric aerosols in the ambient air during fireworks episodes in Eastern Central India. 1172
Bulletin of Environmental Contamination and Toxicology, 90(4): 434-439. 1173
Nishanth T., Praseed K M., Rathnakaran K., Satheesh Kumar M K., Ravi Krishna R., and Valsaraj K 1174
T. 2012. Atmospheric pollution in a semi-urban, coastal region in India following festival 1175
seasons. Atmospheric Environment, 47: 295-306. 1176
Pachauri T., Singla V., Satsangi A., Lakhani A., Maharaj Kumari K. 2013. Characterization of major 1177
pollution events (dust, haze, and two festival events) at Agra, India. Environmental Science and 1178
Pollution Research, 20(8): 5737-5752. 1179
Pandey P., Khan A H., Verma A K., Singh K A., Mathur N., Kisku G C., and Barman S C. 2012. 1180
Seasonal trends of PM2.5 and PM10 in ambient air and their correlation in ambient air of 1181
Lucknow City, India. Bulletin of Environmental Contamination and Toxicology, 88(2): 265-270. 1182
Pathak B., Bharali C., Biswas J., and Bhuyan P K. 2013. Firework induced large increase in trace 1183
gases and black carbon at Dibrugarh, India. Journal of Earth Science and Engineering, 3: 1184
540-544. 1185
Pearson P., Britton J., McKeever T., Lewis SA., Weiss S., Pavord I., and Fogarty A. 2005. Lung 1186
function and blood levels of copper, selenium, vitamin C and vitamin E in the general population. 1187
European Journal of Clinical Nutrition, 59:1043–8. 1188
Page 54 of 87
https://mc06.manuscriptcentral.com/er-pubs
Environmental Reviews
Draft
Pedreros E., Sepúlveda M., Gutierrez J., Carrasco P., and Quiñones R A. 2016. Observations of the 1189
effect of a New Year’s fireworks display on the behavior of the South American sea lion (Otaria 1190
flavescens) in a colony of central-south Chile. Marine and Freshwater Behaviour and 1191
Physiology, 49(2): 1-5. 1192
Perrino C., Tiwari S., Catrambone M., Torre S D., Rantica E., and Canepari S. 2011. Chemical 1193
characterization of atmospheric PM in Delhi, India, during different periods of the year including 1194
Diwali Festival. Atmospheric Pollution Research, 2(4): 418-427. 1195
Perry K D. 1999. Effects of outdoor pyrotechnic displays on the regional air quality of Western 1196
Washington State. Journal of the Air and Waste Management Association, 49(2): 146-155. 1197
Pervez S., Chakrabarty R K., Dewangan S., Watson J G., Chow J C., and Matawle J L. 2016. 1198
Chemical speciation of aerosols and air quality degradation during the festival of lights (Diwali). 1199
Atmospheric Pollution Research, 7(1): 92-99. 1200
Pope III C A., Brook R D., Burnett R T., and Dockery D W. 2011. How is cardiovascular disease 1201
mortality risk affected by duration and intensity of fine particulate matter exposure? An 1202
integration of the epidemiologic evidence. Air Quality, Atmosphere and Health, 4(1): 5-14. 1203
Pope III C A., Burnett R T., Thun M J., Calle E E ., Krewski D., Ito K., and Thurston G D. 2002. Lung 1204
cancer, cardiopulmonary mortality, and long-term exposure to fine particulate air pollution. 1205
Jama, 287(9): 1132-1141. 1206
Prakash D., Payra S., Verma S., and Soni M. 2013. Aerosol particle behavior during Dust Storm and 1207
Diwali over an urban location in north western India. Natural Hazards, 69(3): 1767-1779. 1208
Qin W., Ge S., Zhang X Z., Lu W Q., and Yang X. 2013. The impact of PM2.5 in the air and the 1209
water-soluble ions during fireworks. Environmental Monitoring and Forewarning, 3: 1-4. 1210
Page 55 of 87
https://mc06.manuscriptcentral.com/er-pubs
Environmental Reviews

Draft
Rao P S., Gajghate D G., Gavane A G., Suryawanshi P., Chauhan C., Mishira S., Gupta N., Rao C V 1211
C., and Wate S R. 2012. Air quality status during Diwali Festival of India: A case study. Bulletin 1212
of Environmental Contamination and Toxicology, 89(2): 376-379. 1213
Ravindra K., Mor S., and Kaushik C P. 2003. Short-term variation in air quality associated with 1214
firework events: A case study. Journal of Environmental Monitoring, 5(2): 260-264. 1215
Remškar M., Tavčar G., and Škapin S D. 2014. Sparklers as a nanohazard: size distribution 1216
measurements of the nanoparticles released from sparklers. Air Quality, Atmosphere and 1217
Health, 8(2): 1-7. 1218
Reyes-Villegas E., Priestley M., Ting Y C., Haslett S., Bannan T., Le Breton M., Williams P I., Bacak 1219
A., Flynn M J., Coe H., Percival C., and Allan JD. 2017. Simultaneous Aerosol Mass 1220
Spectrometry and Chemical Ionisation Mass Spectrometry measurements during a biomass 1221
burning event in the UK: Insights into nitrate chemistry. Atmospheric Chemistry and Physics 1222
Discussion, 1-22. 1223
Lad R J., Patil V N., and Raut P D. 2011. Study of noise pollution during Deepawali Festival in 1224
Kolhapur City of Maharashtra, India. Indian Streams Research Journal, 1: 82. 1225
Saadat S., Naseripour M., and Smith G A. 2010. The health and economic impact of 1226
fireworks-related injuries in Iran: a household survey following the New Year's Festival in 1227
Tehran. Injury, 41(7): e28-e33. 1228
Sacu S., Ségur-Eltz N., Stenng K., and Zehetmayer M. 2002. Ocular firework injuries at New Year’s 1229
eve. Ophthalmologica, 216(1): 55-59. 1230
Sánchez A S., Nieto P J G., Fernández P R., Díaz J J C., and Iglesias-Rodríguez F J. 2011. 1231
Application of an SVM-based regression model to the air quality study at local scale in the 1232
Page 56 of 87
https://mc06.manuscriptcentral.com/er-pubs
Environmental Reviews
Draft
Avilés urban area (Spain). Mathematical and Computer Modeling, 54(5): 1453-1466. 1233
Sarkar S., Khillare P S., Jyethi D S., Hasan A., and Parween M. 2010. Chemical speciation of 1234
respirable suspended particulate matter during a major firework festival in India. Journal of 1235
Hazardous Materials, 184(1): 321-330. 1236
Sau C., Lazaroaie C., Zecheru T., Petre R., Iordache P Z., and Goga D A. 2011. Toxicity evaluation 1237
of smoke pyrotechnic compositions based on the dimensional analysis of solid combustion 1238
products. Revista de Chimie, 62(7): 718-722. 1239
Schleicher N., Norra S., Chen Y., Chai F., and Wang S L. 2012. Efficiency of mitigation measures to 1240
reduce particulate air pollution—a case study during the Olympic Summer Games 2008 in 1241
Beijing, China. Science of the Total Environment, 427: 146-158. 1242
Schmid P., Bogdal C., Wang Z Y., Azara V., Haag R., and Von Arx U. 2014. Releases of 1243
chlorobenzenes, chlorophenols and dioxins during fireworks. Chemosphere, 114: 158-164. 1244
Schwartz J., Dockery D W., and Neas L M. 1996. Is daily mortality associated specifically with fine 1245
particles?. Journal of the Air and Waste Management Association, 46(10): 927-939. 1246
Seidel D J., and Birnbaum A N. 2015. Effects of Independence Day Fireworks on Atmospheric 1247
Concentrations of Fine Particulate Matter in the United States. Atmospheric Environment, 115: 1248
192-198. 1249
Shen J D., Jiao L., He X., Xu C., Xu H., Sun H L., Zeng D J., Zhang T., and Ye X M. 2014. Online 1250
measurement of the water-soluble ions in PM2.5 during festival in Hangzhou. Environmental 1251
Monitoring in China, 2: 151-157. 1252
Shi G L., Liu G R., Tian Y Z., Zhou X Y., Peng X., and Feng Y C. 2014. Chemical characteristic and 1253
toxicity assessment of particle associated PAHs for the short-term anthropogenic activity event: 1254
Page 57 of 87
https://mc06.manuscriptcentral.com/er-pubs
Environmental Reviews
Draft
During the Chinese New Year's Festival in 2013. Science of the Total Environment, 482: 8-14. 1255
Shi Y L., Zhang N., Gao J M., Li X., and Cai Y Q. 2011. Effect of fireworks display on perchlorate in 1256
air aerosols during the Spring Festival. Atmospheric Environment, 45(6): 1323-1327. 1257
Shon Z H., Jeong J H., and Kim Y K. 2015. Characteristics of atmospheric metalliferous particles 1258
during large-scale fireworks in Korea. Advances in Meteorology, 3-13. 1259
Sijimol M R., and Mohan M. 2014. Environmental impacts of perchlorate with special reference to 1260
fireworks—a review. Environmental Monitoring and Assessment, 186(11): 7203-7210. 1261
Singh B P., Srivastava A K., Tiwari S., Singh S., Singh R K., Bisht D S., Lal D M., Singh A K., Mall R 1262
K., and Srivastava M K. 2014. Radiative impact of fireworks at a tropical Indian location: A case 1263
study. Advances in Meteorology, 1-8. 1264
Singh D P., Gadi R., Mandal T K., Dixit C K., Singh K., Saud T., Singh N., and Gupta P K. 2010. 1265
Study of temporal variation in ambient air quality during Diwali Festival in India. Environmental 1266
Monitoring and Assessment, 169(1-4): 1-13. 1267
Singh R P., and Sharma M. 2012. Enhancement of BC concentration associated with Diwali festival 1268
in India. Geoscience and Remote Sensing Symposium (IGARSS), 2012 IEEE International. 1269
IEEE, 3685-3688. 1270
Smith G A., Knapp J F., Barnett T M., and Shields B J. 1996. The rockets' red glare, the bombs 1271
bursting in air: fireworks-related injuries to children. Pediatrics, 98(1): 1-9. 1272
Smith P M. 2012. Review of chemistry of pyrotechnics: Basic principles and theory. Journal of 1273
Chemical Education, 89(6): 698-698. 1274
Smittenberg M N., Lungelow D., Rode H., Van As A B., and Millar A J W. 2010. Can 1275
fireworks-related injuries to children during festivities be prevented?. SAMJ: South African 1276
Page 58 of 87
https://mc06.manuscriptcentral.com/er-pubs
Environmental Reviews

Draft
Medical Journal, 100(8): 525-528. 1277
Srivastava R K., Sagar K., and Beig G. 2015. Comparative study of air quality in Jabalpur during 1278
Diwali Festival. International Journal of Advancements in Research and Technology, 4(2): 1279
34-53. 1280
Steinhauser G., Sterba J H., Foster M., Grass F., and Bichler M. 2008. Heavy metals from 1281
pyrotechnics in New Years Eve snow. Atmospheric Environment, 42(37): 8616-8622. 1282
Sterba J H., Steinhauser G., and Grass F. 2013. Illicit utilization of arsenic compounds in 1283
pyrotechnics? An analysis of the suspended particle emission during Vienna’s New Year 1284
fireworks. Journal of Radioanalytical and Nuclear Chemistry, 296(1): 237-243. 1285
Sun Z P., and Zhang J X. 1995. Effect of setting-off fireworks for urban environment during New 1286
Year’s Eve. Environmental Protection Science, 21(2): 65-68. 1287
Sundelin K., and Norrsell K. 2000. Eye injuries from fireworks in Western Sweden. Acta 1288
Ophthalmologica Scandinavica, 78(1): 61-64. 1289
Tandon A., Yadav S., and Attri A K. 2008. City-wide sweeping a source for respirable particulate 1290
matter in the atmosphere. Atmospheric Environment, 42(5): 1064-1069. 1291
Tang M., Ji D S., Gao W K., Yu Z W., Chen K., and Cao W. 2016. Characteristics of air quality in 1292
Tianjin during the Spring Festival period of 2015. Atmospheric and Oceanic Science Letters, 1293
9(1): 15-21. 1294
Tang X Y., Luo L., Cao J J, Wang Q Y. 2013. Characteristics of Chemical Elements in Atmospheric 1295
PM2.5 during the Spring Festival in Chengdu. Environmental Science and Technology, 5: 1296
151-170. 1297
Thakur B., Chakraborty S., Debsarkar A., Chakrabarty S., and Srivastava R C. 2010. Air pollution 1298
Page 59 of 87
https://mc06.manuscriptcentral.com/er-pubs
Environmental Reviews

Draft
from fireworks during festival of lights (Deepawali) in Howrah, India-a case study. Atmósfera, 1299
23(4): 347-365. 1300
Thygesen J. 2000. Ocular injuries caused by fireworks. 25 years of experience with preventive 1301
campaigns in Denmark. Acta ophthalmologica Scandinavica, 78(1): 1-2. 1302
Tian Y Z., Wang J., Peng X., Shi G L., and Feng Y C. 2014. Estimation of direct and indirect impacts 1303
of fireworks on the physicochemical characteristics of atmospheric fine and coarse particles. 1304
Atmospheric Chemistry and Physics Discussions, 14(8): 11075-11101. 1305
Tiwari S., Chate D M., Srivastava M K., Safai P D., Srivastava A K., Bisht D S., and 1306
Padmanabhamurty B. 2012. Statistical evaluation of PM10 and distribution of PM1, PM2.5, and 1307
PM10 in ambient air due to extreme fireworks episodes (Deepawali festivals) in megacity Delhi. 1308
Natural Hazards, 61(2): 521-531. 1309
Tsai H H., Chien L H., Yuan C S., Lin Y C., Jen Y H., and Ie I R. 2012. Influences of fireworks on 1310
chemical characteristics of atmospheric fine and coarse particles during Taiwan's Lantern 1311
Festival. Atmospheric Environment, 62: 256-264. 1312
Tsai Y I., Sopajaree K., Kuo S C., and Yu S P. 2015. Potential PM2.5 impacts of festival-related 1313
burning and other inputs on air quality in an urban area of southern Taiwan. Science of the Total 1314
Environment, 527: 65-79. 1315
Tu Y L., and Granados D V. 2015. Fireworks-related deaths, emergency department-treated injuries, 1316
and enforcement activities during 2014. US Consumer Product Safety Commission report, 1317
10-1. 1318
Vaghardoost R., Ghavami Y., Sobouti B., and Mobayen M R. 2013. Mortality and morbidity of 1319
fireworks-related burns on the annual last wednesday of the year festival (charshanbeh soori) 1320
Page 60 of 87
https://mc06.manuscriptcentral.com/er-pubs
Environmental Reviews

Draft
in Iran: An 11-year study. Trauma Monthly, 18(2): 81. 1321
Van Kamp I., Van der Velden P G., Stellato R K., Roorda J., Van Loon J., Kleber R J., Gersons B B 1322
R., and Lebret E. 2006. Physical and mental health shortly after a disaster: first results from the 1323
Enschede firework disaster study. European Journal of Public Health, 16(3): 252-258. 1324
Vassura I., Venturini E., Marchetti S., Piazzalunga A., Bernardi E., Fermo P., and Passarini F. 2014. 1325
Markers and influence of open biomass burning on atmospheric particulate size and 1326
composition during a major bonfire event. Atmospheric environment, 82: 218-225. 1327
Vecchi R., Bernardoni V., Cricchio D., D’Alessandro A., Fermo P., Lucarelli F., Nava s., Piazzalunga 1328
A., and Valli G. 2008. The impact of fireworks on airborne particles. Atmospheric Environment, 1329
42(6): 1121-1132. 1330
Vella A J., Chircop C., Micallef T., and Pace C. 2015. Perchlorate in dust fall and indoor dust in Malta: 1331
An effect of fireworks. Science of the Total Environment, 521: 46-51. 1332
Verma C., and Deshmukh D K. 2014. The ambient air and noise quality in India during diwali festival: 1333
A review. Recent Research in Science and Technology, 6(1): 203-210. 1334
Verougstraete V., Lison D., and Hotz P. 2003. Cadmium, lung and prostate cancer: A systematic 1335
review of recent epidemiological data. Journal of Toxicology Environmental Health, Part. 1336
6:227–55. 1337
Vyas B M., and Saraswat V. 2012. Studies of atmospheric aerosol’s parameters during pre-Diwali to 1338
post–Diwali festival period over Indian semi arid station ie, Udaipur. Applied Physics Research, 1339
4(2): 40-55. 1340
Wang C., Zhao R., Du W L., Ning F G., and Zhang G A. 2014. Firework injuries at a major trauma 1341
and burn center: A five-year prospective study. Burns, 40(2): 305-310. 1342
Page 61 of 87
https://mc06.manuscriptcentral.com/er-pubs
Environmental Reviews
Draft
Wang F Q., Cai X L., and Zhou S A. 2008. Effect of firecracker setting-off on the PM10 and SO2 and 1343
NO2 in Xi'an. Journal of Safety and Environment, 1: 82-86. 1344
Wang G H., Lin J., Yao J., Fan X B., Geng Y H., Wei N N., Liu W., and Li Y. 2011. Size distribution of 1345
number concentration and chemical components of particulate matters during Spring Festival 1346
in Shanghai suburb. Environmental Chemistry, 5: 913-919. 1347
Wang H L., Zhu B., Shen L J., Liu X H., Zhang Z F., and Yang Y. 2014. Size distributions of aerosol 1348
during the Spring Festival in Nanjing. Environmental Science, 35(2): 442-450. 1349
Wang H L., Zhu B., Shen L J., Zhang Z F., and Liu X H. 2014. The mass concentration and chemical 1350
compositions of the atmospheric aerosol during the Spring Festival in Nanjing. China 1351
Environmental Science, 34(1): 30-39. 1352
Wang J F., Ge X L., Chen Y F., Shen Y F., Zhang Q., Sun Y L., Xu J Z., Ge S., Yu H., and Chen M D. 1353
2016. Highly time-resolved urban aerosol characteristics during springtime in Yangtze River 1354
Delta, China: insights from soot particle aerosol mass spectrometry. Atmospheric Chemistry 1355
and Physics, 16(14): 9109-9127. 1356
Wang M. 2013. Research of the change regularity of aerosol pollutants during the Spring Festival in 1357
Zhengzhou. He’nan Normal University. 1358
Wang P Y. 2015. Determination of perchlorate in soil and air samples during fireworks displays in 1359
Taiwan and USA. University of Delaware. 1360
Wang W., Liu X D., Lu Y Q., Guo D F., Li Y W., Tian X D., Adams F. 2002. Determination of isotope 1361
abundance ratio of lead in Beijing atmospheric aerosol and lead source study. Journal of 1362
Chinese Mass Spectrometry Society, 23(1):21-29. 1363
Wang Y G., Hopke P K., and Rattigan O V. 2012. A new indicator of fireworks emissions in 1364
Page 62 of 87
https://mc06.manuscriptcentral.com/er-pubs
Environmental Reviews

Draft
Rochester, New York. Environmental Monitoring and Assessment, 184(12): 7293-7297. 1365
Wang Y., Zhuang G S., Xu C., An Z S. 2007. The air pollution caused by the burning of fireworks 1366
during the lantern festival in Beijing. Atmospheric Environment, 41(2): 417-431. 1367
Watson J G., Chow J C., Sodeman D A., Lowenthal D H., Chang M C O., Park K H., and Wang X L. 1368
2011. Comparison of four scanning mobility particle sizers at the Fresno Supersite. 1369
Particuology, 9(3): 204-209. 1370
Wehner B., Wiedensohler A., and Heintzenberg J. 2000. Submicrometer aerosol sieze distribution 1371
and mass concentration of the millennium fireworks 2000 in Leipzig, Germany. Journal of 1372
Aerosol Science, 31(12): 1489-1493. 1373
Williams J., Drewnick F., Hings S S., Curtius J., Eerdekens G., Klüpfel T., and Wagner T. 2005. 1374
Firework emissions for satellite validation?. Environmental Chemistry, 2(2): 94-95. 1375
Wilson R S. Ocular fireworks injuries and blindness: an analysis of 154 cases and a three-state 1376
survey comparing the effectiveness of model law regulation[J]. Ophthalmology, 1982, 89(4): 1377
291-297. 1378
Witt M L I., Meheran N., Mather T A., De Hoog J C M., and Pyle DM. 2010. Aerosol trace metals, 1379
particle morphology and total gaseous mercury in the atmosphere of Oxford, UK. Atmospheric 1380
Environment, 44(12): 1524-1538. 1381
Wu Q., Oldi J F., and Kannan K. 2011. Fate of perchlorate in a man-made reflecting pond following a 1382
fireworks display in Albany, New York, USA. Environmental Toxicology and Chemistry, 30(11): 1383
2449-2455. 1384
Xiao X J., Liang J., Zhang Y C., and Li X Z. 2011. Research on the effects of setting off fireworks 1385
and crackers on the environment during the Spring Festival in Liling City. Initiators and 1386
Page 63 of 87
https://mc06.manuscriptcentral.com/er-pubs
Environmental Reviews

Draft
Pyrotechnics, (2): 53-56. 1387
Xu J., Ding G A., Yan P., Zhang J C., Wang S F., Meng Z Y., Zhang Y M., Liu Y C., and Zhang X L. 1388
2006. Effect of firecracker setting-off on the fine particle pollution in Beijing downtown areas. 1389
Journal of Safety and Environment, 5:79-82. 1390
Xu J Y. 2010. Analysis on ambient air quality at Spring Festival Eve Night in Shenyang. 1391
Environmental Protection Science, 36(4): 1-2. 1392
Yan M. 2011. Effect of firecrackers during Spring Festival on air in Nanning City. Sichuan 1393
Environment, 6: 53-56. 1394
Yang L X., Gao X M., Wang X F., Nie W., Wang J., Gao R., Xu P J., Shou Y P., Zhang Q Z., and 1395
Wang W X. 2014. Impacts of firecracker burning on aerosol chemical characteristics and 1396
human health risk levels during the Chinese New Year Celebration in Jinan, China. Science of 1397
the Total Environment, 476: 57-64. 1398
Ye C., Chen R S., and Chen M X. 2015. The impacts of Chinese Nian culture on air pollution. 1399
Journal of Cleaner Production, 1-6. 1400
Ye F., Piver W T., Ando M., and Portier C J. 2001. Effects of temperature and air pollutants on 1401
cardiovascular and respiratory diseases for males and females older than 65 years of age in 1402
Tokyo, July and August 1980-1995. Environmental Health Perspectives, 109(4): 355-359. 1403
Ye W X. 2016. Investigation and identification of fire caused by setting off fireworks. Procedia 1404
Engineering, 135: 426-429. 1405
Yerramsetti V S., Sharma A R., Navlur N G., Rapolu V., Dhulipala N S K C., and Sinha P R. 2013. 1406
The impact assessment of Diwali fireworks emissions on the air quality of a tropical urban site, 1407
Hyderabad, India, during three consecutive years. Environmental Monitoring and Assessment, 1408
Page 64 of 87
https://mc06.manuscriptcentral.com/er-pubs
Environmental Reviews

Draft
185(9): 7309-7325. 1409
Yu X N., Shi C Z., Ma J., Zhu B., Li M., Wang J., Yang S Y., and Kang N. 2013. Aerosol optical 1410
properties during firework, biomass burning and dust episodes in Beijing. Atmospheric 1411
Environment, 81: 475-484. 1412
Yuan J., Xing Y Q., Yang Y N., Ai M., Yang A H., and Zhou L H. 2010. Clinical analysis of 1413
firework-related ocular injuries during Spring Festival 2009. Graefe's Archive for Clinical and 1414
Experimental Ophthalmology, 248(3): 333-338. 1415
Zhang J J., Qin J., Li Q., Lin H P., Yu Y J., and Meng W. 2011. Investigation on female thyroid 1416
function in fireworks and crackers production area. Epidemiology, 22(1): S172. 1417
Zhang J., Li W T., Han J C., Xin Y J., Wang F. 2013. Analyze the effect of firecracker setting-off on 1418
the SO2 and PM10 in Xi’an. Urban Construction Theory Research, (14):1-5. 1419
Zhang M., Wang X M., Chen J M., Cheng T T., Wang T., Yang X., Gong Y G., Geng F H., and Chen 1420
C H. 2010. Physical characterization of aerosol particles during the Chinese New Year’s 1421
firework events. Atmospheric Environment, 44(39): 5191-5198. 1422
Zhang N., Li L L., Zhang D J., and Li R. 2013. The research on the perchloric acid in aerosol of the 1423
urban and the environmental background point polluted by setting off fireworks. Arid 1424
Environmental Monitoring, 1: 01-5. 1425
Zhang N., Li L L., Zhao R F., Yin H., and Niu W J. 2013. Research of fireworks aerosol pollution on 1426
the ground clean water. Arid Environmental Monitoring, 27(3): 104-109. 1427
Zhang N., Zhang X., Yuan Y., Liu X J., Dong J X., and Li L P. 2010. Research on pollution 1428
characterization of polycyclic aromatic hydrocarbons and the water-soluble inorganic ions in 1429
atmospheric aerosols during the firecrackers periods[J]. Journal of Safety and Environment, 1430
Page 65 of 87
https://mc06.manuscriptcentral.com/er-pubs
Environmental Reviews

Draft
10(6): 105-109. 1431
Zhang X L., Xu J., and Li L P.. 2008. Effect of fireworks burning on air quality under different 1432
meteorological conditions. Journal of Meteorology and Environment, 24: 6-12. 1433
Zhao H. 2012. Study on the environmental pollution of fireworks and firecrackers during the Spring 1434
Festival in Xi’an. Xi’an: Northwest University. 1435
Zhao J P., Xu Y., Zhang F W., and Chen J S. 2011. Atmospheric pollution characteristic during 1436
fireworks burning time in spring festival in Quanzhou suburb. Environmental Science, 32(5): 1437
1224-1230. 1438
Zhao S P., Yu Y., He J J., Liu N., Chen J B., and Chen X. 2012. Concentration and size distribution 1439
of aerosol particles during 2011 Spring Festival in Lanzhou. China Environmental Science, 1440
32(11): 1939-1947. 1441
Zhao S P., Yu Y., Yin D Y., Liu N., and He J j. 2014. Ambient particulate pollution during Chinese 1442
Spring Festival in urban Lanzhou, Northwestern China. Atmospheric Pollution Research, 1443
5(2):335-343. 1444
Zheng J., Tan M G., Shibata Y., Tanaka A., Li Y., Zhang G L., Zhang Y M., Shan Z C. 2004. 1445
Characteristics of lead isotope ratios and elemental concentrations in PM10 fraction of airborne 1446
particulate matter in Shanghai after the phase-out of leaded gasoline. Atmospheric 1447
Environment, 38(8): 1191-1200. 1448
Zhong Y C. 2011. Characterization of chemical compositions and size distributions in ambient 1449
aerosols during the Folk Festival events. Chia Nan University of Pharmacy and Science. 1450
Zhou B H., Zhang C Z., and Wang G H. 2013. Study on pollution characteristics of carbonaceous 1451
aerosols in Xi'an City during the Spring Festival. Environmental Science, 34(2): 448-454. 1452
Page 66 of 87
https://mc06.manuscriptcentral.com/er-pubs
Environmental Reviews
Draft
Zhou B H., Wang G H., Zhang C Z., and Shi W G. 2013. Pollutions characteristics of water-souble 1453
ions of fine particle during spring festival over Xi'an southern. Environmental Chemistry, 32(3): 1454
498-504. 1455
Zou Q., Yao Y G., Ding M., Zhang X H., and Ding H D. 2014. Characteristics of water-soluble ions 1456
bounded in PM2.5 during Spring Festival in Suzhou City. Environmental Monitoring 1457
Management and Technology, 26(2):26-29. 1458
1459
1460
1461
1462
1463
1464
1465
1466
1467
1468
1469
1470
1471
1472
1473
1474
1475
1476
1477
1478
1479
1480
Page 67 of 87
https://mc06.manuscriptcentral.com/er-pubs
Environmental Reviews
Draft
Figure 1 Temporal and spatial patterns of publications referring to fireworks: (a) the time-series; (b) 1481
classified by country. 1482
Figure 2 Compilation of festivals reported in previous publications. 1483
Figure 3 Geographic and health effect distribution of studied firework events in previous publications. The 1484
red stars represent the cities with studies on the characteristics of fireworks; the yellow circles represent 1485
the countries with studies on firework-related injuries. 1486
Figure 4(a) Mean number size distribution affected by the burning of fireworks in different publications; (b) 1487
Mean volume size distribution affected by the burning of fireworks in different publications; (c) Mean 1488
number size distribution affected by the burning of fireworks in different publications in 2009, Shanghai; 1489
(d) Mean number size distribution affected by the burning of fireworks in different publications in 2012, 1490
Nanjing. 1491
Figure 5 Mass-size distributions of particulates emitted from fireworks during Mascletà and background 1492
days for K, S, Cu and Ca, which adopted from Crespo et al. (2012). 1493
Figure 6 The morphology of particles in flash powder and particles emitted from fireworks burning 1494
(Further merged from Figure 2a. of Azhagurajan et al. (2014), Figure 1a. of Agrawal et al. (2011), Figure 1495
4. and Figure 7. of Grima et al. (2012)) 1496
Figure 7 The concentration of water-soluble ions in particles emitted from fireworks during pre-burning, 1497
burning and post-burning days (µg/m3). More detailed information is provided in water-soluble 1498
concentrations of the supplement. 1499
Figure 8 The concentration of elements in particles emitted from fireworks during pre-burning, burning 1500
and post-burning days (ng/m3). More detailed information is provided in elements concentrations of the 1501
supplemental database. 1502
Figure 9 Temporal variations of pollutants and meteological conditions in different cities during New 1503
Year’s Eve, 2016. (a-b): Conditional-burning cities; (c-d): Banned-burning cities. 1504
Page 68 of 87
https://mc06.manuscriptcentral.com/er-pubs
Environmental Reviews

Draft
Table 1 Compilation of the mass and number concentrations of TSP particles during firework events (µg/m3)
Festival City Date
TSP
Reference Mean
(BG value)
Max
(pre-days)
Min
(post-days)
Spring Festival Dalian, China 1990-1994† 30200 39800 23760 Sun et al. 1995
Spring Festival Lanzhou, China Jan 31-Mar 5, 2007 459(437) Li et al. 2008
Spring Festival Lanzhou, China Jan 31-Mar 5, 2007 590 1170 90 Zhang et al. 2013
Diwali Festival Hisar, India Dec, 1999 455.8 (360.1) (375.1) Ravindra et al. 2003
Diwali Festival Delhi, India 2002-2007† 425.3 (195.1) (254) Singh et al. 2010
Diwali Festival Unknown Nov 10-15, 2012 1.2×10⁵ $ (0.7×10⁵ $) (0.8×10⁵ $) Pervez et al. 2015
Diwali Festival Delhi, India Oct 16-21, 2009 571.1 852.0 430.1 Agrawal et al. 2011
Diwali Festival Agra, India Feb, 2009-Jun, 2010 330.5 Pachauri et al. 2013
Diwali Festival Jhansi, India Nov 1-5, 2013# 670.8(235.9) (243.0) (255.9) Chauhan et al. 2014
Hoili Festival Agra, India Feb, 2009-Jun, 2010 414.1 Pachauri et al. 2013
Millennium Leipzig, Germany Dec 31, 1999-Jan 1, 2000 40.5 244.0 6.4 Wehner et al. 2000
† Average value for multiple years, for more detailed information for each year see TSP concentrations of the supplement.al database.
# Average value for commercial and residential areas. More detailed information is listed in TSP concentrations of the supplemental database.
$ The unit of these data is particles/cm3
BG value: background value
Table 2 Compilation of the mass and number concentrations for PM10 particles during firework events (µg/m3)
Festival City Date
PM10
Reference Mean
(BG value)
Max
(pre-days)
Min
(post-days)
Midautumn Festival Tainan, Taiwan Sep 7-27, 2011 25.4 Tsai et al. 2015
New Year's Eve Wuhan, China Feb, 2013 96.6 526.5 42.3 Han et al. 2014
Spring Festival Lanzhou, China Jan 31-Mar 5, 2007 470 1140 160 Zhang et al. 2013
Spring festival Shanghai, China Jan 25-Feb 12, 2009 89.8 1000 4.2 Huang et al. 2012
Spring Festival Lanzhou, China Jan 31-Mar 5, 2007 349(225) Li et al. 2008
Spring Festival Dandong, China Jan 24-Feb 11, 2009 88 132 53 Liang et al. 2013
Spring Festival Tianjin, China Jan 30-Feb 24, 2013 220.1 567.4 56 Shi et al. 2014
Spring Festival Xi'an, China 2002-2007† 212.7 (144.5) (131.9) Wang et al. 2008
Spring Festival Shenyang, China Jan 29-Feb 16, 2008 160 400 20 Hong et al. 2010
Spring Festival Hohhot, China 2005-2009† 182.9 777.4 45.2 Han et al. 2010
Spring Festival Dandong, China Feb 17-19, 2007 100 Li et al. 2009
Spring Festival Dandong, China Feb 6-8, 2008 187 Li et al. 2009
Page 69 of 87
https://mc06.manuscriptcentral.com/er-pubs
Environmental Reviews

Draft
Spring Festival Zhengzhou, China 2014 365 1000 32 Liu et al. 2014
Spring Festival Nanning, China Feb 2-20, 2011 145 276 19 Yan et al. 2011
Spring Festival Tianjin, China Jan 30-Feb 24, 2013 213 Tian et al. 2014
Lantern festival Beijing, China Feb 12-15, 2006 338.4 466.2 85.6 Wang et al. 2007
Lantern festival Beijing, China Feb 17-18, 2011 469.3 687 23 He et al. 2012
Busan Culture Busan, Korea 2011-2013† 29.0 Shon et al. 2015
New Year's Eve Nagpur, India Dec 28, 2008-Jan 3, 281 430 131.6 Khaparde et al. 2012
Diwali Festival Jhansi, India Nov 1-5, 2013# 349.9 (116.5) 124.5 133.3 Chauhan et al. 2014
Diwali Festival Hisar, India Dec, 1999 174.5 134.4 167.8 Ravindra et al. 2003
Diwali Festival Lucknow, India Oct 31-Nov 2, 2005 753.3 963.3 527.5 Barman et al. 2008
Diwali Festival Delhi, India 2002-2007† 286.4 (122.1) (167.8) Singh et al. 2010
Diwali Festival Delhi, India Oct 27-31, 2008 767 (276) (282) Perrino et al. 2011
Diwali Festival Delhi, India Oct 16-29, 2009 620 (394) (278) Perrino et al. 2011
Diwali Festival Kolkata, India Nov, 2010 542.5(137.5) (261) (487.5) Chatterjee. 2013
Diwali Festival eastern India Oct-Nov, 2011 555.5 (212.8) (284.4) Nirmalker et al. 2013
Diwali Festival Delhi, India Oct 9-18, 2009 507.2 (244.3) (346.7) (339.8) Sarkar et al. 2010
Diwali Festival Delhi, India 2010-2013† 864(336) Ganguly et al. 2015
Diwali Festival Jabalpur, India 2012-2014† 128 (93.6) (103.1) Srivastava et al. 2015
Diwali Festival Nagpur, India Oct 25-Nov 6, 2008 283.7 526.2 166.8 Khaparde et al. 2012
Diwali Festival Brahmaputra, 2009 49.8 Deka et al. 2013
Diwali Festival Salkia, India Nov 7-25, 2008 2237.3 (529.1) (538.0) Thakur et al. 2010
Diwali Festival Nagpur, India Oct 22-28, 2011 930 (251.1) (591.9) Rao et al. 2012
Vishnu Festival Kannur, India Apr 12-17, 2011 71.2 118.3 52.0 Nishanth et al. 2012
Festas Malta Jul-Oct, 2005 38.9 58 25.1 Camilleri et al. 2010
Festas Gozo, Malta Jul-Oct, 2005 20.5 39.6 10.2 Camilleri et al. 2010
Las Fallas Valencia, Spain Mar 15-20, 2005 79 (37.7) (41.5) Moreno et al. 2007
2006 FIFA World Milan, Italy Jul 10, 2006 63.9(29.3) Vecchi et al. 2008
† Average values for multiple years, for detailed information for each year see PM10 concentrations of the supplement.al database.
# Average values for commercial and residential areas, for more detailed information for each area see PM10 concentrations of the supplemental database.
BG value: background value.
Page 70 of 87
https://mc06.manuscriptcentral.com/er-pubs
Environmental Reviews

Draft
Table 3 Compilation of the mass and number concentrations of PM2.5 particles during firework events (µg/m3)
Festival City Date PM2.5
Reference
Mean Max (pre) Min(post)
New Year's Eve Wuhan, China Feb, 2013 75.2 216.9 31.8 Han et al. 2014
New Year Jinan, China Jan 27-Feb 8, 2011 183.0 217 117 Li et al. 2013
Spring Festival Tianjin, China Jan 30-Feb 24, 2013 153.0 430.6 32.6 Shi et al. 2014
Spring Festival Beijing, China 2010-2013† 139.2 773.0 5.9 Ye et al. 2015
Spring Festival Zhengzhou, China 2014 173 500 17 Liu et al. 2014
Spring Festival Nanjing, China Jan 24-Feb 21, 2014 318 (119.6) (88.9) Kong et al. 2014
Spring Festival Jinan, China 2008 464.0 Yang et al. 2014
Spring Festival Suzhou, China Feb 9-15, 2013 100.9 592.1 21.1 Zou et al. 2014
Spring Festival Shanghai, China Jan 25-Feb 12, 2009 61.5 950 2.11 Huang et al. 2012
Spring Festival Shanghai, China Jan 21 –Feb 6, 2009 91 382 33 Feng et al. 2012
Spring Festival Chengdu, China Feb 10-28, 2010 155.5 321.8 42.2 Tang et al. 2013
Spring Festival Tianjin, China Jan 30-Feb 24, 2013 140.6 Tian et al. 2014
Lantern Festival Nanjing, China Feb 14, 2014 118.4 Kong et al. 2015
Lantern Festival Beijing, China Feb 12-15, 2006 122.7 184.3 26.1 Wang et al. 2007
Diwali Festival Delhi, India Oct 27-31, 2008 448 (94) (110) Perrino et al. 2011
Diwali Festival Delhi, India Oct 16-29, 2009 365 (148) (135) Perrino et al. 2011
Diwali Festival Jabalpur, India 2012-2014† 87.3 (53.4) (72.1) Srivastava et al. 2015
Diwali Festival eastern India Oct-Nov, 2011 395.4 (136.7) (98.6) Nirmalker et al. 2013
Diwali Festival Nagpur, India Oct 22-28, 2011 271 (139.0) (251.1) Rao et al. 2012
Diwali Festival Salkia, India Nov 7-25, 2008 1199.7 (388.1) (344.1) Thakur et al. 2010
Fireworks event Nagpur, India 4464472$ (1344598)$ (1118739)$ Majumdar et al. 2011
International fireworks
Competition Montréal, Canada Jun-Jul, 2007 6378.6 9941.2 3215.7 Joly et al. 2010
Independence Day Ogden, USA Jul 4, 2006-2013 61 96 17 Seidel et al. 2015
Mascletàs Alicante, Spain Jun 19-24, 2013 629 1261 41 Caballero et al. 2015
New Year Mainz, Germany Dec 28, 2004-Jan 4, 2005 111.4 611.1 3.4 Dreunick et al. 2006
$ The units of these data are particles/L
† Average values for multi-years. More detailed information for each year are included in PM2.5 concentrations of the supplemental database.
Page 71 of 87
https://mc06.manuscriptcentral.com/er-pubs
Environmental Reviews

Draft
Table 4 The ratios of TSP, PM10, PM2.5, and PM1.0 particles during different firework events
Festival City Date PM10/TSP PM2.5/PM10 PM1.0/PM2.5
Reference
(pre, post) (pre, post) (pre, post)
Lantern festival Beijing, China Feb 12-15, 2006 0.76
Wang et al. 2007 (0.70,0.59)
Spring Festival Beijing, China Jan 31-Feb 25, 2003 0.71 Xu et al. 2006
Spring Festival Nanjing, China Jan 19-31, 2012 0.6 0.68 Wang et al. 2014
Spring Festival Chengdu, China Feb 9-14, 2013 0.75 He et al. 2014
New Year’s Eve Wuhan, China Feb, 2013 0.78
Han et al. 2014 (0.41,0.75)
Spring festival Tianjin, China Jan 30-Feb 24, 2013 0.76
Shi et al. 2014 (0.70,0.58)
Lantern festival Yanshui, Taiwan Feb 21-25, 2013 0.76 0.73
Lin et al. 2014 (0.63,0.68) (0.71,0.42)
Diwali Festival eastern India Oct-Nov, 2011 0.71 0.53
Nirmalker et al. 2013 (0.64,0.35) (0.33,0.59)
Diwali Festival Delhi, India 2002 0.63
Singh et al. 2010 (0.67,0.60)
Diwali Festival Delhi, India 2003 0.61
Singh et al. 2010 (1.06,0.76)
Diwali Festival Delhi, India 2004 0.60
Singh et al. 2010 (0.52,0.61)
Diwali Festival Delhi, India 2005 0.83
Singh et al. 2010 (0.54,0.70)
Diwali Festival Delhi, India 2006 0.86
Singh et al. 2010 (0.84,0.85)
Diwali Festival Delhi, India 2007 0.66
Singh et al. 2010 (0.41,0.57
Diwali Festival Jabalpur, India Nov 10-16, 2012 0.75
Srivastava et al. 2015 (0.58,0.79)
Diwali Festival Jabalpur, India Oct 31-Nov 6, 2013 0.62
Srivastava et al. 2015 (0.57,0.66)
Diwali Festival Jabalpur, India Oct 20-26, 2014 0.67
Srivastava et al. 2015 (0.55,0.61)
Diwali Festival Jhansi, India Nov 1-5, 2013 0.53
Chauhan et al. 2014 (0.51,0.52)
Diwali Festival Hisar, India Dec, 1999 0.38
Ravindra et al. 2003 (0.37,0.45)
Diwali Festival Salkia, India Nov 7-25, 2008 0.76
Thakur et al. 2010 (0.70,0.58)
Page 72 of 87
https://mc06.manuscriptcentral.com/er-pubs
Environmental Reviews
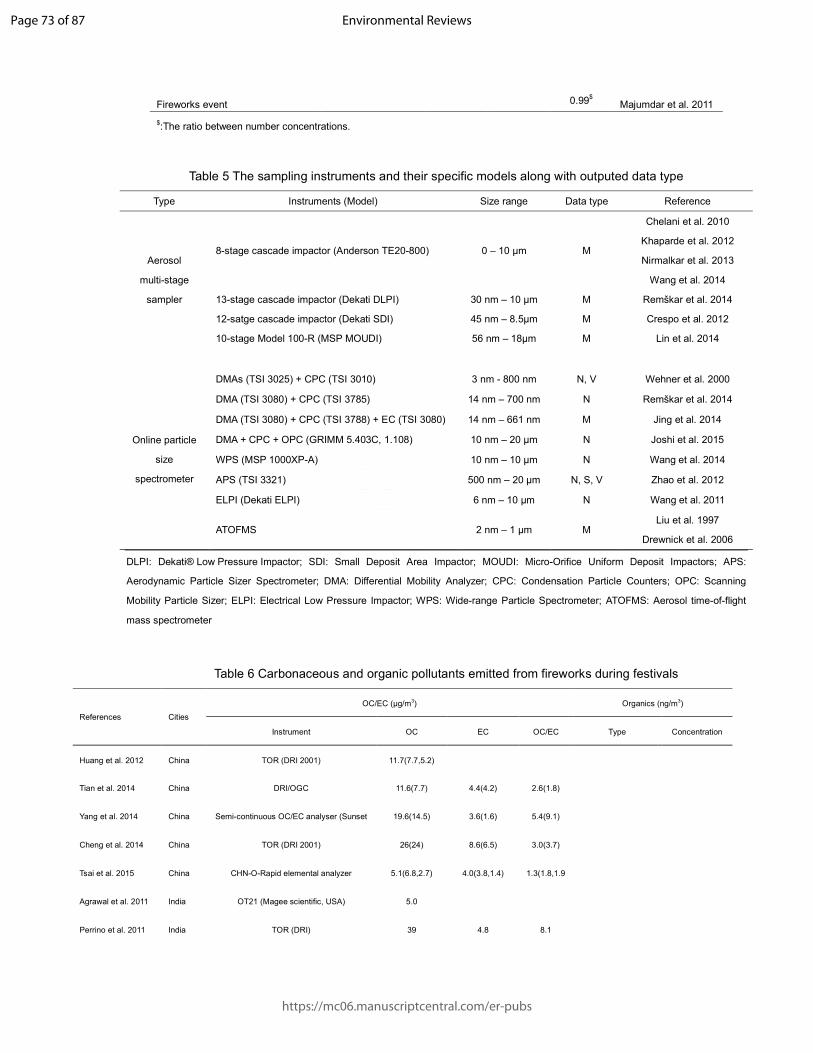
Draft
Fireworks event 0.99$ Majumdar et al. 2011
$:The ratio between number concentrations.
Table 5 The sampling instruments and their specific models along with outputed data type
Type Instruments (Model) Size range Data type Reference
Aerosol
multi-stage
sampler
8-stage cascade impactor (Anderson TE20-800) 0 – 10 µm M
Chelani et al. 2010
Khaparde et al. 2012
Nirmalkar et al. 2013
Wang et al. 2014
13-stage cascade impactor (Dekati DLPI) 30 nm – 10 µm M Remškar et al. 2014
12-satge cascade impactor (Dekati SDI) 45 nm – 8.5µm M Crespo et al. 2012
10-stage Model 100-R (MSP MOUDI) 56 nm – 18µm M Lin et al. 2014
Online particle
size
spectrometer
DMAs (TSI 3025) + CPC (TSI 3010) 3 nm - 800 nm N, V Wehner et al. 2000
DMA (TSI 3080) + CPC (TSI 3785) 14 nm – 700 nm N Remškar et al. 2014
DMA (TSI 3080) + CPC (TSI 3788) + EC (TSI 3080) 14 nm – 661 nm M Jing et al. 2014
DMA + CPC + OPC (GRIMM 5.403C, 1.108) 10 nm – 20 µm N Joshi et al. 2015
WPS (MSP 1000XP-A) 10 nm – 10 µm N Wang et al. 2014
APS (TSI 3321) 500 nm – 20 µm N, S, V Zhao et al. 2012
ELPI (Dekati ELPI) 6 nm – 10 µm N Wang et al. 2011
ATOFMS 2 nm – 1 µm M Liu et al. 1997
Drewnick et al. 2006
DLPI: Dekati® Low Pressure Impactor; SDI: Small Deposit Area Impactor; MOUDI: Micro-Orifice Uniform Deposit Impactors; APS:
Aerodynamic Particle Sizer Spectrometer; DMA: Differential Mobility Analyzer; CPC: Condensation Particle Counters; OPC: Scanning
Mobility Particle Sizer; ELPI: Electrical Low Pressure Impactor; WPS: Wide-range Particle Spectrometer; ATOFMS: Aerosol time-of-flight
mass spectrometer
Table 6 Carbonaceous and organic pollutants emitted from fireworks during festivals
References Cities
OC/EC (µg/m3) Organics (ng/m3)
Instrument OC EC OC/EC Type Concentration
Huang et al. 2012 China TOR (DRI 2001) 11.7(7.7,5.2)
Tian et al. 2014 China DRI/OGC 11.6(7.7) 4.4(4.2) 2.6(1.8)
Yang et al. 2014 China Semi-continuous OC/EC analyser (Sunset 19.6(14.5) 3.6(1.6) 5.4(9.1)
Cheng et al. 2014 China TOR (DRI 2001) 26(24) 8.6(6.5) 3.0(3.7)
Tsai et al. 2015 China CHN-O-Rapid elemental analyzer 5.1(6.8,2.7) 4.0(3.8,1.4) 1.3(1.8,1.9
Agrawal et al. 2011 India OT21 (Magee scientific, USA) 5.0
Perrino et al. 2011 India TOR (DRI) 39 4.8 8.1
Page 73 of 87
https://mc06.manuscriptcentral.com/er-pubs
Environmental Reviews
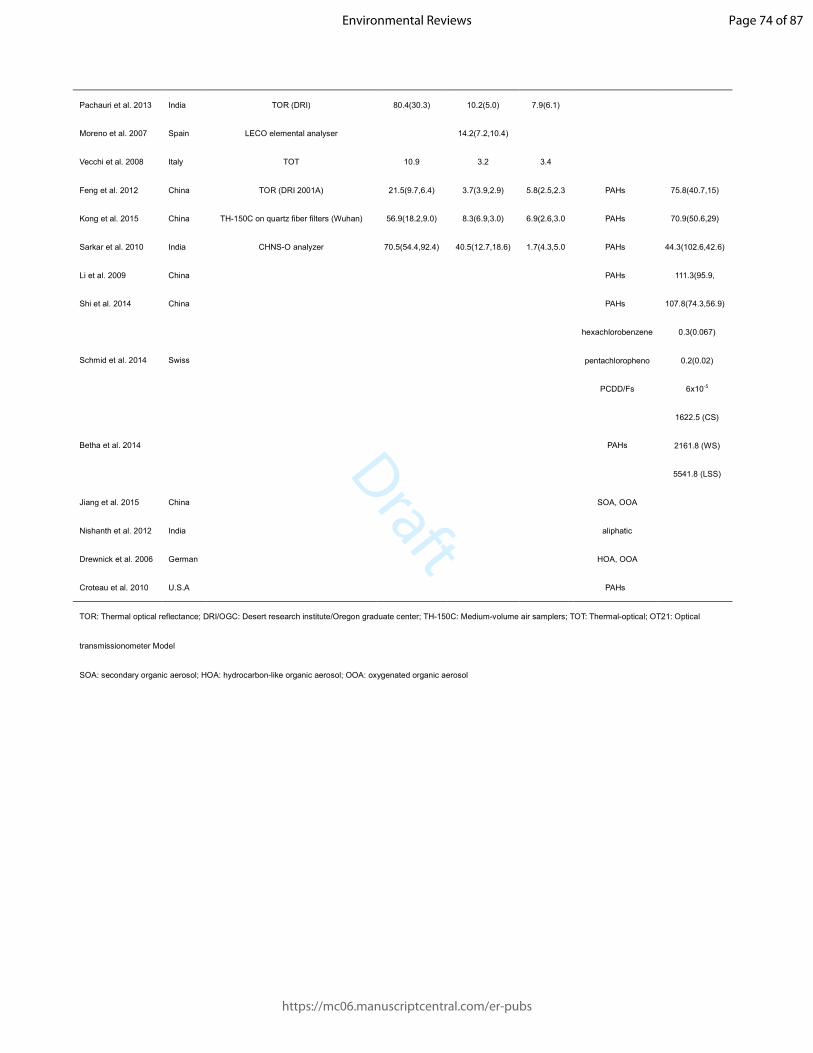
Draft
Pachauri et al. 2013 India TOR (DRI) 80.4(30.3) 10.2(5.0) 7.9(6.1)
Moreno et al. 2007 Spain LECO elemental analyser 14.2(7.2,10.4)
Vecchi et al. 2008 Italy TOT 10.9 3.2 3.4
Feng et al. 2012 China TOR (DRI 2001A) 21.5(9.7,6.4) 3.7(3.9,2.9) 5.8(2.5,2.3 PAHs 75.8(40.7,15)
Kong et al. 2015 China TH-150C on quartz fiber filters (Wuhan) 56.9(18.2,9.0) 8.3(6.9,3.0) 6.9(2.6,3.0 PAHs 70.9(50.6,29)
Sarkar et al. 2010 India CHNS-O analyzer 70.5(54.4,92.4) 40.5(12.7,18.6) 1.7(4.3,5.0 PAHs 44.3(102.6,42.6)
Li et al. 2009 China PAHs 111.3(95.9,
Shi et al. 2014 China PAHs 107.8(74.3,56.9)
Schmid et al. 2014 Swiss
hexachlorobenzene 0.3(0.067)
pentachloropheno 0.2(0.02)
PCDD/Fs 6x10⁻⁵
Betha et al. 2014
PAHs
1622.5 (CS)
2161.8 (WS)
5541.8 (LSS)
Jiang et al. 2015 China SOA, OOA
Nishanth et al. 2012 India aliphatic
Drewnick et al. 2006 German HOA, OOA
Croteau et al. 2010 U.S.A PAHs
TOR: Thermal optical reflectance; DRI/OGC: Desert research institute/Oregon graduate center; TH-150C: Medium-volume air samplers; TOT: Thermal-optical; OT21: Optical
transmissionometer Model
SOA: secondary organic aerosol; HOA: hydrocarbon-like organic aerosol; OOA: oxygenated organic aerosol
Page 74 of 87
https://mc06.manuscriptcentral.com/er-pubs
Environmental Reviews
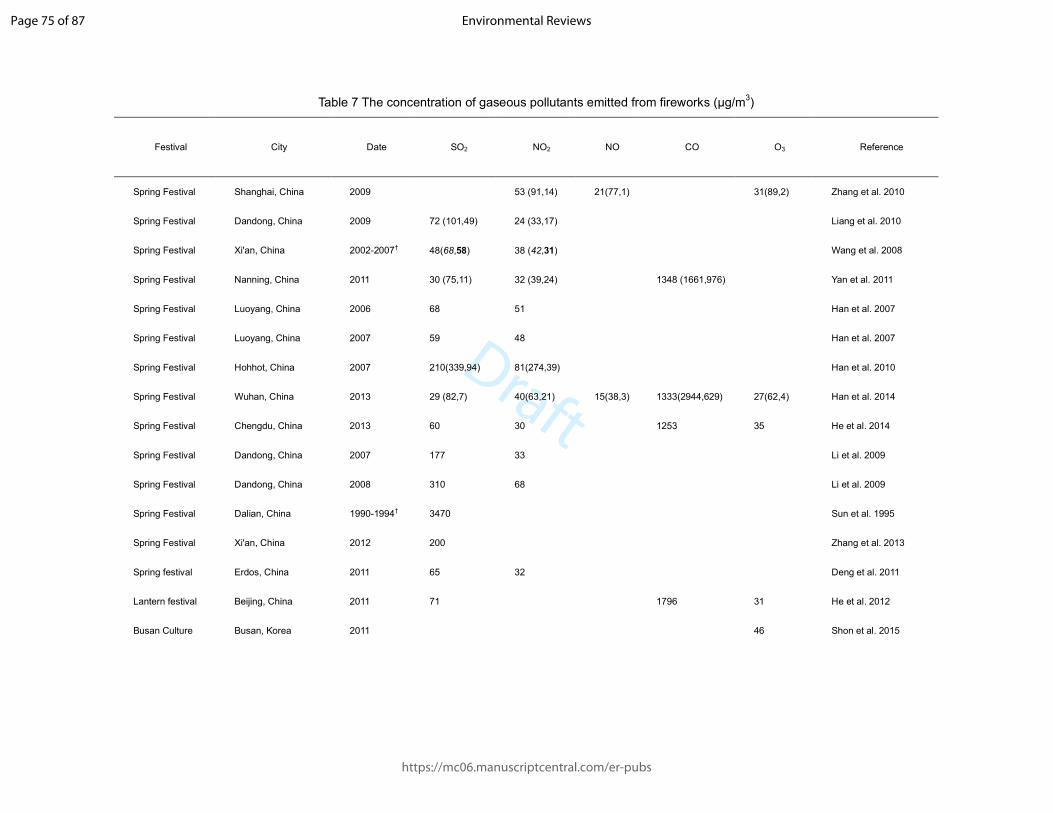
Draft
Table 7 The concentration of gaseous pollutants emitted from fireworks (µg/m3)
Festival City Date SO2 NO2 NO CO O3 Reference
Spring Festival Shanghai, China 2009 53 (91,14) 21(77,1) 31(89,2) Zhang et al. 2010
Spring Festival Dandong, China 2009 72 (101,49) 24 (33,17) Liang et al. 2010
Spring Festival Xi'an, China 2002-2007† 48(68,58) 38 (42,31) Wang et al. 2008
Spring Festival Nanning, China 2011 30 (75,11) 32 (39,24) 1348 (1661,976) Yan et al. 2011
Spring Festival Luoyang, China 2006 68 51 Han et al. 2007
Spring Festival Luoyang, China 2007 59 48 Han et al. 2007
Spring Festival Hohhot, China 2007 210(339,94) 81(274,39) Han et al. 2010
Spring Festival Wuhan, China 2013 29 (82,7) 40(63,21) 15(38,3) 1333(2944,629) 27(62,4) Han et al. 2014
Spring Festival Chengdu, China 2013 60 30 1253 35 He et al. 2014
Spring Festival Dandong, China 2007 177 33 Li et al. 2009
Spring Festival Dandong, China 2008 310 68 Li et al. 2009
Spring Festival Dalian, China 1990-1994† 3470 Sun et al. 1995
Spring Festival Xi'an, China 2012 200 Zhang et al. 2013
Spring festival Erdos, China 2011 65 32 Deng et al. 2011
Lantern festival Beijing, China 2011 71 1796 31 He et al. 2012
Busan Culture Busan, Korea 2011 46 Shon et al. 2015
Page 75 of 87
https://mc06.manuscriptcentral.com/er-pubs
Environmental Reviews

Draft
Busan Culture Busan, Korea 2012 47 Shon et al. 2015
Busan Culture Busan, Korea 2013 48 Shon et al. 2015
Vishu festival Kannur, India 2010 3(6,1) 2 35(76,8) Nishanth et al. 2012
Vishu festival Kannur, India 2011 5(10,2) 2 21(71,7) Nishanth et al. 2012
Diwali Festival Rajnandgaon, India 2011 13(10,12) 100(88,93) Ambade et al. 2013
Diwali Festival Nagpur, India Oct 22-28 17 70 Rao et al. 2012
Diwali Festival Lucknow, India 2005 139(120,164) Barman et al. 2008
Diwali Festival Jhansi, India 2013 30(10,11) 60(22,21) Chauhan et al. 2014
Diwali Festival Delhi, India 2004 41(83,11) Ganguly et al. 2009
Diwali Festival Delhi, India 2006 92 4729 63 (180,22) Ganguly et al. 2009
Diwali Festival Dibrugarh, India 2012 8(16,3) 12(31,2) 94 940 (2191,140) 25(55,2) Pathak et al. 2013
Diwali Festival Hisar, India 1999 17 (12,9) 26 (19,38) Ravindra et al. 2003
Diwali Festival Delhi, India 2002-2007† 50(13,29) 62 (25,33) Singh et al. 2010
Diwali Festival Salkia, India 2008 12 (10,10) 98(86,80) Thakur et al. 2010
Diwali Festival Hyderabad, India 2009-2011† 15(11,17) 26 (24,36) Yerramsetti et al. 2013
Diwali Festival Delhi, India 2010 53 Ganguly et al. 2015
Diwali Festival Delhi, India 2014 669(860,524) 86 (160,56) Ganguly et al. 2015
Diwali Festival Jabalpur, India 2012 43(30,32) 470 (331,370) Srivastava et al. 2015
Diwali Festival Jabalpur, India 2013 20 (18,24) 150 (150,141) Srivastava et al. 2015
Page 76 of 87
https://mc06.manuscriptcentral.com/er-pubs
Environmental Reviews

Draft
Diwali Festival Jabalpur, India 2014 19(11,15) 301(300,290) Srivastava et al. 2015
Millennium Leipzig, Germany 1999- 2000 6 Wehner et al. 2000
Mascletàs Alicante, Spain 2013 20 (178,0) 559 51(153,9) Caballero et al. 2015
† Average values for multi-years. More detailed information for each year seen gaseous concentrations of the supplemental database.
The italics represented the value before festivals or celebrations and the bold represented the value after festivals or celebrations.
Page 77 of 87
https://mc06.manuscriptcentral.com/er-pubs
Environmental Reviews

Draft
Table 8 Summary of reported noise levels during firework events around the world
Festival City Date Noise(dB)
Reference during(D,N)m pre(D,N)m post(D,N)m
Spring
Festival
Dandong, China Feb 17-18, 2007 80
Li et al.2009
(108,66)
Spring
Festival
Dalian, China 1990-1994 103
Sun et al.1995
(110,86)
Diwali Festival Kolhapur, India Oct 17-19, 2009 71
Lad et al. 2012
(70,72)
Diwali Festival Rajasthan, India Nov, 2010 73 63
Mahecha et al. 2012
(68,78) (64,63)
Diwali Festival Delhi, India 2006-2008 78 Mandal et al. 2012
Diwali Festival Rajnandgaon, India(R) Oct 24-28, 2011 97 87 84
Ambade et al. 2013
(105,89) (97,77) (99,67)
Mascletàs Alicante, Spain Jun 19-24, 2007 120 Crespo et al. 2012
Table 9 Daily exposure values (mg kg−1
day−1
) and health risks of heavy metals.
Elements Dinh of children Dinh of adult LADD HIchildren HIadult Rt
Zn 1.15E-06 6.51E-07 1.81E-06 3.83E-06 2.16E-06
Sr 5.71E-07 3.22E-07 8.94E-07 1.90E-03 1.07E-03
Ba 1.99E-07 1.12E-07 3.11E-07 1.39E-03 7.85E-04
Mn 3.14E-07 1.77E-07 4.91E-07 4.49E-05 2.53E-05
Cr 3.28E-08 1.85E-08 5.13E-08 1.15E-03 6.47E-04 2.15E-06
As 5.98E-08 3.37E-08 9.35E-08
9.16E-07
Cu 5.04E-07 2.84E-07 7.89E-07 1.25E-05 7.07E-06
Pb 1.43E-06 8.09E-07 2.24E-06 4.08E-04 2.30E-04
∑ 4.26E-06 2.41E-06 6.68E-06 3.52E-03 1.98E-03 2.29E-06
Dinh represented the exposure by respiratory inhalation, mg kg-1 day-1.
HIchildren and HIadult are represented the hazard index of children and adult, respectively.
Page 78 of 87
https://mc06.manuscriptcentral.com/er-pubs
Environmental Reviews

Draft
172x65mm (300 x 300 DPI)
Page 79 of 87
https://mc06.manuscriptcentral.com/er-pubs
Environmental Reviews
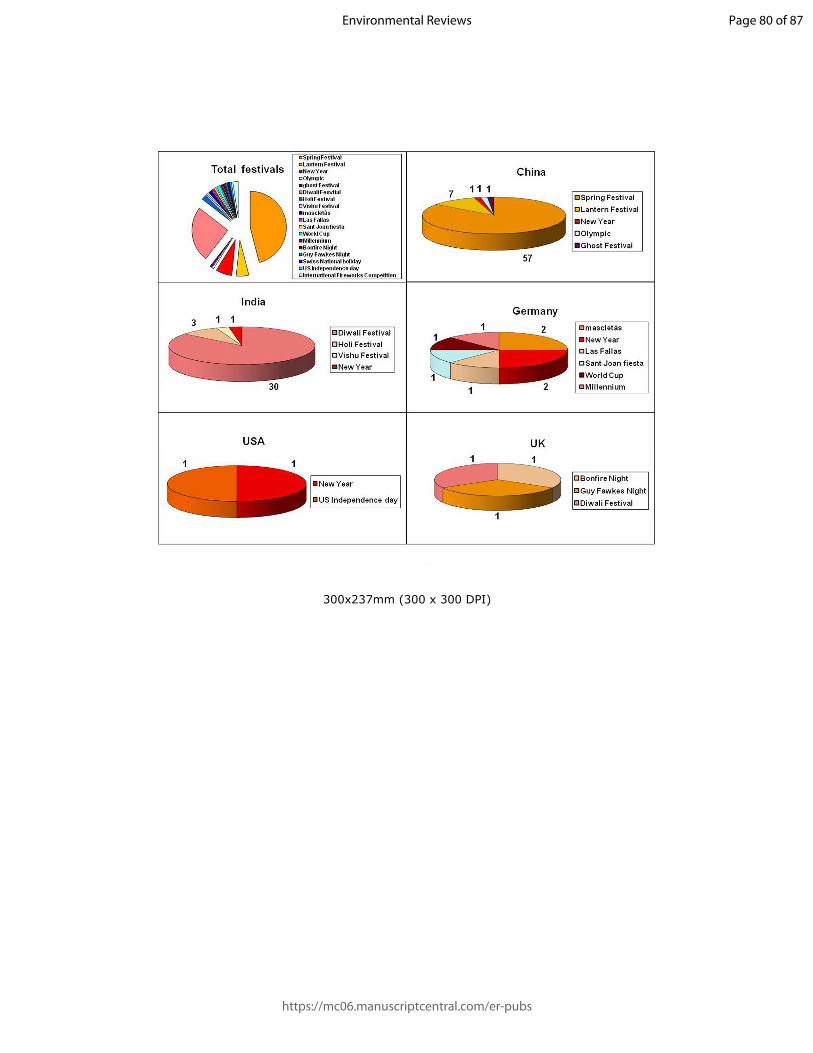
Draft
300x237mm (300 x 300 DPI)
Page 80 of 87
https://mc06.manuscriptcentral.com/er-pubs
Environmental Reviews

Draft
101x70mm (300 x 300 DPI)
Page 81 of 87
https://mc06.manuscriptcentral.com/er-pubs
Environmental Reviews

Draft
393x337mm (300 x 300 DPI)
Page 82 of 87
https://mc06.manuscriptcentral.com/er-pubs
Environmental Reviews
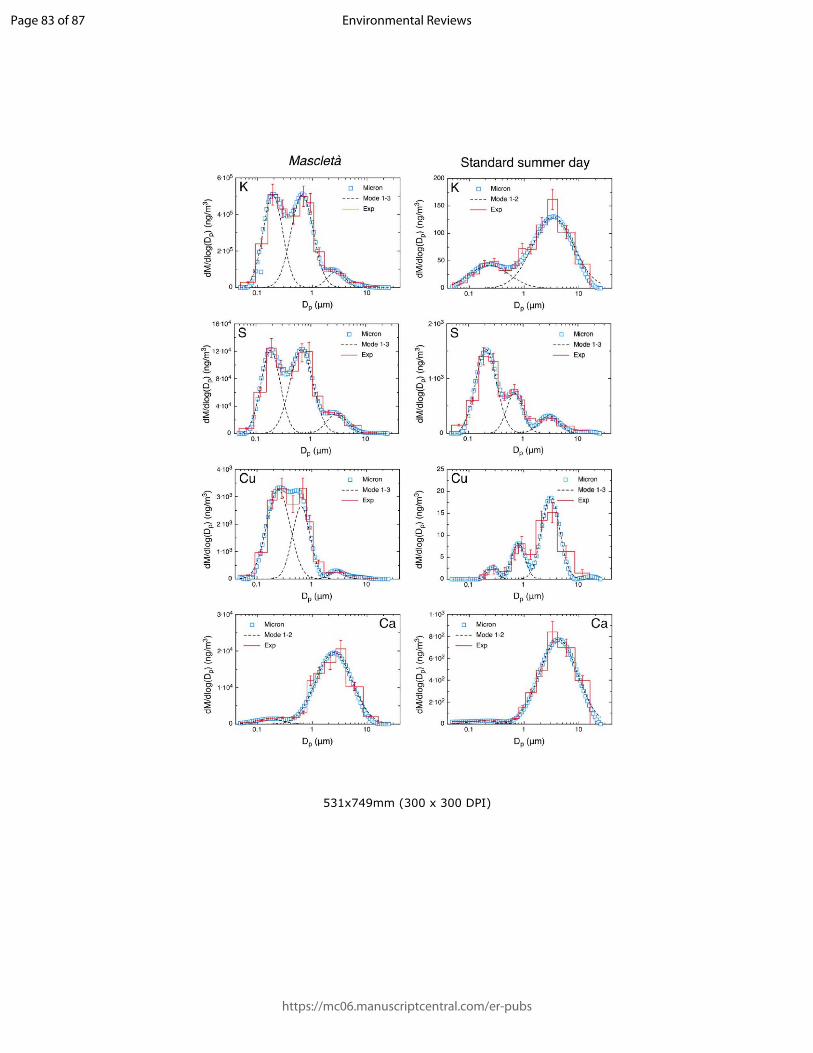
Draft
531x749mm (300 x 300 DPI)
Page 83 of 87
https://mc06.manuscriptcentral.com/er-pubs
Environmental Reviews

Draft
431x185mm (300 x 300 DPI)
Page 84 of 87
https://mc06.manuscriptcentral.com/er-pubs
Environmental Reviews
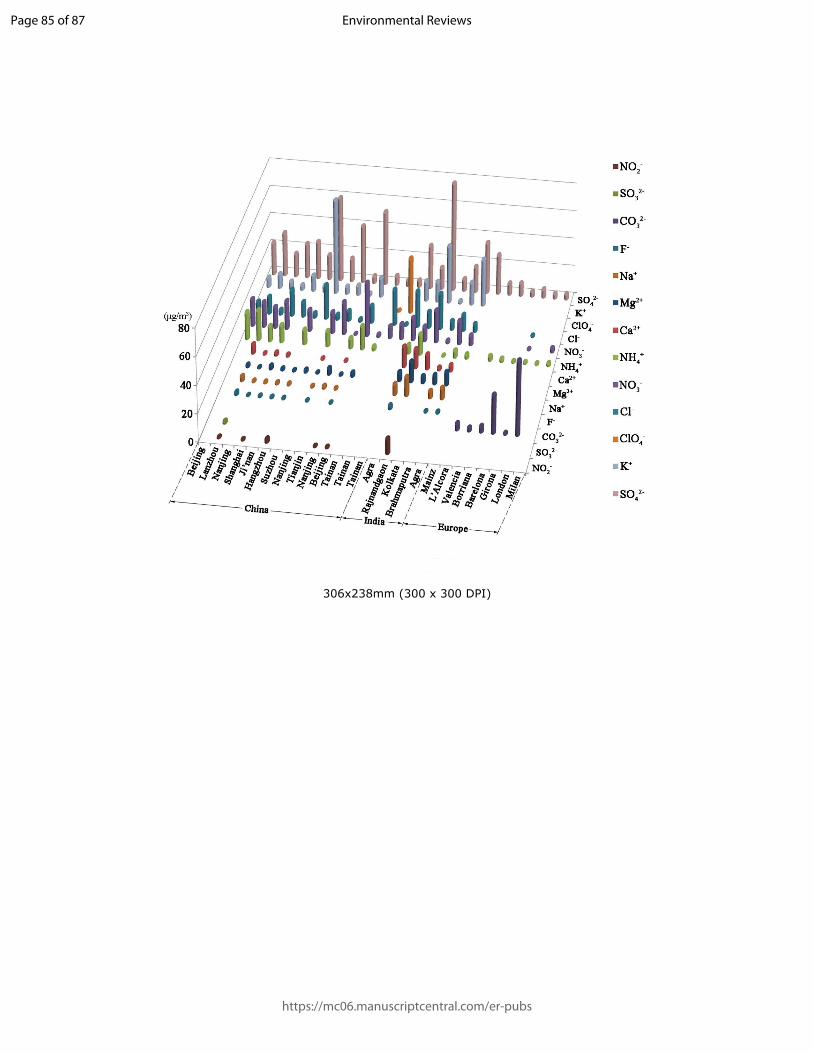
Draft
306x238mm (300 x 300 DPI)
Page 85 of 87
https://mc06.manuscriptcentral.com/er-pubs
Environmental Reviews
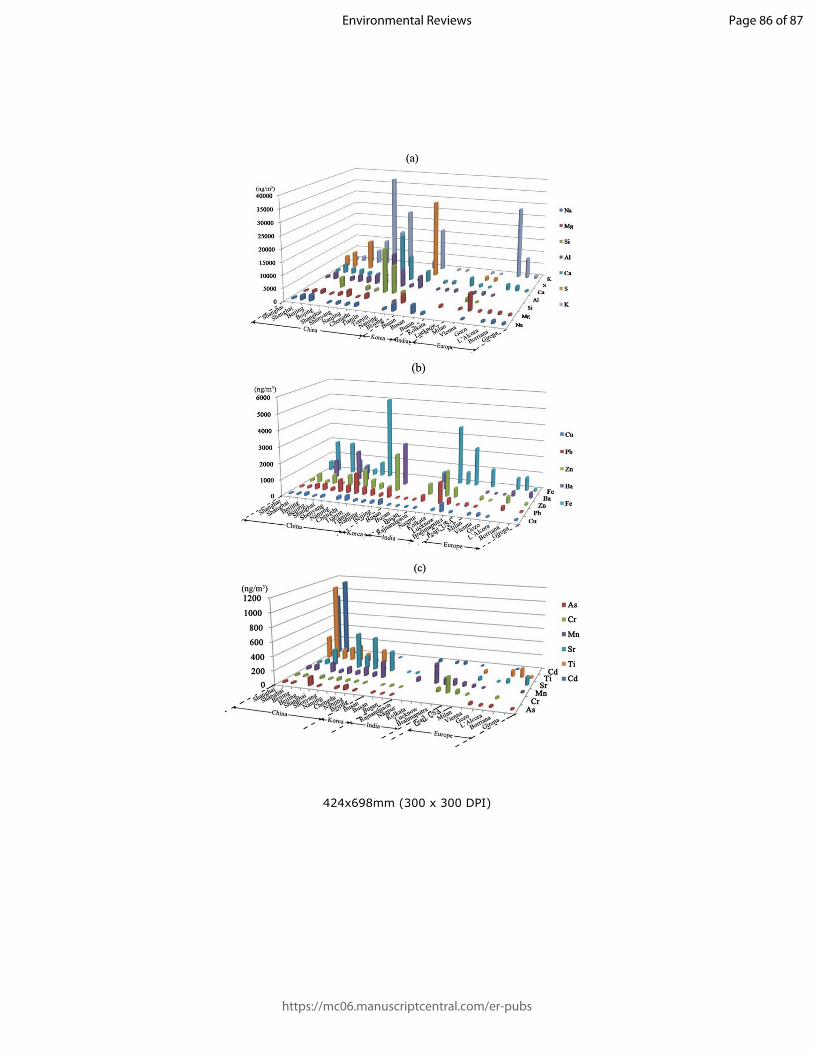
Draft
424x698mm (300 x 300 DPI)
Page 86 of 87
https://mc06.manuscriptcentral.com/er-pubs
Environmental Reviews

Draft
366x264mm (300 x 300 DPI)
Page 87 of 87
https://mc06.manuscriptcentral.com/er-pubs
Environmental Reviews