DKI JAKARTA: INFORMAL SETTLEMENT...
81
Cities Alliance Project Output DKI JAKARTA: INFORMAL SETTLEMENT MAPPING Indonesia Slum Alleviation Policy and Action Plan (SAPOLA) P121467 This project output was created with Cities Alliance grant funding.
Transcript of DKI JAKARTA: INFORMAL SETTLEMENT...
Cities Alliance Project Output
DKI JAKARTA: INFORMAL SETTLEMENT MAPPING
Indonesia Slum Alleviation Policy and Action Plan (SAPOLA)
P121467
This project output was created with Cities Alliance grant funding.
S A P O L A – Slum Alleviation Policy and Action Plan | i
DKI JAKARTA: INFORMAL
SETTLEMENT MAPPING Final Report
S A P O L A – Slum Alleviation Policy and Action Plan | i
Table of Content Table of Content .......................................................................................................... i
1 INTRODUCTION ............................................................................................ 1 1.1 Background ................................................................................................... 1 1.2 Objective ....................................................................................................... 2 1.3 Method ......................................................................................................... 2 1.4 Structure of Report ....................................................................................... 3
2 SLUM IDENTIFICATION THROUGH OBJECT-BASED IMAGE ANALYSIS............... 4 2.1 Image Analysis Using Satellite Data .............................................................. 4 2.2 Object-oriented Analysis (OOA) for Slum Identification
and Mapping ................................................................................................. 5 2.3 Conceptual Approach on Object Based Classification .................................. 6
2.3.1 Segmentation .................................................................................. 6 2.3.2 Chessboard Segmentation .............................................................. 6 2.3.3 Quadtree-Based Segmentation ....................................................... 7 2.3.4 Contrast Split Segmentation ........................................................... 8 2.3.5 Multiresolution Segmentation ........................................................ 8 2.3.6 Spectral difference Segmentation ................................................10 2.3.7 Scale Parameter ............................................................................10 2.3.8 Composition of Homogeneity Criterion ........................................10 2.3.9 Shape .............................................................................................11 2.3.10 Compactness .................................................................................11 2.3.11 Characteristic of object samples in Quick Bird
data Quick Bird ..............................................................................12 2.4 Methods ......................................................................................................12 2.5 Result and discussion ..................................................................................13
2.5.1 Criteria Classification .....................................................................14 2.5.2 Implemented Tree algorithm ........................................................14
2.6 Ground check ..............................................................................................16 2.7 Result of field survey ...................................................................................17 2.8 Accuracy ......................................................................................................19
Accuracy of slum detection in Jakarta using OBIA .....................................20 2.9 Conclusions .................................................................................................21 2.10 Recommendations ......................................................................................22
3 PROFILE OF SLUM NEIGHBORHOOD (RW’S KUMUH).................................... 23 3.1 Selection of Slum Neighborhood (RW’s Kumuh) ........................................23 3.2 Description of Slum Neighborhood (Selected RW’s
Kumuh) ........................................................................................................26
S A P O L A – Slum Alleviation Policy and Action Plan | ii
3.3 Slum Neighborhood (Selected RW’s Kumuh) Based on Location and Building Density .....................................................................28
3.4 Slum Neighborhood (RW’s Kumuh) Based on Housing Ownership and Proof of Ownership ...........................................................30
3.5 Slum Neighborhood (Selected RW’s Kumuh) Based on Access to Water and Sanitation ..................................................................32
3.6 Slum Neighborhood Based on The Availability of Drainage and Road System .........................................................................35
3.7 Flood Prone Slum Area ...............................................................................37 3.7.1 North Jakarta Slum Areas ..............................................................37 3.7.2 West Jakarta Slum Areas ...............................................................39 3.7.3 Central Jakarta Slum Areas ...........................................................40 3.7.4 East Jakarta Slum Areas ................................................................41 3.7.5 South Jakarta Slum Areas ..............................................................43
4 PROFILE OF HOUSEHOLD IN SELECTED RW’S KUMUH .................................. 45 4.1 Sampling ......................................................................................................45
4.1.1 Coverage Area ...............................................................................45 4.1.2 Sampling Frame .............................................................................45 4.1.3 Number of Sample ........................................................................46 4.1.4 Sampling Plan ................................................................................48
4.2 Analysis by Slum Typology ..........................................................................49 4.2.1 Socio- Economic Characteristics of Household in
Selected RW’s Kumuh ...................................................................49 4.2.2 Housing and Land-Related Characteristics of
Household in RW’s Kumuh ............................................................52 4.2.3 Physical Environment Characteristics of
Household in Selected RW’s Kumuh .............................................60 4.3 Analysis by Selected RW’s Kumuh in Each Kelurahan ................................68
4.3.1 Slum Neighborhood in Selected RW’s Kumuh by Age, Education and Type of Employment .....................................68
4.3.2 Slum Neighborhood in Selected RW’s Kumuh by Length of Stay and Reason to live .................................................69
4.3.3 Slum Neighborhood in Selected RW’s Kumuh by Ownership and Proof of Ownership .............................................71
4.3.4 Slum Neighborhood in Selected RW’s Kumuh by Building Material ...........................................................................72
4.3.5 Slum Neighborhood in Selected RW’s Kumuh by Building Size, Source of Electricity and Source of Water Supply .................................................................................73
4.3.6 Slum Neighborhood in Selected RW’s Kumuh by Sanitation Facility ..........................................................................74
S A P O L A – Slum Alleviation Policy and Action Plan | iii
List Of Table
Table 1-1 Slum Mapping Methodology..................................................................................3 Table 3-1 The Distribution of Sampling Slum Neighborhood ..............................................23 Table 3-2 Slum Neighborhoods by Its Location ...................................................................24 Table 3-3 Description of Slum Neighborhood ......................................................................26 Table 3-4 Slum Neighborhood Based on Location and Building Density .............................28 Table 3-5 Slum Neighborhood Based on Status Ownership and Proof of Ownership .........30 Table 3-6 Slum Neighborhood Based on Access to Water and Sanitation ..........................33 Table 3-7 Slum Neighborhood Based on The Availability of Drainage and Road System ....35 Table 3-8 Number of RW’s in flood prone area based on slum typology in North Jakarta .38 Table 3-9. Number of RW’s in flood prone area based on slum typology in West Jakarta ..40 Table 3-10 Number of RW’s in flood prone area based on slum typology in Central Jakarta
.............................................................................................................................41 Table 3-11 Number of RW’s in flood prone area based on slum typology in East Jakarta ....43 Table 3-12 Number of RW’s in flood prone area based on slum typology in South Jakarta .44 Table 4-1 Population and Sampling .....................................................................................47 Table 4-2 Distribution of Household Based on Typology .....................................................48 Table 4-3 Number of Household by Age Group and Typology ............................................50 Table 4-4 Percentage of Household by Age Group and Highest Educational Attainment ...50 Table 4-5 Number of Household by Type of Employment...................................................51 Table 4-6 Number of Household by Monthly Income .........................................................51 Table 4-7 Number of Household by Monthly Income and Monthly Expenditure ...............52 Table 4-8 Number of Household by Length of Stay and Typology .......................................53 Table 4-9 Percentage of Household by reason to live in slum area .....................................54 Table 4-10 Percentage of Household by Housing Ownership
.............................................................................................................................55 Table 4-11 Percentage of Household by Proof Land Ownership ...........................................56 Table 4-12 Number of Household by Housing Expenditure and Slum Typology ...................58 Table 4-13 Monthly rent price of house at riverbanks slum area ..........................................59 Table 4-14 Monthly rent price of house at railroads slum area ............................................59 Table 4-15 Monthly rent price of house at other slum area ..................................................59 Table 4-16 Percentage of Household by Housing Materials ..................................................60 Table 4-17 Source of clean water at other slum area ............................................................65 Table 4-18 Percentage of Slum Neighborhood in Selected RW’s Kumuh by Age, Education
and Type of Employment .....................................................................................68 Table 4-19 Percentage of Slum Neighborhood in Selected RW’s Kumuh by Length of Stay
and Reason to live ................................................................................................69 Table 4-20 Percentage of Slum Neighborhood in Selected RW’s Kumuh by Ownership and
Proof of Ownership ..............................................................................................71 Table 4-21 Percentage of Slum Neighborhood in Selected RW’s Kumuh by building material
.............................................................................................................................72 Table 4-22 Percentage of Slum Neighborhood in Selected RW’s Kumuh by Building Size,
Source of Electricity and Source of Water Supply................................................73 Table 4-23 Percentage of Slum Neighborhood in Selected RW’s Kumuh by the condition of
sanitation facility. .................................................................................................74
S A P O L A – Slum Alleviation Policy and Action Plan | iv
List of Figures
Figure 2-1 Chessboard Segmentation .................................................................................7 Figure 2-2 Quadtree Based Segmentation .........................................................................7 Figure 2-3 Result of multiresolution segmentation with scale 10, shape 0.1 and
compactness 0.5 ................................................................................................9 Figure 2-4 Multiresolution segmentation work flow diagram (eCognition, 2013) .............9 Figure 2-5 Graph Characteristics Entire Sample Class and Parameters (compactness and
Roundness) ......................................................................................................12 Figure 2-6 Quick Bird data of DKI Jakarta .........................................................................13 Figure 2-7 Manual equalizing radiometric of Quick Bird data ..........................................13 Figure 2-8 OBIA implementation for Slum Mapping: Jakarta Case ..................................14 Figure 2-9 Samples of object based classification for slum detection ..............................15 Figure 2-10 Ground check in Pluit and Pademangan ..........................................................16 Figure 2-11 Ground check in Tegal Arum and Marunda .....................................................17 Figure 2-12 Accuracy and precise .......................................................................................19 Figure 3-1 Location of Slum Neighborhoods ....................................................................25 Figure 3-2. Slum typology and flood prone area in North Jakarta .....................................38 Figure 3-3. Slum typology and flood prone area in West Jakarta ......................................39 Figure 3-4. Slum typology and flood prone area in Central Jakarta ..................................41 Figure 3-5. Slum typology and flood prone area in East Jakarta .......................................42 Figure 3-6. Slum typology and flood prone area in South Jakarta .....................................44 Figure 4-1 Sampling Frame ...............................................................................................46 Figure 4-2 Proof of ownership certificate. Top Left: riverbanks slum area; Top Right:
Coastal slum area; Bottom Left: Railroads slum area; Bottom right: Other slum area .........................................................................................................57
Figure 4-3 Buildings characteristics of riverbanks slum area. Top left: Percentage of roofing material; Top right: Percentage of wall type; Bottom left: Percentage of floor type; Bottom right: Number of houses based on land size ................61
Figure 4-4 Buildings characteristics of coastal slum area. Top left: Percentage of roofing material; Top right: Percentage of wall type; Bottom left: Percentage of floor type; Bottom right: Number of houses based on land size .............................62
Figure 4-5 Buildings characteristics of railroads slum area. Top left: Perentage of roofing material; Top right: Percentage of wall type; Bottom left: Percentage of floor type; Bottom right: Number of houses based on land size .............................63
Figure 4-6 Buildings characteristics of other slum area. Top left: Perentage of roofing material; Top right: Percentage of wall type; Bottom left: Percentage of floor type; Bottom right: Number of houses based on land size .............................64
Figure 4-7 Percentage of septic tanks ownerships in riverbanks slum area .....................65 Figure 4-8 Percentage of septic tanks ownerships in railroads slum area .......................66 Figure 4-9 Percentage of septic tanks ownerships in other slum area .............................67 Figure 4-10 Percentage of drainage type. Top left: riverbanks slum area; Top right:
Coastal slum aea; bottom: railroads slum area ...............................................67
S A P O L A – Slum Alleviation Policy and Action Plan | 1
1 INTRODUCTION
Background 1.1
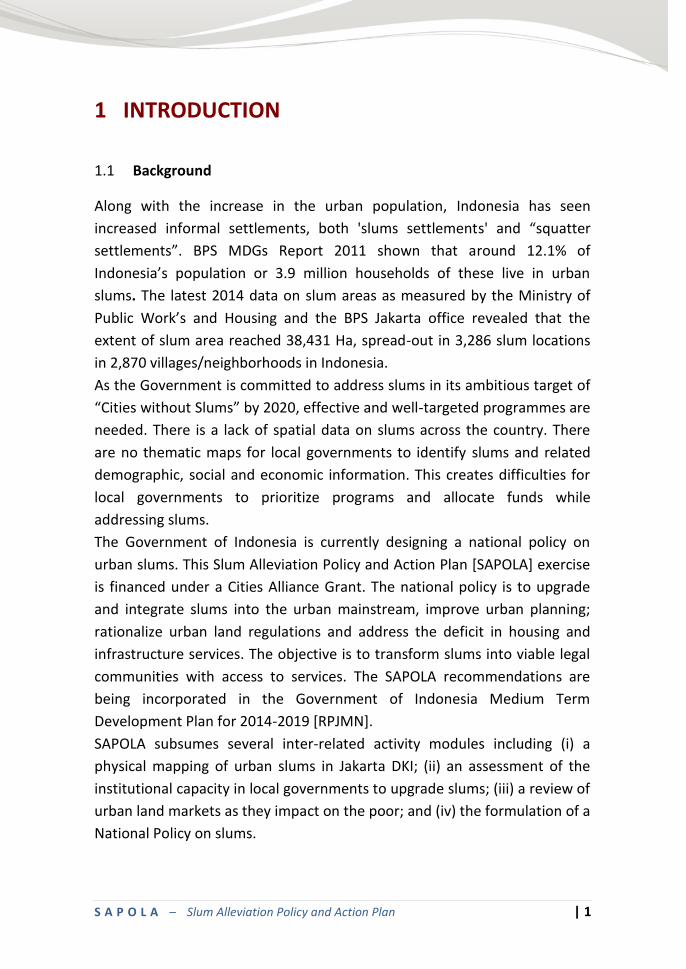
Along with the increase in the urban population, Indonesia has seen
increased informal settlements, both 'slums settlements' and “squatter
settlements”. BPS MDGs Report 2011 shown that around 12.1% of
Indonesia’s population or 3.9 million households of these live in urban
slums. The latest 2014 data on slum areas as measured by the Ministry of
Public Work’s and Housing and the BPS Jakarta office revealed that the
extent of slum area reached 38,431 Ha, spread-out in 3,286 slum locations
in 2,870 villages/neighborhoods in Indonesia.
As the Government is committed to address slums in its ambitious target of
“Cities without Slums” by 2020, effective and well-targeted programmes are
needed. There is a lack of spatial data on slums across the country. There
are no thematic maps for local governments to identify slums and related
demographic, social and economic information. This creates difficulties for
local governments to prioritize programs and allocate funds while
addressing slums.
The Government of Indonesia is currently designing a national policy on
urban slums. This Slum Alleviation Policy and Action Plan [SAPOLA] exercise
is financed under a Cities Alliance Grant. The national policy is to upgrade
and integrate slums into the urban mainstream, improve urban planning;
rationalize urban land regulations and address the deficit in housing and
infrastructure services. The objective is to transform slums into viable legal
communities with access to services. The SAPOLA recommendations are
being incorporated in the Government of Indonesia Medium Term
Development Plan for 2014-2019 [RPJMN].
SAPOLA subsumes several inter-related activity modules including (i) a
physical mapping of urban slums in Jakarta DKI; (ii) an assessment of the
institutional capacity in local governments to upgrade slums; (iii) a review of
urban land markets as they impact on the poor; and (iv) the formulation of a
National Policy on slums.
S A P O L A – Slum Alleviation Policy and Action Plan | 2
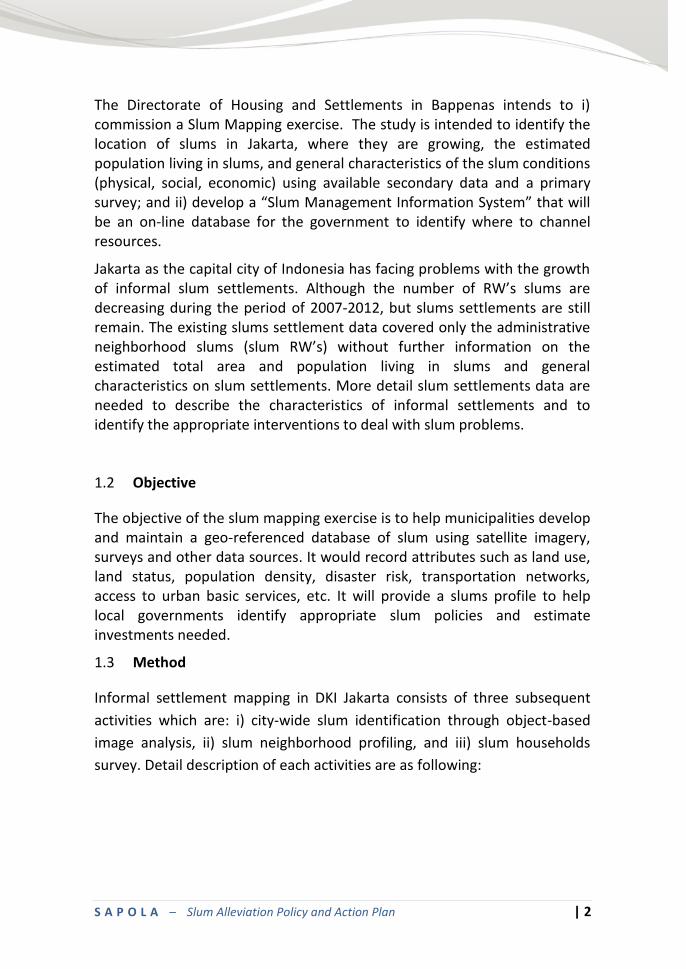
The Directorate of Housing and Settlements in Bappenas intends to i) commission a Slum Mapping exercise. The study is intended to identify the location of slums in Jakarta, where they are growing, the estimated population living in slums, and general characteristics of the slum conditions (physical, social, economic) using available secondary data and a primary survey; and ii) develop a “Slum Management Information System” that will be an on-line database for the government to identify where to channel resources.
Jakarta as the capital city of Indonesia has facing problems with the growth of informal slum settlements. Although the number of RW’s slums are decreasing during the period of 2007-2012, but slums settlements are still remain. The existing slums settlement data covered only the administrative neighborhood slums (slum RW’s) without further information on the estimated total area and population living in slums and general characteristics on slum settlements. More detail slum settlements data are needed to describe the characteristics of informal settlements and to identify the appropriate interventions to deal with slum problems.
Objective 1.2
The objective of the slum mapping exercise is to help municipalities develop and maintain a geo-referenced database of slum using satellite imagery, surveys and other data sources. It would record attributes such as land use, land status, population density, disaster risk, transportation networks, access to urban basic services, etc. It will provide a slums profile to help local governments identify appropriate slum policies and estimate investments needed.
Method 1.3
Informal settlement mapping in DKI Jakarta consists of three subsequent
activities which are: i) city-wide slum identification through object-based
image analysis, ii) slum neighborhood profiling, and iii) slum households
survey. Detail description of each activities are as following:
S A P O L A – Slum Alleviation Policy and Action Plan | 3
Table 1-1 Slum Mapping Methodology
Stage Activity Data Output
City-wide Slum
Identification
through object-
based image
analysis
Identification of
slum areas in a
city based on
image-based
analysis
Field checking
Quickbird
satellite
imagery 2010
A sample slum
mapping through
object based image
analysis and ground
check in 15
locations
Slum
neighborhood
profiling
Selection of
Surveyed RW’s
Kumuh based on
DKI Jakarta BPS
Data (2013)
Field observations
to slum
neigborhood
(RW’s Kumuh)
Primary data
based on
interview to
RW or RT and
observation
Profile of slum
neighborhood
(selected RW’s
Kumuh)
Slum household
survey
Selection of
household within
RW’s Kumuh as
target sampling
Household survey
Primary data,
household
survey
Profile of slum
households in 50
selected RW’s
Kumuh and 38
Keulurahan
Structure of Report 1.4
This report consist of these following section:
Chapter 1 Introduction
Chapter 2 Slum Identification thorugh object based image analysis
Chapter 3 Profile of Slum Neighborhood (Selected RW’s Kumuh)
Chapter 4 Profile of Slum Household
S A P O L A – Slum Alleviation Policy and Action Plan | 4
2 SLUM IDENTIFICATION THROUGH OBJECT-
BASED IMAGE ANALYSIS
Image Analysis Using Satellite Data 2.1
High resolution satellite data is becoming increasingly available and
considered to be a crucial data source for efficiently analyzing the
landscape. The benefits of remotely sensed data can be explained from two
perspectives:
a. They offer quick detection as well as detailed depiction on natural and
manmade features; and
b. They combine both high accuracy and affordability since one data sets
can be used to support many development and program activities by a
cross section of agencies reducing unnecessary redundancy and
duplications.
Image analysis utilizing satellite data can be done in two ways:
a. Utilizing pixel/spectral-based supervised and unsupervised
classifications; where classification is done based on spectral
reflectance of a pixel;
b. Utilizing object based-which utilizes rule and knowledge-based
techniques.
Pixel-based classification can be used to detect urban features. However the
result of past studies applying pixel-based classification led to
misclassifications since urban areas are complex and have a high degree of
heterogeneity. Thomas et al. (2003), who compared three different
methods namely (1) combined supervised/unsupervised spectral
classification, (2) raster-based spatial modelling, and (3) image
segmentation classification using classification tree analysis, found that
derived spectral information resulted from spectral classification gave
relatively low map accuracies while using image segmentation and
classification tree approach increased map accuracy. They have also caused
S A P O L A – Slum Alleviation Policy and Action Plan | 5
“mixed pixel‟ problems particularly for classifying urban classes. The
aforementioned classification problems have led to a paradigm shift from
pixel based to object-based methodology.
Object-oriented Analysis (OOA) for Slum Identification and Mapping 2.2
Object Oriented Analysis (OOA) involves partitioning image into meaningful
objects called segments, and assessing their properties by use of spectral
signatures, geographical features and topological properties. These features
are used in recognition and classification process (Durand et al., 2007).
Several studies have demonstrated the usefulness of object-based approach
by comparing pixel based and object oriented classification. For example, a
study to identify urban structures and its dynamics was evaluated using
Quick Bird satellite image in Delhi India. OOA was used to classify different
settlement types in the urban area to detect informal settlements
(Niebergall et al., 2007). The results showed that pixel-based classifications
gave bad results for complex urban environment.
The strengths of OOA are:
1. Spatial relationship can be revealed hence the accuracy of the value of
final classification is increased (which cannot be fulfilled by pixel based
approach).
2. Iterative process in extracting objects of interest in the process of
segmentation and classification can be performed.
3. OOA is also capable of using multiple data types during analysis to help
create meaningful segments.
4. OOA provides meaningful information by allowing integration of
fuzziness in the boundaries of classes.
5. It allows multiple scale: OOA allows for more than one level of analysis.
For identification of features in an image through classification, it
requires objects of different sizes which are linked.
S A P O L A – Slum Alleviation Policy and Action Plan | 6
Conceptual Approach on Object Based Classification 2.3
OOA is process of image analysis characterized by transformation of
knowledge which involves feeding rules into the software, on which the
Image segmentation is the first and important step for classification of an
image to group results of pixels with similar values (Nobrega et al., 2008).
Object image analysis consists of two steps: segmentation and classification.
2.3.1 Segmentation
Image segmentation is the first most crucial steps which involve grouping
pixels into meaningful objects of homogeneous spectral properties
(Bhaskaran et al., 2010; Blaschke, 2010). Image segmentation links objects
in a network which offers important context information for classification.
There are two basic segmentation principles; top down segmentation which
cuts the image into smaller pieces and bottom up approach that merges
smaller objects into bigger objects (eCognition, 2010). This depends on the
type of segmentation. Seven types of multiresolution algorithm are
available in eCognition software which includes: chessboard segmentation,
quadtree-based segmentation, contrast split segmentation, multiresolution
segmentation, spectral difference segmentation, multithreshold
segmentation and contrast filter segmentation (eCognition, 2013).
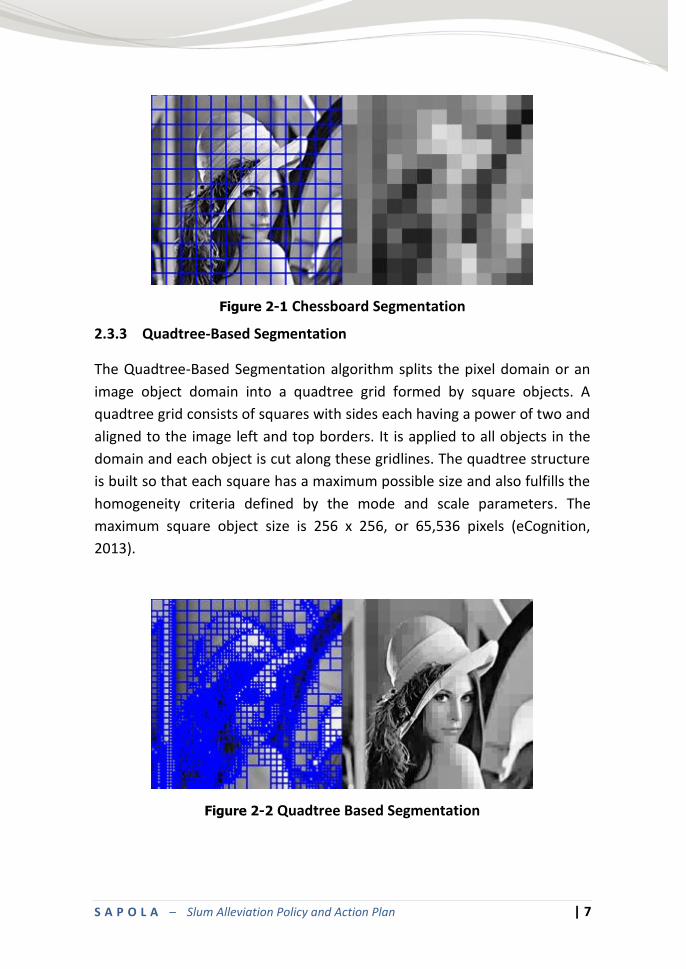
2.3.2 Chessboard Segmentation
Chessboard segmentation is a top down region splitting principle which
splits the pixel domain or an image into square image objects (eCognition,
2010). Object size which is determined by the scale size, defines the square
grid in pixels. Chessboard segmentation is simple and fast. It generates seed
segments which are used for further analysis (eCognition, 2013).
S A P O L A – Slum Alleviation Policy and Action Plan | 7
Figure 2-1 Chessboard Segmentation
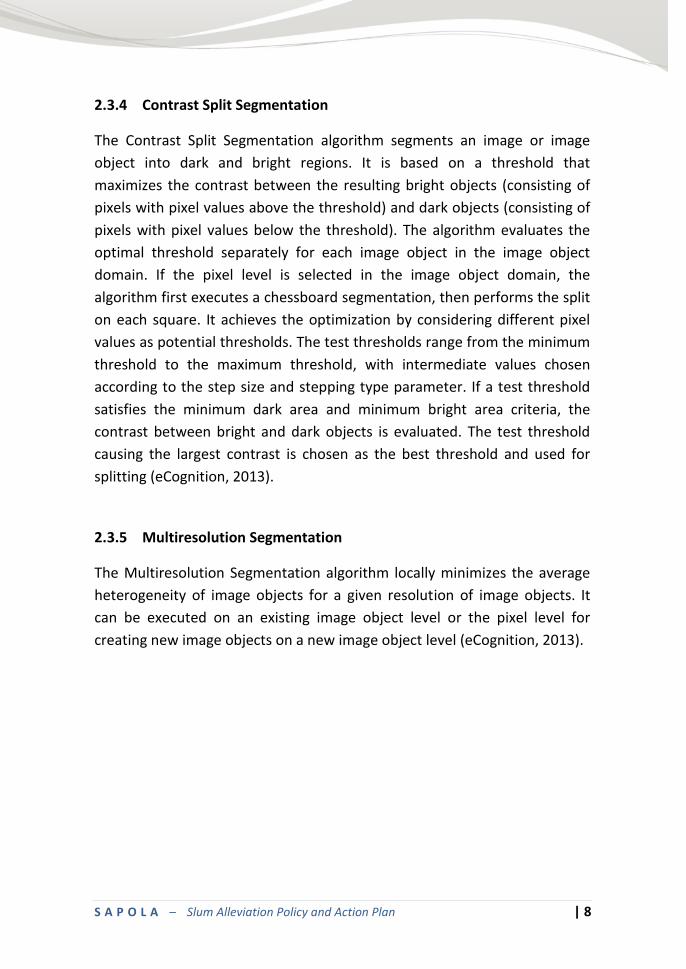
2.3.3 Quadtree-Based Segmentation
The Quadtree-Based Segmentation algorithm splits the pixel domain or an
image object domain into a quadtree grid formed by square objects. A
quadtree grid consists of squares with sides each having a power of two and
aligned to the image left and top borders. It is applied to all objects in the
domain and each object is cut along these gridlines. The quadtree structure
is built so that each square has a maximum possible size and also fulfills the
homogeneity criteria defined by the mode and scale parameters. The
maximum square object size is 256 x 256, or 65,536 pixels (eCognition,
2013).
Figure 2-2 Quadtree Based Segmentation
S A P O L A – Slum Alleviation Policy and Action Plan | 8
2.3.4 Contrast Split Segmentation
The Contrast Split Segmentation algorithm segments an image or image
object into dark and bright regions. It is based on a threshold that
maximizes the contrast between the resulting bright objects (consisting of
pixels with pixel values above the threshold) and dark objects (consisting of
pixels with pixel values below the threshold). The algorithm evaluates the
optimal threshold separately for each image object in the image object
domain. If the pixel level is selected in the image object domain, the
algorithm first executes a chessboard segmentation, then performs the split
on each square. It achieves the optimization by considering different pixel
values as potential thresholds. The test thresholds range from the minimum
threshold to the maximum threshold, with intermediate values chosen
according to the step size and stepping type parameter. If a test threshold
satisfies the minimum dark area and minimum bright area criteria, the
contrast between bright and dark objects is evaluated. The test threshold
causing the largest contrast is chosen as the best threshold and used for
splitting (eCognition, 2013).
2.3.5 Multiresolution Segmentation
The Multiresolution Segmentation algorithm locally minimizes the average
heterogeneity of image objects for a given resolution of image objects. It
can be executed on an existing image object level or the pixel level for
creating new image objects on a new image object level (eCognition, 2013).
S A P O L A – Slum Alleviation Policy and Action Plan | 9
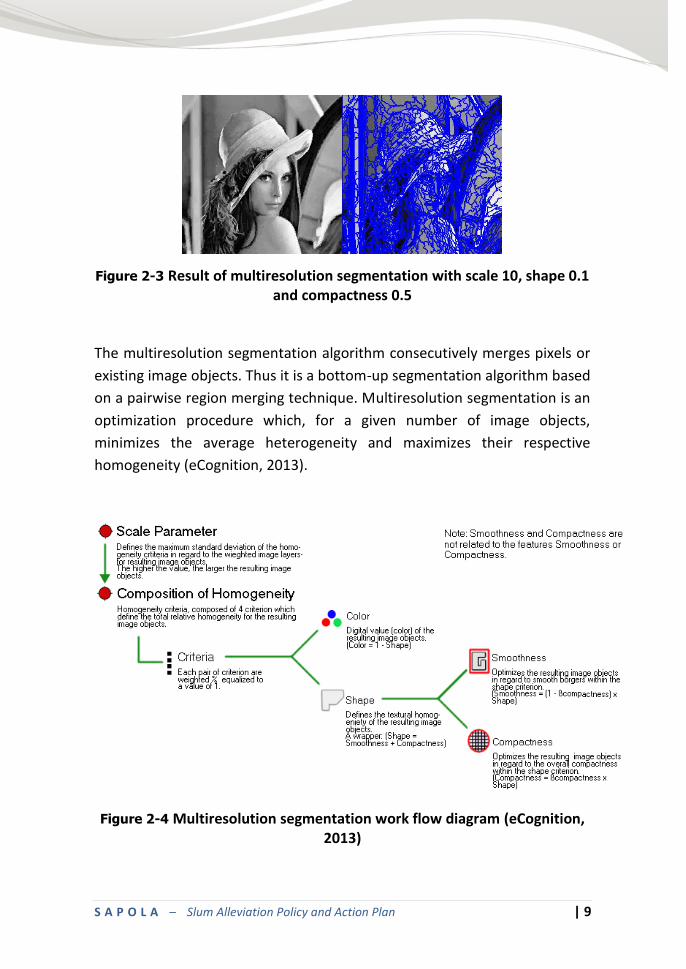
Figure 2-3 Result of multiresolution segmentation with scale 10, shape 0.1 and compactness 0.5
The multiresolution segmentation algorithm consecutively merges pixels or
existing image objects. Thus it is a bottom-up segmentation algorithm based
on a pairwise region merging technique. Multiresolution segmentation is an
optimization procedure which, for a given number of image objects,
minimizes the average heterogeneity and maximizes their respective
homogeneity (eCognition, 2013).
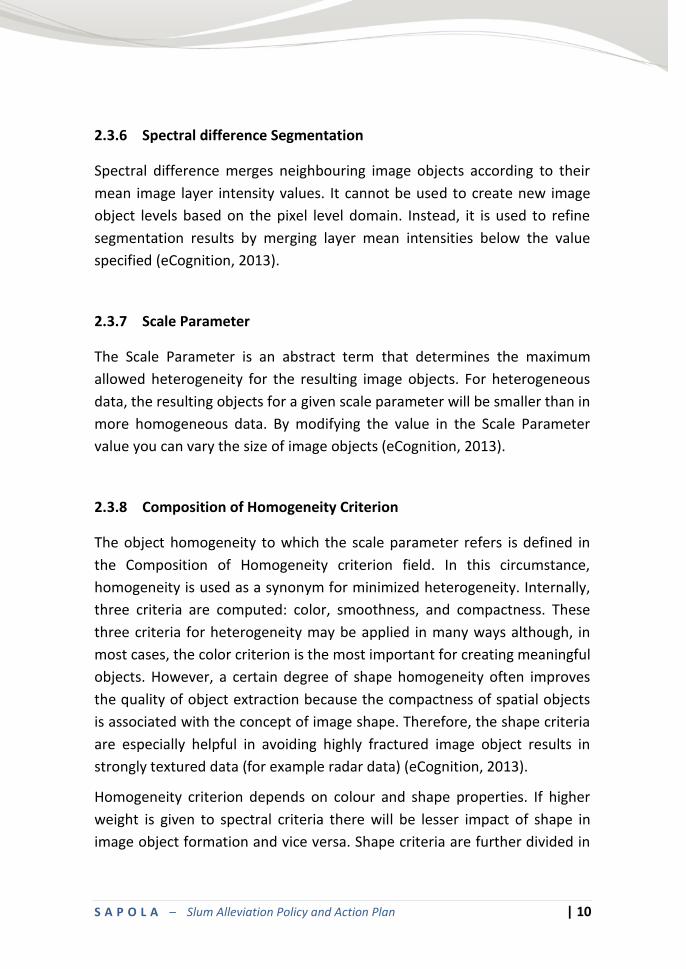
Figure 2-4 Multiresolution segmentation work flow diagram (eCognition, 2013)
S A P O L A – Slum Alleviation Policy and Action Plan | 10
2.3.6 Spectral difference Segmentation
Spectral difference merges neighbouring image objects according to their
mean image layer intensity values. It cannot be used to create new image
object levels based on the pixel level domain. Instead, it is used to refine
segmentation results by merging layer mean intensities below the value
specified (eCognition, 2013).
2.3.7 Scale Parameter
The Scale Parameter is an abstract term that determines the maximum
allowed heterogeneity for the resulting image objects. For heterogeneous
data, the resulting objects for a given scale parameter will be smaller than in
more homogeneous data. By modifying the value in the Scale Parameter
value you can vary the size of image objects (eCognition, 2013).
2.3.8 Composition of Homogeneity Criterion
The object homogeneity to which the scale parameter refers is defined in
the Composition of Homogeneity criterion field. In this circumstance,
homogeneity is used as a synonym for minimized heterogeneity. Internally,
three criteria are computed: color, smoothness, and compactness. These
three criteria for heterogeneity may be applied in many ways although, in
most cases, the color criterion is the most important for creating meaningful
objects. However, a certain degree of shape homogeneity often improves
the quality of object extraction because the compactness of spatial objects
is associated with the concept of image shape. Therefore, the shape criteria
are especially helpful in avoiding highly fractured image object results in
strongly textured data (for example radar data) (eCognition, 2013).
Homogeneity criterion depends on colour and shape properties. If higher
weight is given to spectral criteria there will be lesser impact of shape in
image object formation and vice versa. Shape criteria are further divided in
S A P O L A – Slum Alleviation Policy and Action Plan | 11
smoothness and compactness. Smoothness influences the smoothness of
the object while compactness determines how compact objects will be.
Among these parameters, scale parameter is the most important factor
since it determines the heterogeneity for the target image objects(Chen et
al., 2009).The larger the scale parameter, the more objects are fused and
the larger the objects grow (Benz et al., 2004). This allows for the
representation of image information simultaneously at different scales thus
achieving a hierarchical network of objects. For example the classification of
a single building and a settlement requires would require a different scale to
classify them. Therefore, it is important while analysing various objects in an
image to perform it on several scales in a hierarchical manner (eCognition,
2013).
2.3.9 Shape
The value of the Shape field modifies the relationship between shape and
color criteria; By modifying the Shape criterion,1 you define the color
criteria (color = 1 shape). In effect, by decreasing the value assigned to the
Shape field, you define to which percentage the spectral values of the image
layers will contribute to the entire homogeneity criterion. This is weighted
against the percentage of the shape homogeneity, which is defined in the
Shape field. Changing the weight for the Shape criterion to 1 will result in
objects more optimized for spatial homogeneity. However, the shape
criterion cannot have a value larger than 0.9, due to the fact that without
the spectral information of the image, the resulting objects would not be
related to the spectral information at all. The slider bar adjusts the amount
of Color and Shape to be used for the segmentation. In addition to spectral
information, the object homogeneity is optimized with regard to the object
shape, defined by the Compactness parameter (eCognition, 2013).
2.3.10 Compactness
The compactness criterion is used to optimize image objects with regard to
compactness. This criterion should be used when different image objects
S A P O L A – Slum Alleviation Policy and Action Plan | 12
which are rather compact, but are separated from non-compact objects
only by a relatively weak spectral contrast. Use the slider bar to adjust the
degree of compactness to be used for the segmentation (eCognition, 2013).
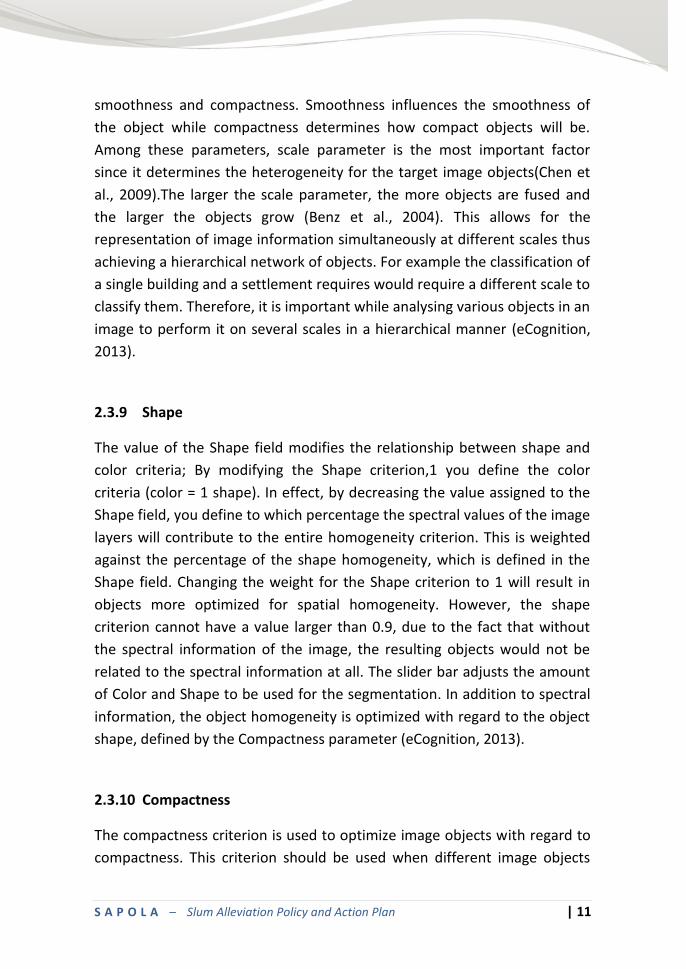
2.3.11 Characteristic of object samples in Quick Bird data Quick Bird
Figure 2-5 Graph Characteristics Entire Sample Class and Parameters (compactness and Roundness)
Methods 2.4
The image used is the Quick Bird in 2010 with the condition already
orthoimage, but have not done radiometric correction. This image has three
bands of blue, green, red, but not fitted with NIR band and radiometric
metadata.
KARAKTERISTIK SELURUH SAMPEL KELAS & PARAMETER
(Compactness dan Roundness)
0
2
4
6
8
C R
BAND
DN
WADUK
SUNGAI
SWH BERA
SWH GEN
SWH VEG
SWH AIR
HUTAN
BELUKAR
SEMAK/ALANG-ALANG
PERKEBUNAN
PERKEBUNAN (Tebu)
KEBUN CAMPUR
TEGALAN/LADANG
LAHAN TERBUKA
PERMUKIMAN JARANG
PERMUKIMAN PADAT
KAWASAN INDUSTRI
S A P O L A – Slum Alleviation Policy and Action Plan | 13
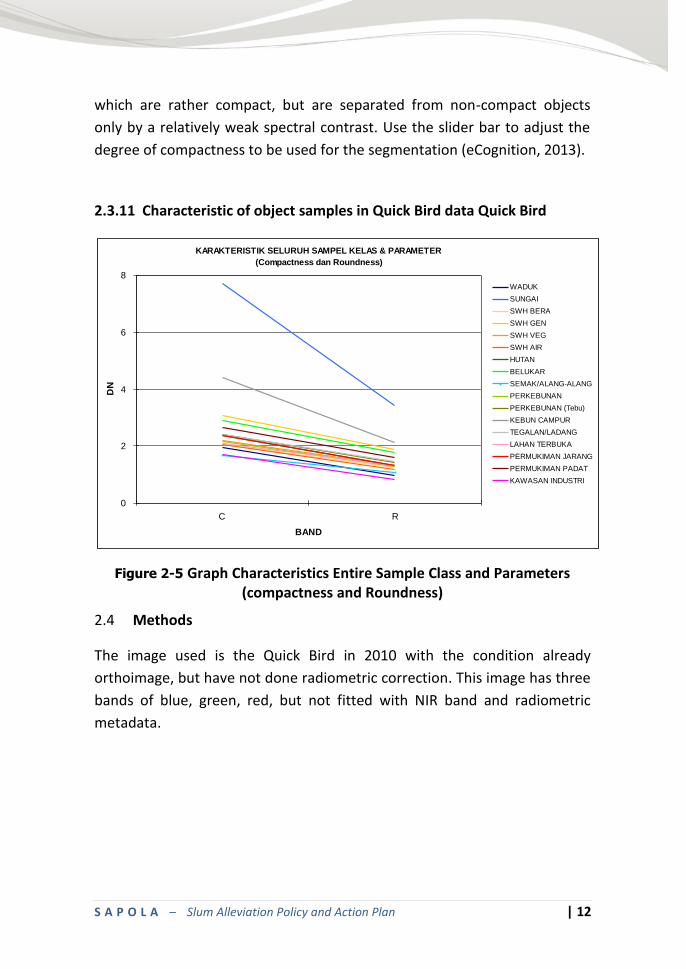
Figure 2-6 Quick Bird data of DKI Jakarta
Location: DKI Jakarta
Software: eCognition 8.7 and QGIS
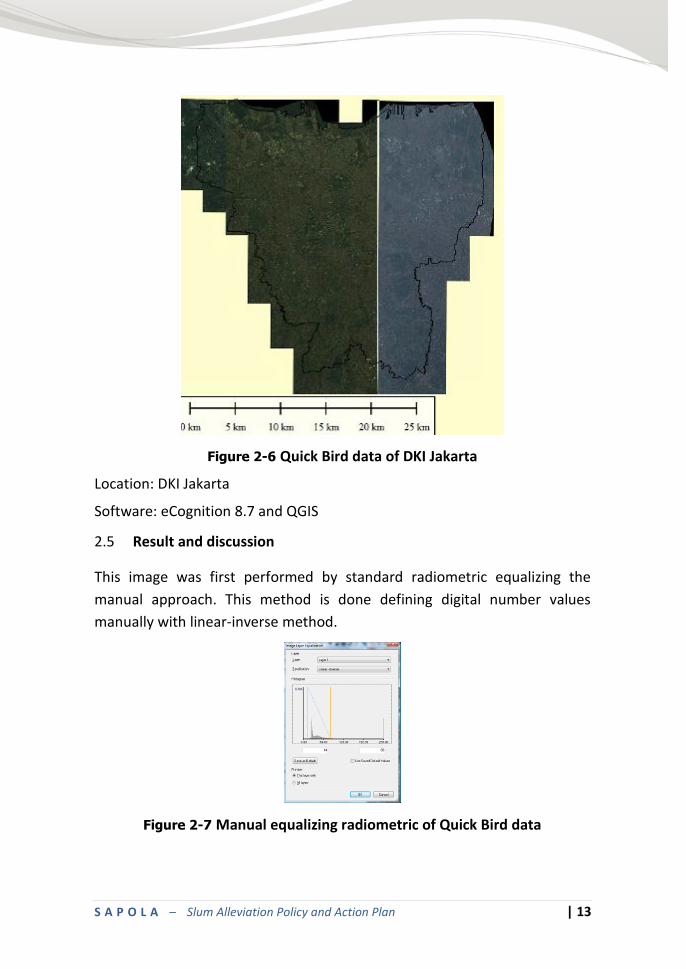
Result and discussion 2.5
This image was first performed by standard radiometric equalizing the
manual approach. This method is done defining digital number values
manually with linear-inverse method.
Figure 2-7 Manual equalizing radiometric of Quick Bird data
S A P O L A – Slum Alleviation Policy and Action Plan | 14
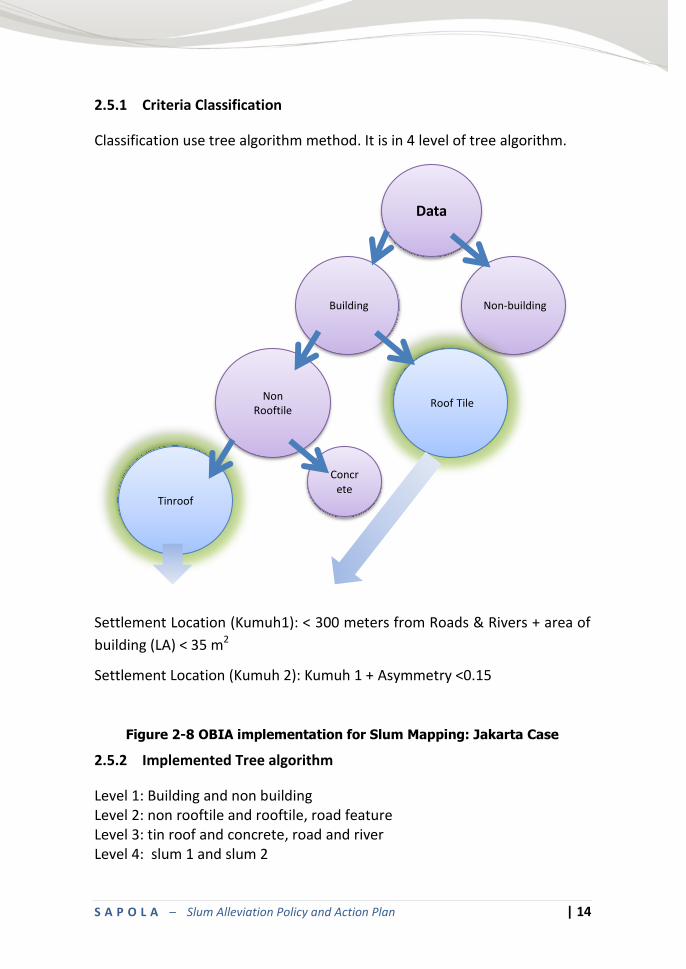
2.5.1 Criteria Classification
Classification use tree algorithm method. It is in 4 level of tree algorithm.
Settlement Location (Kumuh1): < 300 meters from Roads & Rivers + area of
building (LA) < 35 m2
Settlement Location (Kumuh 2): Kumuh 1 + Asymmetry <0.15
Figure 2-8 OBIA implementation for Slum Mapping: Jakarta Case
2.5.2 Implemented Tree algorithm
Level 1: Building and non building Level 2: non rooftile and rooftile, road feature Level 3: tin roof and concrete, road and river Level 4: slum 1 and slum 2
Data
Building Non-building
Non Rooftile
Roof Tile
Tinroof
Concrete
S A P O L A – Slum Alleviation Policy and Action Plan | 15
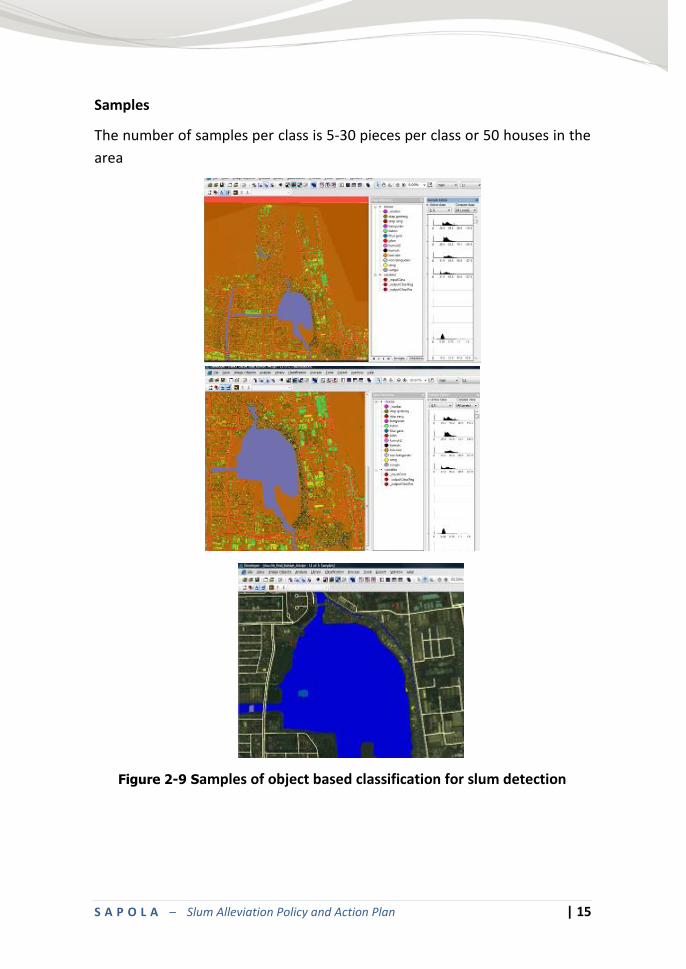
Samples
The number of samples per class is 5-30 pieces per class or 50 houses in the
area
Figure 2-9 Samples of object based classification for slum detection
S A P O L A – Slum Alleviation Policy and Action Plan | 16
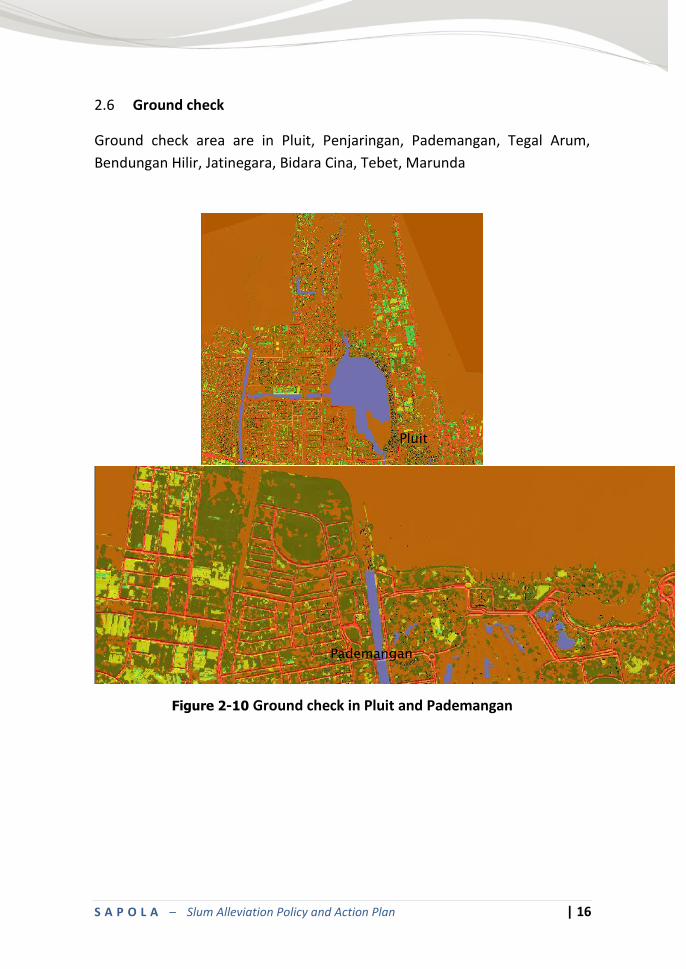
Ground check 2.6
Ground check area are in Pluit, Penjaringan, Pademangan, Tegal Arum,
Bendungan Hilir, Jatinegara, Bidara Cina, Tebet, Marunda
Figure 2-10 Ground check in Pluit and Pademangan
Pluit
Pademangan
S A P O L A – Slum Alleviation Policy and Action Plan | 17
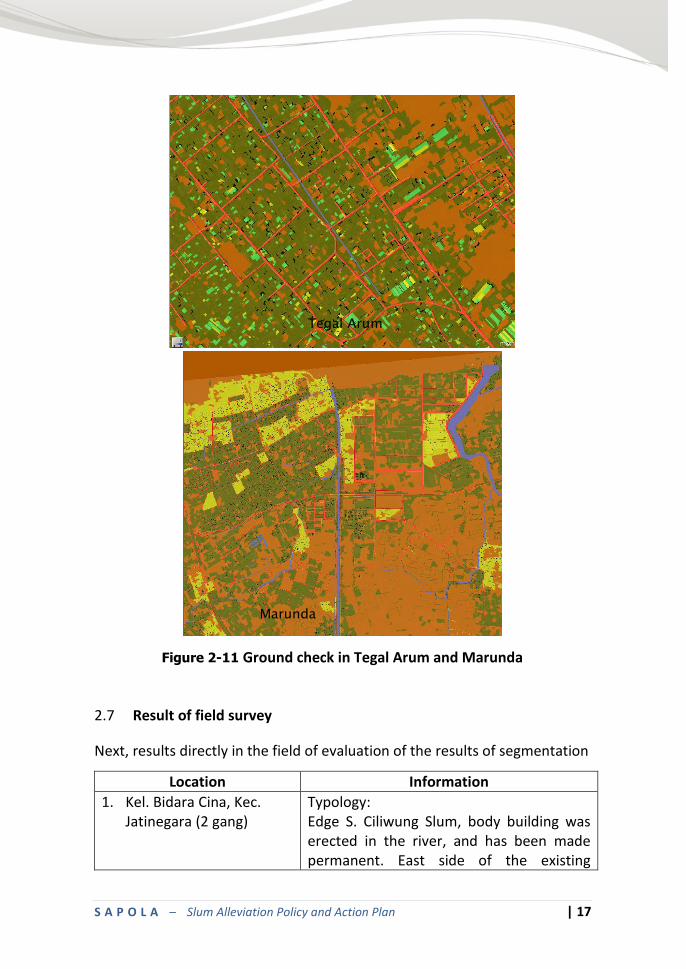
Figure 2-11 Ground check in Tegal Arum and Marunda
Result of field survey 2.7
Next, results directly in the field of evaluation of the results of segmentation
Location Information
1. Kel. Bidara Cina, Kec. Jatinegara (2 gang)
Typology: Edge S. Ciliwung Slum, body building was erected in the river, and has been made permanent. East side of the existing
Tegal Arum
Marunda
S A P O L A – Slum Alleviation Policy and Action Plan | 18
Location Information
building public toilets WIKA (the mosque compound) over the tomb. Estimation Accuracy: 80%
2. Kampung Pulo, Jatinegara Village near the bridge, being dismantled. Accuracy: 80%
3. Bukit Duri, Tebet rail station
Houses seedy roadside (for example, a car wash business)
4. Stasiun Manggarai (near river)
Ditch the right way
5. Matraman -
6. Bendungan Hilir near PAM
7. Tanah Abang near Tanah Abang rail stasion
8. Marunda Slum area (80%)
9. Pademangan Timur Down the motorway, riverbanks and railway (impression: many pets sheep left), an accuracy of 70-80%
10. Pademangan Barat Canal of East Pademangan region (80% accurate)
11. Penjaringan Under the slum houses toll up to the port of Sunda Kelapa / village along the river port of Sunda Kelapa
12. Pluit Validated. The edge of the reservoir whistle (estimation accuracy rate: 80%)
13. Tegal Alur Sewer water on the road (border with Tangerang) (Not detected because in the street)
14. Muara Kamal Newly built residential complex, seedy, roadside selling timber businesses. Border with Tangerang (a new area in the image not yet available)
15. Grogol Untidiness Along the river seen from the highway - along the river (level of accuracy: 90%)
S A P O L A – Slum Alleviation Policy and Action Plan | 19
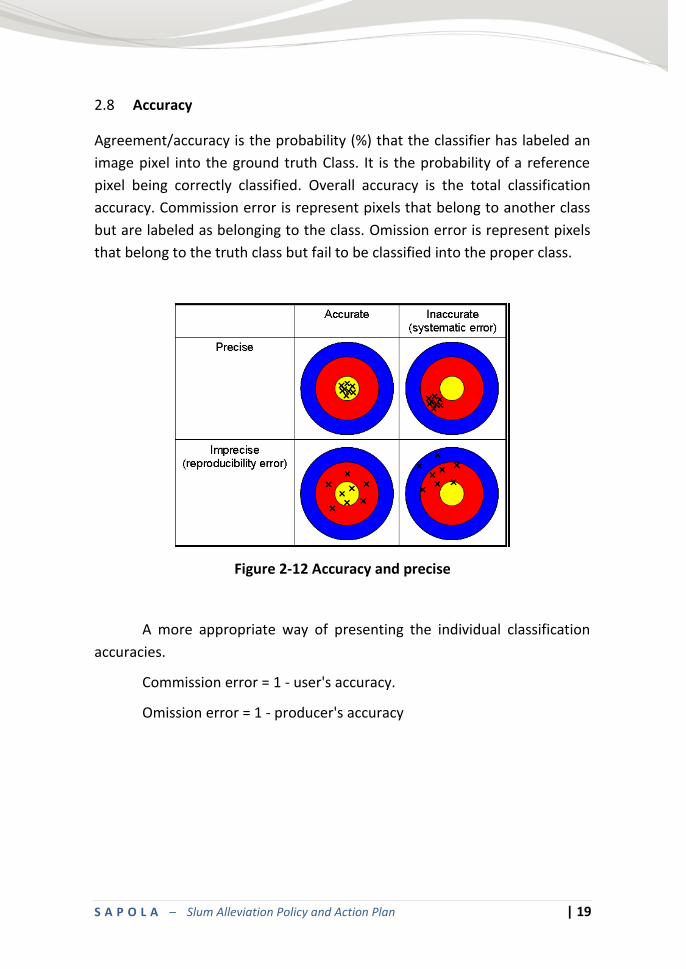
Accuracy 2.8
Agreement/accuracy is the probability (%) that the classifier has labeled an
image pixel into the ground truth Class. It is the probability of a reference
pixel being correctly classified. Overall accuracy is the total classification
accuracy. Commission error is represent pixels that belong to another class
but are labeled as belonging to the class. Omission error is represent pixels
that belong to the truth class but fail to be classified into the proper class.
Figure 2-12 Accuracy and precise
A more appropriate way of presenting the individual classification
accuracies.
Commission error = 1 - user's accuracy.
Omission error = 1 - producer's accuracy
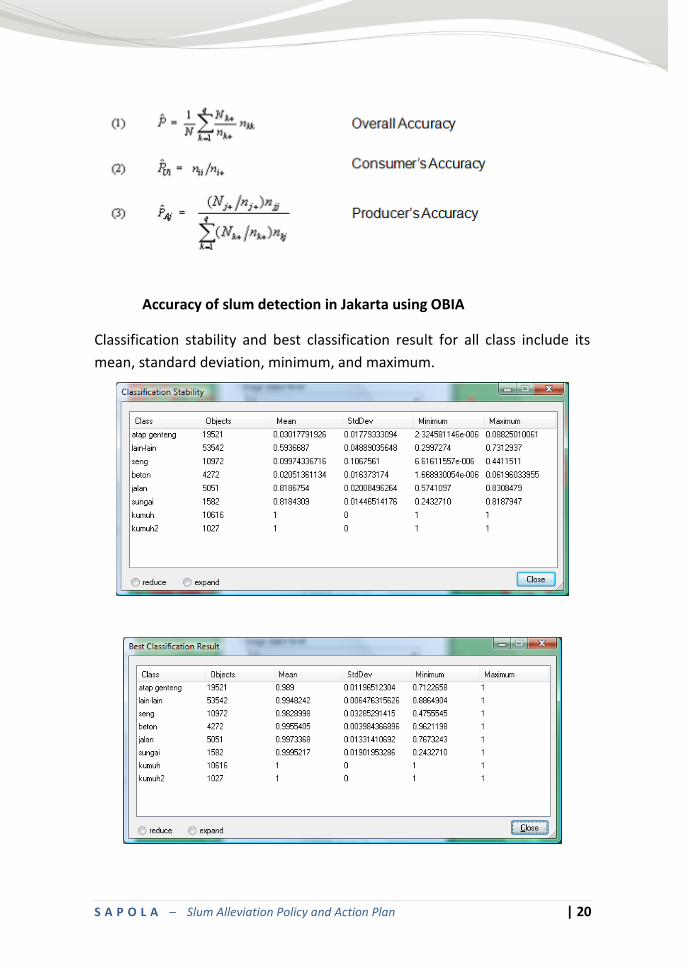
S A P O L A – Slum Alleviation Policy and Action Plan | 20
Accuracy of slum detection in Jakarta using OBIA
Classification stability and best classification result for all class include its
mean, standard deviation, minimum, and maximum.
S A P O L A – Slum Alleviation Policy and Action Plan | 21
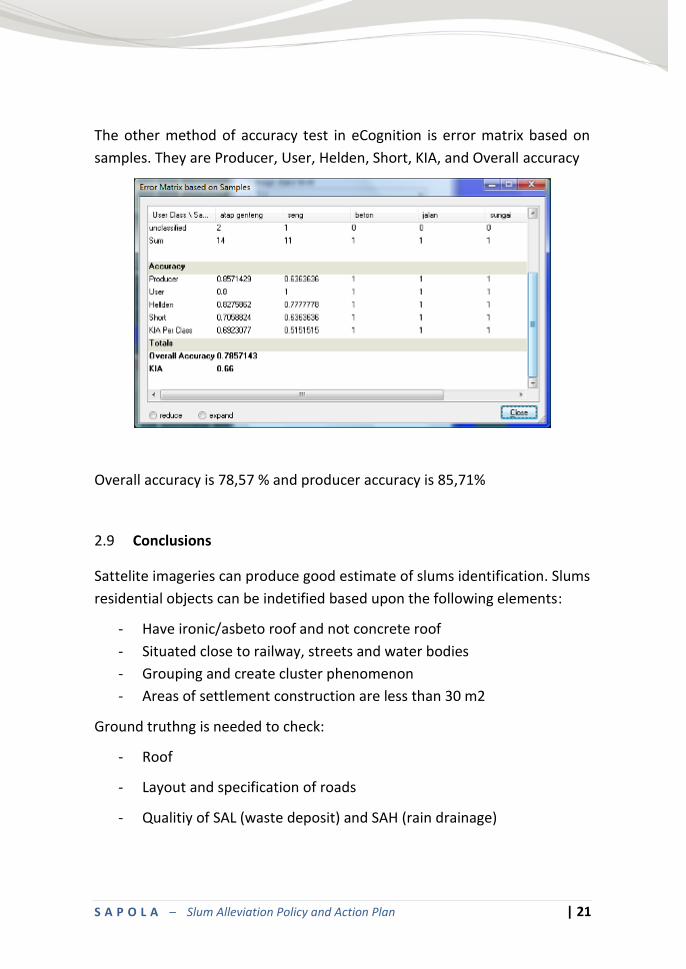
The other method of accuracy test in eCognition is error matrix based on
samples. They are Producer, User, Helden, Short, KIA, and Overall accuracy
Overall accuracy is 78,57 % and producer accuracy is 85,71%
Conclusions 2.9
Sattelite imageries can produce good estimate of slums identification. Slums
residential objects can be indetified based upon the following elements:
- Have ironic/asbeto roof and not concrete roof
- Situated close to railway, streets and water bodies
- Grouping and create cluster phenomenon
- Areas of settlement construction are less than 30 m2
Ground truthng is needed to check:
- Roof
- Layout and specification of roads
- Qualitiy of SAL (waste deposit) and SAH (rain drainage)
S A P O L A – Slum Alleviation Policy and Action Plan | 22
The results of object-based image analysis is that the resulted overall
accuracy is 78,57 % and producer accuracy is 85,71%
Recommendations 2.10
Recommendation for the next research:
1. Utilisation of high resolution imageries with full band covrag, for
example WorldView-2 using 9 band (coastal blue, blue, red, green,
NIR 1, NIR 2, yellow, red edge, panchromatic is highly recommended.
Minimum recommendation is the use of Ikonos, Quick Bird that have
4 bands only (blue, red, green, NIR).
2. The imageries should bave been ortho-rectified and owing geometric
metadata (RPB or RPC).
3. The imageries should have been radiometrically corrected (standard,
normalization, atmosphere, topography) and have radiometric
metadata.
4. Utilization of 3D model (Digital Surface Model (DSM), Digital Terrain
Model (DTM) that minimum has Digital Elevation Model (DEM) with
vertical accuracy < 1 m wouldbe even better. This data are IFSAR,
TerraSAR X/TanDEM X., DSM Ikonos/QuickBird/WorldView/GeoEye.
S A P O L A – Slum Alleviation Policy and Action Plan | 23
3 PROFILE OF SLUM NEIGHBORHOOD (RW’S
KUMUH)
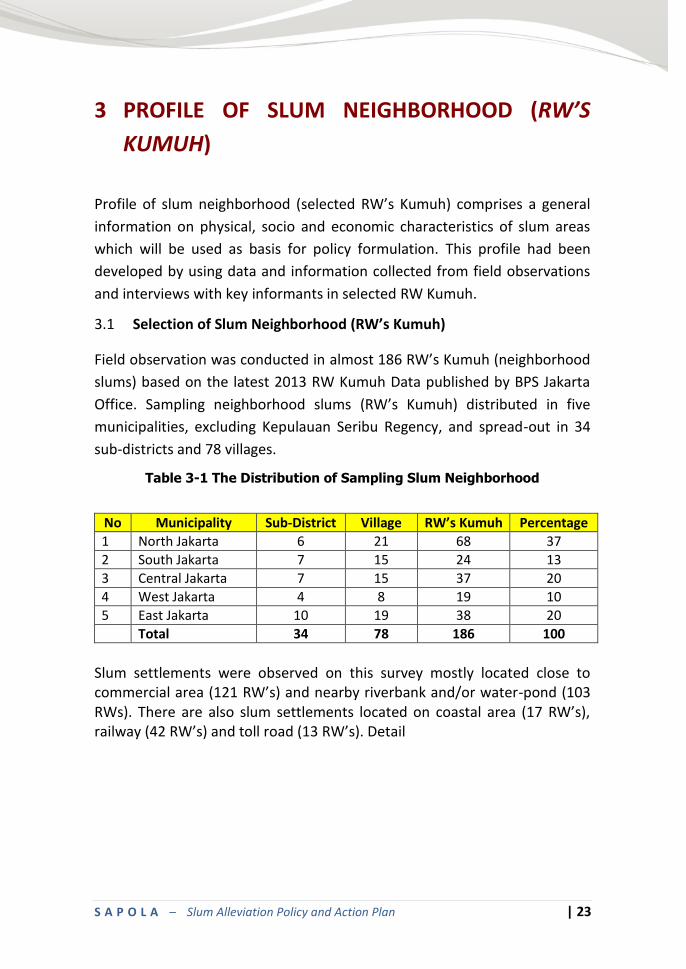
Profile of slum neighborhood (selected RW’s Kumuh) comprises a general
information on physical, socio and economic characteristics of slum areas
which will be used as basis for policy formulation. This profile had been
developed by using data and information collected from field observations
and interviews with key informants in selected RW Kumuh.
Selection of Slum Neighborhood (RW’s Kumuh) 3.1
Field observation was conducted in almost 186 RW’s Kumuh (neighborhood
slums) based on the latest 2013 RW Kumuh Data published by BPS Jakarta
Office. Sampling neighborhood slums (RW’s Kumuh) distributed in five
municipalities, excluding Kepulauan Seribu Regency, and spread-out in 34
sub-districts and 78 villages.
Table 3-1 The Distribution of Sampling Slum Neighborhood
No Municipality Sub-District Village RW’s Kumuh Percentage
1 North Jakarta 6 21 68 37
2 South Jakarta 7 15 24 13
3 Central Jakarta 7 15 37 20
4 West Jakarta 4 8 19 10
5 East Jakarta 10 19 38 20
Total 34 78 186 100
Slum settlements were observed on this survey mostly located close to commercial area (121 RW’s) and nearby riverbank and/or water-pond (103 RWs). There are also slum settlements located on coastal area (17 RW’s), railway (42 RW’s) and toll road (13 RW’s). Detail

S A P O L A – Slum Alleviation Policy and Action Plan | 24
Table 3-2 Slum Neighborhoods by Its Location
No Municipality Riverbank
And Water-Pond
Coastal Railway Toll Road Commercial
1 North Jakarta 20 16 12 8 38
2 South Jakarta 22 0 0 0 15
3 Central Jakarta 18 0 18 0 23
4 West Jakarta 9 1 5 0 16
5 East Jakarta 34 0 7 5 29
Total 103 17 42 13 121
S A P O L A – Slum Alleviation Policy and Action Plan | 25
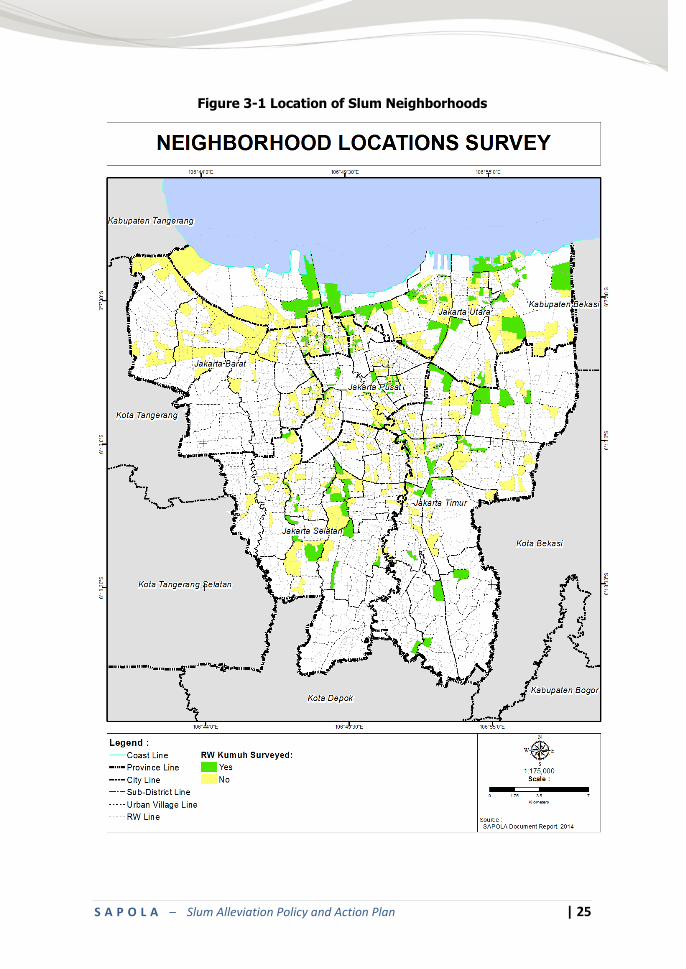
Figure 3-1 Location of Slum Neighborhoods
S A P O L A – Slum Alleviation Policy and Action Plan | 26
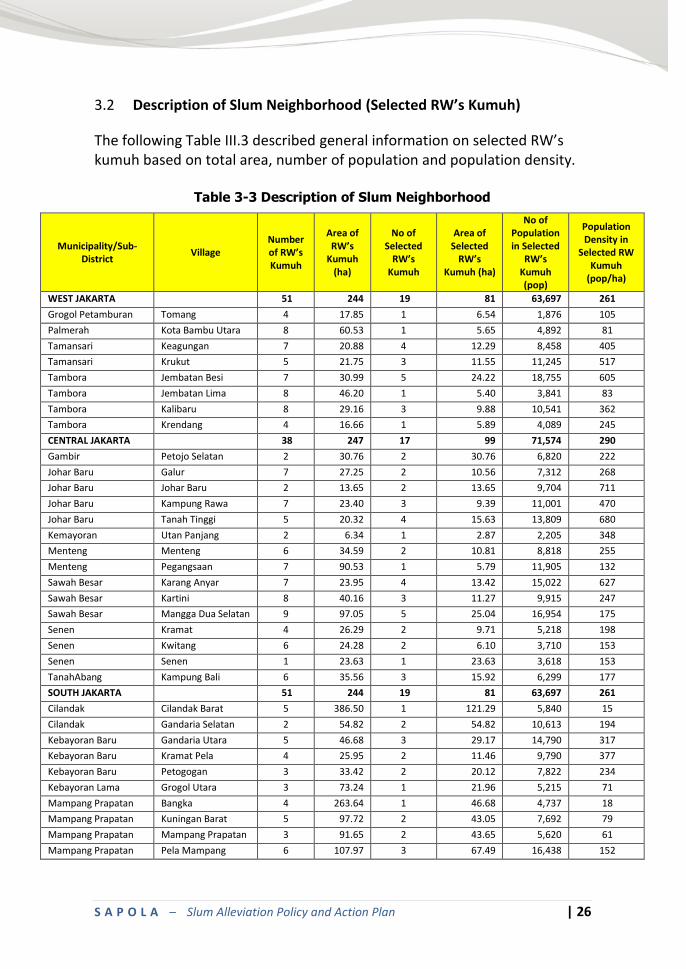
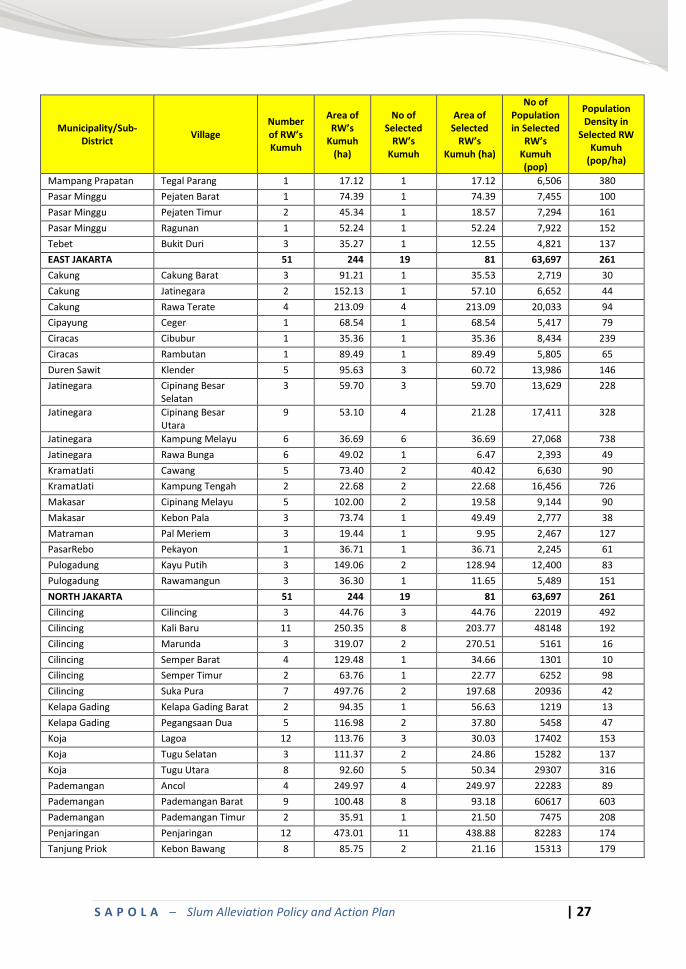
Description of Slum Neighborhood (Selected RW’s Kumuh) 3.2
The following Table III.3 described general information on selected RW’s kumuh based on total area, number of population and population density.
Table 3-3 Description of Slum Neighborhood
Municipality/Sub-District
Village Number of RW’s Kumuh
Area of RW’s
Kumuh (ha)
No of Selected
RW’s Kumuh
Area of Selected
RW’s Kumuh (ha)
No of Population in Selected
RW’s Kumuh (pop)
Population Density in
Selected RW Kumuh
(pop/ha)
WEST JAKARTA 51 244 19 81 63,697 261
Grogol Petamburan Tomang 4 17.85 1 6.54 1,876 105
Palmerah Kota Bambu Utara 8 60.53 1 5.65 4,892 81
Tamansari Keagungan 7 20.88 4 12.29 8,458 405
Tamansari Krukut 5 21.75 3 11.55 11,245 517
Tambora Jembatan Besi 7 30.99 5 24.22 18,755 605
Tambora Jembatan Lima 8 46.20 1 5.40 3,841 83
Tambora Kalibaru 8 29.16 3 9.88 10,541 362
Tambora Krendang 4 16.66 1 5.89 4,089 245
CENTRAL JAKARTA 38 247 17 99 71,574 290
Gambir Petojo Selatan 2 30.76 2 30.76 6,820 222
Johar Baru Galur 7 27.25 2 10.56 7,312 268
Johar Baru Johar Baru 2 13.65 2 13.65 9,704 711
Johar Baru Kampung Rawa 7 23.40 3 9.39 11,001 470
Johar Baru Tanah Tinggi 5 20.32 4 15.63 13,809 680
Kemayoran Utan Panjang 2 6.34 1 2.87 2,205 348
Menteng Menteng 6 34.59 2 10.81 8,818 255
Menteng Pegangsaan 7 90.53 1 5.79 11,905 132
Sawah Besar Karang Anyar 7 23.95 4 13.42 15,022 627
Sawah Besar Kartini 8 40.16 3 11.27 9,915 247
Sawah Besar Mangga Dua Selatan 9 97.05 5 25.04 16,954 175
Senen Kramat 4 26.29 2 9.71 5,218 198
Senen Kwitang 6 24.28 2 6.10 3,710 153
Senen Senen 1 23.63 1 23.63 3,618 153
TanahAbang Kampung Bali 6 35.56 3 15.92 6,299 177
SOUTH JAKARTA 51 244 19 81 63,697 261
Cilandak Cilandak Barat 5 386.50 1 121.29 5,840 15
Cilandak Gandaria Selatan 2 54.82 2 54.82 10,613 194
Kebayoran Baru Gandaria Utara 5 46.68 3 29.17 14,790 317
Kebayoran Baru Kramat Pela 4 25.95 2 11.46 9,790 377
Kebayoran Baru Petogogan 3 33.42 2 20.12 7,822 234
Kebayoran Lama Grogol Utara 3 73.24 1 21.96 5,215 71
Mampang Prapatan Bangka 4 263.64 1 46.68 4,737 18
Mampang Prapatan Kuningan Barat 5 97.72 2 43.05 7,692 79
Mampang Prapatan Mampang Prapatan 3 91.65 2 43.65 5,620 61
Mampang Prapatan Pela Mampang 6 107.97 3 67.49 16,438 152
S A P O L A – Slum Alleviation Policy and Action Plan | 27
Municipality/Sub-District
Village Number of RW’s Kumuh
Area of RW’s
Kumuh (ha)
No of Selected
RW’s Kumuh
Area of Selected
RW’s Kumuh (ha)
No of Population in Selected
RW’s Kumuh (pop)
Population Density in
Selected RW Kumuh
(pop/ha)
Mampang Prapatan Tegal Parang 1 17.12 1 17.12 6,506 380
Pasar Minggu Pejaten Barat 1 74.39 1 74.39 7,455 100
Pasar Minggu Pejaten Timur 2 45.34 1 18.57 7,294 161
Pasar Minggu Ragunan 1 52.24 1 52.24 7,922 152
Tebet Bukit Duri 3 35.27 1 12.55 4,821 137
EAST JAKARTA 51 244 19 81 63,697 261
Cakung Cakung Barat 3 91.21 1 35.53 2,719 30
Cakung Jatinegara 2 152.13 1 57.10 6,652 44
Cakung Rawa Terate 4 213.09 4 213.09 20,033 94
Cipayung Ceger 1 68.54 1 68.54 5,417 79
Ciracas Cibubur 1 35.36 1 35.36 8,434 239
Ciracas Rambutan 1 89.49 1 89.49 5,805 65
Duren Sawit Klender 5 95.63 3 60.72 13,986 146
Jatinegara Cipinang Besar Selatan
3 59.70 3 59.70 13,629 228
Jatinegara Cipinang Besar Utara
9 53.10 4 21.28 17,411 328
Jatinegara Kampung Melayu 6 36.69 6 36.69 27,068 738
Jatinegara Rawa Bunga 6 49.02 1 6.47 2,393 49
KramatJati Cawang 5 73.40 2 40.42 6,630 90
KramatJati Kampung Tengah 2 22.68 2 22.68 16,456 726
Makasar Cipinang Melayu 5 102.00 2 19.58 9,144 90
Makasar Kebon Pala 3 73.74 1 49.49 2,777 38
Matraman Pal Meriem 3 19.44 1 9.95 2,467 127
PasarRebo Pekayon 1 36.71 1 36.71 2,245 61
Pulogadung Kayu Putih 3 149.06 2 128.94 12,400 83
Pulogadung Rawamangun 3 36.30 1 11.65 5,489 151
NORTH JAKARTA 51 244 19 81 63,697 261
Cilincing Cilincing 3 44.76 3 44.76 22019 492
Cilincing Kali Baru 11 250.35 8 203.77 48148 192
Cilincing Marunda 3 319.07 2 270.51 5161 16
Cilincing Semper Barat 4 129.48 1 34.66 1301 10
Cilincing Semper Timur 2 63.76 1 22.77 6252 98
Cilincing Suka Pura 7 497.76 2 197.68 20936 42
Kelapa Gading Kelapa Gading Barat 2 94.35 1 56.63 1219 13
Kelapa Gading Pegangsaan Dua 5 116.98 2 37.80 5458 47
Koja Lagoa 12 113.76 3 30.03 17402 153
Koja Tugu Selatan 3 111.37 2 24.86 15282 137
Koja Tugu Utara 8 92.60 5 50.34 29307 316
Pademangan Ancol 4 249.97 4 249.97 22283 89
Pademangan Pademangan Barat 9 100.48 8 93.18 60617 603
Pademangan Pademangan Timur 2 35.91 1 21.50 7475 208
Penjaringan Penjaringan 12 473.01 11 438.88 82283 174
Tanjung Priok Kebon Bawang 8 85.75 2 21.16 15313 179
S A P O L A – Slum Alleviation Policy and Action Plan | 28
Municipality/Sub-District
Village Number of RW’s Kumuh
Area of RW’s
Kumuh (ha)
No of Selected
RW’s Kumuh
Area of Selected
RW’s Kumuh (ha)
No of Population in Selected
RW’s Kumuh (pop)
Population Density in
Selected RW Kumuh
(pop/ha)
Tanjung Priok Papango 7 132.01 2 49.94 16707 127
Tanjung Priok Sunter Agung 6 146.07 2 39.41 21603 148
Tanjung Priok Sunter Jaya 9 352.00 2 154.24 11272 32
Tanjung Priok Tanjung Priuk 7 56.53 4 30.28 17745 314
Tanjung Priok Warakas 6 54.18 2 18.07 9281 171
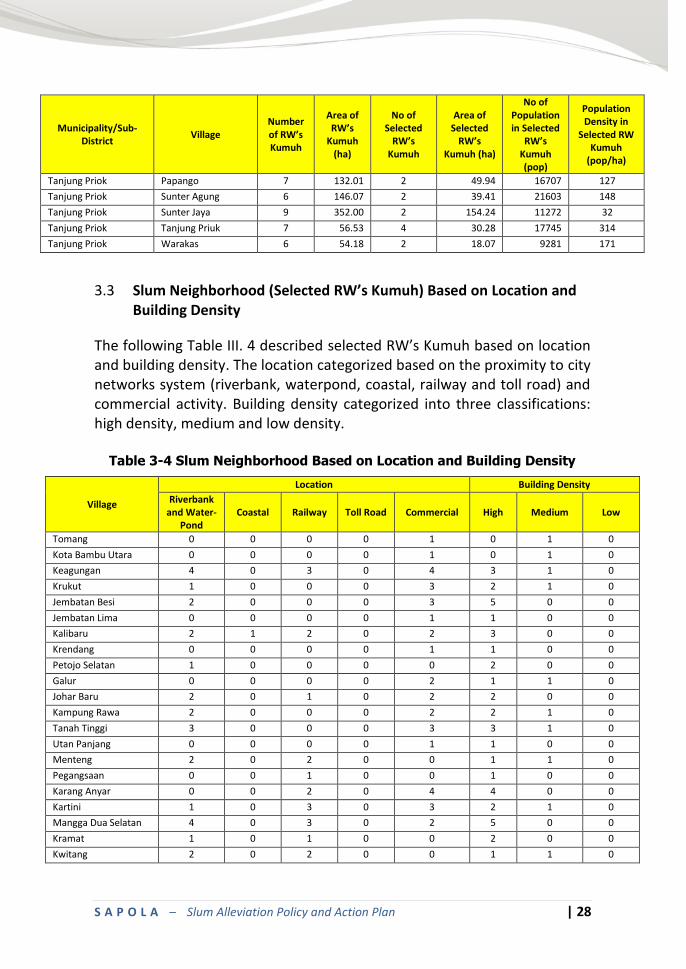
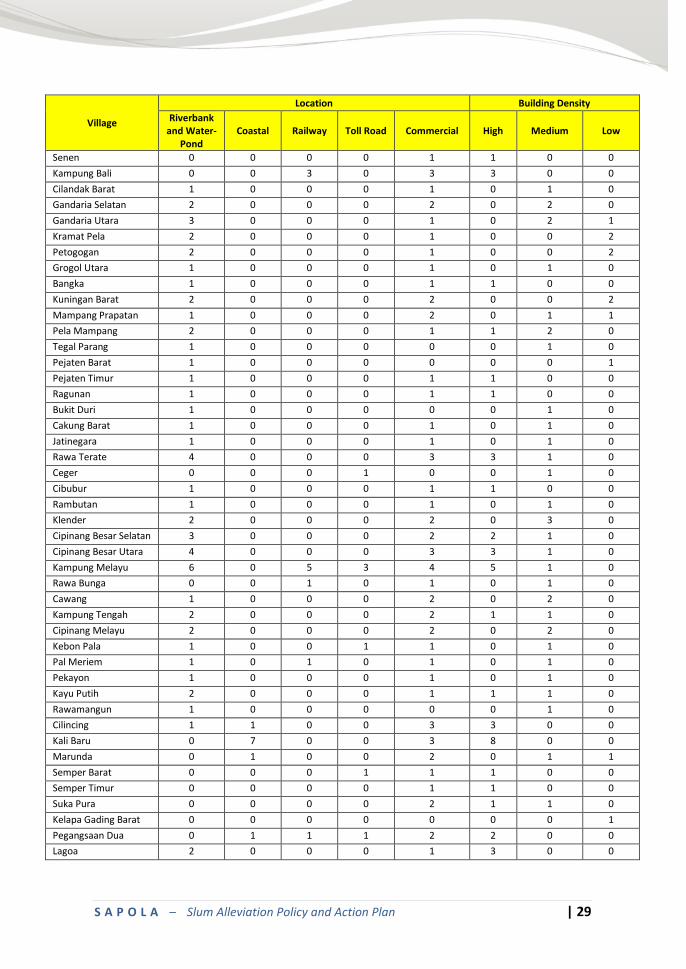
Slum Neighborhood (Selected RW’s Kumuh) Based on Location and 3.3Building Density
The following Table III. 4 described selected RW’s Kumuh based on location and building density. The location categorized based on the proximity to city networks system (riverbank, waterpond, coastal, railway and toll road) and commercial activity. Building density categorized into three classifications: high density, medium and low density.
Table 3-4 Slum Neighborhood Based on Location and Building Density
Village
Location Building Density
Riverbank and Water-
Pond Coastal Railway Toll Road Commercial High Medium Low
Tomang 0 0 0 0 1 0 1 0
Kota Bambu Utara 0 0 0 0 1 0 1 0
Keagungan 4 0 3 0 4 3 1 0
Krukut 1 0 0 0 3 2 1 0
Jembatan Besi 2 0 0 0 3 5 0 0
Jembatan Lima 0 0 0 0 1 1 0 0
Kalibaru 2 1 2 0 2 3 0 0
Krendang 0 0 0 0 1 1 0 0
Petojo Selatan 1 0 0 0 0 2 0 0
Galur 0 0 0 0 2 1 1 0
Johar Baru 2 0 1 0 2 2 0 0
Kampung Rawa 2 0 0 0 2 2 1 0
Tanah Tinggi 3 0 0 0 3 3 1 0
Utan Panjang 0 0 0 0 1 1 0 0
Menteng 2 0 2 0 0 1 1 0
Pegangsaan 0 0 1 0 0 1 0 0
Karang Anyar 0 0 2 0 4 4 0 0
Kartini 1 0 3 0 3 2 1 0
Mangga Dua Selatan 4 0 3 0 2 5 0 0
Kramat 1 0 1 0 0 2 0 0
Kwitang 2 0 2 0 0 1 1 0
S A P O L A – Slum Alleviation Policy and Action Plan | 29
Village
Location Building Density
Riverbank and Water-
Pond Coastal Railway Toll Road Commercial High Medium Low
Senen 0 0 0 0 1 1 0 0
Kampung Bali 0 0 3 0 3 3 0 0
Cilandak Barat 1 0 0 0 1 0 1 0
Gandaria Selatan 2 0 0 0 2 0 2 0
Gandaria Utara 3 0 0 0 1 0 2 1
Kramat Pela 2 0 0 0 1 0 0 2
Petogogan 2 0 0 0 1 0 0 2
Grogol Utara 1 0 0 0 1 0 1 0
Bangka 1 0 0 0 1 1 0 0
Kuningan Barat 2 0 0 0 2 0 0 2
Mampang Prapatan 1 0 0 0 2 0 1 1
Pela Mampang 2 0 0 0 1 1 2 0
Tegal Parang 1 0 0 0 0 0 1 0
Pejaten Barat 1 0 0 0 0 0 0 1
Pejaten Timur 1 0 0 0 1 1 0 0
Ragunan 1 0 0 0 1 1 0 0
Bukit Duri 1 0 0 0 0 0 1 0
Cakung Barat 1 0 0 0 1 0 1 0
Jatinegara 1 0 0 0 1 0 1 0
Rawa Terate 4 0 0 0 3 3 1 0
Ceger 0 0 0 1 0 0 1 0
Cibubur 1 0 0 0 1 1 0 0
Rambutan 1 0 0 0 1 0 1 0
Klender 2 0 0 0 2 0 3 0
Cipinang Besar Selatan 3 0 0 0 2 2 1 0
Cipinang Besar Utara 4 0 0 0 3 3 1 0
Kampung Melayu 6 0 5 3 4 5 1 0
Rawa Bunga 0 0 1 0 1 0 1 0
Cawang 1 0 0 0 2 0 2 0
Kampung Tengah 2 0 0 0 2 1 1 0
Cipinang Melayu 2 0 0 0 2 0 2 0
Kebon Pala 1 0 0 1 1 0 1 0
Pal Meriem 1 0 1 0 1 0 1 0
Pekayon 1 0 0 0 1 0 1 0
Kayu Putih 2 0 0 0 1 1 1 0
Rawamangun 1 0 0 0 0 0 1 0
Cilincing 1 1 0 0 3 3 0 0
Kali Baru 0 7 0 0 3 8 0 0
Marunda 0 1 0 0 2 0 1 1
Semper Barat 0 0 0 1 1 1 0 0
Semper Timur 0 0 0 0 1 1 0 0
Suka Pura 0 0 0 0 2 1 1 0
Kelapa Gading Barat 0 0 0 0 0 0 0 1
Pegangsaan Dua 0 1 1 1 2 2 0 0
Lagoa 2 0 0 0 1 3 0 0
S A P O L A – Slum Alleviation Policy and Action Plan | 30
Village
Location Building Density
Riverbank and Water-
Pond Coastal Railway Toll Road Commercial High Medium Low
Tugu Selatan 1 0 0 0 0 2 0 0
Tugu Utara 1 1 1 1 5 5 0 0
Ancol 2 1 0 0 2 4 0 0
Pademangan Barat 1 1 5 1 4 6 0 2
Pademangan Timur 1 0 1 1 1 1 0 0
Penjaringan 3 3 1 2 8 9 2 0
Kebon Bawang 2 0 0 0 1 1 1 0
Papango 2 0 0 0 0 1 1 0
Sunter Agung 2 0 0 0 0 2 0 0
Sunter Jaya 1 0 0 0 1 2 0 0
Tanjung Priuk 0 0 3 0 0 4 0 0
Warakas 1 0 0 1 1 2 0 0
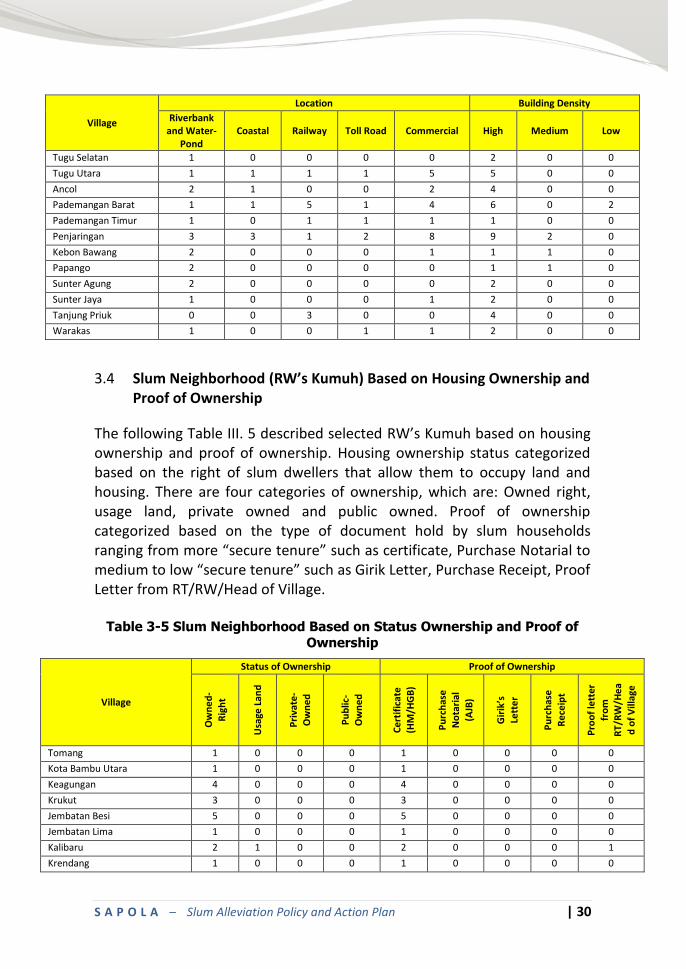
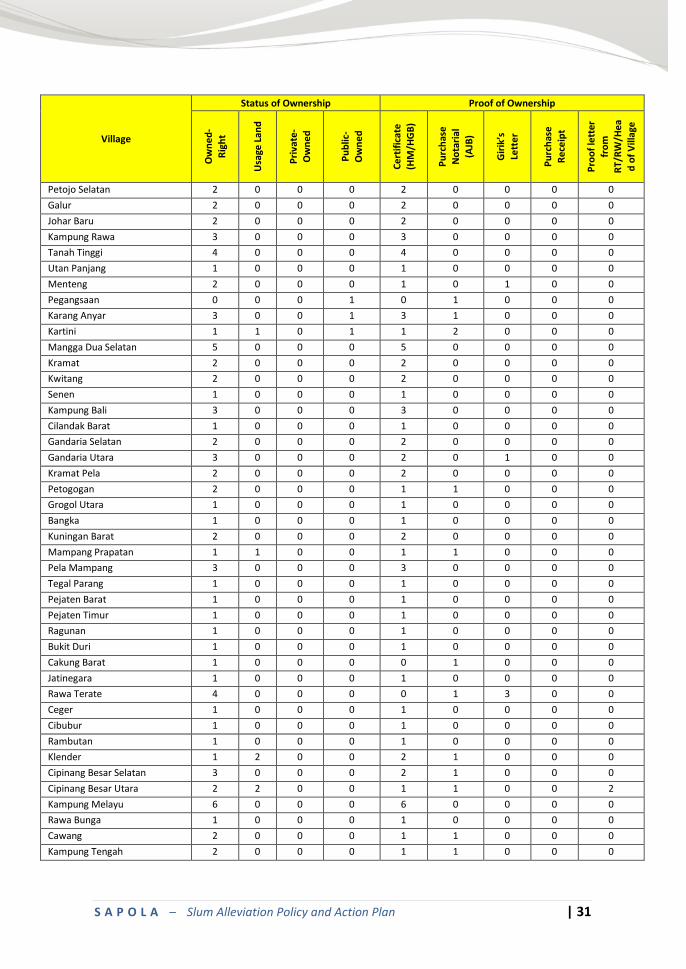
Slum Neighborhood (RW’s Kumuh) Based on Housing Ownership and 3.4Proof of Ownership
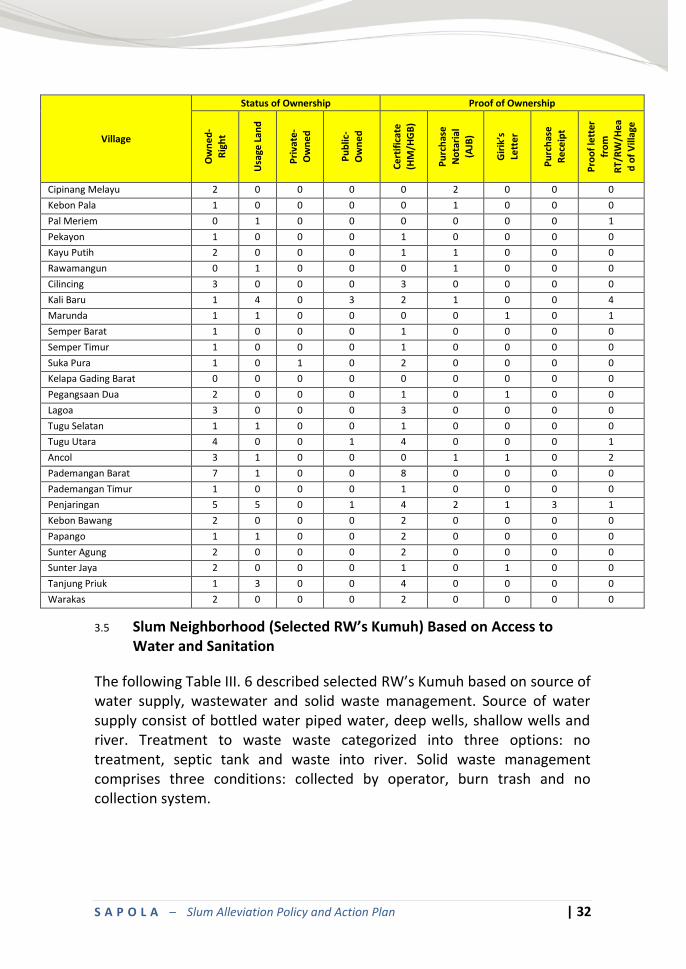
The following Table III. 5 described selected RW’s Kumuh based on housing ownership and proof of ownership. Housing ownership status categorized based on the right of slum dwellers that allow them to occupy land and housing. There are four categories of ownership, which are: Owned right, usage land, private owned and public owned. Proof of ownership categorized based on the type of document hold by slum households ranging from more “secure tenure” such as certificate, Purchase Notarial to medium to low “secure tenure” such as Girik Letter, Purchase Receipt, Proof Letter from RT/RW/Head of Village.
Table 3-5 Slum Neighborhood Based on Status Ownership and Proof of
Ownership
Village
Status of Ownership Proof of Ownership
Ow
ne
d-
Rig
ht
Usa
ge L
and
Pri
vate
-O
wn
ed
Pu
blic
-O
wn
ed
Ce
rtif
icat
e
(HM
/HG
B)
Pu
rch
ase
N
ota
rial
(AJB
)
Gir
ik’s
Lett
er
Pu
rch
ase
Re
ceip
t
Pro
of
lett
er
fro
m
RT/
RW
/He
a
d o
f V
illag
e
Tomang 1 0 0 0 1 0 0 0 0
Kota Bambu Utara 1 0 0 0 1 0 0 0 0
Keagungan 4 0 0 0 4 0 0 0 0
Krukut 3 0 0 0 3 0 0 0 0
Jembatan Besi 5 0 0 0 5 0 0 0 0
Jembatan Lima 1 0 0 0 1 0 0 0 0
Kalibaru 2 1 0 0 2 0 0 0 1
Krendang 1 0 0 0 1 0 0 0 0
S A P O L A – Slum Alleviation Policy and Action Plan | 31
Village
Status of Ownership Proof of Ownership
Ow
ne
d-
Rig
ht
Usa
ge L
and
Pri
vate
-O
wn
ed
Pu
blic
-O
wn
ed
Ce
rtif
icat
e
(HM
/HG
B)
Pu
rch
ase
N
ota
rial
(AJB
)
Gir
ik’s
Lett
er
Pu
rch
ase
Re
ceip
t
Pro
of
lett
er
fro
m
RT/
RW
/He
a
d o
f V
illag
e
Petojo Selatan 2 0 0 0 2 0 0 0 0
Galur 2 0 0 0 2 0 0 0 0
Johar Baru 2 0 0 0 2 0 0 0 0
Kampung Rawa 3 0 0 0 3 0 0 0 0
Tanah Tinggi 4 0 0 0 4 0 0 0 0
Utan Panjang 1 0 0 0 1 0 0 0 0
Menteng 2 0 0 0 1 0 1 0 0
Pegangsaan 0 0 0 1 0 1 0 0 0
Karang Anyar 3 0 0 1 3 1 0 0 0
Kartini 1 1 0 1 1 2 0 0 0
Mangga Dua Selatan 5 0 0 0 5 0 0 0 0
Kramat 2 0 0 0 2 0 0 0 0
Kwitang 2 0 0 0 2 0 0 0 0
Senen 1 0 0 0 1 0 0 0 0
Kampung Bali 3 0 0 0 3 0 0 0 0
Cilandak Barat 1 0 0 0 1 0 0 0 0
Gandaria Selatan 2 0 0 0 2 0 0 0 0
Gandaria Utara 3 0 0 0 2 0 1 0 0
Kramat Pela 2 0 0 0 2 0 0 0 0
Petogogan 2 0 0 0 1 1 0 0 0
Grogol Utara 1 0 0 0 1 0 0 0 0
Bangka 1 0 0 0 1 0 0 0 0
Kuningan Barat 2 0 0 0 2 0 0 0 0
Mampang Prapatan 1 1 0 0 1 1 0 0 0
Pela Mampang 3 0 0 0 3 0 0 0 0
Tegal Parang 1 0 0 0 1 0 0 0 0
Pejaten Barat 1 0 0 0 1 0 0 0 0
Pejaten Timur 1 0 0 0 1 0 0 0 0
Ragunan 1 0 0 0 1 0 0 0 0
Bukit Duri 1 0 0 0 1 0 0 0 0
Cakung Barat 1 0 0 0 0 1 0 0 0
Jatinegara 1 0 0 0 1 0 0 0 0
Rawa Terate 4 0 0 0 0 1 3 0 0
Ceger 1 0 0 0 1 0 0 0 0
Cibubur 1 0 0 0 1 0 0 0 0
Rambutan 1 0 0 0 1 0 0 0 0
Klender 1 2 0 0 2 1 0 0 0
Cipinang Besar Selatan 3 0 0 0 2 1 0 0 0
Cipinang Besar Utara 2 2 0 0 1 1 0 0 2
Kampung Melayu 6 0 0 0 6 0 0 0 0
Rawa Bunga 1 0 0 0 1 0 0 0 0
Cawang 2 0 0 0 1 1 0 0 0
Kampung Tengah 2 0 0 0 1 1 0 0 0
S A P O L A – Slum Alleviation Policy and Action Plan | 32
Village
Status of Ownership Proof of Ownership
Ow
ne
d-
Rig
ht
Usa
ge L
and
Pri
vate
-O
wn
ed
Pu
blic
-O
wn
ed
Ce
rtif
icat
e
(HM
/HG
B)
Pu
rch
ase
N
ota
rial
(AJB
)
Gir
ik’s
Lett
er
Pu
rch
ase
Re
ceip
t
Pro
of
lett
er
fro
m
RT/
RW
/He
a
d o
f V
illag
e
Cipinang Melayu 2 0 0 0 0 2 0 0 0
Kebon Pala 1 0 0 0 0 1 0 0 0
Pal Meriem 0 1 0 0 0 0 0 0 1
Pekayon 1 0 0 0 1 0 0 0 0
Kayu Putih 2 0 0 0 1 1 0 0 0
Rawamangun 0 1 0 0 0 1 0 0 0
Cilincing 3 0 0 0 3 0 0 0 0
Kali Baru 1 4 0 3 2 1 0 0 4
Marunda 1 1 0 0 0 0 1 0 1
Semper Barat 1 0 0 0 1 0 0 0 0
Semper Timur 1 0 0 0 1 0 0 0 0
Suka Pura 1 0 1 0 2 0 0 0 0
Kelapa Gading Barat 0 0 0 0 0 0 0 0 0
Pegangsaan Dua 2 0 0 0 1 0 1 0 0
Lagoa 3 0 0 0 3 0 0 0 0
Tugu Selatan 1 1 0 0 1 0 0 0 0
Tugu Utara 4 0 0 1 4 0 0 0 1
Ancol 3 1 0 0 0 1 1 0 2
Pademangan Barat 7 1 0 0 8 0 0 0 0
Pademangan Timur 1 0 0 0 1 0 0 0 0
Penjaringan 5 5 0 1 4 2 1 3 1
Kebon Bawang 2 0 0 0 2 0 0 0 0
Papango 1 1 0 0 2 0 0 0 0
Sunter Agung 2 0 0 0 2 0 0 0 0
Sunter Jaya 2 0 0 0 1 0 1 0 0
Tanjung Priuk 1 3 0 0 4 0 0 0 0
Warakas 2 0 0 0 2 0 0 0 0
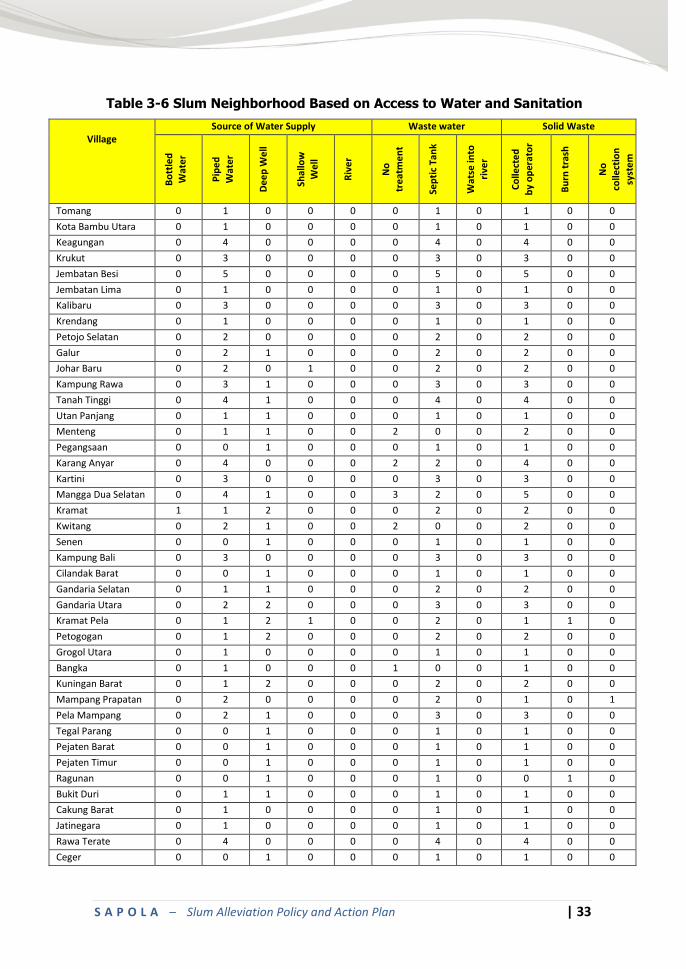
Slum Neighborhood (Selected RW’s Kumuh) Based on Access to 3.5
Water and Sanitation
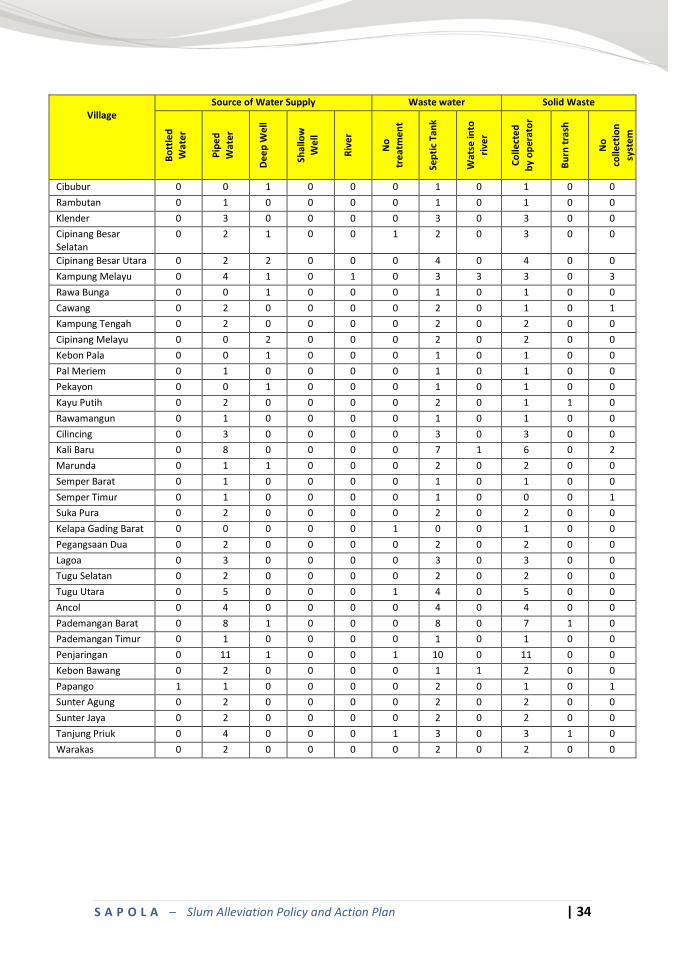
The following Table III. 6 described selected RW’s Kumuh based on source of water supply, wastewater and solid waste management. Source of water supply consist of bottled water piped water, deep wells, shallow wells and river. Treatment to waste waste categorized into three options: no treatment, septic tank and waste into river. Solid waste management comprises three conditions: collected by operator, burn trash and no collection system.
S A P O L A – Slum Alleviation Policy and Action Plan | 33
Table 3-6 Slum Neighborhood Based on Access to Water and Sanitation
Village
Source of Water Supply Waste water Solid Waste
Bo
ttle
d
Wat
er
Pip
ed
Wat
er
De
ep
We
ll
Shal
low
W
ell
Riv
er
No
tr
eat
me
nt
Sep
tic
Tan
k
Wat
se in
to
rive
r
Co
llect
ed
by
op
erat
or
Bu
rn t
rash
No
co
llect
ion
syst
em
Tomang 0 1 0 0 0 0 1 0 1 0 0
Kota Bambu Utara 0 1 0 0 0 0 1 0 1 0 0
Keagungan 0 4 0 0 0 0 4 0 4 0 0
Krukut 0 3 0 0 0 0 3 0 3 0 0
Jembatan Besi 0 5 0 0 0 0 5 0 5 0 0
Jembatan Lima 0 1 0 0 0 0 1 0 1 0 0
Kalibaru 0 3 0 0 0 0 3 0 3 0 0
Krendang 0 1 0 0 0 0 1 0 1 0 0
Petojo Selatan 0 2 0 0 0 0 2 0 2 0 0
Galur 0 2 1 0 0 0 2 0 2 0 0
Johar Baru 0 2 0 1 0 0 2 0 2 0 0
Kampung Rawa 0 3 1 0 0 0 3 0 3 0 0
Tanah Tinggi 0 4 1 0 0 0 4 0 4 0 0
Utan Panjang 0 1 1 0 0 0 1 0 1 0 0
Menteng 0 1 1 0 0 2 0 0 2 0 0
Pegangsaan 0 0 1 0 0 0 1 0 1 0 0
Karang Anyar 0 4 0 0 0 2 2 0 4 0 0
Kartini 0 3 0 0 0 0 3 0 3 0 0
Mangga Dua Selatan 0 4 1 0 0 3 2 0 5 0 0
Kramat 1 1 2 0 0 0 2 0 2 0 0
Kwitang 0 2 1 0 0 2 0 0 2 0 0
Senen 0 0 1 0 0 0 1 0 1 0 0
Kampung Bali 0 3 0 0 0 0 3 0 3 0 0
Cilandak Barat 0 0 1 0 0 0 1 0 1 0 0
Gandaria Selatan 0 1 1 0 0 0 2 0 2 0 0
Gandaria Utara 0 2 2 0 0 0 3 0 3 0 0
Kramat Pela 0 1 2 1 0 0 2 0 1 1 0
Petogogan 0 1 2 0 0 0 2 0 2 0 0
Grogol Utara 0 1 0 0 0 0 1 0 1 0 0
Bangka 0 1 0 0 0 1 0 0 1 0 0
Kuningan Barat 0 1 2 0 0 0 2 0 2 0 0
Mampang Prapatan 0 2 0 0 0 0 2 0 1 0 1
Pela Mampang 0 2 1 0 0 0 3 0 3 0 0
Tegal Parang 0 0 1 0 0 0 1 0 1 0 0
Pejaten Barat 0 0 1 0 0 0 1 0 1 0 0
Pejaten Timur 0 0 1 0 0 0 1 0 1 0 0
Ragunan 0 0 1 0 0 0 1 0 0 1 0
Bukit Duri 0 1 1 0 0 0 1 0 1 0 0
Cakung Barat 0 1 0 0 0 0 1 0 1 0 0
Jatinegara 0 1 0 0 0 0 1 0 1 0 0
Rawa Terate 0 4 0 0 0 0 4 0 4 0 0
Ceger 0 0 1 0 0 0 1 0 1 0 0
S A P O L A – Slum Alleviation Policy and Action Plan | 34
Village
Source of Water Supply Waste water Solid Waste
Bo
ttle
d
Wat
er
Pip
ed
Wat
er
De
ep
We
ll
Shal
low
W
ell
Riv
er
No
tr
eat
me
nt
Sep
tic
Tan
k
Wat
se in
to
rive
r
Co
llect
ed
by
op
erat
or
Bu
rn t
rash
No
co
llect
ion
syst
em
Cibubur 0 0 1 0 0 0 1 0 1 0 0
Rambutan 0 1 0 0 0 0 1 0 1 0 0
Klender 0 3 0 0 0 0 3 0 3 0 0
Cipinang Besar Selatan
0 2 1 0 0 1 2 0 3 0 0
Cipinang Besar Utara 0 2 2 0 0 0 4 0 4 0 0
Kampung Melayu 0 4 1 0 1 0 3 3 3 0 3
Rawa Bunga 0 0 1 0 0 0 1 0 1 0 0
Cawang 0 2 0 0 0 0 2 0 1 0 1
Kampung Tengah 0 2 0 0 0 0 2 0 2 0 0
Cipinang Melayu 0 0 2 0 0 0 2 0 2 0 0
Kebon Pala 0 0 1 0 0 0 1 0 1 0 0
Pal Meriem 0 1 0 0 0 0 1 0 1 0 0
Pekayon 0 0 1 0 0 0 1 0 1 0 0
Kayu Putih 0 2 0 0 0 0 2 0 1 1 0
Rawamangun 0 1 0 0 0 0 1 0 1 0 0
Cilincing 0 3 0 0 0 0 3 0 3 0 0
Kali Baru 0 8 0 0 0 0 7 1 6 0 2
Marunda 0 1 1 0 0 0 2 0 2 0 0
Semper Barat 0 1 0 0 0 0 1 0 1 0 0
Semper Timur 0 1 0 0 0 0 1 0 0 0 1
Suka Pura 0 2 0 0 0 0 2 0 2 0 0
Kelapa Gading Barat 0 0 0 0 0 1 0 0 1 0 0
Pegangsaan Dua 0 2 0 0 0 0 2 0 2 0 0
Lagoa 0 3 0 0 0 0 3 0 3 0 0
Tugu Selatan 0 2 0 0 0 0 2 0 2 0 0
Tugu Utara 0 5 0 0 0 1 4 0 5 0 0
Ancol 0 4 0 0 0 0 4 0 4 0 0
Pademangan Barat 0 8 1 0 0 0 8 0 7 1 0
Pademangan Timur 0 1 0 0 0 0 1 0 1 0 0
Penjaringan 0 11 1 0 0 1 10 0 11 0 0
Kebon Bawang 0 2 0 0 0 0 1 1 2 0 0
Papango 1 1 0 0 0 0 2 0 1 0 1
Sunter Agung 0 2 0 0 0 0 2 0 2 0 0
Sunter Jaya 0 2 0 0 0 0 2 0 2 0 0
Tanjung Priuk 0 4 0 0 0 1 3 0 3 1 0
Warakas 0 2 0 0 0 0 2 0 2 0 0
S A P O L A – Slum Alleviation Policy and Action Plan | 35
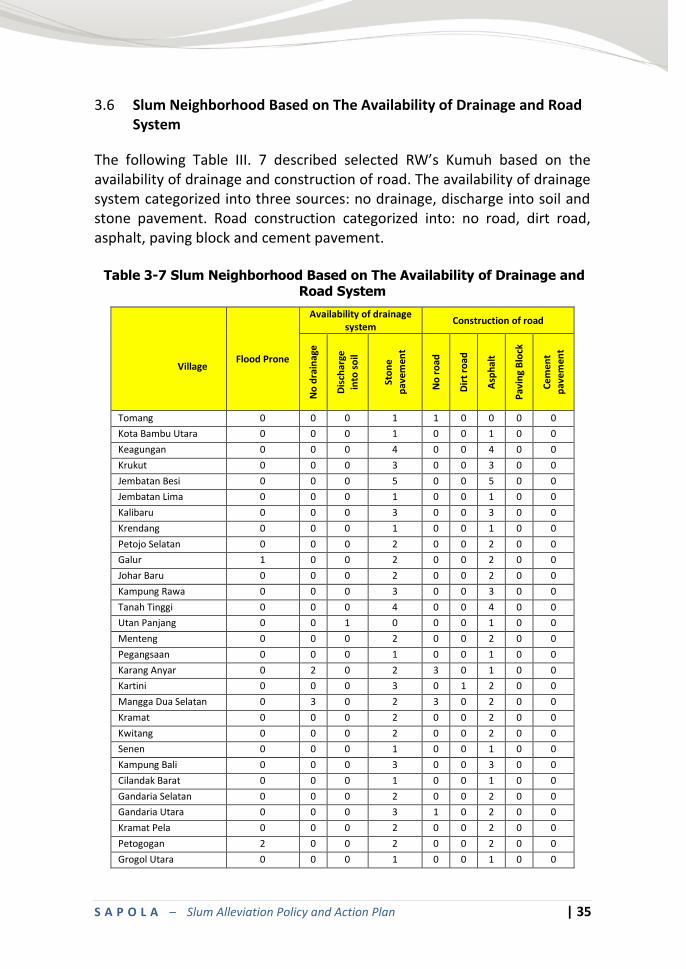
Slum Neighborhood Based on The Availability of Drainage and Road 3.6System
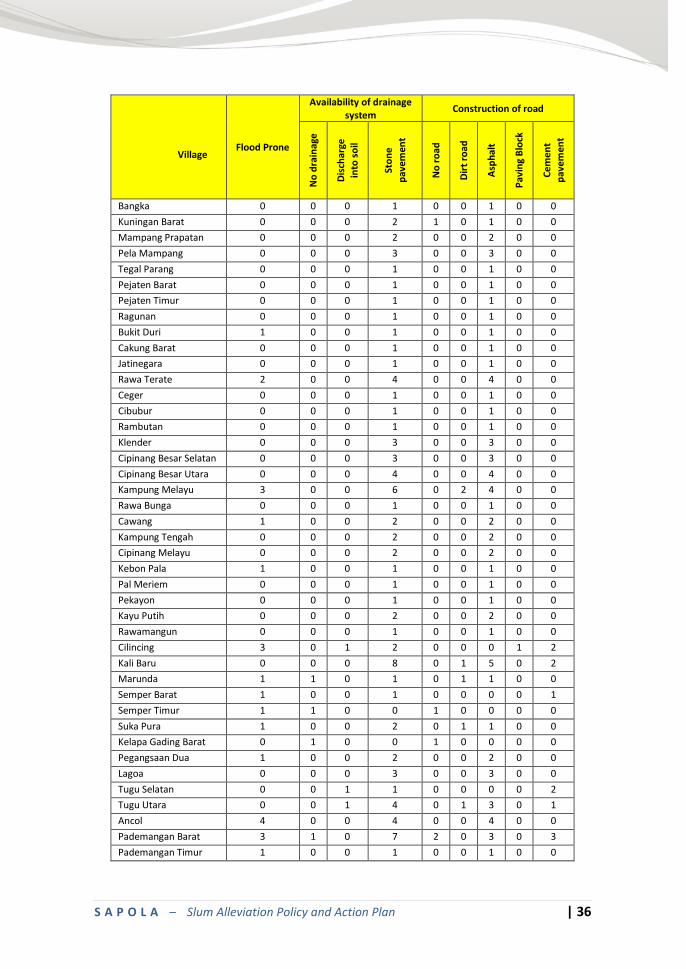
The following Table III. 7 described selected RW’s Kumuh based on the availability of drainage and construction of road. The availability of drainage system categorized into three sources: no drainage, discharge into soil and stone pavement. Road construction categorized into: no road, dirt road, asphalt, paving block and cement pavement. Table 3-7 Slum Neighborhood Based on The Availability of Drainage and
Road System
Village
Flood Prone
Availability of drainage system
Construction of road N
o d
rain
age
Dis
char
ge
into
so
il
Sto
ne
pav
emen
t
No
ro
ad
Dir
t ro
ad
Asp
hal
t
Pav
ing
Blo
ck
Ce
men
t p
avem
ent
Tomang 0 0 0 1 1 0 0 0 0
Kota Bambu Utara 0 0 0 1 0 0 1 0 0
Keagungan 0 0 0 4 0 0 4 0 0
Krukut 0 0 0 3 0 0 3 0 0
Jembatan Besi 0 0 0 5 0 0 5 0 0
Jembatan Lima 0 0 0 1 0 0 1 0 0
Kalibaru 0 0 0 3 0 0 3 0 0
Krendang 0 0 0 1 0 0 1 0 0
Petojo Selatan 0 0 0 2 0 0 2 0 0
Galur 1 0 0 2 0 0 2 0 0
Johar Baru 0 0 0 2 0 0 2 0 0
Kampung Rawa 0 0 0 3 0 0 3 0 0
Tanah Tinggi 0 0 0 4 0 0 4 0 0
Utan Panjang 0 0 1 0 0 0 1 0 0
Menteng 0 0 0 2 0 0 2 0 0
Pegangsaan 0 0 0 1 0 0 1 0 0
Karang Anyar 0 2 0 2 3 0 1 0 0
Kartini 0 0 0 3 0 1 2 0 0
Mangga Dua Selatan 0 3 0 2 3 0 2 0 0
Kramat 0 0 0 2 0 0 2 0 0
Kwitang 0 0 0 2 0 0 2 0 0
Senen 0 0 0 1 0 0 1 0 0
Kampung Bali 0 0 0 3 0 0 3 0 0
Cilandak Barat 0 0 0 1 0 0 1 0 0
Gandaria Selatan 0 0 0 2 0 0 2 0 0
Gandaria Utara 0 0 0 3 1 0 2 0 0
Kramat Pela 0 0 0 2 0 0 2 0 0
Petogogan 2 0 0 2 0 0 2 0 0
Grogol Utara 0 0 0 1 0 0 1 0 0
S A P O L A – Slum Alleviation Policy and Action Plan | 36
Village
Flood Prone
Availability of drainage system
Construction of road
No
dra
inag
e
Dis
char
ge
into
so
il
Sto
ne
pav
emen
t
No
ro
ad
Dir
t ro
ad
Asp
hal
t
Pav
ing
Blo
ck
Ce
men
t p
avem
ent
Bangka 0 0 0 1 0 0 1 0 0
Kuningan Barat 0 0 0 2 1 0 1 0 0
Mampang Prapatan 0 0 0 2 0 0 2 0 0
Pela Mampang 0 0 0 3 0 0 3 0 0
Tegal Parang 0 0 0 1 0 0 1 0 0
Pejaten Barat 0 0 0 1 0 0 1 0 0
Pejaten Timur 0 0 0 1 0 0 1 0 0
Ragunan 0 0 0 1 0 0 1 0 0
Bukit Duri 1 0 0 1 0 0 1 0 0
Cakung Barat 0 0 0 1 0 0 1 0 0
Jatinegara 0 0 0 1 0 0 1 0 0
Rawa Terate 2 0 0 4 0 0 4 0 0
Ceger 0 0 0 1 0 0 1 0 0
Cibubur 0 0 0 1 0 0 1 0 0
Rambutan 0 0 0 1 0 0 1 0 0
Klender 0 0 0 3 0 0 3 0 0
Cipinang Besar Selatan 0 0 0 3 0 0 3 0 0
Cipinang Besar Utara 0 0 0 4 0 0 4 0 0
Kampung Melayu 3 0 0 6 0 2 4 0 0
Rawa Bunga 0 0 0 1 0 0 1 0 0
Cawang 1 0 0 2 0 0 2 0 0
Kampung Tengah 0 0 0 2 0 0 2 0 0
Cipinang Melayu 0 0 0 2 0 0 2 0 0
Kebon Pala 1 0 0 1 0 0 1 0 0
Pal Meriem 0 0 0 1 0 0 1 0 0
Pekayon 0 0 0 1 0 0 1 0 0
Kayu Putih 0 0 0 2 0 0 2 0 0
Rawamangun 0 0 0 1 0 0 1 0 0
Cilincing 3 0 1 2 0 0 0 1 2
Kali Baru 0 0 0 8 0 1 5 0 2
Marunda 1 1 0 1 0 1 1 0 0
Semper Barat 1 0 0 1 0 0 0 0 1
Semper Timur 1 1 0 0 1 0 0 0 0
Suka Pura 1 0 0 2 0 1 1 0 0
Kelapa Gading Barat 0 1 0 0 1 0 0 0 0
Pegangsaan Dua 1 0 0 2 0 0 2 0 0
Lagoa 0 0 0 3 0 0 3 0 0
Tugu Selatan 0 0 1 1 0 0 0 0 2
Tugu Utara 0 0 1 4 0 1 3 0 1
Ancol 4 0 0 4 0 0 4 0 0
Pademangan Barat 3 1 0 7 2 0 3 0 3
Pademangan Timur 1 0 0 1 0 0 1 0 0
S A P O L A – Slum Alleviation Policy and Action Plan | 37
Village
Flood Prone
Availability of drainage system
Construction of road
No
dra
inag
e
Dis
char
ge
into
so
il
Sto
ne
pav
emen
t
No
ro
ad
Dir
t ro
ad
Asp
hal
t
Pav
ing
Blo
ck
Ce
men
t p
avem
ent
Penjaringan 11 1 0 10 4 0 5 0 2
Kebon Bawang 2 0 0 2 0 0 1 0 1
Papango 0 0 0 2 1 0 0 0 1
Sunter Agung 0 0 0 2 0 0 1 0 1
Sunter Jaya 0 1 1 0 0 1 1 0 0
Tanjung Priuk 4 0 0 4 1 0 3 0 0
Warakas 0 0 0 2 0 0 1 0 1
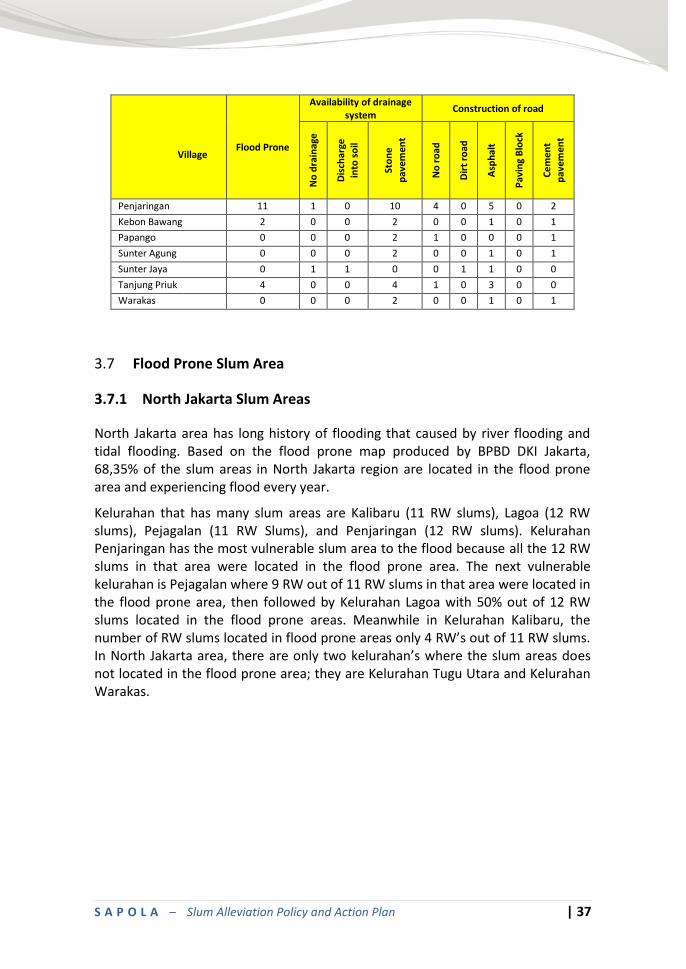
Flood Prone Slum Area 3.7
3.7.1 North Jakarta Slum Areas
North Jakarta area has long history of flooding that caused by river flooding and tidal flooding. Based on the flood prone map produced by BPBD DKI Jakarta, 68,35% of the slum areas in North Jakarta region are located in the flood prone area and experiencing flood every year.
Kelurahan that has many slum areas are Kalibaru (11 RW slums), Lagoa (12 RW slums), Pejagalan (11 RW Slums), and Penjaringan (12 RW slums). Kelurahan Penjaringan has the most vulnerable slum area to the flood because all the 12 RW slums in that area were located in the flood prone area. The next vulnerable kelurahan is Pejagalan where 9 RW out of 11 RW slums in that area were located in the flood prone area, then followed by Kelurahan Lagoa with 50% out of 12 RW slums located in the flood prone areas. Meanwhile in Kelurahan Kalibaru, the number of RW slums located in flood prone areas only 4 RW’s out of 11 RW slums. In North Jakarta area, there are only two kelurahan’s where the slum areas does not located in the flood prone area; they are Kelurahan Tugu Utara and Kelurahan Warakas.
S A P O L A – Slum Alleviation Policy and Action Plan | 38
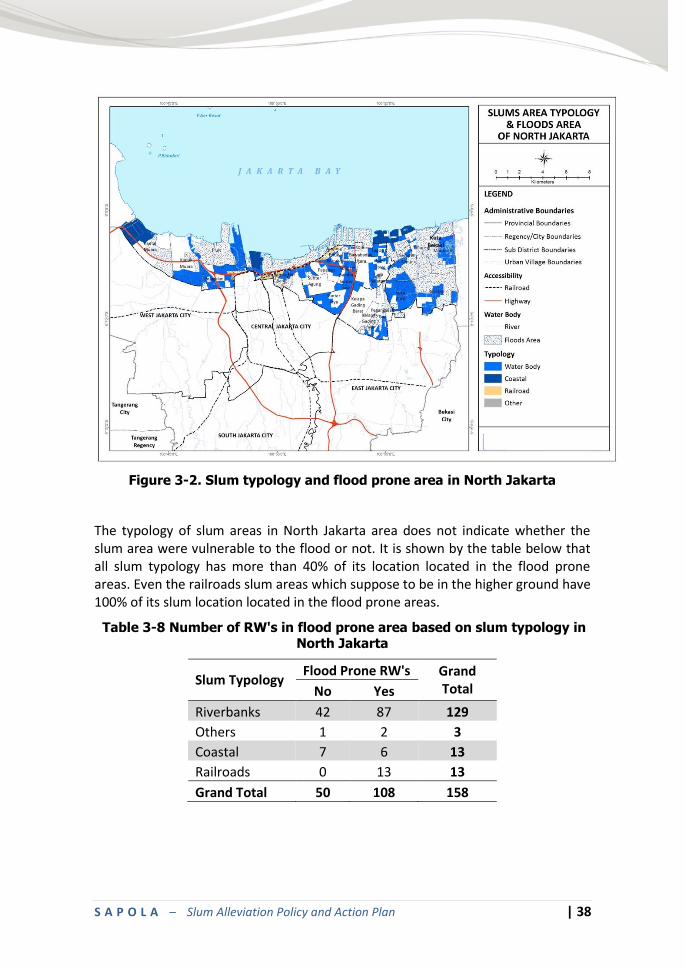
Figure 3-2. Slum typology and flood prone area in North Jakarta
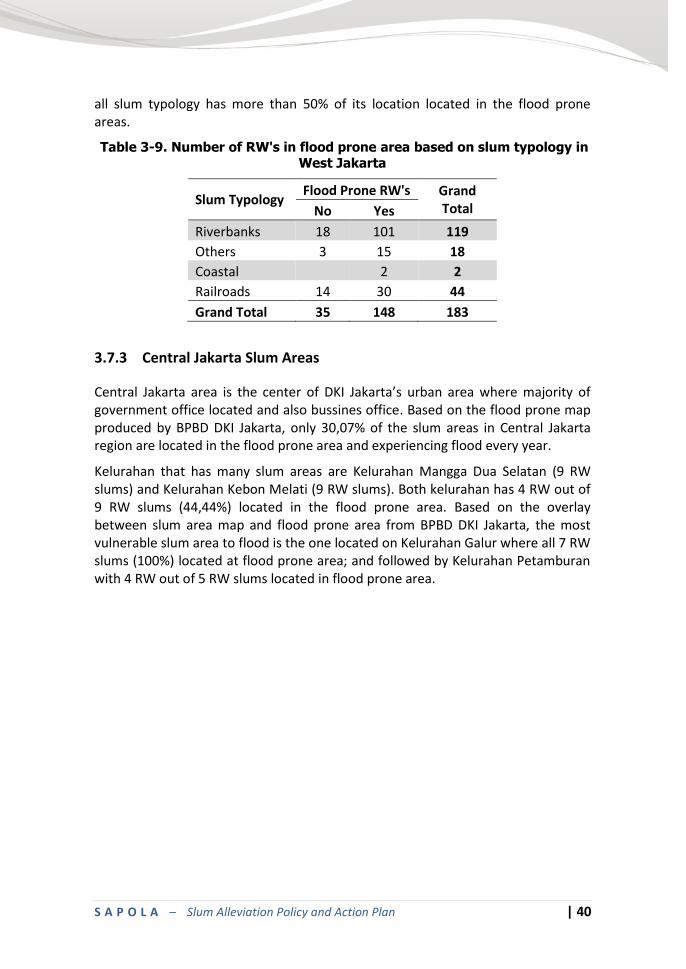
The typology of slum areas in North Jakarta area does not indicate whether the slum area were vulnerable to the flood or not. It is shown by the table below that all slum typology has more than 40% of its location located in the flood prone areas. Even the railroads slum areas which suppose to be in the higher ground have 100% of its slum location located in the flood prone areas.
Table 3-8 Number of RW's in flood prone area based on slum typology in North Jakarta
Slum Typology Flood Prone RW's Grand
Total No Yes
Riverbanks 42 87 129
Others 1 2 3
Coastal 7 6 13
Railroads 0 13 13
Grand Total 50 108 158
S A P O L A – Slum Alleviation Policy and Action Plan | 39
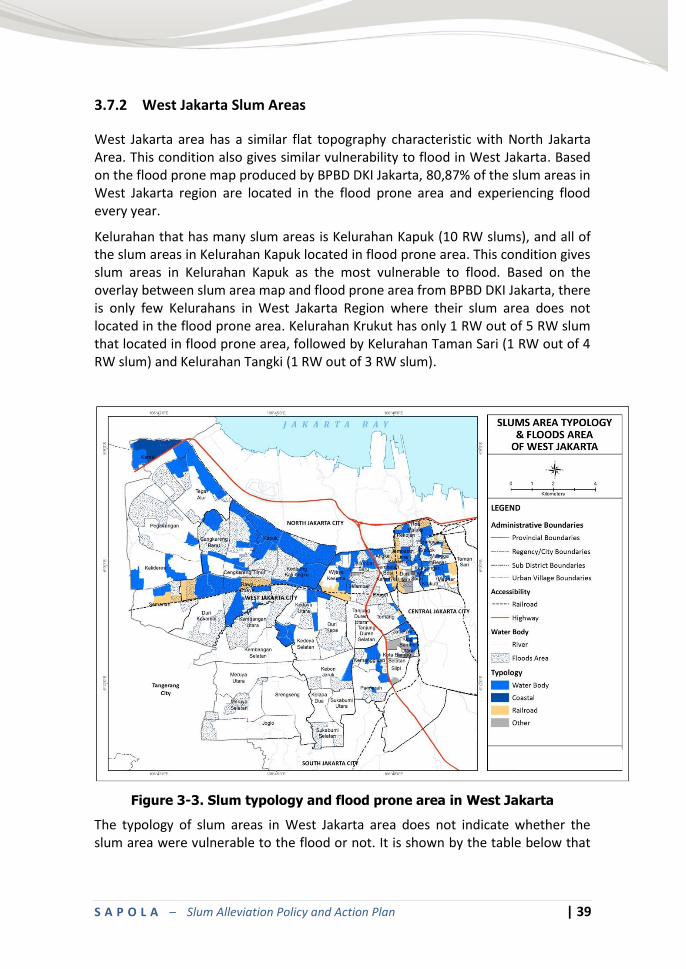
3.7.2 West Jakarta Slum Areas
West Jakarta area has a similar flat topography characteristic with North Jakarta Area. This condition also gives similar vulnerability to flood in West Jakarta. Based on the flood prone map produced by BPBD DKI Jakarta, 80,87% of the slum areas in West Jakarta region are located in the flood prone area and experiencing flood every year.
Kelurahan that has many slum areas is Kelurahan Kapuk (10 RW slums), and all of the slum areas in Kelurahan Kapuk located in flood prone area. This condition gives slum areas in Kelurahan Kapuk as the most vulnerable to flood. Based on the overlay between slum area map and flood prone area from BPBD DKI Jakarta, there is only few Kelurahans in West Jakarta Region where their slum area does not located in the flood prone area. Kelurahan Krukut has only 1 RW out of 5 RW slum that located in flood prone area, followed by Kelurahan Taman Sari (1 RW out of 4 RW slum) and Kelurahan Tangki (1 RW out of 3 RW slum).
Figure 3-3. Slum typology and flood prone area in West Jakarta
The typology of slum areas in West Jakarta area does not indicate whether the slum area were vulnerable to the flood or not. It is shown by the table below that
S A P O L A – Slum Alleviation Policy and Action Plan | 40
all slum typology has more than 50% of its location located in the flood prone areas.
Table 3-9. Number of RW's in flood prone area based on slum typology in West Jakarta
Slum Typology Flood Prone RW's Grand
Total No Yes
Riverbanks 18 101 119
Others 3 15 18
Coastal
2 2
Railroads 14 30 44
Grand Total 35 148 183
3.7.3 Central Jakarta Slum Areas
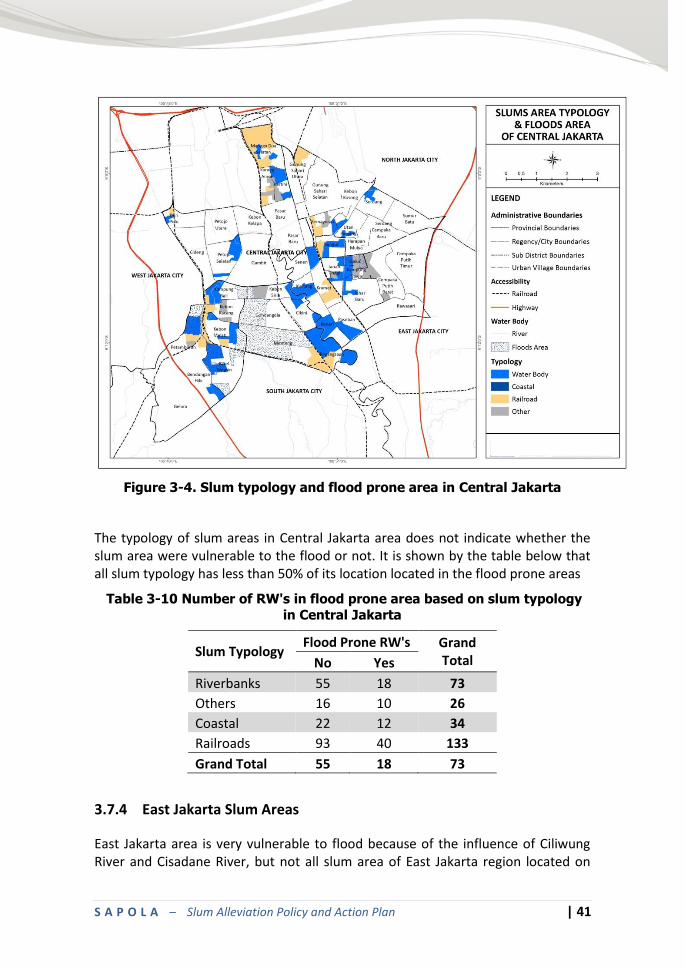
Central Jakarta area is the center of DKI Jakarta’s urban area where majority of government office located and also bussines office. Based on the flood prone map produced by BPBD DKI Jakarta, only 30,07% of the slum areas in Central Jakarta region are located in the flood prone area and experiencing flood every year.
Kelurahan that has many slum areas are Kelurahan Mangga Dua Selatan (9 RW slums) and Kelurahan Kebon Melati (9 RW slums). Both kelurahan has 4 RW out of 9 RW slums (44,44%) located in the flood prone area. Based on the overlay between slum area map and flood prone area from BPBD DKI Jakarta, the most vulnerable slum area to flood is the one located on Kelurahan Galur where all 7 RW slums (100%) located at flood prone area; and followed by Kelurahan Petamburan with 4 RW out of 5 RW slums located in flood prone area.
S A P O L A – Slum Alleviation Policy and Action Plan | 41
Figure 3-4. Slum typology and flood prone area in Central Jakarta
The typology of slum areas in Central Jakarta area does not indicate whether the slum area were vulnerable to the flood or not. It is shown by the table below that all slum typology has less than 50% of its location located in the flood prone areas
Table 3-10 Number of RW's in flood prone area based on slum typology
in Central Jakarta
Slum Typology Flood Prone RW's Grand
Total No Yes
Riverbanks 55 18 73
Others 16 10 26
Coastal 22 12 34
Railroads 93 40 133
Grand Total 55 18 73
3.7.4 East Jakarta Slum Areas
East Jakarta area is very vulnerable to flood because of the influence of Ciliwung River and Cisadane River, but not all slum area of East Jakarta region located on
S A P O L A – Slum Alleviation Policy and Action Plan | 42
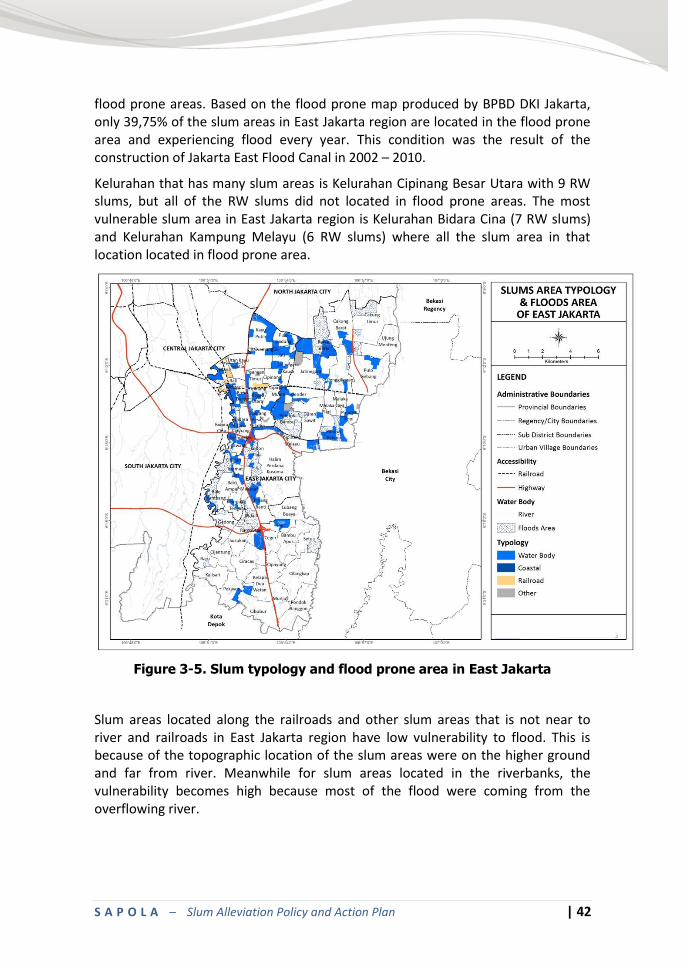
flood prone areas. Based on the flood prone map produced by BPBD DKI Jakarta, only 39,75% of the slum areas in East Jakarta region are located in the flood prone area and experiencing flood every year. This condition was the result of the construction of Jakarta East Flood Canal in 2002 – 2010.
Kelurahan that has many slum areas is Kelurahan Cipinang Besar Utara with 9 RW slums, but all of the RW slums did not located in flood prone areas. The most vulnerable slum area in East Jakarta region is Kelurahan Bidara Cina (7 RW slums) and Kelurahan Kampung Melayu (6 RW slums) where all the slum area in that location located in flood prone area.
Figure 3-5. Slum typology and flood prone area in East Jakarta
Slum areas located along the railroads and other slum areas that is not near to river and railroads in East Jakarta region have low vulnerability to flood. This is because of the topographic location of the slum areas were on the higher ground and far from river. Meanwhile for slum areas located in the riverbanks, the vulnerability becomes high because most of the flood were coming from the overflowing river.
S A P O L A – Slum Alleviation Policy and Action Plan | 43
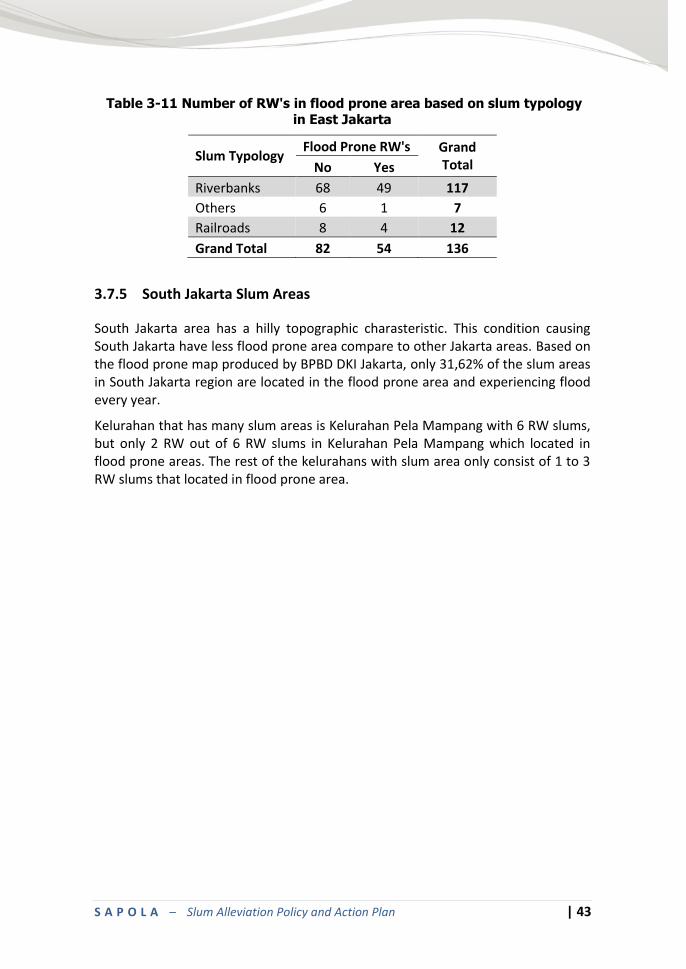
Table 3-11 Number of RW's in flood prone area based on slum typology
in East Jakarta
Slum Typology Flood Prone RW's Grand
Total No Yes
Riverbanks 68 49 117
Others 6 1 7
Railroads 8 4 12
Grand Total 82 54 136
3.7.5 South Jakarta Slum Areas
South Jakarta area has a hilly topographic charasteristic. This condition causing South Jakarta have less flood prone area compare to other Jakarta areas. Based on the flood prone map produced by BPBD DKI Jakarta, only 31,62% of the slum areas in South Jakarta region are located in the flood prone area and experiencing flood every year.
Kelurahan that has many slum areas is Kelurahan Pela Mampang with 6 RW slums, but only 2 RW out of 6 RW slums in Kelurahan Pela Mampang which located in flood prone areas. The rest of the kelurahans with slum area only consist of 1 to 3 RW slums that located in flood prone area.
S A P O L A – Slum Alleviation Policy and Action Plan | 44
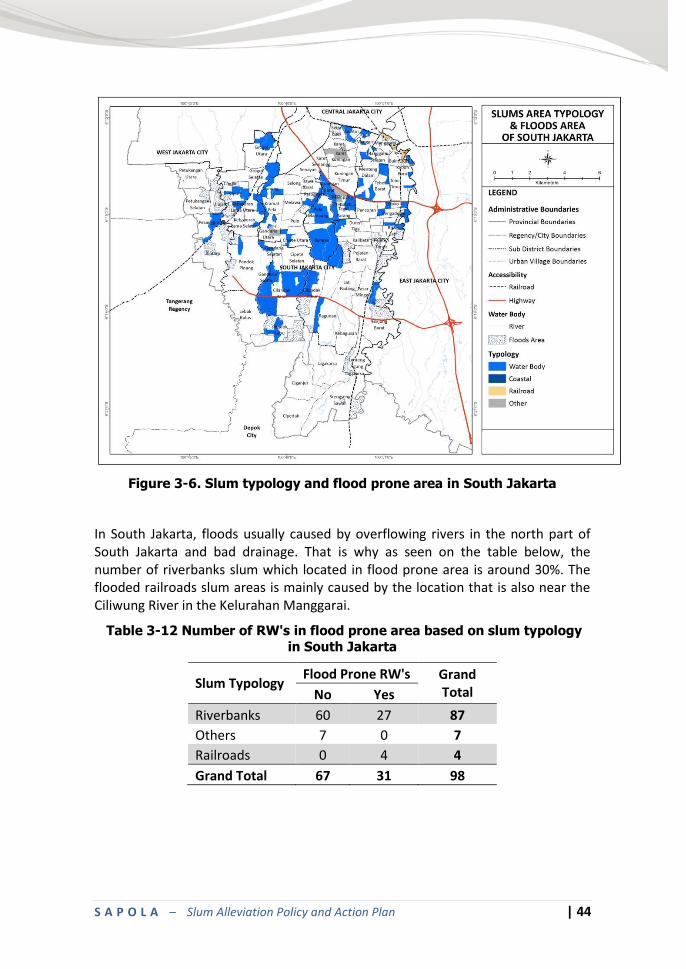
Figure 3-6. Slum typology and flood prone area in South Jakarta
In South Jakarta, floods usually caused by overflowing rivers in the north part of South Jakarta and bad drainage. That is why as seen on the table below, the number of riverbanks slum which located in flood prone area is around 30%. The flooded railroads slum areas is mainly caused by the location that is also near the Ciliwung River in the Kelurahan Manggarai.
Table 3-12 Number of RW's in flood prone area based on slum typology
in South Jakarta
Slum Typology Flood Prone RW's Grand
Total No Yes
Riverbanks 60 27 87
Others 7 0 7
Railroads 0 4 4
Grand Total 67 31 98
S A P O L A – Slum Alleviation Policy and Action Plan | 45
4 PROFILE OF HOUSEHOLD IN SELECTED RW’S
KUMUH
This section elaborates the results of a household survey in selected slum areas with the aimed to further develop the database and contribute a more robust understanding of the slum areas. It is consisted these four main steps: i) design methodology and questionnaire for household survey; ii) household survey; iii) survey results inputted into slum information database and iv) an analysis based on the survey.
Sampling 4.1
4.1.1 Coverage Area
A household survey conducted in slum neighborhood following the 2011 data on RW Kumuh in DKI Jakarta. The unit of analysis is at neighborhood level (RW) and then, in each RW’s, a number of household are taken as the respondent. The population of slum neighborhoods based on 2011 RW Kumuh data is about 392 RW’s which covered 413,078 slum households.
4.1.2 Sampling Frame
A stratified cluster sampling is used as sampling frame in this survey which consisting these following stages: a. The sampling frame for selection of neighborhood unit based on slum
deprivation levels such as: heavy, medium, light and very light slums. This
survey conducted in heavy and medium slums.
b. The sampling frame for selection of neighborhood unit based on location
typologies such as: proximity to river and water-pond; proximity to
railway; proximity to coastal area and proximity to other infrastructure
facilities (toll road, waste disposal site, etc). The location typology
analysed using GIS tool by overlying neighborhood boundary and
proximity to location typologies, i.e: the buffer distance for
riverbank/waterpond/railway is about 200 meter and for coastal area is
about 500 meter.
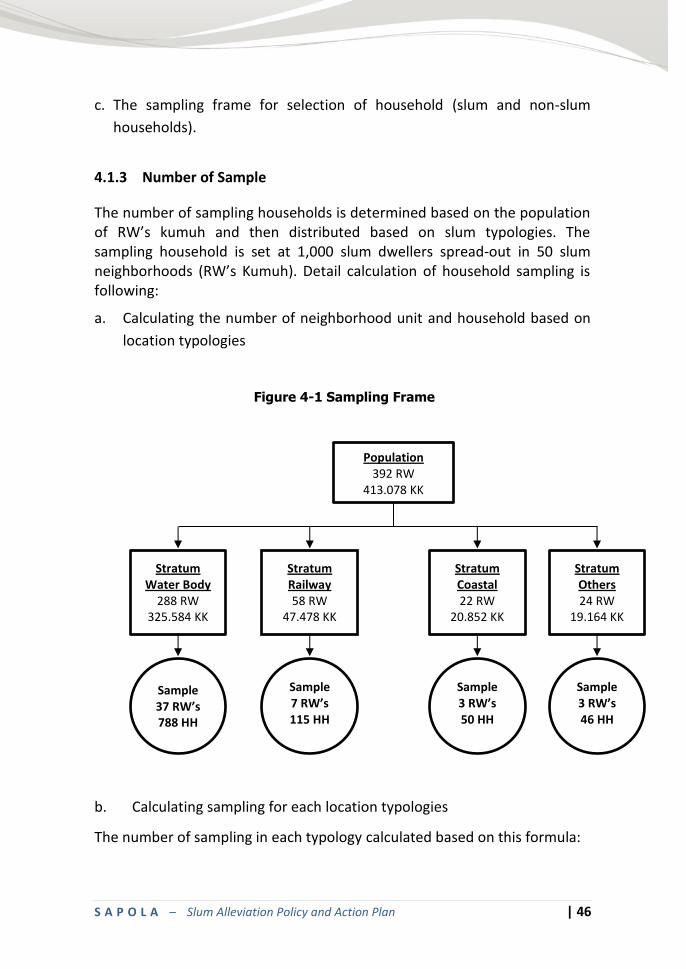
S A P O L A – Slum Alleviation Policy and Action Plan | 46
c. The sampling frame for selection of household (slum and non-slum
households).
4.1.3 Number of Sample
The number of sampling households is determined based on the population of RW’s kumuh and then distributed based on slum typologies. The sampling household is set at 1,000 slum dwellers spread-out in 50 slum neighborhoods (RW’s Kumuh). Detail calculation of household sampling is following:
a. Calculating the number of neighborhood unit and household based on
location typologies
Figure 4-1 Sampling Frame
b. Calculating sampling for each location typologies
The number of sampling in each typology calculated based on this formula:
Population 392 RW
413.078 KK
Stratum Water Body
288 RW 325.584 KK
Stratum Railway 58 RW
47.478 KK
Stratum Coastal 22 RW
20.852 KK
Stratum Others 24 RW
19.164 KK
Sample 37 RW’s 788 HH
Sample 7 RW’s 115 HH
Sample 3 RW’s 50 HH
Sample 3 RW’s 46 HH
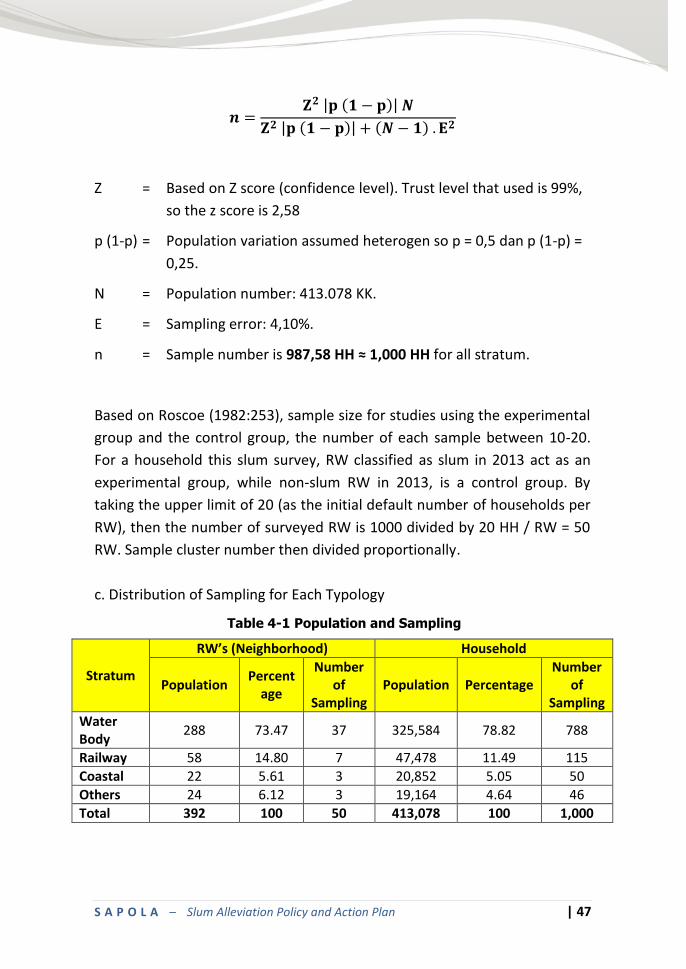
S A P O L A – Slum Alleviation Policy and Action Plan | 47
| ( )|
| ( )| ( )
Z = Based on Z score (confidence level). Trust level that used is 99%,
so the z score is 2,58
p (1-p) = Population variation assumed heterogen so p = 0,5 dan p (1-p) =
0,25.
N = Population number: 413.078 KK.
E = Sampling error: 4,10%.
n = Sample number is 987,58 HH ≈ 1,000 HH for all stratum.
Based on Roscoe (1982:253), sample size for studies using the experimental
group and the control group, the number of each sample between 10-20.
For a household this slum survey, RW classified as slum in 2013 act as an
experimental group, while non-slum RW in 2013, is a control group. By
taking the upper limit of 20 (as the initial default number of households per
RW), then the number of surveyed RW is 1000 divided by 20 HH / RW = 50
RW. Sample cluster number then divided proportionally.
c. Distribution of Sampling for Each Typology
Table 4-1 Population and Sampling
Stratum
RW’s (Neighborhood) Household
Population Percent
age
Number of
Sampling Population Percentage
Number of
Sampling
Water Body
288 73.47 37 325,584 78.82 788
Railway 58 14.80 7 47,478 11.49 115
Coastal 22 5.61 3 20,852 5.05 50
Others 24 6.12 3 19,164 4.64 46
Total 392 100 50 413,078 100 1,000
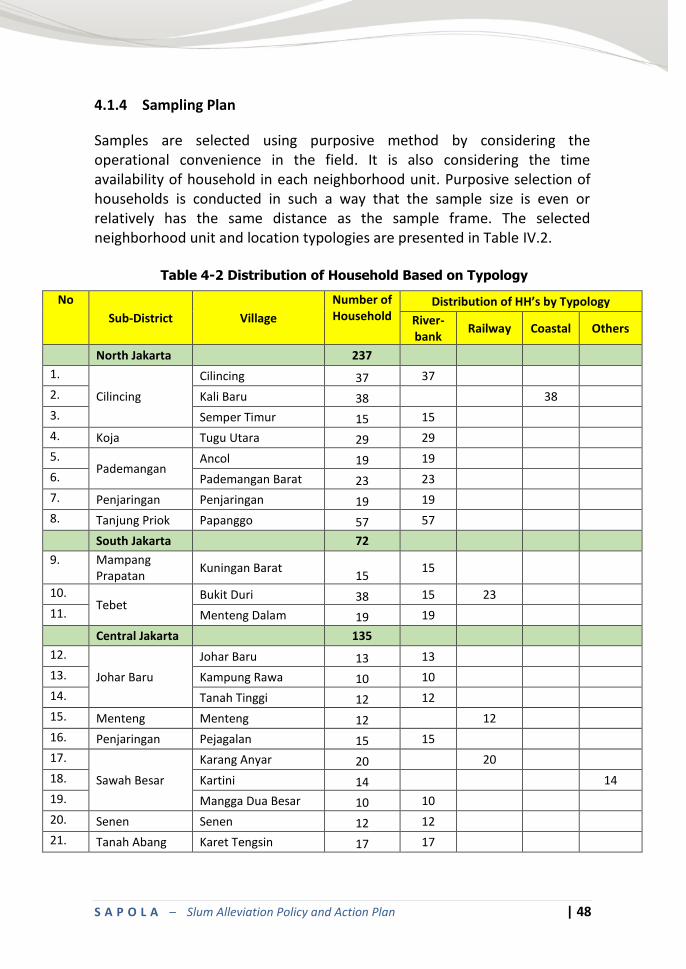
S A P O L A – Slum Alleviation Policy and Action Plan | 48
4.1.4 Sampling Plan
Samples are selected using purposive method by considering the operational convenience in the field. It is also considering the time availability of household in each neighborhood unit. Purposive selection of households is conducted in such a way that the sample size is even or relatively has the same distance as the sample frame. The selected neighborhood unit and location typologies are presented in Table IV.2.
Table 4-2 Distribution of Household Based on Typology
No
Sub-District Village
Number of Household
Distribution of HH’s by Typology
River-bank
Railway Coastal Others
North Jakarta 237
1.
Cilincing
Cilincing 37 37
2. Kali Baru 38 38
3. Semper Timur 15 15
4. Koja Tugu Utara 29 29
5.
Pademangan Ancol 19 19
6. Pademangan Barat 23 23
7. Penjaringan Penjaringan 19 19
8. Tanjung Priok Papanggo 57 57
South Jakarta 72
9. Mampang
Prapatan Kuningan Barat
15 15
10. Tebet
Bukit Duri 38 15 23
11. Menteng Dalam 19 19
Central Jakarta 135
12.
Johar Baru
Johar Baru 13 13
13. Kampung Rawa 10 10
14. Tanah Tinggi 12 12
15. Menteng Menteng 12 12
16. Penjaringan Pejagalan 15 15
17.
Sawah Besar
Karang Anyar 20 20
18. Kartini 14
14
19. Mangga Dua Besar 10 10
20. Senen Senen 12 12
21. Tanah Abang Karet Tengsin 17 17
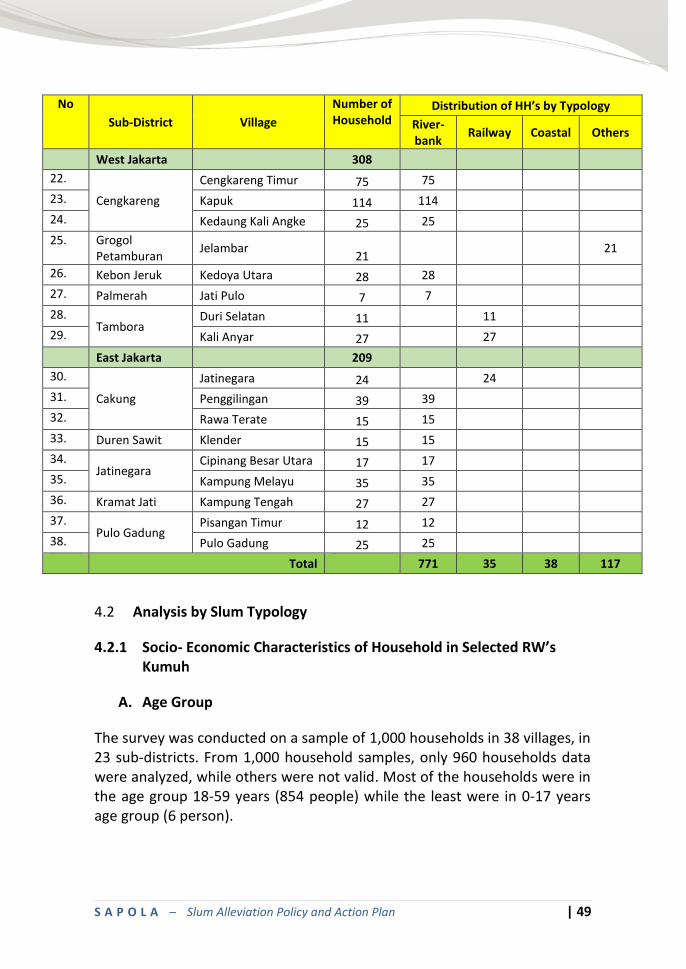
S A P O L A – Slum Alleviation Policy and Action Plan | 49
No
Sub-District Village
Number of Household
Distribution of HH’s by Typology
River-bank
Railway Coastal Others
West Jakarta 308
22.
Cengkareng
Cengkareng Timur 75 75
23. Kapuk 114 114
24. Kedaung Kali Angke 25 25
25. Grogol Petamburan
Jelambar 21
21
26. Kebon Jeruk Kedoya Utara 28 28
27. Palmerah Jati Pulo 7 7
28. Tambora
Duri Selatan 11 11
29. Kali Anyar 27
27
East Jakarta 209
30.
Cakung
Jatinegara 24 24
31. Penggilingan 39 39
32. Rawa Terate 15 15
33. Duren Sawit Klender 15 15
34.
Jatinegara Cipinang Besar Utara 17 17
35. Kampung Melayu 35 35
36. Kramat Jati Kampung Tengah 27 27
37.
Pulo Gadung Pisangan Timur 12 12
38. Pulo Gadung 25 25
Total 771 35 38 117
Analysis by Slum Typology 4.2
4.2.1 Socio- Economic Characteristics of Household in Selected RW’s Kumuh
A. Age Group
The survey was conducted on a sample of 1,000 households in 38 villages, in 23 sub-districts. From 1,000 household samples, only 960 households data were analyzed, while others were not valid. Most of the households were in the age group 18-59 years (854 people) while the least were in 0-17 years age group (6 person).
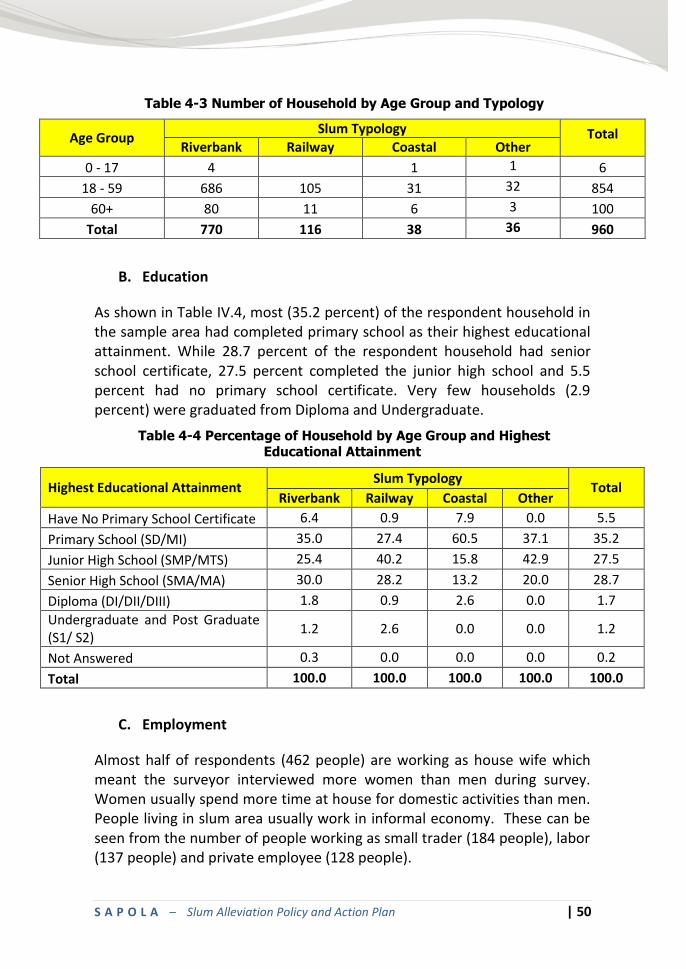
S A P O L A – Slum Alleviation Policy and Action Plan | 50
Table 4-3 Number of Household by Age Group and Typology
Age Group Slum Typology Total
Riverbank Railway Coastal Other
0 - 17 4 1 1 6
18 - 59 686 105 31 32 854
60+ 80 11 6 3 100
Total 770 116 38 36 960
B. Education
As shown in Table IV.4, most (35.2 percent) of the respondent household in the sample area had completed primary school as their highest educational attainment. While 28.7 percent of the respondent household had senior school certificate, 27.5 percent completed the junior high school and 5.5 percent had no primary school certificate. Very few households (2.9 percent) were graduated from Diploma and Undergraduate.
Table 4-4 Percentage of Household by Age Group and Highest Educational Attainment
Highest Educational Attainment Slum Typology
Total Riverbank Railway Coastal Other
Have No Primary School Certificate 6.4 0.9 7.9 0.0 5.5
Primary School (SD/MI) 35.0 27.4 60.5 37.1 35.2
Junior High School (SMP/MTS) 25.4 40.2 15.8 42.9 27.5
Senior High School (SMA/MA) 30.0 28.2 13.2 20.0 28.7
Diploma (DI/DII/DIII) 1.8 0.9 2.6 0.0 1.7
Undergraduate and Post Graduate (S1/ S2)
1.2 2.6 0.0 0.0 1.2
Not Answered 0.3 0.0 0.0 0.0 0.2
Total 100.0 100.0 100.0 100.0 100.0
C. Employment
Almost half of respondents (462 people) are working as house wife which meant the surveyor interviewed more women than men during survey. Women usually spend more time at house for domestic activities than men. People living in slum area usually work in informal economy. These can be seen from the number of people working as small trader (184 people), labor (137 people) and private employee (128 people).
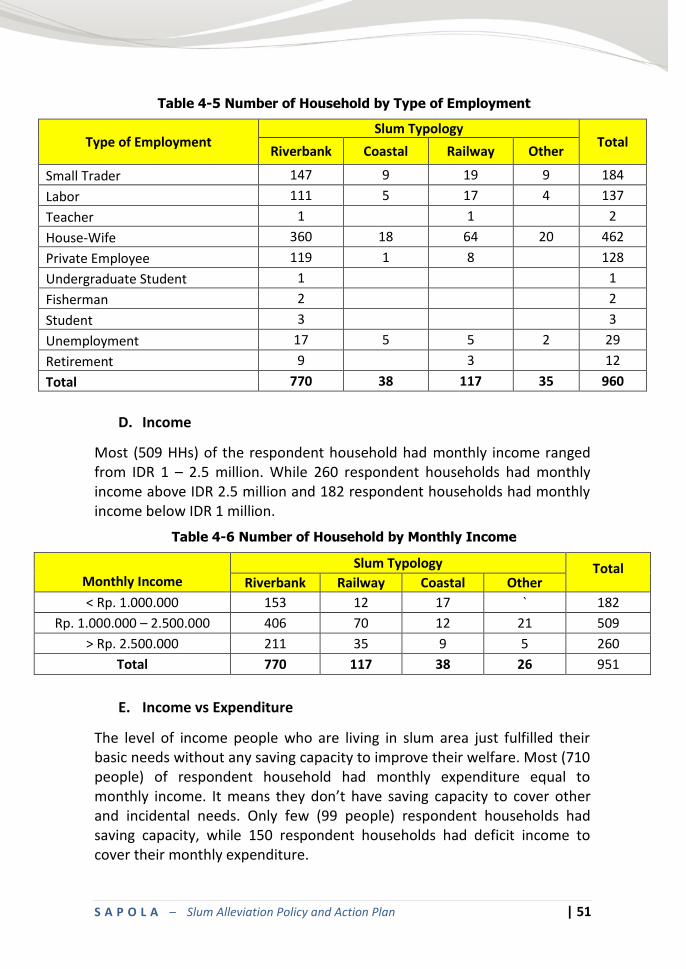
S A P O L A – Slum Alleviation Policy and Action Plan | 51
Table 4-5 Number of Household by Type of Employment
Type of Employment Slum Typology
Total Riverbank Coastal Railway Other
Small Trader 147 9 19 9 184
Labor 111 5 17 4 137
Teacher 1 1
2
House-Wife 360 18 64 20 462
Private Employee 119 1 8
128
Undergraduate Student 1
1
Fisherman 2
2
Student 3
3
Unemployment 17 5 5 2 29
Retirement 9 3
12
Total 770 38 117 35 960
D. Income
Most (509 HHs) of the respondent household had monthly income ranged from IDR 1 – 2.5 million. While 260 respondent households had monthly income above IDR 2.5 million and 182 respondent households had monthly income below IDR 1 million.
Table 4-6 Number of Household by Monthly Income
Monthly Income
Slum Typology Total Riverbank Railway Coastal Other
< Rp. 1.000.000 153 12 17 ` 182
Rp. 1.000.000 – 2.500.000 406 70 12 21 509
> Rp. 2.500.000 211 35 9 5 260
Total 770 117 38 26 951
E. Income vs Expenditure
The level of income people who are living in slum area just fulfilled their basic needs without any saving capacity to improve their welfare. Most (710 people) of respondent household had monthly expenditure equal to monthly income. It means they don’t have saving capacity to cover other and incidental needs. Only few (99 people) respondent households had saving capacity, while 150 respondent households had deficit income to cover their monthly expenditure.
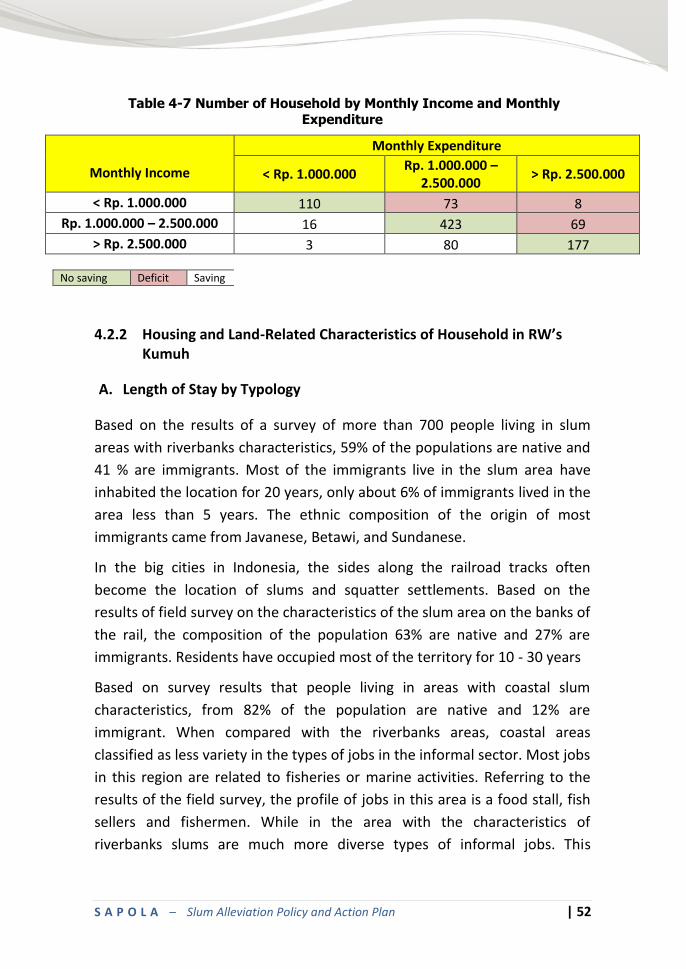
S A P O L A – Slum Alleviation Policy and Action Plan | 52
Table 4-7 Number of Household by Monthly Income and Monthly
Expenditure
Monthly Income
Monthly Expenditure
< Rp. 1.000.000 Rp. 1.000.000 –
2.500.000 > Rp. 2.500.000
< Rp. 1.000.000 110 73 8
Rp. 1.000.000 – 2.500.000 16 423 69
> Rp. 2.500.000 3 80 177
No saving Deficit Saving
4.2.2 Housing and Land-Related Characteristics of Household in RW’s
Kumuh
A. Length of Stay by Typology
Based on the results of a survey of more than 700 people living in slum
areas with riverbanks characteristics, 59% of the populations are native and
41 % are immigrants. Most of the immigrants live in the slum area have
inhabited the location for 20 years, only about 6% of immigrants lived in the
area less than 5 years. The ethnic composition of the origin of most
immigrants came from Javanese, Betawi, and Sundanese.
In the big cities in Indonesia, the sides along the railroad tracks often
become the location of slums and squatter settlements. Based on the
results of field survey on the characteristics of the slum area on the banks of
the rail, the composition of the population 63% are native and 27% are
immigrants. Residents have occupied most of the territory for 10 - 30 years
Based on survey results that people living in areas with coastal slum
characteristics, from 82% of the population are native and 12% are
immigrant. When compared with the riverbanks areas, coastal areas
classified as less variety in the types of jobs in the informal sector. Most jobs
in this region are related to fisheries or marine activities. Referring to the
results of the field survey, the profile of jobs in this area is a food stall, fish
sellers and fishermen. While in the area with the characteristics of
riverbanks slums are much more diverse types of informal jobs. This
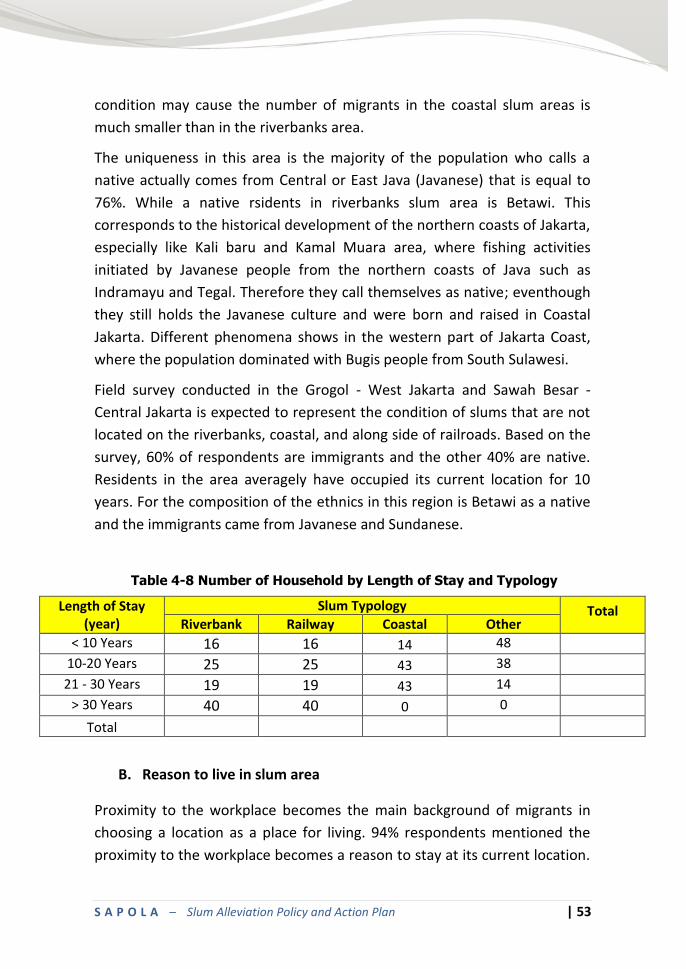
S A P O L A – Slum Alleviation Policy and Action Plan | 53
condition may cause the number of migrants in the coastal slum areas is
much smaller than in the riverbanks area.
The uniqueness in this area is the majority of the population who calls a
native actually comes from Central or East Java (Javanese) that is equal to
76%. While a native rsidents in riverbanks slum area is Betawi. This
corresponds to the historical development of the northern coasts of Jakarta,
especially like Kali baru and Kamal Muara area, where fishing activities
initiated by Javanese people from the northern coasts of Java such as
Indramayu and Tegal. Therefore they call themselves as native; eventhough
they still holds the Javanese culture and were born and raised in Coastal
Jakarta. Different phenomena shows in the western part of Jakarta Coast,
where the population dominated with Bugis people from South Sulawesi.
Field survey conducted in the Grogol - West Jakarta and Sawah Besar -
Central Jakarta is expected to represent the condition of slums that are not
located on the riverbanks, coastal, and along side of railroads. Based on the
survey, 60% of respondents are immigrants and the other 40% are native.
Residents in the area averagely have occupied its current location for 10
years. For the composition of the ethnics in this region is Betawi as a native
and the immigrants came from Javanese and Sundanese.
Table 4-8 Number of Household by Length of Stay and Typology
Length of Stay (year)
Slum Typology Total Riverbank Railway Coastal Other
< 10 Years 16 16 14 48
10-20 Years 25 25 43 38
21 - 30 Years 19 19 43 14
> 30 Years 40 40 0 0
Total
B. Reason to live in slum area
Proximity to the workplace becomes the main background of migrants in
choosing a location as a place for living. 94% respondents mentioned the
proximity to the workplace becomes a reason to stay at its current location.
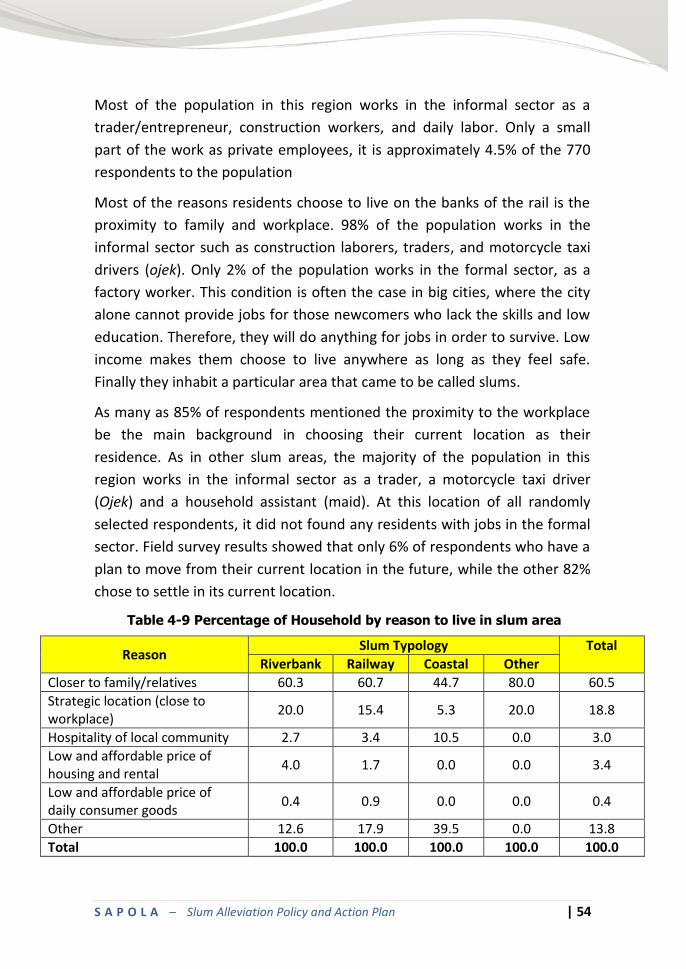
S A P O L A – Slum Alleviation Policy and Action Plan | 54
Most of the population in this region works in the informal sector as a
trader/entrepreneur, construction workers, and daily labor. Only a small
part of the work as private employees, it is approximately 4.5% of the 770
respondents to the population
Most of the reasons residents choose to live on the banks of the rail is the
proximity to family and workplace. 98% of the population works in the
informal sector such as construction laborers, traders, and motorcycle taxi
drivers (ojek). Only 2% of the population works in the formal sector, as a
factory worker. This condition is often the case in big cities, where the city
alone cannot provide jobs for those newcomers who lack the skills and low
education. Therefore, they will do anything for jobs in order to survive. Low
income makes them choose to live anywhere as long as they feel safe.
Finally they inhabit a particular area that came to be called slums.
As many as 85% of respondents mentioned the proximity to the workplace
be the main background in choosing their current location as their
residence. As in other slum areas, the majority of the population in this
region works in the informal sector as a trader, a motorcycle taxi driver
(Ojek) and a household assistant (maid). At this location of all randomly
selected respondents, it did not found any residents with jobs in the formal
sector. Field survey results showed that only 6% of respondents who have a
plan to move from their current location in the future, while the other 82%
chose to settle in its current location.
Table 4-9 Percentage of Household by reason to live in slum area
Reason Slum Typology Total
Riverbank Railway Coastal Other
Closer to family/relatives 60.3 60.7 44.7 80.0 60.5
Strategic location (close to workplace)
20.0 15.4 5.3 20.0 18.8
Hospitality of local community 2.7 3.4 10.5 0.0 3.0
Low and affordable price of housing and rental
4.0 1.7 0.0 0.0 3.4
Low and affordable price of daily consumer goods
0.4 0.9 0.0 0.0 0.4
Other 12.6 17.9 39.5 0.0 13.8
Total 100.0 100.0 100.0 100.0 100.0
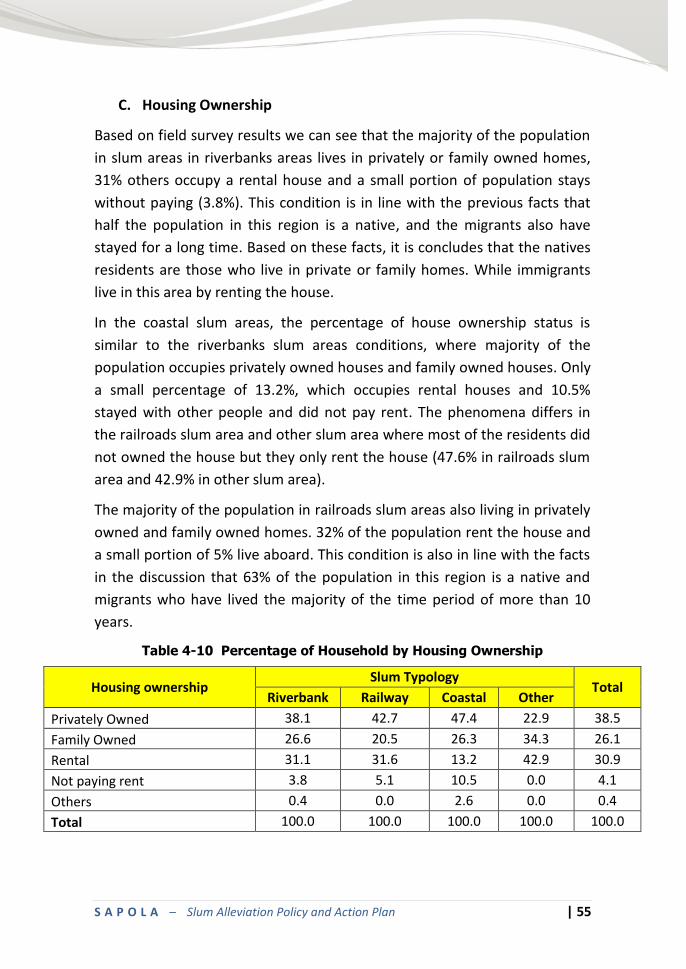
S A P O L A – Slum Alleviation Policy and Action Plan | 55
C. Housing Ownership
Based on field survey results we can see that the majority of the population
in slum areas in riverbanks areas lives in privately or family owned homes,
31% others occupy a rental house and a small portion of population stays
without paying (3.8%). This condition is in line with the previous facts that
half the population in this region is a native, and the migrants also have
stayed for a long time. Based on these facts, it is concludes that the natives
residents are those who live in private or family homes. While immigrants
live in this area by renting the house.
In the coastal slum areas, the percentage of house ownership status is
similar to the riverbanks slum areas conditions, where majority of the
population occupies privately owned houses and family owned houses. Only
a small percentage of 13.2%, which occupies rental houses and 10.5%
stayed with other people and did not pay rent. The phenomena differs in
the railroads slum area and other slum area where most of the residents did
not owned the house but they only rent the house (47.6% in railroads slum
area and 42.9% in other slum area).
The majority of the population in railroads slum areas also living in privately
owned and family owned homes. 32% of the population rent the house and
a small portion of 5% live aboard. This condition is also in line with the facts
in the discussion that 63% of the population in this region is a native and
migrants who have lived the majority of the time period of more than 10
years.
Table 4-10 Percentage of Household by Housing Ownership
Housing ownership Slum Typology
Total Riverbank Railway Coastal Other
Privately Owned 38.1 42.7 47.4 22.9 38.5
Family Owned 26.6 20.5 26.3 34.3 26.1
Rental 31.1 31.6 13.2 42.9 30.9
Not paying rent 3.8 5.1 10.5 0.0 4.1
Others 0.4 0.0 2.6 0.0 0.4
Total 100.0 100.0 100.0 100.0 100.0
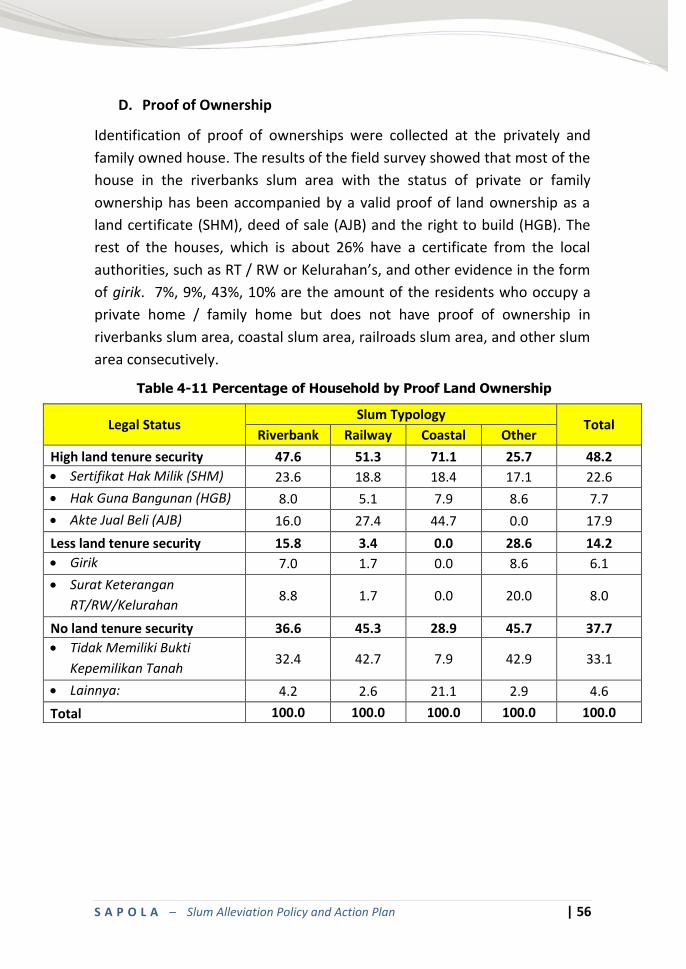
S A P O L A – Slum Alleviation Policy and Action Plan | 56
D. Proof of Ownership
Identification of proof of ownerships were collected at the privately and
family owned house. The results of the field survey showed that most of the
house in the riverbanks slum area with the status of private or family
ownership has been accompanied by a valid proof of land ownership as a
land certificate (SHM), deed of sale (AJB) and the right to build (HGB). The
rest of the houses, which is about 26% have a certificate from the local
authorities, such as RT / RW or Kelurahan’s, and other evidence in the form
of girik. 7%, 9%, 43%, 10% are the amount of the residents who occupy a
private home / family home but does not have proof of ownership in
riverbanks slum area, coastal slum area, railroads slum area, and other slum
area consecutively.
Table 4-11 Percentage of Household by Proof Land Ownership
Legal Status Slum Typology
Total Riverbank Railway Coastal Other
High land tenure security 47.6 51.3 71.1 25.7 48.2
Sertifikat Hak Milik (SHM) 23.6 18.8 18.4 17.1 22.6
Hak Guna Bangunan (HGB) 8.0 5.1 7.9 8.6 7.7
Akte Jual Beli (AJB) 16.0 27.4 44.7 0.0 17.9
Less land tenure security 15.8 3.4 0.0 28.6 14.2
Girik 7.0 1.7 0.0 8.6 6.1
Surat Keterangan
RT/RW/Kelurahan 8.8 1.7 0.0 20.0 8.0
No land tenure security 36.6 45.3 28.9 45.7 37.7
Tidak Memiliki Bukti
Kepemilikan Tanah 32.4 42.7 7.9 42.9 33.1
Lainnya: 4.2 2.6 21.1 2.9 4.6
Total 100.0 100.0 100.0 100.0 100.0
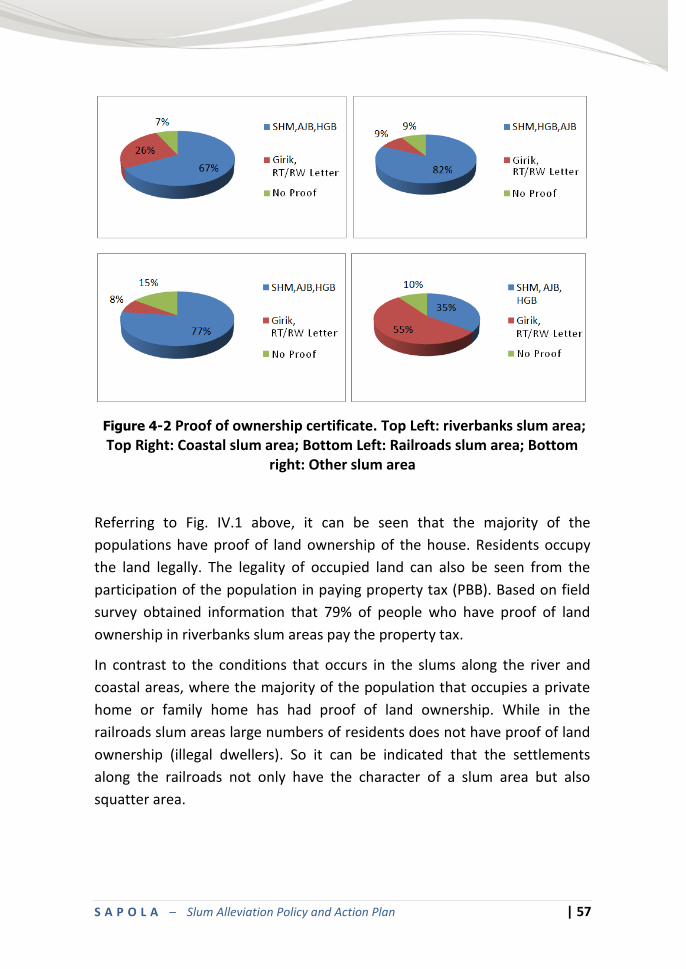
S A P O L A – Slum Alleviation Policy and Action Plan | 57
Figure 4-2 Proof of ownership certificate. Top Left: riverbanks slum area; Top Right: Coastal slum area; Bottom Left: Railroads slum area; Bottom
right: Other slum area
Referring to Fig. IV.1 above, it can be seen that the majority of the
populations have proof of land ownership of the house. Residents occupy
the land legally. The legality of occupied land can also be seen from the
participation of the population in paying property tax (PBB). Based on field
survey obtained information that 79% of people who have proof of land
ownership in riverbanks slum areas pay the property tax.
In contrast to the conditions that occurs in the slums along the river and
coastal areas, where the majority of the population that occupies a private
home or family home has had proof of land ownership. While in the
railroads slum areas large numbers of residents does not have proof of land
ownership (illegal dwellers). So it can be indicated that the settlements
along the railroads not only have the character of a slum area but also
squatter area.
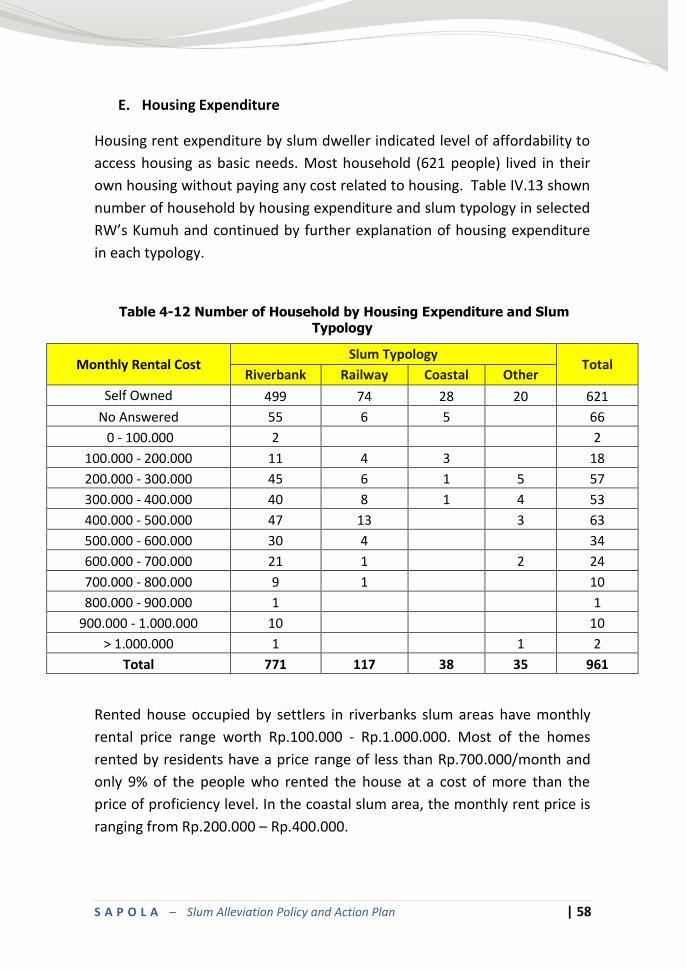
S A P O L A – Slum Alleviation Policy and Action Plan | 58
E. Housing Expenditure
Housing rent expenditure by slum dweller indicated level of affordability to
access housing as basic needs. Most household (621 people) lived in their
own housing without paying any cost related to housing. Table IV.13 shown
number of household by housing expenditure and slum typology in selected
RW’s Kumuh and continued by further explanation of housing expenditure
in each typology.
Table 4-12 Number of Household by Housing Expenditure and Slum
Typology
Monthly Rental Cost Slum Typology
Total Riverbank Railway Coastal Other
Self Owned 499 74 28 20 621
No Answered 55 6 5
66
0 - 100.000 2
2
100.000 - 200.000 11 4 3
18
200.000 - 300.000 45 6 1 5 57
300.000 - 400.000 40 8 1 4 53
400.000 - 500.000 47 13
3 63
500.000 - 600.000 30 4
34
600.000 - 700.000 21 1
2 24
700.000 - 800.000 9 1
10
800.000 - 900.000 1
1
900.000 - 1.000.000 10
10
> 1.000.000 1
1 2
Total 771 117 38 35 961
Rented house occupied by settlers in riverbanks slum areas have monthly
rental price range worth Rp.100.000 - Rp.1.000.000. Most of the homes
rented by residents have a price range of less than Rp.700.000/month and
only 9% of the people who rented the house at a cost of more than the
price of proficiency level. In the coastal slum area, the monthly rent price is
ranging from Rp.200.000 – Rp.400.000.
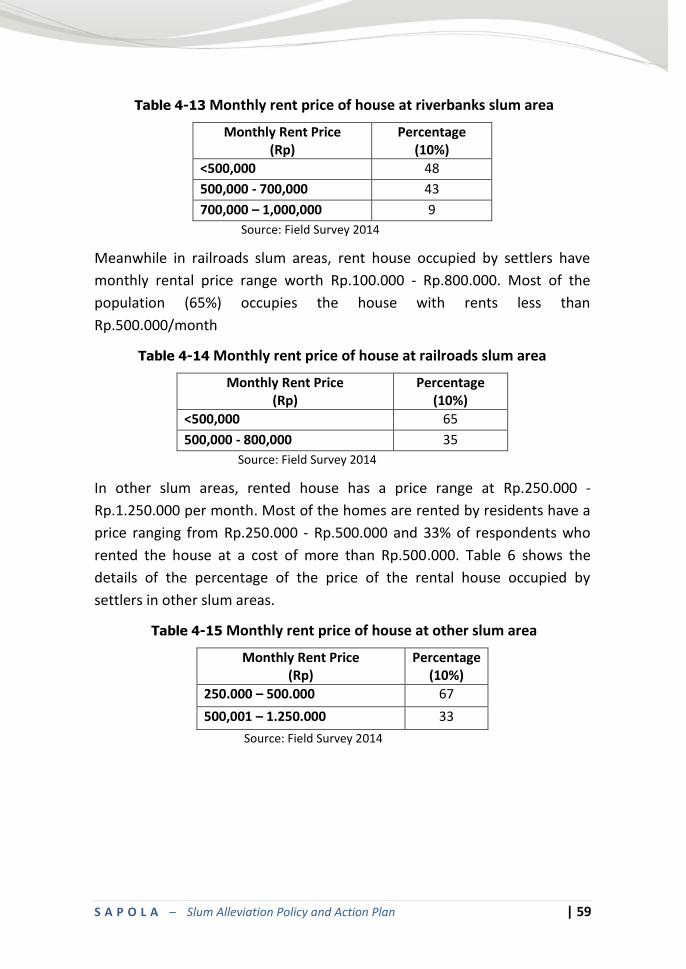
S A P O L A – Slum Alleviation Policy and Action Plan | 59
Table 4-13 Monthly rent price of house at riverbanks slum area
Monthly Rent Price (Rp)
Percentage (10%)
<500,000 48
500,000 - 700,000 43
700,000 – 1,000,000 9
Source: Field Survey 2014
Meanwhile in railroads slum areas, rent house occupied by settlers have
monthly rental price range worth Rp.100.000 - Rp.800.000. Most of the
population (65%) occupies the house with rents less than
Rp.500.000/month
Table 4-14 Monthly rent price of house at railroads slum area
Monthly Rent Price (Rp)
Percentage (10%)
<500,000 65
500,000 - 800,000 35
Source: Field Survey 2014
In other slum areas, rented house has a price range at Rp.250.000 -
Rp.1.250.000 per month. Most of the homes are rented by residents have a
price ranging from Rp.250.000 - Rp.500.000 and 33% of respondents who
rented the house at a cost of more than Rp.500.000. Table 6 shows the
details of the percentage of the price of the rental house occupied by
settlers in other slum areas.
Table 4-15 Monthly rent price of house at other slum area
Monthly Rent Price (Rp)
Percentage (10%)
250.000 – 500.000 67
500,001 – 1.250.000 33
Source: Field Survey 2014
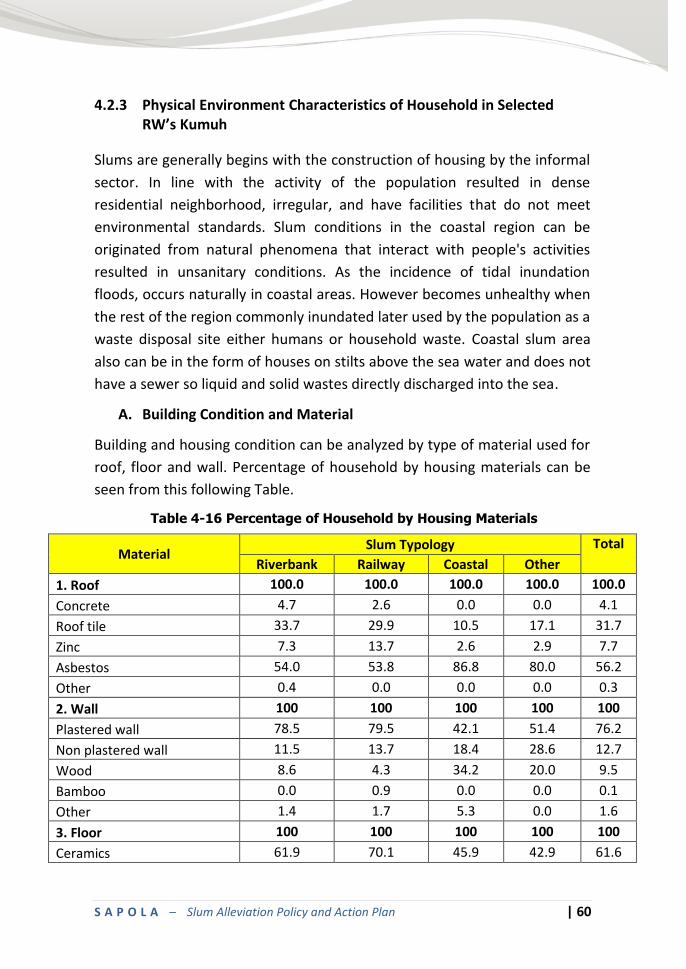
S A P O L A – Slum Alleviation Policy and Action Plan | 60
4.2.3 Physical Environment Characteristics of Household in Selected RW’s Kumuh
Slums are generally begins with the construction of housing by the informal
sector. In line with the activity of the population resulted in dense
residential neighborhood, irregular, and have facilities that do not meet
environmental standards. Slum conditions in the coastal region can be
originated from natural phenomena that interact with people's activities
resulted in unsanitary conditions. As the incidence of tidal inundation
floods, occurs naturally in coastal areas. However becomes unhealthy when
the rest of the region commonly inundated later used by the population as a
waste disposal site either humans or household waste. Coastal slum area
also can be in the form of houses on stilts above the sea water and does not
have a sewer so liquid and solid wastes directly discharged into the sea.
A. Building Condition and Material
Building and housing condition can be analyzed by type of material used for
roof, floor and wall. Percentage of household by housing materials can be
seen from this following Table.
Table 4-16 Percentage of Household by Housing Materials
Material Slum Typology Total
Riverbank Railway Coastal Other
1. Roof 100.0 100.0 100.0 100.0 100.0
Concrete 4.7 2.6 0.0 0.0 4.1
Roof tile 33.7 29.9 10.5 17.1 31.7
Zinc 7.3 13.7 2.6 2.9 7.7
Asbestos 54.0 53.8 86.8 80.0 56.2
Other 0.4 0.0 0.0 0.0 0.3
2. Wall 100 100 100 100 100
Plastered wall 78.5 79.5 42.1 51.4 76.2
Non plastered wall 11.5 13.7 18.4 28.6 12.7
Wood 8.6 4.3 34.2 20.0 9.5
Bamboo 0.0 0.9 0.0 0.0 0.1
Other 1.4 1.7 5.3 0.0 1.6
3. Floor 100 100 100 100 100
Ceramics 61.9 70.1 45.9 42.9 61.6
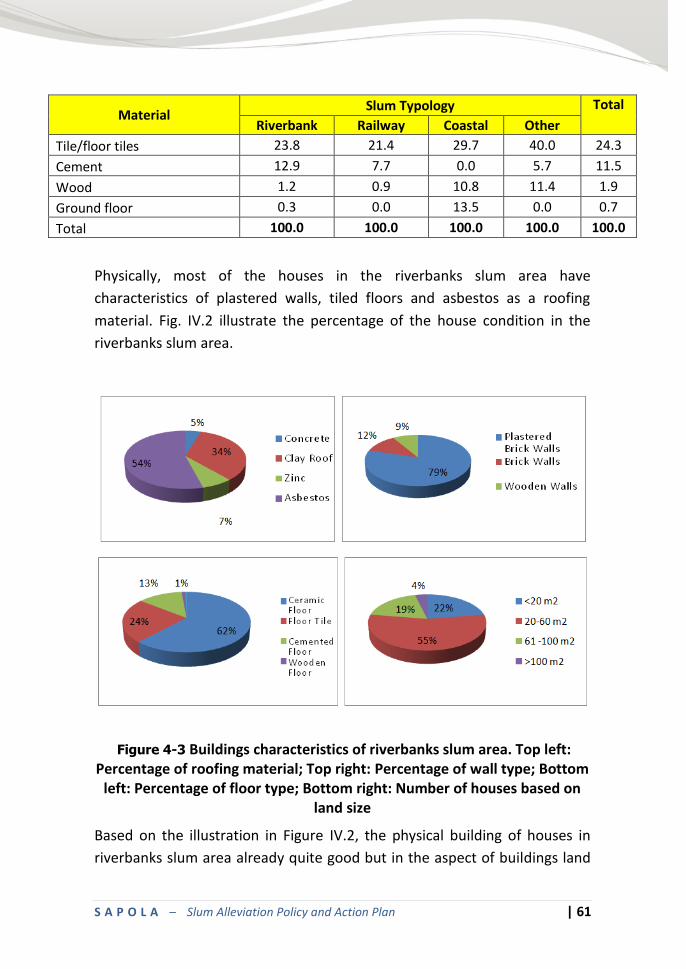
S A P O L A – Slum Alleviation Policy and Action Plan | 61
Material Slum Typology Total
Riverbank Railway Coastal Other
Tile/floor tiles 23.8 21.4 29.7 40.0 24.3
Cement 12.9 7.7 0.0 5.7 11.5
Wood 1.2 0.9 10.8 11.4 1.9
Ground floor 0.3 0.0 13.5 0.0 0.7
Total 100.0 100.0 100.0 100.0 100.0
Physically, most of the houses in the riverbanks slum area have
characteristics of plastered walls, tiled floors and asbestos as a roofing
material. Fig. IV.2 illustrate the percentage of the house condition in the
riverbanks slum area.
Figure 4-3 Buildings characteristics of riverbanks slum area. Top left: Percentage of roofing material; Top right: Percentage of wall type; Bottom
left: Percentage of floor type; Bottom right: Number of houses based on land size
Based on the illustration in Figure IV.2, the physical building of houses in
riverbanks slum area already quite good but in the aspect of buildings land
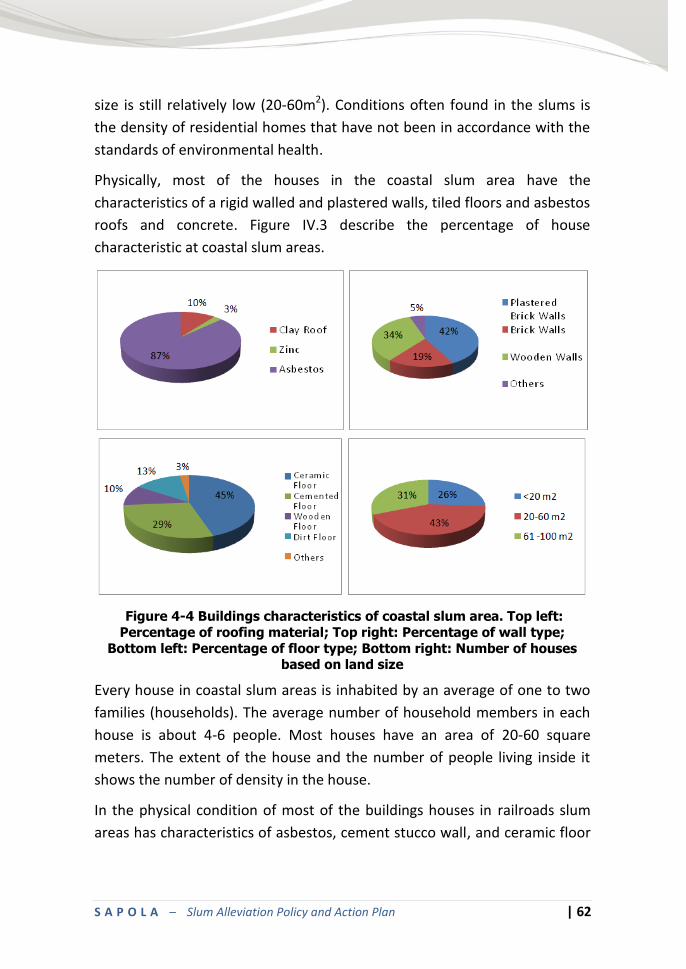
S A P O L A – Slum Alleviation Policy and Action Plan | 62
size is still relatively low (20-60m2). Conditions often found in the slums is
the density of residential homes that have not been in accordance with the
standards of environmental health.
Physically, most of the houses in the coastal slum area have the
characteristics of a rigid walled and plastered walls, tiled floors and asbestos
roofs and concrete. Figure IV.3 describe the percentage of house
characteristic at coastal slum areas.
Figure 4-4 Buildings characteristics of coastal slum area. Top left:
Percentage of roofing material; Top right: Percentage of wall type;
Bottom left: Percentage of floor type; Bottom right: Number of houses based on land size
Every house in coastal slum areas is inhabited by an average of one to two
families (households). The average number of household members in each
house is about 4-6 people. Most houses have an area of 20-60 square
meters. The extent of the house and the number of people living inside it
shows the number of density in the house.
In the physical condition of most of the buildings houses in railroads slum
areas has characteristics of asbestos, cement stucco wall, and ceramic floor
S A P O L A – Slum Alleviation Policy and Action Plan | 63
tiles. Figure 4 describe the percentage of house characteristic at railroads
slum areas.
Figure 4-5 Buildings characteristics of railroads slum area. Top left: Perentage of roofing material; Top right: Percentage of wall type; Bottom
left: Percentage of floor type; Bottom right: Number of houses based on
land size
Physically, the material of most of the houses in the slums in other regions
has the characteristics of plaster walls, tiled floors and asbestos as a roofing
material. Here's an illustration of the physical condition of the houses.

S A P O L A – Slum Alleviation Policy and Action Plan | 64
Figure 4-6 Buildings characteristics of other slum area. Top left:
Perentage of roofing material; Top right: Percentage of wall type; Bottom left: Percentage of floor type; Bottom right: Number of houses based on
land size
B. Water Supply
The source of water used by residents largely derived from ground water,
water taps and retail. Only about 0.3% that uses river water for
consumption or sanitation needs. The use of water taps dominating source
of water in the riverbanks slum area, approximately 55% of the population
uses water taps for daily needs, the rest use ground water and retail.
Different from the riverbanks slum area, the resident at coastal slum area
did not use ground water for daily needs, most of the residents uses water
taps and retail.
The main source of water used by railroads slum area residents for
consumption and sanitation activities derived from taps and other part
comes from groundwater and retail water. For people who use the services
in the retail water taps or water supply have to pay Rp.50.000 - Rp.200.000
per month.
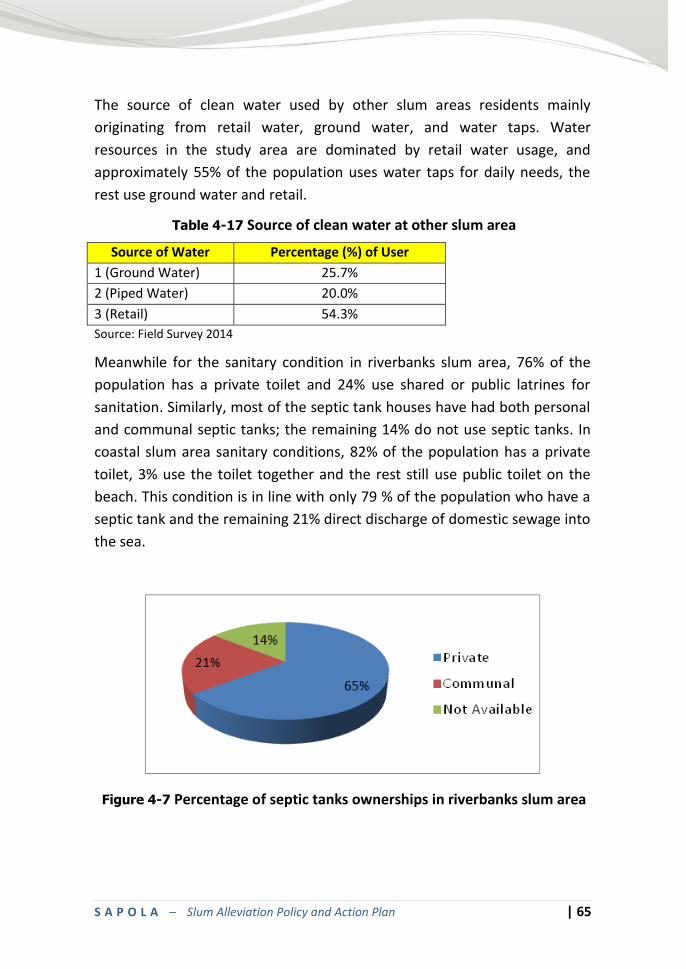
S A P O L A – Slum Alleviation Policy and Action Plan | 65
The source of clean water used by other slum areas residents mainly
originating from retail water, ground water, and water taps. Water
resources in the study area are dominated by retail water usage, and
approximately 55% of the population uses water taps for daily needs, the
rest use ground water and retail.
Table 4-17 Source of clean water at other slum area
Source of Water Percentage (%) of User
1 (Ground Water) 25.7%
2 (Piped Water) 20.0%
3 (Retail) 54.3%
Source: Field Survey 2014
Meanwhile for the sanitary condition in riverbanks slum area, 76% of the
population has a private toilet and 24% use shared or public latrines for
sanitation. Similarly, most of the septic tank houses have had both personal
and communal septic tanks; the remaining 14% do not use septic tanks. In
coastal slum area sanitary conditions, 82% of the population has a private
toilet, 3% use the toilet together and the rest still use public toilet on the
beach. This condition is in line with only 79 % of the population who have a
septic tank and the remaining 21% direct discharge of domestic sewage into
the sea.
Figure 4-7 Percentage of septic tanks ownerships in riverbanks slum area
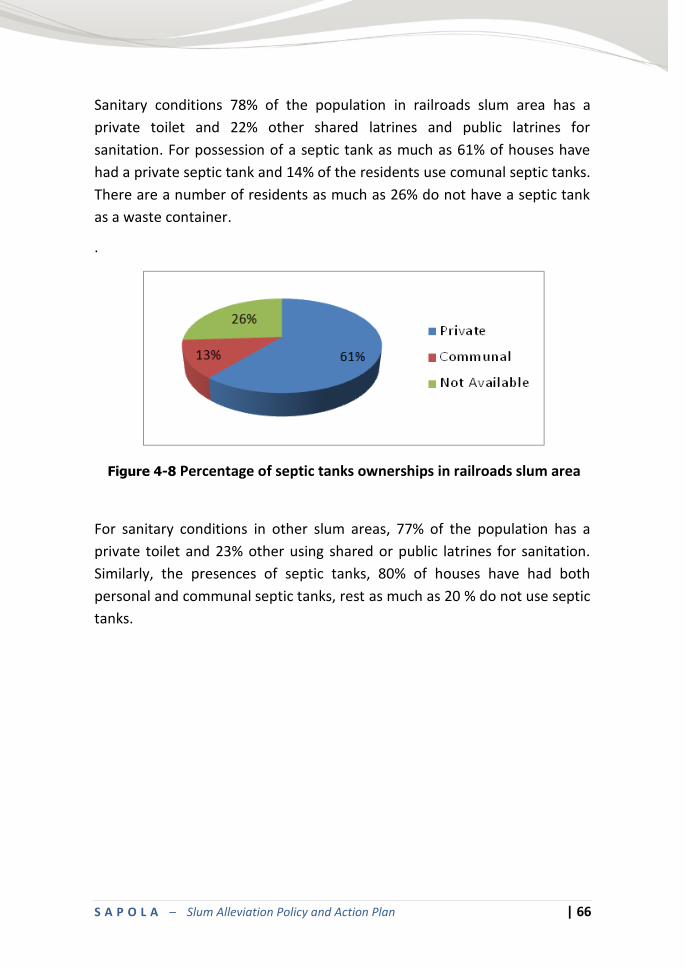
S A P O L A – Slum Alleviation Policy and Action Plan | 66
Sanitary conditions 78% of the population in railroads slum area has a
private toilet and 22% other shared latrines and public latrines for
sanitation. For possession of a septic tank as much as 61% of houses have
had a private septic tank and 14% of the residents use comunal septic tanks.
There are a number of residents as much as 26% do not have a septic tank
as a waste container.
.
Figure 4-8 Percentage of septic tanks ownerships in railroads slum area
For sanitary conditions in other slum areas, 77% of the population has a
private toilet and 23% other using shared or public latrines for sanitation.
Similarly, the presences of septic tanks, 80% of houses have had both
personal and communal septic tanks, rest as much as 20 % do not use septic
tanks.
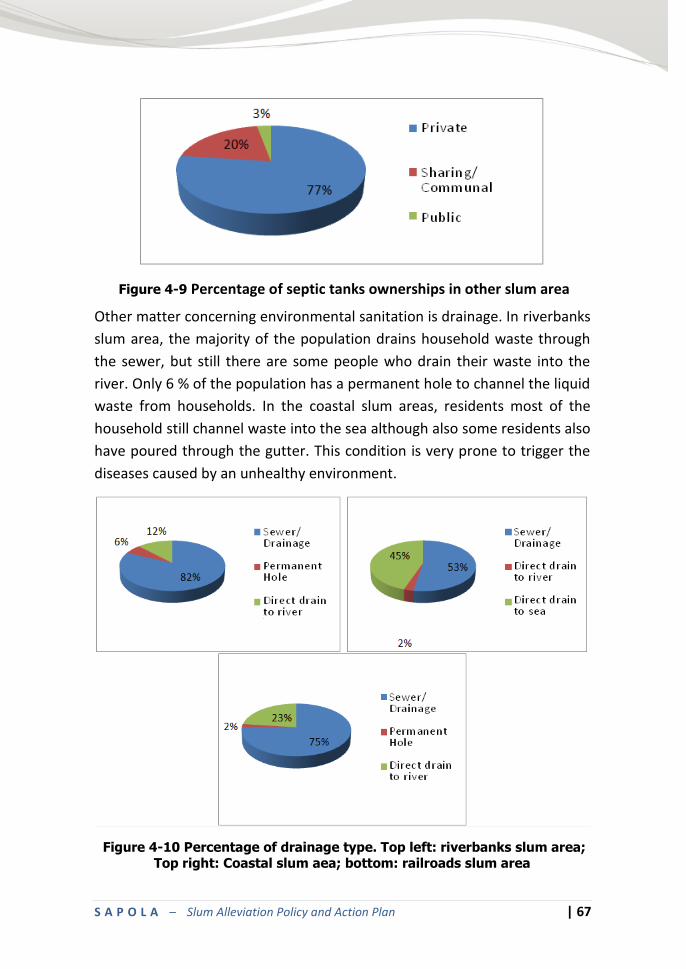
S A P O L A – Slum Alleviation Policy and Action Plan | 67
Figure 4-9 Percentage of septic tanks ownerships in other slum area
Other matter concerning environmental sanitation is drainage. In riverbanks
slum area, the majority of the population drains household waste through
the sewer, but still there are some people who drain their waste into the
river. Only 6 % of the population has a permanent hole to channel the liquid
waste from households. In the coastal slum areas, residents most of the
household still channel waste into the sea although also some residents also
have poured through the gutter. This condition is very prone to trigger the
diseases caused by an unhealthy environment.
Figure 4-10 Percentage of drainage type. Top left: riverbanks slum area; Top right: Coastal slum aea; bottom: railroads slum area
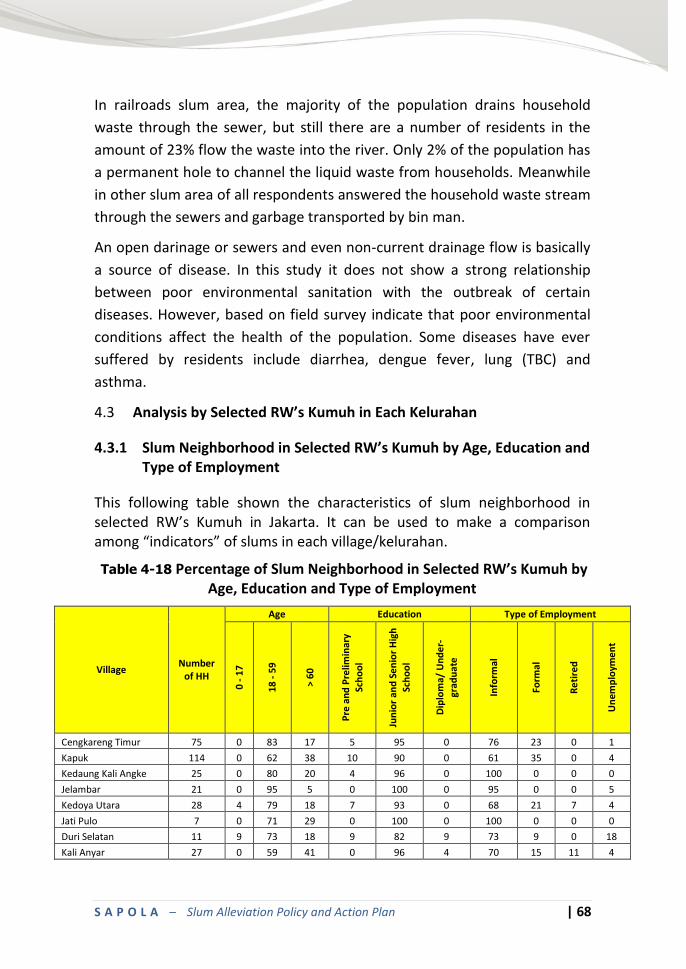
S A P O L A – Slum Alleviation Policy and Action Plan | 68
In railroads slum area, the majority of the population drains household
waste through the sewer, but still there are a number of residents in the
amount of 23% flow the waste into the river. Only 2% of the population has
a permanent hole to channel the liquid waste from households. Meanwhile
in other slum area of all respondents answered the household waste stream
through the sewers and garbage transported by bin man.
An open darinage or sewers and even non-current drainage flow is basically
a source of disease. In this study it does not show a strong relationship
between poor environmental sanitation with the outbreak of certain
diseases. However, based on field survey indicate that poor environmental
conditions affect the health of the population. Some diseases have ever
suffered by residents include diarrhea, dengue fever, lung (TBC) and
asthma.
Analysis by Selected RW’s Kumuh in Each Kelurahan 4.3
4.3.1 Slum Neighborhood in Selected RW’s Kumuh by Age, Education and Type of Employment
This following table shown the characteristics of slum neighborhood in selected RW’s Kumuh in Jakarta. It can be used to make a comparison among “indicators” of slums in each village/kelurahan.
Table 4-18 Percentage of Slum Neighborhood in Selected RW’s Kumuh by Age, Education and Type of Employment
Village Number
of HH
Age Education Type of Employment
0 -
17
18
- 5
9
> 6
0
Pre
an
d P
relim
inar
y Sc
ho
ol
Jun
ior
and
Se
nio
r H
igh
Sch
oo
l
Dip
lom
a/ U
nd
er-
grad
uat
e
Info
rmal
Form
al
Re
tire
d
Un
emp
loym
en
t
Cengkareng Timur 75 0 83 17 5 95 0 76 23 0 1
Kapuk 114 0 62 38 10 90 0 61 35 0 4
Kedaung Kali Angke 25 0 80 20 4 96 0 100 0 0 0
Jelambar 21 0 95 5 0 100 0 95 0 0 5
Kedoya Utara 28 4 79 18 7 93 0 68 21 7 4
Jati Pulo 7 0 71 29 0 100 0 100 0 0 0
Duri Selatan 11 9 73 18 9 82 9 73 9 0 18
Kali Anyar 27 0 59 41 0 96 4 70 15 11 4

S A P O L A – Slum Alleviation Policy and Action Plan | 69
Village Number
of HH
Age Education Type of Employment
0 -
17
18
- 5
9
> 6
0
Pre
an
d P
relim
inar
y Sc
ho
ol
Jun
ior
and
Se
nio
r H
igh
Sch
oo
l
Dip
lom
a/ U
nd
er-
grad
uat
e
Info
rmal
Form
al
Re
tire
d
Un
emp
loym
en
t
Johar Baru 13 0 69 31 0 92 8 77 23 0 0
Kampung Rawa 10 0 60 40 0 100 0 50 40 10 0
Tanah Tinggi 12 0 50 50 0 100 0 92 8 0 0
Menteng 12 0 75 25 0 92 8 83 8 0 8
Pejagalan 15 0 47 53 7 53 40 93 7 0 0
Karang Anyar 20 0 80 20 0 95 5 95 5 0 0
Kartini 14 0 57 43 0 100 0 93 0 0 7
Mangga Dua Besar 10 0 60 40 0 100 0 90 0 0 10
Senen 12 0 33 67 33 67 0 92 8 0 0
Karet Tengsin 17 0 82 18 6 88 6 100 0 0 0
Kuningan Barat 15 0 87 13 0 100 0 87 13 0 0
Bukit Duri 38 0 55 45 5 92 3 92 0 3 5
Menteng Dalam 19 0 68 32 0 95 5 100 0 0 0
Jatinegara 24 0 71 29 0 100 0 96 4 0 0
Penggilingan 39 0 85 15 0 100 0 100 0 0 0
Rawa Terate 15 0 87 13 7 87 7 100 0 0 0
Klender 15 0 73 27 13 87 0 100 0 0 0
Cipinang Besar Utara 17 12 53 35 24 71 6 94 0 0 6
Kampung Melayu 35 0 83 17 0 91 9 89 9 0 3
Kampung Tengah 27 4 78 19 4 96 0 96 4 0 0
Pisangan Timur 12 0 100 0 0 92 8 92 0 0 8
Pulo Gadung 25 0 76 24 20 80 0 100 0 0 0
Cilincing 37 0 68 32 5 89 5 76 14 8 3
Kali Baru 38 3 58 39 8 89 3 82 3 0 16
Semper Timur 15 0 73 27 0 93 7 93 0 0 7
Tugu Utara 29 0 83 17 7 93 0 83 10 0 7
Ancol 19 0 89 11 11 84 5 84 11 0 5
Pademangan Barat 23 0 70 26 4 78 13 96 0 0 0
Penjaringan 19 0 47 53 21 79 0 100 0 0 0
Papanggo 57 0 60 40 0 100 0 47 51 2 0
4.3.2 Slum Neighborhood in Selected RW’s Kumuh by Length of Stay and Reason to live
This following table shown percentage of household by length of stay and reason to live.
Table 4-19 Percentage of Slum Neighborhood in Selected RW’s Kumuh by Length of Stay and Reason to live
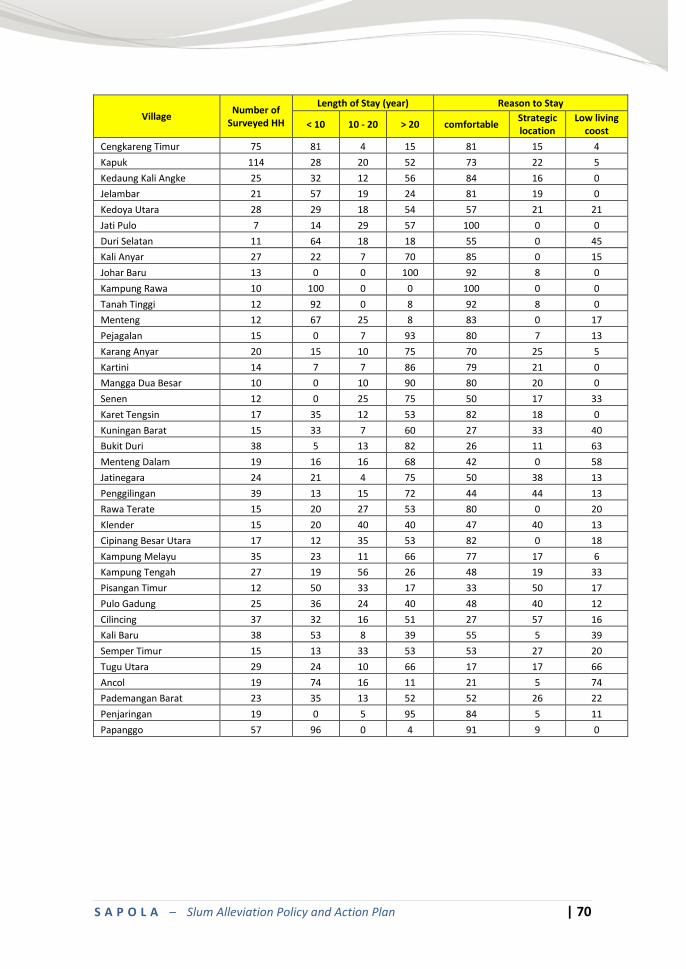
S A P O L A – Slum Alleviation Policy and Action Plan | 70
Village Number of
Surveyed HH
Length of Stay (year) Reason to Stay
< 10 10 - 20 > 20 comfortable Strategic location
Low living coost
Cengkareng Timur 75 81 4 15 81 15 4
Kapuk 114 28 20 52 73 22 5
Kedaung Kali Angke 25 32 12 56 84 16 0
Jelambar 21 57 19 24 81 19 0
Kedoya Utara 28 29 18 54 57 21 21
Jati Pulo 7 14 29 57 100 0 0
Duri Selatan 11 64 18 18 55 0 45
Kali Anyar 27 22 7 70 85 0 15
Johar Baru 13 0 0 100 92 8 0
Kampung Rawa 10 100 0 0 100 0 0
Tanah Tinggi 12 92 0 8 92 8 0
Menteng 12 67 25 8 83 0 17
Pejagalan 15 0 7 93 80 7 13
Karang Anyar 20 15 10 75 70 25 5
Kartini 14 7 7 86 79 21 0
Mangga Dua Besar 10 0 10 90 80 20 0
Senen 12 0 25 75 50 17 33
Karet Tengsin 17 35 12 53 82 18 0
Kuningan Barat 15 33 7 60 27 33 40
Bukit Duri 38 5 13 82 26 11 63
Menteng Dalam 19 16 16 68 42 0 58
Jatinegara 24 21 4 75 50 38 13
Penggilingan 39 13 15 72 44 44 13
Rawa Terate 15 20 27 53 80 0 20
Klender 15 20 40 40 47 40 13
Cipinang Besar Utara 17 12 35 53 82 0 18
Kampung Melayu 35 23 11 66 77 17 6
Kampung Tengah 27 19 56 26 48 19 33
Pisangan Timur 12 50 33 17 33 50 17
Pulo Gadung 25 36 24 40 48 40 12
Cilincing 37 32 16 51 27 57 16
Kali Baru 38 53 8 39 55 5 39
Semper Timur 15 13 33 53 53 27 20
Tugu Utara 29 24 10 66 17 17 66
Ancol 19 74 16 11 21 5 74
Pademangan Barat 23 35 13 52 52 26 22
Penjaringan 19 0 5 95 84 5 11
Papanggo 57 96 0 4 91 9 0
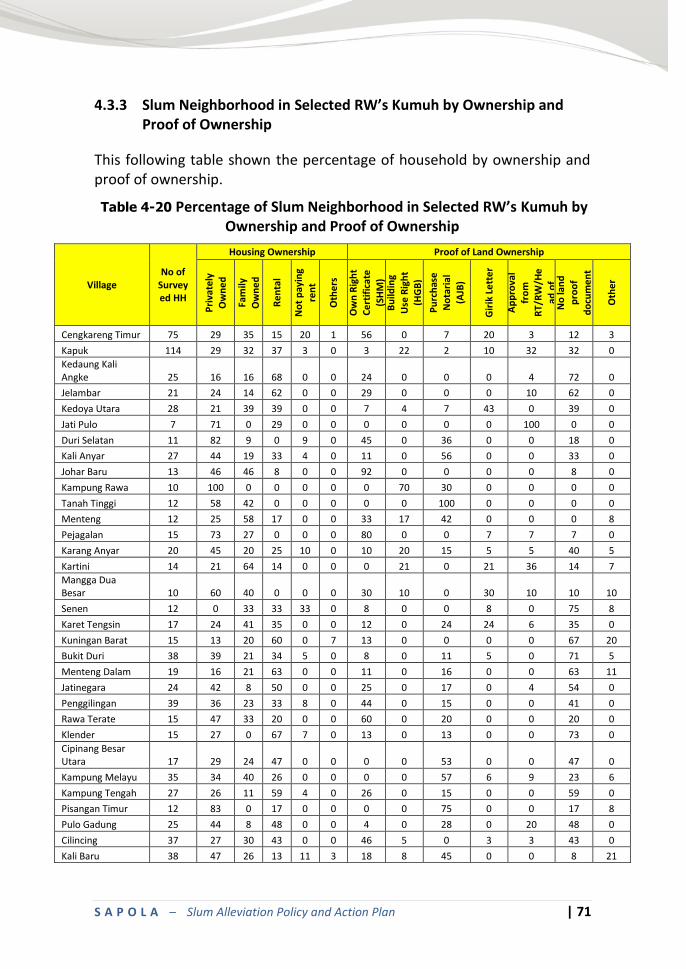
S A P O L A – Slum Alleviation Policy and Action Plan | 71
4.3.3 Slum Neighborhood in Selected RW’s Kumuh by Ownership and Proof of Ownership
This following table shown the percentage of household by ownership and proof of ownership.
Table 4-20 Percentage of Slum Neighborhood in Selected RW’s Kumuh by Ownership and Proof of Ownership
Village No of
Surveyed HH
Housing Ownership Proof of Land Ownership
Pri
vate
ly
Ow
ne
d
Fam
ily
Ow
ne
d
Re
nta
l
No
t p
ayin
g
ren
t
Oth
ers
Ow
n R
igh
t C
ert
ific
ate
(SH
M)
Bu
ildin
g
Use
Rig
ht
(HG
B)
Pu
rch
ase
N
ota
rial
(AJB
)
Gir
ik L
ett
er
Lett
er
of
Ap
pro
val
fro
m
RT/
RW
/He
ad o
f V
illag
e
No
lan
d
pro
of
do
cum
en
t
Oth
er
Cengkareng Timur 75 29 35 15 20 1 56 0 7 20 3 12 3
Kapuk 114 29 32 37 3 0 3 22 2 10 32 32 0
Kedaung Kali Angke 25 16 16 68 0 0 24 0 0 0 4 72 0
Jelambar 21 24 14 62 0 0 29 0 0 0 10 62 0
Kedoya Utara 28 21 39 39 0 0 7 4 7 43 0 39 0
Jati Pulo 7 71 0 29 0 0 0 0 0 0 100 0 0
Duri Selatan 11 82 9 0 9 0 45 0 36 0 0 18 0
Kali Anyar 27 44 19 33 4 0 11 0 56 0 0 33 0
Johar Baru 13 46 46 8 0 0 92 0 0 0 0 8 0
Kampung Rawa 10 100 0 0 0 0 0 70 30 0 0 0 0
Tanah Tinggi 12 58 42 0 0 0 0 0 100 0 0 0 0
Menteng 12 25 58 17 0 0 33 17 42 0 0 0 8
Pejagalan 15 73 27 0 0 0 80 0 0 7 7 7 0
Karang Anyar 20 45 20 25 10 0 10 20 15 5 5 40 5
Kartini 14 21 64 14 0 0 0 21 0 21 36 14 7
Mangga Dua Besar 10 60 40 0 0 0 30 10 0 30 10 10 10
Senen 12 0 33 33 33 0 8 0 0 8 0 75 8
Karet Tengsin 17 24 41 35 0 0 12 0 24 24 6 35 0
Kuningan Barat 15 13 20 60 0 7 13 0 0 0 0 67 20
Bukit Duri 38 39 21 34 5 0 8 0 11 5 0 71 5
Menteng Dalam 19 16 21 63 0 0 11 0 16 0 0 63 11
Jatinegara 24 42 8 50 0 0 25 0 17 0 4 54 0
Penggilingan 39 36 23 33 8 0 44 0 15 0 0 41 0
Rawa Terate 15 47 33 20 0 0 60 0 20 0 0 20 0
Klender 15 27 0 67 7 0 13 0 13 0 0 73 0
Cipinang Besar Utara 17 29 24 47 0 0 0 0 53 0 0 47 0
Kampung Melayu 35 34 40 26 0 0 0 0 57 6 9 23 6
Kampung Tengah 27 26 11 59 4 0 26 0 15 0 0 59 0
Pisangan Timur 12 83 0 17 0 0 0 0 75 0 0 17 8
Pulo Gadung 25 44 8 48 0 0 4 0 28 0 20 48 0
Cilincing 37 27 30 43 0 0 46 5 0 3 3 43 0
Kali Baru 38 47 26 13 11 3 18 8 45 0 0 8 21
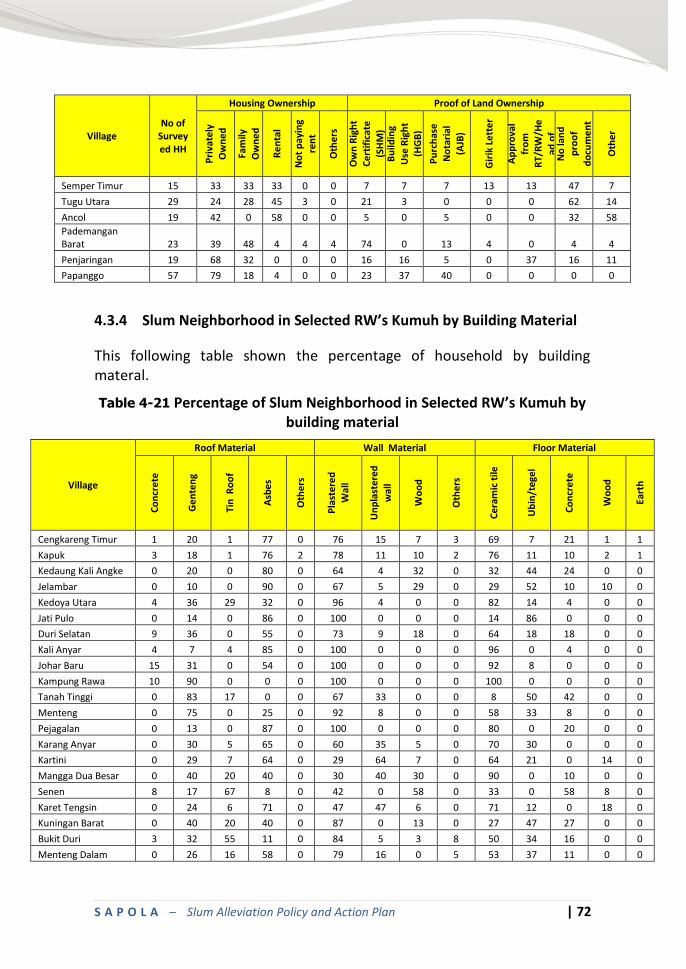
S A P O L A – Slum Alleviation Policy and Action Plan | 72
Village No of
Surveyed HH
Housing Ownership Proof of Land Ownership
Pri
vate
ly
Ow
ne
d
Fam
ily
Ow
ne
d
Re
nta
l
No
t p
ayin
g
ren
t
Oth
ers
Ow
n R
igh
t C
ert
ific
ate
(SH
M)
Bu
ildin
g
Use
Rig
ht
(HG
B)
Pu
rch
ase
N
ota
rial
(AJB
)
Gir
ik L
ett
er
Lett
er
of
Ap
pro
val
fro
m
RT/
RW
/He
ad o
f V
illag
e
No
lan
d
pro
of
do
cum
en
t
Oth
er
Semper Timur 15 33 33 33 0 0 7 7 7 13 13 47 7
Tugu Utara 29 24 28 45 3 0 21 3 0 0 0 62 14
Ancol 19 42 0 58 0 0 5 0 5 0 0 32 58
Pademangan Barat 23 39 48 4 4 4 74 0 13 4 0 4 4
Penjaringan 19 68 32 0 0 0 16 16 5 0 37 16 11
Papanggo 57 79 18 4 0 0 23 37 40 0 0 0 0
4.3.4 Slum Neighborhood in Selected RW’s Kumuh by Building Material
This following table shown the percentage of household by building materal.
Table 4-21 Percentage of Slum Neighborhood in Selected RW’s Kumuh by building material
Village
Roof Material Wall Material Floor Material
Co
ncr
ete
Ge
nte
ng
Tin
Ro
of
Asb
es
Oth
ers
Pla
ste
red
Wal
l
Un
pla
ster
ed
wal
l
Wo
od
Oth
ers
Ce
ram
ic t
ile
Ub
in/t
ege
l
Co
ncr
ete
Wo
od
Eart
h
Cengkareng Timur 1 20 1 77 0 76 15 7 3 69 7 21 1 1
Kapuk 3 18 1 76 2 78 11 10 2 76 11 10 2 1
Kedaung Kali Angke 0 20 0 80 0 64 4 32 0 32 44 24 0 0
Jelambar 0 10 0 90 0 67 5 29 0 29 52 10 10 0
Kedoya Utara 4 36 29 32 0 96 4 0 0 82 14 4 0 0
Jati Pulo 0 14 0 86 0 100 0 0 0 14 86 0 0 0
Duri Selatan 9 36 0 55 0 73 9 18 0 64 18 18 0 0
Kali Anyar 4 7 4 85 0 100 0 0 0 96 0 4 0 0
Johar Baru 15 31 0 54 0 100 0 0 0 92 8 0 0 0
Kampung Rawa 10 90 0 0 0 100 0 0 0 100 0 0 0 0
Tanah Tinggi 0 83 17 0 0 67 33 0 0 8 50 42 0 0
Menteng 0 75 0 25 0 92 8 0 0 58 33 8 0 0
Pejagalan 0 13 0 87 0 100 0 0 0 80 0 20 0 0
Karang Anyar 0 30 5 65 0 60 35 5 0 70 30 0 0 0
Kartini 0 29 7 64 0 29 64 7 0 64 21 0 14 0
Mangga Dua Besar 0 40 20 40 0 30 40 30 0 90 0 10 0 0
Senen 8 17 67 8 0 42 0 58 0 33 0 58 8 0
Karet Tengsin 0 24 6 71 0 47 47 6 0 71 12 0 18 0
Kuningan Barat 0 40 20 40 0 87 0 13 0 27 47 27 0 0
Bukit Duri 3 32 55 11 0 84 5 3 8 50 34 16 0 0
Menteng Dalam 0 26 16 58 0 79 16 0 5 53 37 11 0 0
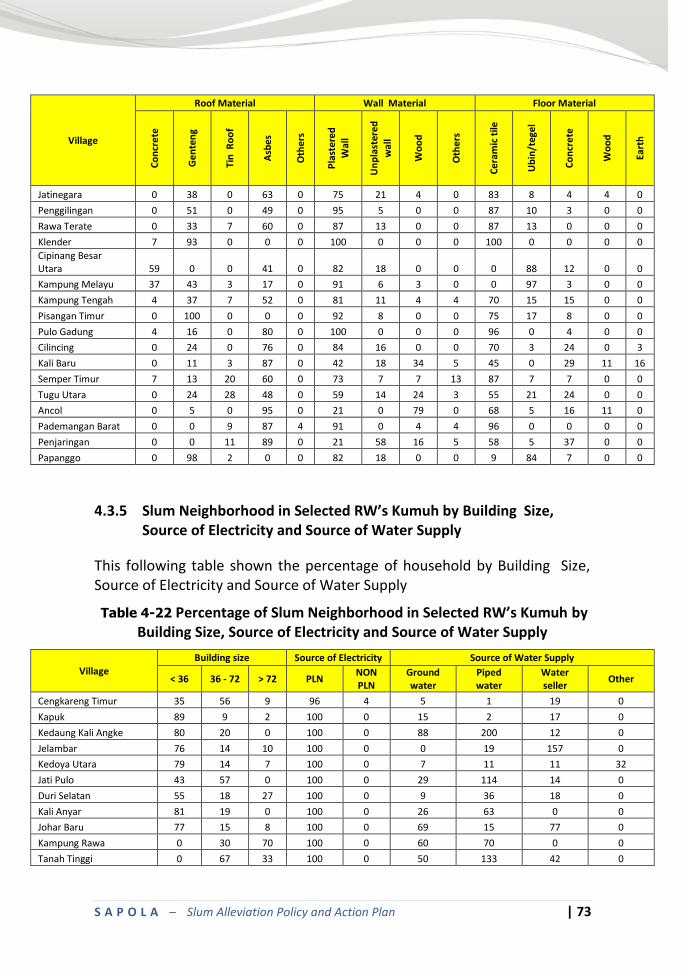
S A P O L A – Slum Alleviation Policy and Action Plan | 73
Village
Roof Material Wall Material Floor Material
Co
ncr
ete
Ge
nte
ng
Tin
Ro
of
Asb
es
Oth
ers
Pla
ste
red
Wal
l
Un
pla
ster
ed
wal
l
Wo
od
Oth
ers
Ce
ram
ic t
ile
Ub
in/t
ege
l
Co
ncr
ete
Wo
od
Eart
h
Jatinegara 0 38 0 63 0 75 21 4 0 83 8 4 4 0
Penggilingan 0 51 0 49 0 95 5 0 0 87 10 3 0 0
Rawa Terate 0 33 7 60 0 87 13 0 0 87 13 0 0 0
Klender 7 93 0 0 0 100 0 0 0 100 0 0 0 0
Cipinang Besar Utara 59 0 0 41 0 82 18 0 0 0 88 12 0 0
Kampung Melayu 37 43 3 17 0 91 6 3 0 0 97 3 0 0
Kampung Tengah 4 37 7 52 0 81 11 4 4 70 15 15 0 0
Pisangan Timur 0 100 0 0 0 92 8 0 0 75 17 8 0 0
Pulo Gadung 4 16 0 80 0 100 0 0 0 96 0 4 0 0
Cilincing 0 24 0 76 0 84 16 0 0 70 3 24 0 3
Kali Baru 0 11 3 87 0 42 18 34 5 45 0 29 11 16
Semper Timur 7 13 20 60 0 73 7 7 13 87 7 7 0 0
Tugu Utara 0 24 28 48 0 59 14 24 3 55 21 24 0 0
Ancol 0 5 0 95 0 21 0 79 0 68 5 16 11 0
Pademangan Barat 0 0 9 87 4 91 0 4 4 96 0 0 0 0
Penjaringan 0 0 11 89 0 21 58 16 5 58 5 37 0 0
Papanggo 0 98 2 0 0 82 18 0 0 9 84 7 0 0
4.3.5 Slum Neighborhood in Selected RW’s Kumuh by Building Size, Source of Electricity and Source of Water Supply
This following table shown the percentage of household by Building Size, Source of Electricity and Source of Water Supply
Table 4-22 Percentage of Slum Neighborhood in Selected RW’s Kumuh by Building Size, Source of Electricity and Source of Water Supply
Village
Building size Source of Electricity Source of Water Supply
< 36 36 - 72 > 72 PLN NON PLN
Ground water
Piped water
Water seller
Other
Cengkareng Timur 35 56 9 96 4 5 1 19 0
Kapuk 89 9 2 100 0 15 2 17 0
Kedaung Kali Angke 80 20 0 100 0 88 200 12 0
Jelambar 76 14 10 100 0 0 19 157 0
Kedoya Utara 79 14 7 100 0 7 11 11 32
Jati Pulo 43 57 0 100 0 29 114 14 0
Duri Selatan 55 18 27 100 0 9 36 18 0
Kali Anyar 81 19 0 100 0 26 63 0 0
Johar Baru 77 15 8 100 0 69 15 77 0
Kampung Rawa 0 30 70 100 0 60 70 0 0
Tanah Tinggi 0 67 33 100 0 50 133 42 0
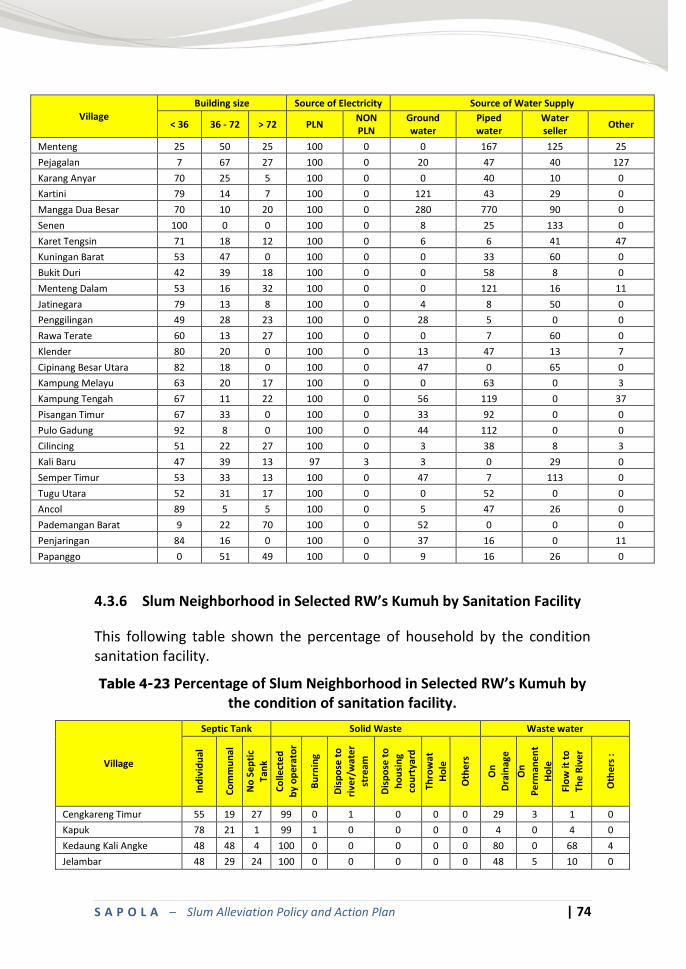
S A P O L A – Slum Alleviation Policy and Action Plan | 74
Village Building size Source of Electricity Source of Water Supply
< 36 36 - 72 > 72 PLN NON PLN
Ground water
Piped water
Water seller
Other
Menteng 25 50 25 100 0 0 167 125 25
Pejagalan 7 67 27 100 0 20 47 40 127
Karang Anyar 70 25 5 100 0 0 40 10 0
Kartini 79 14 7 100 0 121 43 29 0
Mangga Dua Besar 70 10 20 100 0 280 770 90 0
Senen 100 0 0 100 0 8 25 133 0
Karet Tengsin 71 18 12 100 0 6 6 41 47
Kuningan Barat 53 47 0 100 0 0 33 60 0
Bukit Duri 42 39 18 100 0 0 58 8 0
Menteng Dalam 53 16 32 100 0 0 121 16 11
Jatinegara 79 13 8 100 0 4 8 50 0
Penggilingan 49 28 23 100 0 28 5 0 0
Rawa Terate 60 13 27 100 0 0 7 60 0
Klender 80 20 0 100 0 13 47 13 7
Cipinang Besar Utara 82 18 0 100 0 47 0 65 0
Kampung Melayu 63 20 17 100 0 0 63 0 3
Kampung Tengah 67 11 22 100 0 56 119 0 37
Pisangan Timur 67 33 0 100 0 33 92 0 0
Pulo Gadung 92 8 0 100 0 44 112 0 0
Cilincing 51 22 27 100 0 3 38 8 3
Kali Baru 47 39 13 97 3 3 0 29 0
Semper Timur 53 33 13 100 0 47 7 113 0
Tugu Utara 52 31 17 100 0 0 52 0 0
Ancol 89 5 5 100 0 5 47 26 0
Pademangan Barat 9 22 70 100 0 52 0 0 0
Penjaringan 84 16 0 100 0 37 16 0 11
Papanggo 0 51 49 100 0 9 16 26 0
4.3.6 Slum Neighborhood in Selected RW’s Kumuh by Sanitation Facility
This following table shown the percentage of household by the condition sanitation facility.
Table 4-23 Percentage of Slum Neighborhood in Selected RW’s Kumuh by the condition of sanitation facility.
Village
Septic Tank Solid Waste Waste water
Ind
ivid
ual
Co
mm
un
al
No
Se
pti
c
Tan
k
Co
llect
ed
b
y o
per
ato
r
Bu
rnin
g
Dis
po
se t
o
rive
r/w
ate
r
stre
am
Dis
po
se t
o
ho
usi
ng
cou
rtya
rd
Thro
wat
Ho
le
Oth
ers
On
D
rain
age
On
Pe
rman
en
t H
ole
Flo
w it
to
The
Riv
er
Oth
ers
:
Cengkareng Timur 55 19 27 99 0 1 0 0 0 29 3 1 0
Kapuk 78 21 1 99 1 0 0 0 0 4 0 4 0
Kedaung Kali Angke 48 48 4 100 0 0 0 0 0 80 0 68 4
Jelambar 48 29 24 100 0 0 0 0 0 48 5 10 0
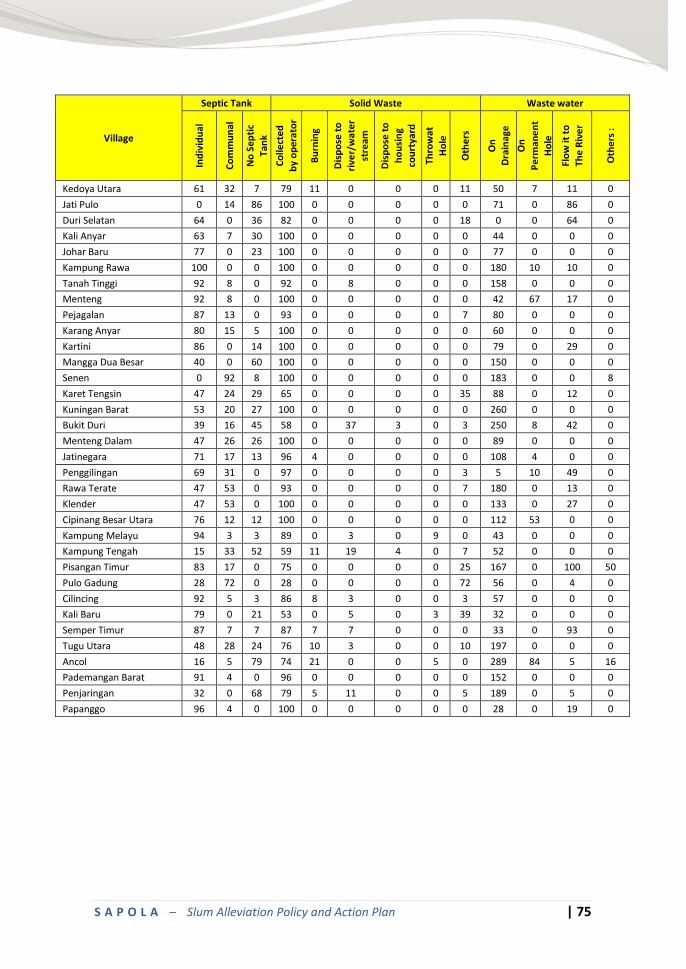
S A P O L A – Slum Alleviation Policy and Action Plan | 75
Village
Septic Tank Solid Waste Waste water
Ind
ivid
ual
Co
mm
un
al
No
Se
pti
c
Tan
k
Co
llect
ed
b
y o
per
ato
r
Bu
rnin
g
Dis
po
se t
o
rive
r/w
ate
r
stre
am
Dis
po
se t
o
ho
usi
ng
cou
rtya
rd
Thro
wat
Ho
le
Oth
ers
On
D
rain
age
On
Pe
rman
en
t H
ole
Flo
w it
to
The
Riv
er
Oth
ers
:
Kedoya Utara 61 32 7 79 11 0 0 0 11 50 7 11 0
Jati Pulo 0 14 86 100 0 0 0 0 0 71 0 86 0
Duri Selatan 64 0 36 82 0 0 0 0 18 0 0 64 0
Kali Anyar 63 7 30 100 0 0 0 0 0 44 0 0 0
Johar Baru 77 0 23 100 0 0 0 0 0 77 0 0 0
Kampung Rawa 100 0 0 100 0 0 0 0 0 180 10 10 0
Tanah Tinggi 92 8 0 92 0 8 0 0 0 158 0 0 0
Menteng 92 8 0 100 0 0 0 0 0 42 67 17 0
Pejagalan 87 13 0 93 0 0 0 0 7 80 0 0 0
Karang Anyar 80 15 5 100 0 0 0 0 0 60 0 0 0
Kartini 86 0 14 100 0 0 0 0 0 79 0 29 0
Mangga Dua Besar 40 0 60 100 0 0 0 0 0 150 0 0 0
Senen 0 92 8 100 0 0 0 0 0 183 0 0 8
Karet Tengsin 47 24 29 65 0 0 0 0 35 88 0 12 0
Kuningan Barat 53 20 27 100 0 0 0 0 0 260 0 0 0
Bukit Duri 39 16 45 58 0 37 3 0 3 250 8 42 0
Menteng Dalam 47 26 26 100 0 0 0 0 0 89 0 0 0
Jatinegara 71 17 13 96 4 0 0 0 0 108 4 0 0
Penggilingan 69 31 0 97 0 0 0 0 3 5 10 49 0
Rawa Terate 47 53 0 93 0 0 0 0 7 180 0 13 0
Klender 47 53 0 100 0 0 0 0 0 133 0 27 0
Cipinang Besar Utara 76 12 12 100 0 0 0 0 0 112 53 0 0
Kampung Melayu 94 3 3 89 0 3 0 9 0 43 0 0 0
Kampung Tengah 15 33 52 59 11 19 4 0 7 52 0 0 0
Pisangan Timur 83 17 0 75 0 0 0 0 25 167 0 100 50
Pulo Gadung 28 72 0 28 0 0 0 0 72 56 0 4 0
Cilincing 92 5 3 86 8 3 0 0 3 57 0 0 0
Kali Baru 79 0 21 53 0 5 0 3 39 32 0 0 0
Semper Timur 87 7 7 87 7 7 0 0 0 33 0 93 0
Tugu Utara 48 28 24 76 10 3 0 0 10 197 0 0 0
Ancol 16 5 79 74 21 0 0 5 0 289 84 5 16
Pademangan Barat 91 4 0 96 0 0 0 0 0 152 0 0 0
Penjaringan 32 0 68 79 5 11 0 0 5 189 0 5 0
Papanggo 96 4 0 100 0 0 0 0 0 28 0 19 0


![INKINDO DKI.pdf · INKINDO DKI Jakarta is located in the Eita] aty of Jakarta Pro,nnce, established in 1982 INKINDODKI Jakarta ncwhas 930 active mernba.s of cmsulting](https://static.fdocuments.in/doc/165x107/5ace62327f8b9ae2138b49ea/inkindo-dkipdfinkindo-dki-jakarta-is-located-in-the-eita-aty-of-jakarta-pronnce.jpg)