Continuum finite element modeling of concrete structural components - Nilanjan Mitra.
19
Continuum finite element modeling of concrete structural components - Nilanjan Mitra
-
Upload
alfred-boone -
Category
Documents
-
view
223 -
download
1
Transcript of Continuum finite element modeling of concrete structural components - Nilanjan Mitra.

Continuum finite element modeling of concrete structural components
- Nilanjan Mitra
Crack modeling for concreteDiscrete crack model
Advanced remeshing(Ingraffea & Saouma, Cervenka)
Adaptive boundary/fem(Carter, Spievak)
Advanced fem
• Meshfree fem (Belytschko)
• X fem (Sukumar, Moes, Dolbow)
Lattice methods(van Mier, Bolander)
Smeared crack model Enriched continua
Empirical global(Vecchio & Collins, Hsu)
Phenomenological(Rots, de Borst, Willam, Crisfield, Blaauwendraad)• Fixed crack• Coaxial rotating• Multi-directional fixed
Damage Plasticity(de Borst, Simo, Lubliner, Desai, Fenves, Govindjee)
Microplane models(Bazant, Prat, Ozbolt, Caner)
Cosserat continua(Cosserat, Green, Rivlin,Mindlin, Vardoulakis,Muhlhaus, de Borst, Willam, Sluys, Etse)
Higher order gradient(Aifantis, Vardoulakis,de Borst, Pamin, Voyiadjis)
Embedded discontinuity(Jirasek, Lotfi, Shing, Spencer, Belytschko, Sluys,Larsson, Simo, Oliver,Armero, Olofsson)• KOS• SOS• SKON
Models done with TNO DIANA
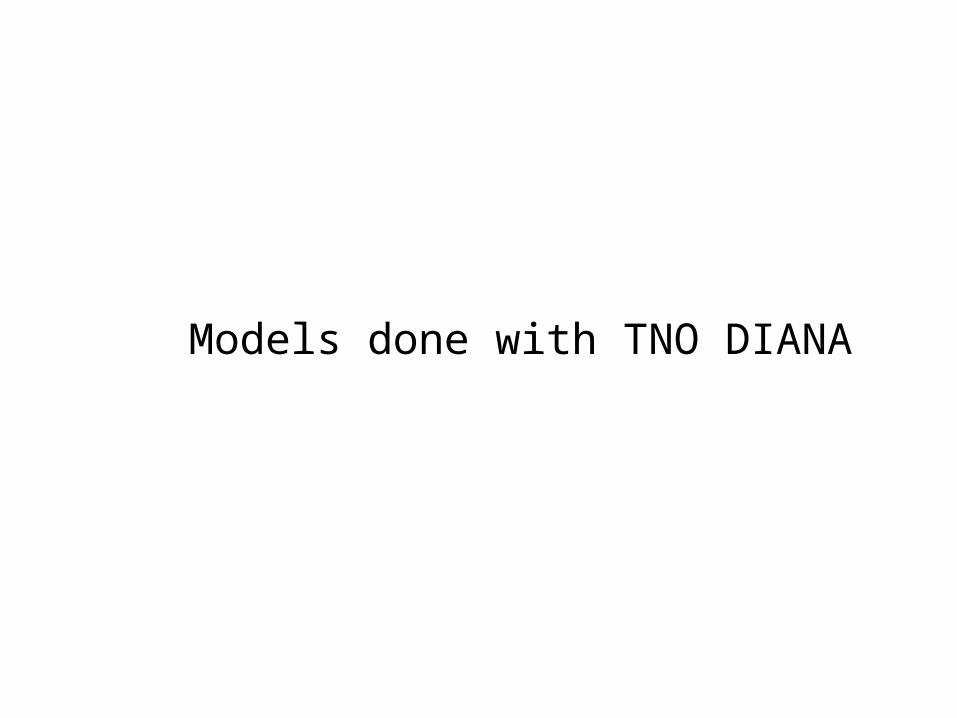
Constitutive models for continuum FEMCompressive model for concrete:
• Yield surface – Drucker-Prager
• Flow rule -- Associative
• Compression Hardening/Softening function -- calibrated to match Popovics relation
• Plastic strain is zero till 30% of the strength is achieved
• Suitable for biaxial loading -- 16% increase in strength
Tensile model for concrete:
• Linear tension cut-off
• Hordijk model for tension softening
Model for reinforcement steel:
• Associated Von-Mises plasticity with strain hardening
Model for bond in between reinforcement and concrete:
• Elastic radial response
• Transverse response is calibrated to match the Eligehausen model for bond
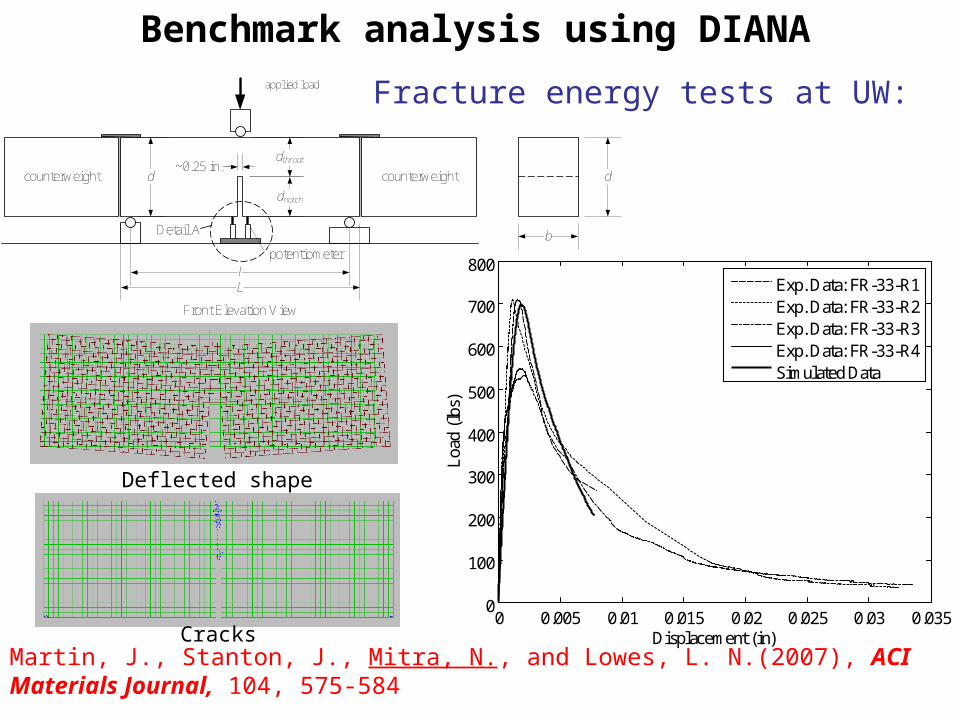
Benchmark analysis using DIANA
Fracture energy tests at UW:
0 0.005 0.01 0.015 0.02 0.025 0.03 0.0350
100
200
300
400
500
600
700
800
Displacement (in)
Loa
d (l
bs)
Exp. Data: FR-33-R1Exp. Data: FR-33-R2Exp. Data: FR-33-R3Exp. Data: FR-33-R4Simulated Data
counterweight counterweight
l
d
dnotch
dthroat
applied load
~0.25 in.
Detail A
potentiometer
Front Elevation View
d
b
L
Deflected shape
Cracks
Martin, J., Stanton, J., Mitra, N., and Lowes, L. N.(2007), ACI Materials Journal, 104, 575-584
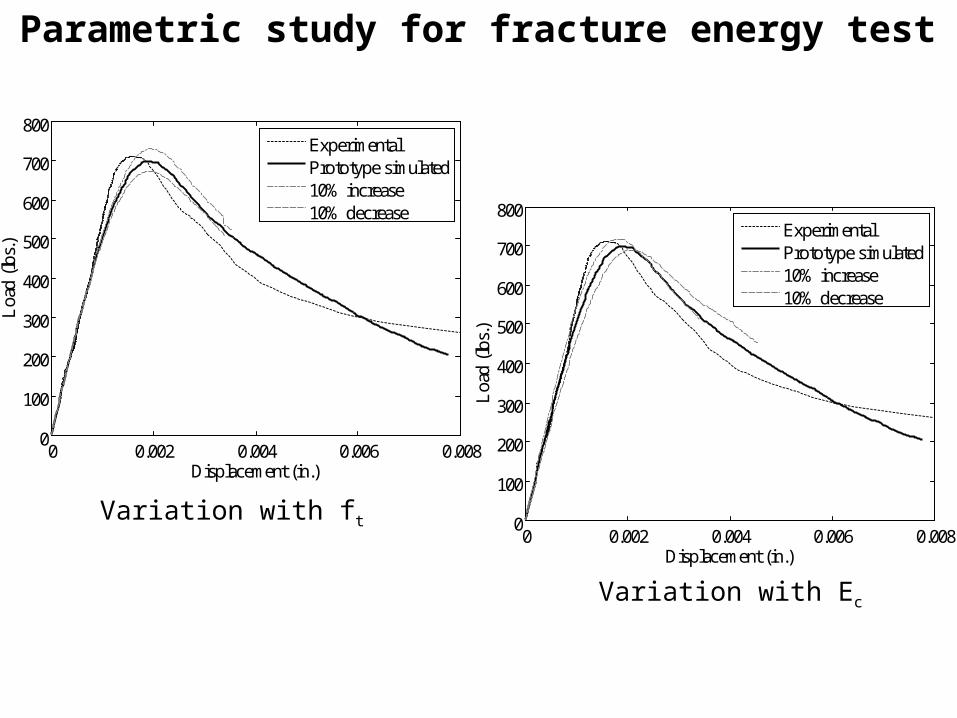
Parametric study for fracture energy test
Variation with ft
Variation with Ec
0 0.002 0.004 0.006 0.0080
100
200
300
400
500
600
700
800
Displacement (in.)
Loa
d (l
bs.)
ExperimentalPrototype simulated10% increase10% decrease
0 0.002 0.004 0.006 0.0080
100
200
300
400
500
600
700
800
Displacement (in.)
Loa
d (l
bs.)
ExperimentalPrototype simulated10% increase10% decrease
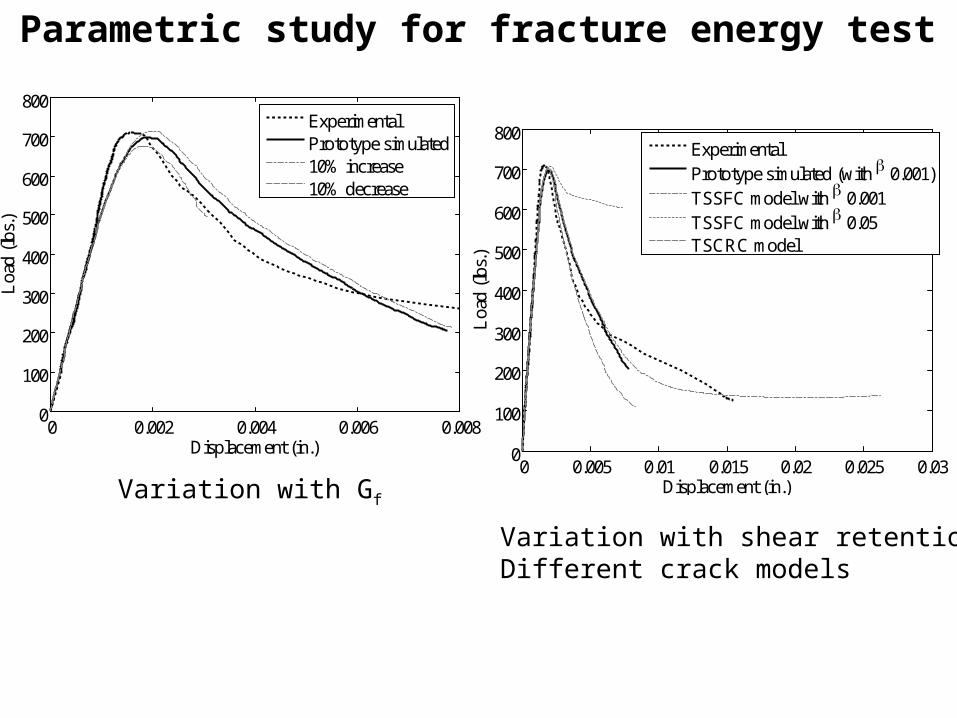
Parametric study for fracture energy test
0 0.002 0.004 0.006 0.0080
100
200
300
400
500
600
700
800
Displacement (in.)
Loa
d (l
bs.)
ExperimentalPrototype simulated10% increase10% decrease
Variation with Gf
0 0.005 0.01 0.015 0.02 0.025 0.030
100
200
300
400
500
600
700
800
Displacement (in.)L
oad
(lbs
.)
ExperimentalPrototype simulated (with 0.001)TSSFC model with 0.001TSSFC model with 0.05TSCRC model
Variation with shear retention,Different crack models
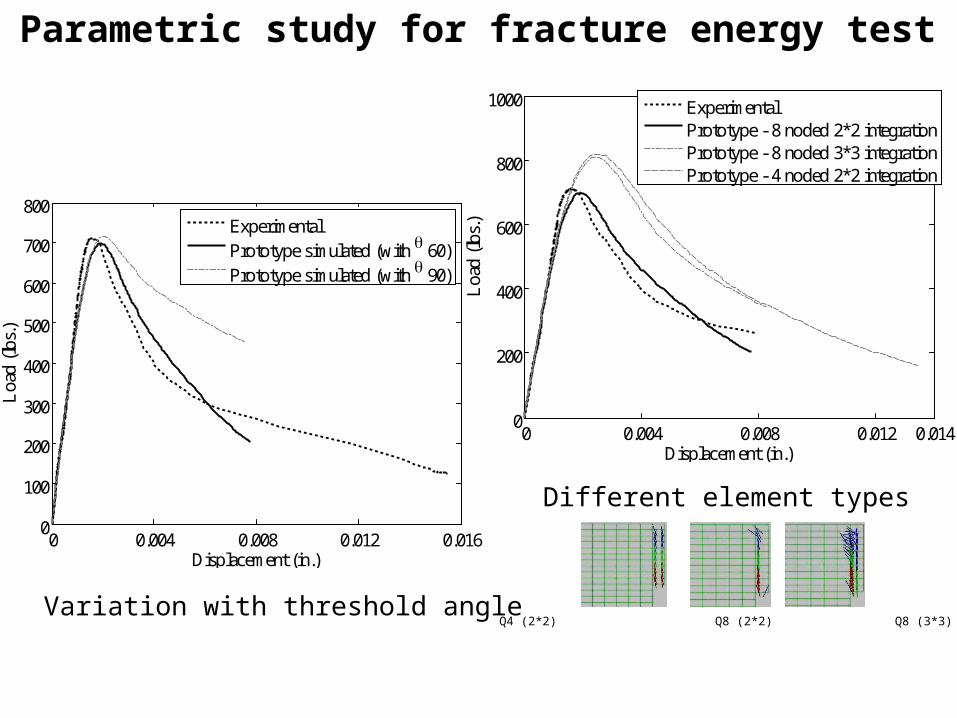
Parametric study for fracture energy test
0 0.004 0.008 0.012 0.0140
200
400
600
800
1000
Displacement (in.)L
oad
(lbs
.)
ExperimentalPrototype - 8 noded 2*2 integrationPrototype - 8 noded 3*3 integrationPrototype - 4 noded 2*2 integration
Different element types
0 0.004 0.008 0.012 0.0160
100
200
300
400
500
600
700
800
Displacement (in.)
Loa
d (l
bs.)
ExperimentalPrototype simulated (with 60)Prototype simulated (with 90)
Variation with threshold angle
Q4 (2*2) Q8 (2*2) Q8 (3*3)
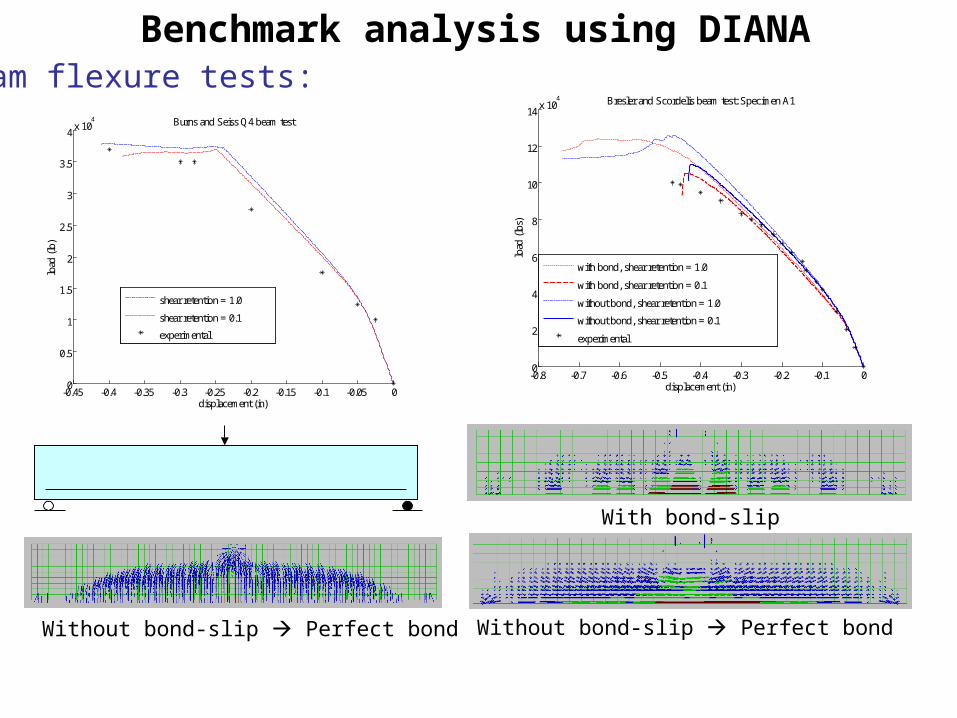
-0.8 -0.7 -0.6 -0.5 -0.4 -0.3 -0.2 -0.1 00
2
4
6
8
10
12
14x 10
4 Bresler and Scordelis beam test: Specimen A1
displacement (in)
load
(lb
s)
with bond, shear retention = 1.0
with bond, shear retention = 0.1
without bond, shear retention = 1.0
without bond, shear retention = 0.1
experimental
Benchmark analysis using DIANABeam flexure tests:
-0.45 -0.4 -0.35 -0.3 -0.25 -0.2 -0.15 -0.1 -0.05 00
0.5
1
1.5
2
2.5
3
3.5
4x 10
4 Burns and Seiss Q4 beam test
displacement (in)
load
(lb
)
shear retention = 1.0
shear retention = 0.1
experimental
Without bond-slip Perfect bond
With bond-slip
Without bond-slip Perfect bond
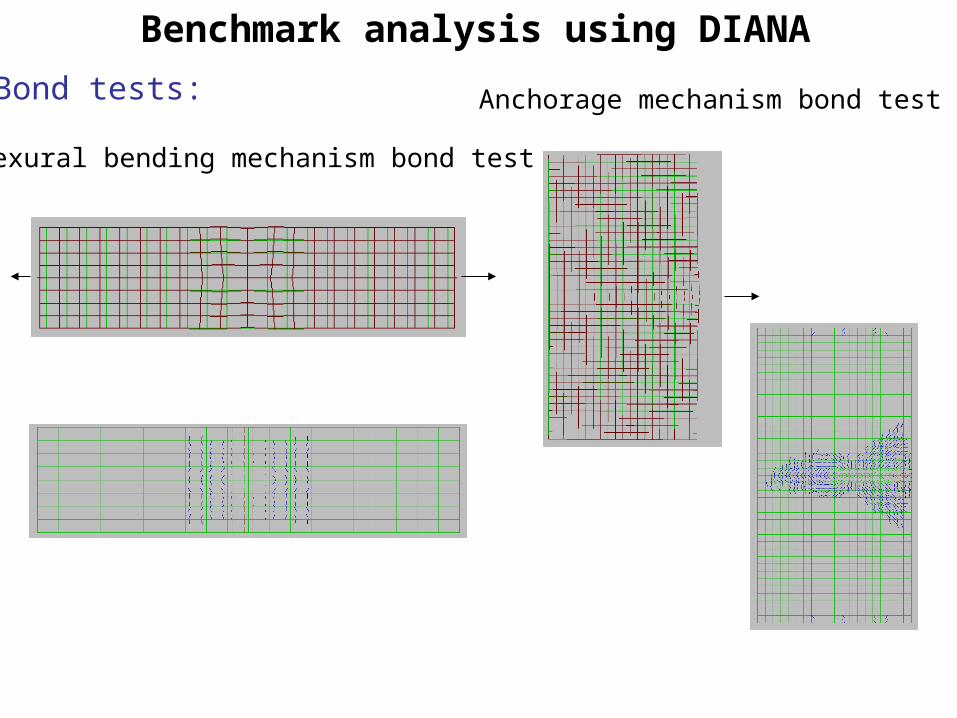
Benchmark analysis using DIANA
Flexural bending mechanism bond test
Anchorage mechanism bond testBond tests:
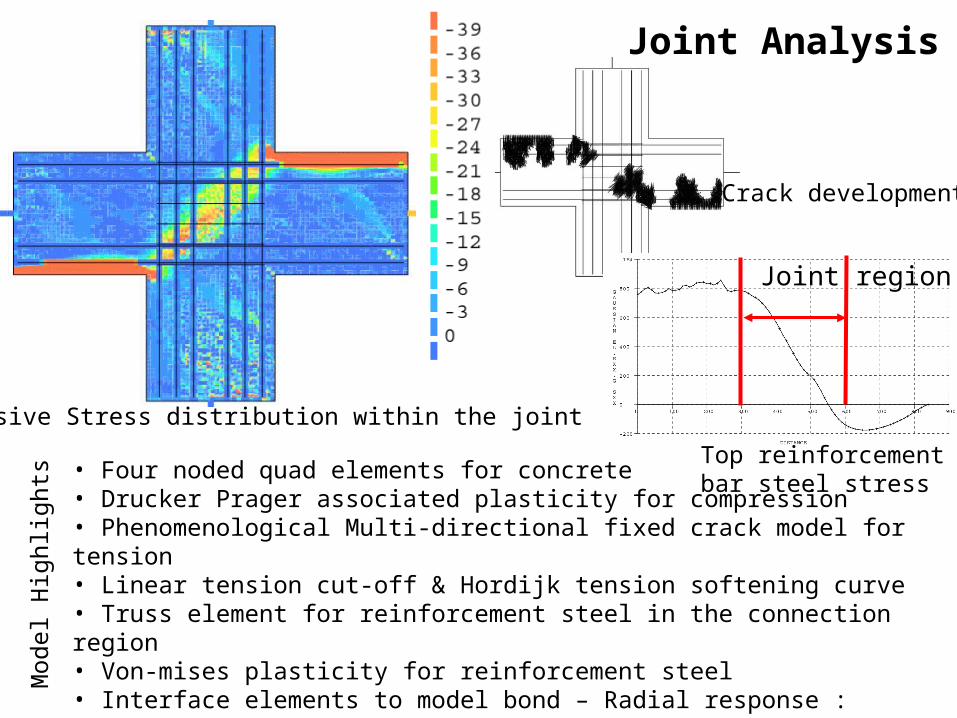
Compressive Stress distribution within the joint
Joint region
Top reinforcement bar steel stress
• Four noded quad elements for concrete• Drucker Prager associated plasticity for compression• Phenomenological Multi-directional fixed crack model for tension• Linear tension cut-off & Hordijk tension softening curve• Truss element for reinforcement steel in the connection region• Von-mises plasticity for reinforcement steel• Interface elements to model bond – Radial response : Elastic Transverse response: Nonlinear calibrated to Eligehausen uniaxial bond model• Elastic elements with cracked stiffness to model the beams and columns
Mod
el H
ighl
ight
sJoint Analysis
Crack development
Studies carried out with ABAQUS
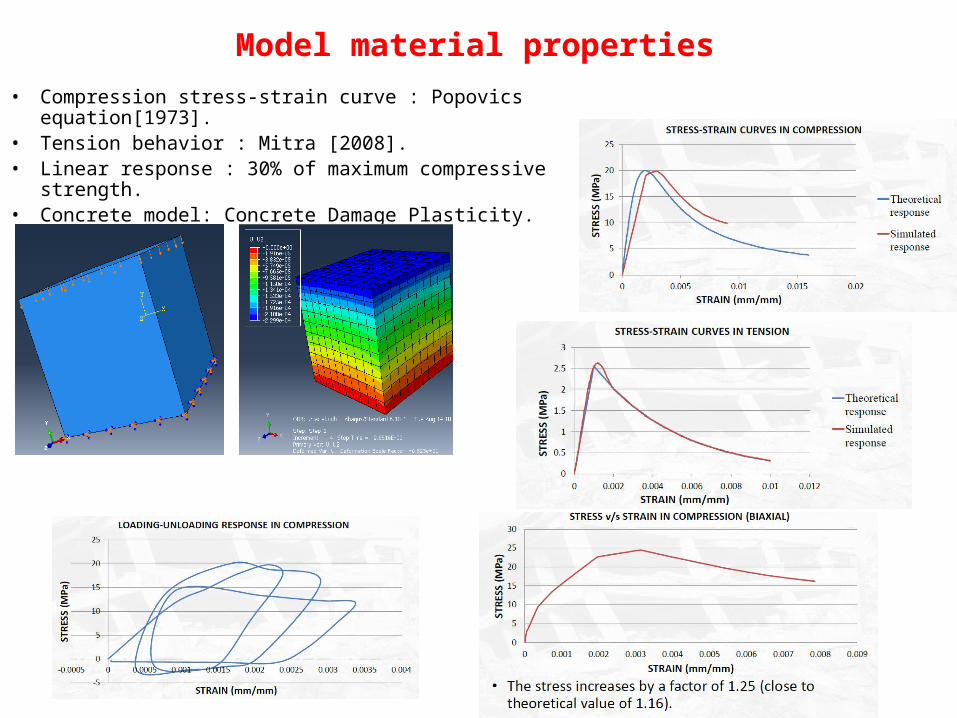
Model material properties
• Compression stress-strain curve : Popovics equation[1973].• Tension behavior : Mitra [2008].• Linear response : 30% of maximum compressive strength.• Concrete model: Concrete Damage Plasticity.

Beam-column Joint Model
Beam and column as line element
Connection region
Monotonic increasing lateral load
Constant axial load
Simulated Joint with loading and boundary condition.
Transfer of force/moment to joint : ‘Distributing coupling’ .
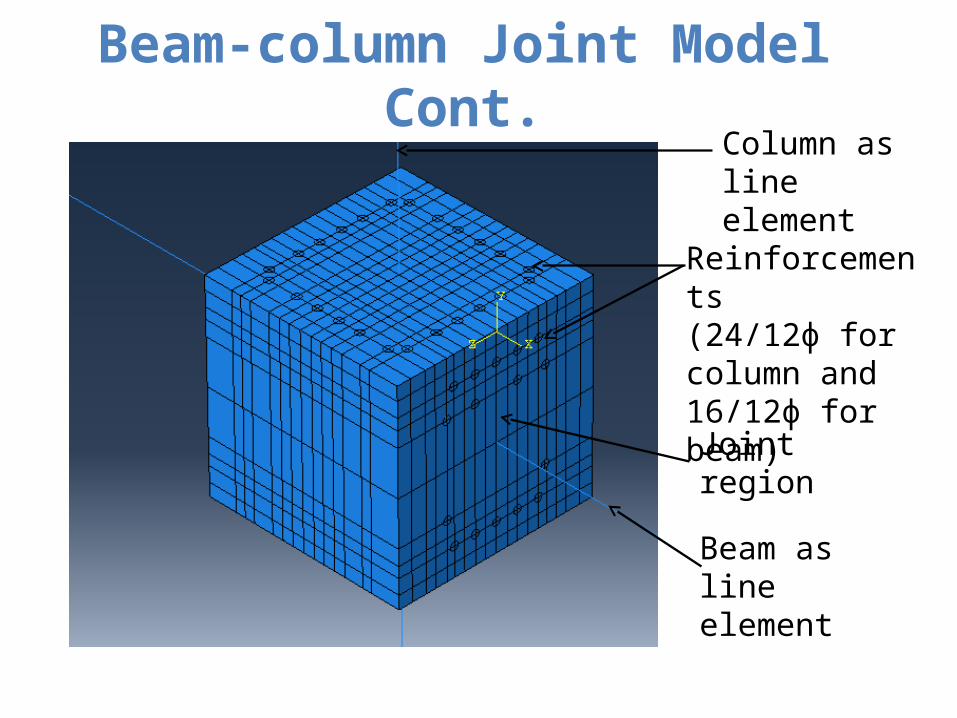
Beam-column Joint Model Cont.Column as line element
Reinforcements(24/12ɸ for column and 16/12ɸ for beam)
Joint region
Beam as line element

Beam-column Joint Model Cont.
• Studies made up to 2% drift.• Nature of loading :
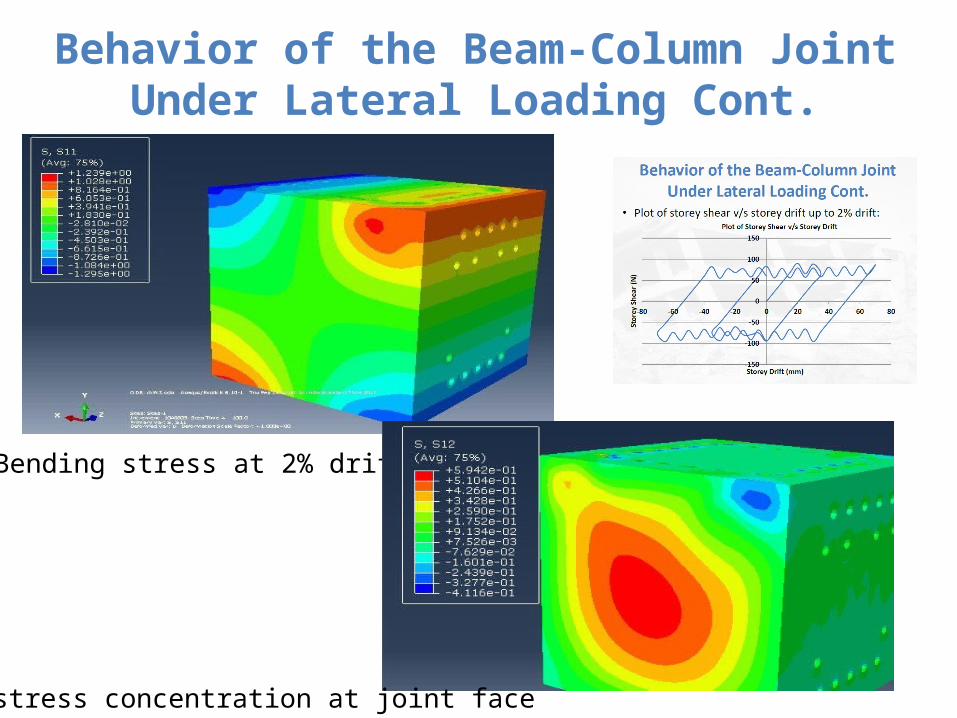
Behavior of the Beam-Column Joint Under Lateral Loading Cont.
Bending stress at 2% drift
Shear stress concentration at joint face
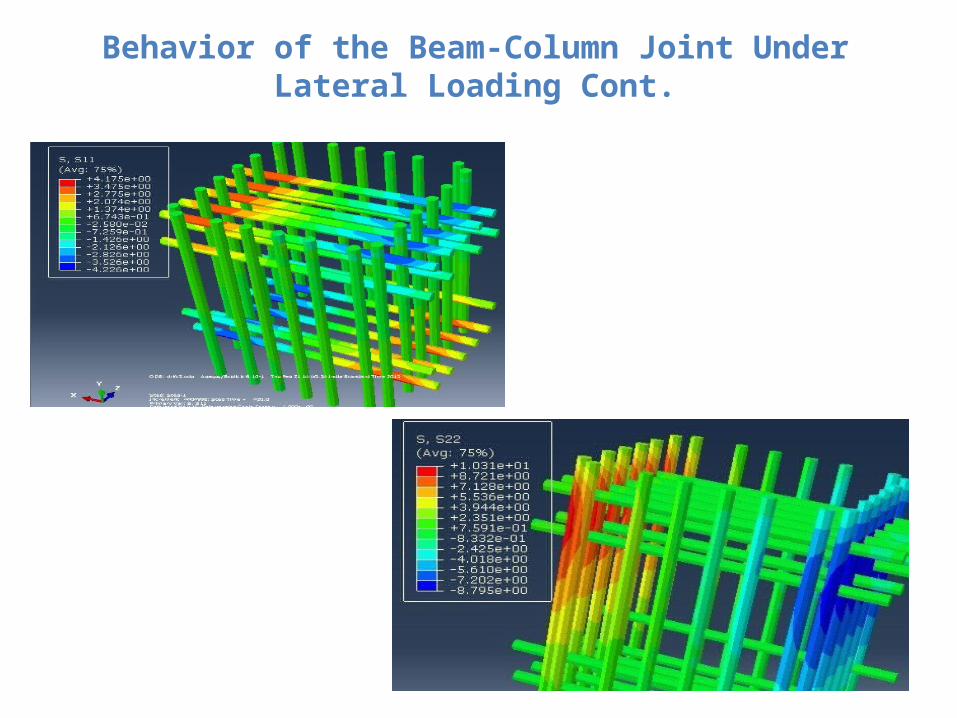
Behavior of the Beam-Column Joint Under Lateral Loading Cont.
More work pending for 3d continuum simulation for joints:
Looking for students to complete the work
Any interested student with some prior expertise in FE modeling,preferably with concrete modeling can contact me in my email add.