Greater Bendigo Cultural Diversity and Inclusion Plan 2016 ...

1
City of Greater Bendigo Early Years Profile
Introduction
The City of Greater Bendigo Early Years Profile provides a snapshot of the key trends and
indicators relating to the early years population of Greater Bendigo. In particular, the profile
provides an overview of key demographic data, such as current population, population forecasts,
advantage and disadvantage, and the profiles of households with children; as well as child health
and wellbeing, child early development statistics, and child education attendance and standards.
This profile represents a snapshot of key indicators of the 0 to 8 year old age group (early years)
population of Greater Bendigo. However, the age bracket of 0 to 9 is primarily used to match the
available five-year age groups of 0 to 4 and 5 to 9, and where this is not available, the 0 to 4 and 5
to 11 service groups are used.
The profile is based on the most recent publicly available data for each indicator from a range of
government agencies and other organisations, including the Australian Bureau of Statistics, the
Department of Education, City of Greater Bendigo, the Public Health Information Development
Unit, and Department of Environment, Land, Water and Planning. All demographic statistics
referring to numbers/percentages of residents are either usual residents or estimated residential
population data, unless otherwise stated. Where possible, all Greater Bendigo statistics are
compared to Victorian equivalents.
Key and Emerging Themes
The profile illustrates that Greater Bendigo has a higher proportion of children aged 0 to 9 than
Victoria, and that this age group is predicted to grow in numbers and as a percentage of population
over the next two decades. Some suburbs like Huntly are expected to experience more than a
doubling of this age group, while Heathcote & District will experience negative growth of population
of 0 to 9 year olds.
The data also highlights that suburbs like Long Gully-West Bendigo-Ironbark have higher levels of
disadvantage, higher levels of single partner households, higher levels of developmentally
vulnerable children, and lower levels of mothers in work than Victoria. While Greater Bendigo as a
whole, has higher levels of housing stress and higher levels of low income households than
Victoria.
Greater Bendigo also has a higher rate of infants born with low birth weight, higher rate of infant
deaths, and higher rate of child abuse than Victoria, but better rates of immunisation than Victoria.
Greater Bendigo also has a lower rate of overweight children, but a higher rate of children with
allergies and less children are reported to have very good or excellent health than Victoria.
2
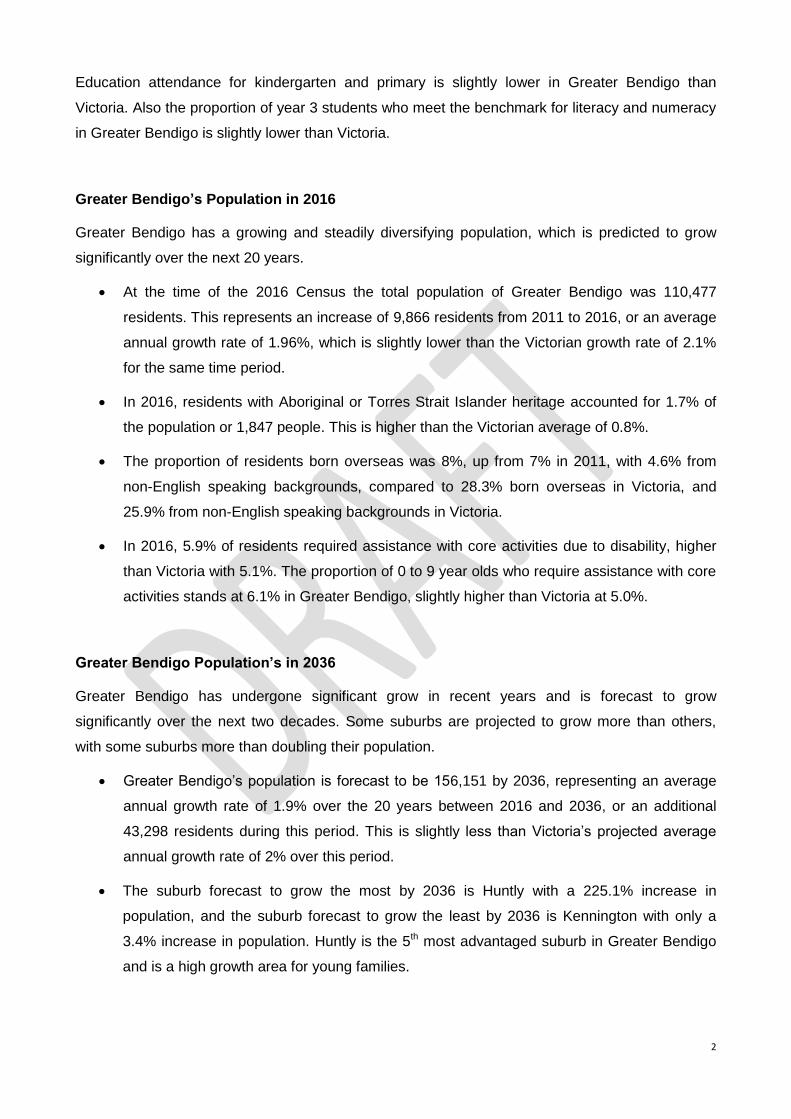
Education attendance for kindergarten and primary is slightly lower in Greater Bendigo than
Victoria. Also the proportion of year 3 students who meet the benchmark for literacy and numeracy
in Greater Bendigo is slightly lower than Victoria.
Greater Bendigo’s Population in 2016
Greater Bendigo has a growing and steadily diversifying population, which is predicted to grow
significantly over the next 20 years.
At the time of the 2016 Census the total population of Greater Bendigo was 110,477
residents. This represents an increase of 9,866 residents from 2011 to 2016, or an average
annual growth rate of 1.96%, which is slightly lower than the Victorian growth rate of 2.1%
for the same time period.
In 2016, residents with Aboriginal or Torres Strait Islander heritage accounted for 1.7% of
the population or 1,847 people. This is higher than the Victorian average of 0.8%.
The proportion of residents born overseas was 8%, up from 7% in 2011, with 4.6% from
non-English speaking backgrounds, compared to 28.3% born overseas in Victoria, and
25.9% from non-English speaking backgrounds in Victoria.
In 2016, 5.9% of residents required assistance with core activities due to disability, higher
than Victoria with 5.1%. The proportion of 0 to 9 year olds who require assistance with core
activities stands at 6.1% in Greater Bendigo, slightly higher than Victoria at 5.0%.
Greater Bendigo Population’s in 2036
Greater Bendigo has undergone significant grow in recent years and is forecast to grow
significantly over the next two decades. Some suburbs are projected to grow more than others,
with some suburbs more than doubling their population.
Greater Bendigo’s population is forecast to be 156,151 by 2036, representing an average
annual growth rate of 1.9% over the 20 years between 2016 and 2036, or an additional
43,298 residents during this period. This is slightly less than Victoria’s projected average
annual growth rate of 2% over this period.
The suburb forecast to grow the most by 2036 is Huntly with a 225.1% increase in
population, and the suburb forecast to grow the least by 2036 is Kennington with only a
3.4% increase in population. Huntly is the 5th most advantaged suburb in Greater Bendigo
and is a high growth area for young families.

3
Advantage and Disadvantage in Greater Bendigo
Like other communities in Australia, Greater Bendigo has diverse levels of disadvantage with some
suburbs more advantaged than others, and in some areas significant numbers of households
experience housing stress.
In 2016, the most disadvantaged suburb in Greater Bendigo was Long Gully-West Bendigo-
Ironbark with a SEIFA score of 863, making it more disadvantaged than Greater Bendigo
overall with 981 and Victoria with 1010.
While the most advantaged suburb is Strathfieldsaye with a SEIFA score of 1090.6,
meaning it is in the top ten percent most advantaged suburbs in Australia.
In 2016, 11.9% of households were living in housing stress, slightly higher than the
Victorian average of 11.4%. The suburb with the highest level of housing stress is North
Bendigo-California Gully with 16.3%, and the suburb with the lowest level of housing stress
is Rural East with 4.2%.
The proportion of households with no parent in employment in 2016 was 21.0%, higher
than Victoria with 19.2% with Kangaroo Flat at the highest proportion with 11.1% of
households with no family in employment.
Households with Children in Greater Bendigo
The profile of households with children in Greater Bendigo is diverse and changing. Some areas
have significantly more couple households with children, while others have higher levels of single
parent households. Mothers in the labour force and household incomes also vary across the
suburbs.
In 2016, the proportion of Couple households with children under 15 in Greater Bendigo
was 18.3%, lower than the Victorian average of 21.2%, while Single Parent households
with children under 15 accounted for 6.2%, higher than the Victorian average of 4.6%.
The suburb with the most Couple households with children under 15 years is Maiden Gully
with 52.8%, while the suburb with the fewest is Heathcote and District with 15.8%.
The suburb with the most Single Parent households with children under 15 is Long Gully-
West Bendigo-Ironbark with 16.5%, while Maiden Gully has only 6.3%.
The proportion of residents providing unpaid childcare is 29.5%, compared to Victoria with
27.6%.
In 2016, the proportion of mothers in the labour force was 69.6%, higher than Victoria with
67.5%. The suburb with the most mothers in the labour force was Strathfieldsaye with
82.0% and the suburb with the fewest was Heathcote and District with 51.5%.

4
In 2016, the proportion of low income households (income less than $650 per week) in
Greater Bendigo was 21.0%, higher than Victoria with 18.3%. The suburb with the highest
proportion of low income households was Heathcote and District with 30.8%, while
Strathfieldsaye had the fewest low income households with only 6.8%.
In 2016, 3.9% of households lived in rented social housing – more than Victoria with 2.8%.
Forecasts show that by 2036 Couple households with children will account for 27.5% of
households in Greater Bendigo, while Single Parent households will account for 10.2%.
Maiden Gully is projected to have the most Couple households with children with 44.6%,
while the suburb with the most Single Parent households is forecast to be Long Gully –
West Bendigo - Ironbark with 16.0%.
Early Years Population in Greater Bendigo
A sizeable proportion of the Greater Bendigo population is made up of children, and they account
for more residents of that age than the Victorian average. The proportion of children varies
between suburbs significantly.
At the time of the 2016 Census the population of 0 to 9 year olds in Greater Bendigo was
14,385, or 6.5% of the population, compared to 6.3% in Victoria. This was an increase of
9.4% from 2011 to 2016, or an average annual growth rate of 1.9%, slightly lower than the
Victorian growth rate of 2.1% for the same time period. 7,075 children of the group were 0
to 4 year olds and 7,310 were 5 to 9 year olds, while 3.5% were of Aboriginal or Torres
Strait Islander heritage.
The proportion of 0 to 9 year olds who required assistance with core activities in 2016 was
6.1%, higher than Victoria with 5.0%.
The proportion of 0 to 4 years olds born overseas in 2016 was 1.1%, with 1.1% from non-
English speaking backgrounds, compared to 1.0% born overseas in Victoria, and 0.8%
from non-English speaking backgrounds in Victoria.
The proportion of 5 to 11 years olds born overseas in 2016 was 3.8%, with 4.5% from non-
English speaking backgrounds, compared to 3.8% born overseas in Victoria, and 4.9%
from non-English speaking backgrounds in Victoria.
In 2016, suburb with the highest proportion of 0 to 4 year olds was Epsom-Ascot with 9.8%,
and the suburb with the lowest proportion of 0 to 4 year olds was Heathcote and District
with 3.2%.

5
The suburb with the largest growth in 0 to 4 year olds between 2011 and 2016 was Huntly
with 120.5% increase, and the suburb with least growth in 0 to 4 year olds between 2011
and 2016 was Heathcote and District with a decrease of 24.9%.
In 2016, the suburb with the highest proportion of 5 to 11 year olds was Maiden Gully with
13.3%, and the suburb with the lowest proportion of 5 to 11 year olds was Bendigo with
6.2%.
The suburb with the largest growth in 5 to 11 year olds between 2011 and 2016 was Huntly
with 89.9% increase, and the suburb with least growth in 5 to 11 year olds between 2011
and 2016 was Bendigo with a decrease of 25.5%.
Early Years Population Forecasts
Over recent years the population of children in Greater Bendigo has steadily grown and is
projected to continue to grow over the next two decades, with some suburbs predicted to grow
more in their population of children than others.
Greater Bendigo’s population of 0 to 9 year olds is forecast to grow to 20,806 by 2036 or
13.4% of the population, representing an average annual growth rate of 1.4% over the 20
years between 2016 and 2036 or an additional 5,798 0 to 9 year olds. As a percentage of
the population this is higher than Victoria’s projected population of 11.7%, and higher than
Victoria’s projected average annual growth rate of 1.1% over this period.
The suburb forecast to grow the most in 0 to 9 year old population by 2036 is Huntly with a
143.7% increase, while Long Gully-West Bendigo-Ironbark is forecast to decline in 0 to 9
year olds by 24.6%. However, the suburb forecast to have the highest number of 0 to 9
year olds by 2036 is Strathfieldsaye with 2,161 children, and the suburb forecast to have
the fewest is East Bendigo with 321.
Early Years Health and Wellbeing
Health and wellbeing is a priority for many people, as without good health it is difficult to live a full
life. Health is more than being free from sickness or disease - it is a state of physical, mental and
social wellbeing. Many aspects in life impact on a person’s health, including income, housing,
education, diet, lifestyle, connectedness to family and community, and safety. These issues all
impact the health and wellbeing of children. Health and wellbeing indicators for children in Greater
Bendigo illustrate a varied picture of child health and wellbeing across the municipality.
The average annual proportion of babies born with low birth weight between 2012 and 2014
in Greater Bendigo was 6.7%, just higher than Victoria with 6.3%.
6
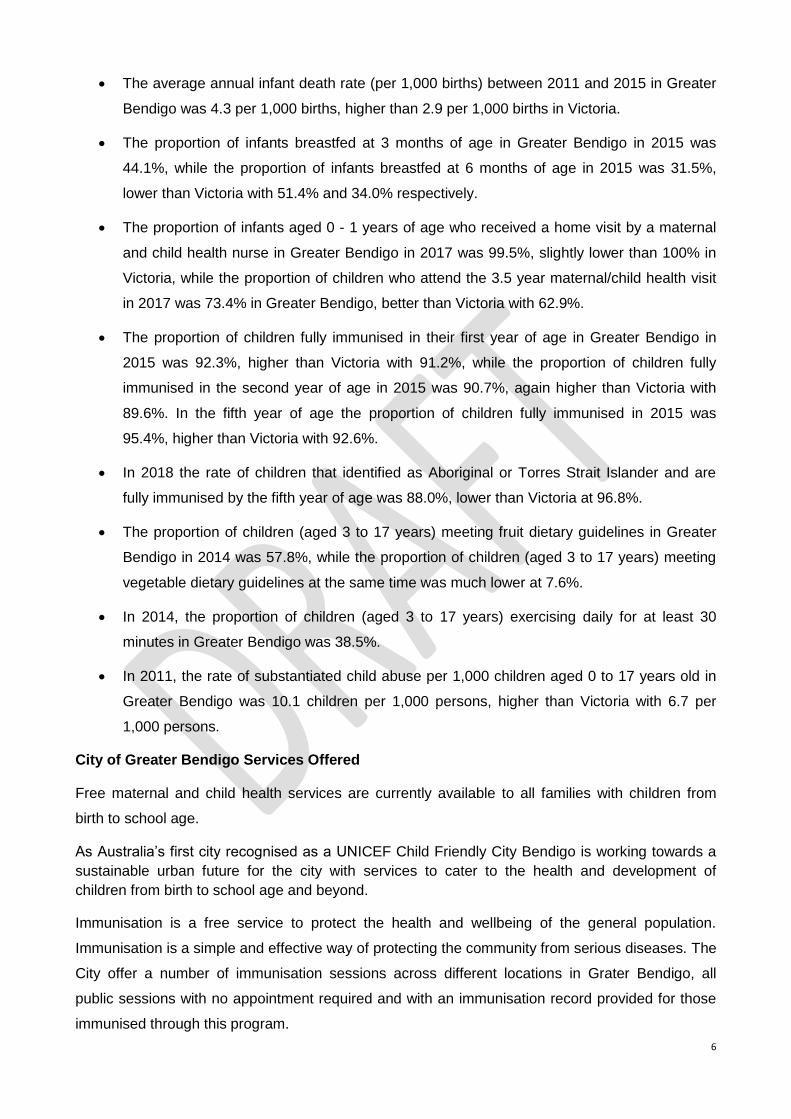
The average annual infant death rate (per 1,000 births) between 2011 and 2015 in Greater
Bendigo was 4.3 per 1,000 births, higher than 2.9 per 1,000 births in Victoria.
The proportion of infants breastfed at 3 months of age in Greater Bendigo in 2015 was
44.1%, while the proportion of infants breastfed at 6 months of age in 2015 was 31.5%,
lower than Victoria with 51.4% and 34.0% respectively.
The proportion of infants aged 0 - 1 years of age who received a home visit by a maternal
and child health nurse in Greater Bendigo in 2017 was 99.5%, slightly lower than 100% in
Victoria, while the proportion of children who attend the 3.5 year maternal/child health visit
in 2017 was 73.4% in Greater Bendigo, better than Victoria with 62.9%.
The proportion of children fully immunised in their first year of age in Greater Bendigo in
2015 was 92.3%, higher than Victoria with 91.2%, while the proportion of children fully
immunised in the second year of age in 2015 was 90.7%, again higher than Victoria with
89.6%. In the fifth year of age the proportion of children fully immunised in 2015 was
95.4%, higher than Victoria with 92.6%.
In 2018 the rate of children that identified as Aboriginal or Torres Strait Islander and are
fully immunised by the fifth year of age was 88.0%, lower than Victoria at 96.8%.
The proportion of children (aged 3 to 17 years) meeting fruit dietary guidelines in Greater
Bendigo in 2014 was 57.8%, while the proportion of children (aged 3 to 17 years) meeting
vegetable dietary guidelines at the same time was much lower at 7.6%.
In 2014, the proportion of children (aged 3 to 17 years) exercising daily for at least 30
minutes in Greater Bendigo was 38.5%.
In 2011, the rate of substantiated child abuse per 1,000 children aged 0 to 17 years old in
Greater Bendigo was 10.1 children per 1,000 persons, higher than Victoria with 6.7 per
1,000 persons.
City of Greater Bendigo Services Offered
Free maternal and child health services are currently available to all families with children from
birth to school age.
As Australia’s first city recognised as a UNICEF Child Friendly City Bendigo is working towards a
sustainable urban future for the city with services to cater to the health and development of
children from birth to school age and beyond.
Immunisation is a free service to protect the health and wellbeing of the general population.
Immunisation is a simple and effective way of protecting the community from serious diseases. The
City offer a number of immunisation sessions across different locations in Grater Bendigo, all
public sessions with no appointment required and with an immunisation record provided for those
immunised through this program.

7
City of Greater Bendigo has two Early Learning Centres for families with young children, both
assessed and rated under the Department of Education and Early Childhood Development
National Quality Framework. Local Bendigo Early Learning Centres provide a comprehensive
caring and educative facility for families with young children.
School Entrant Health Questionnaire
The School Entrant Health Questionnaire is an important aspect of the Primary School Nursing
Program. It is completed by parents or carers - thus providing the parent’s/carer’s perspective of
their child’s health and wellbeing, not a clinician’s opinion.
Findings from the 2017 questionnaire showed:
83.9% of children in Greater Bendigo reported being in excellent or very good health,
slightly worse than 85.3% in Victoria.
9.3% of children were reported to have allergies in Greater Bendigo, slightly higher than
Victoria with 9.2%.
14.6% of children in Greater Bendigo were reported as having been told by a doctor that
they had asthma, higher than Victoria with 12.2%.
15.9% of parents in Greater Bendigo said they were concerned about their child's oral
health (e.g., teeth, gums etc.), higher than Victoria with 14%.
15.1% of children were reported to have difficulties with speech and/or language in Greater
Bendigo, higher than Victoria with 14.1%.
15.1% of parents in Greater Bendigo reported being concerned about the behaviour of their
child, higher than 12.6% in Victoria.
14.9% of children in Greater Bendigo were at high risk of developmental or behavioural
problems in 2017, lower than Victoria with 15.5%. While 28.3% of children in Greater
Bendigo were at moderate risk of developmental or behavioural problems, lower than
28.6% in Victoria.

8
Australian Early Development Census
The Australian Early Development Census collects data on the developmental health and
wellbeing of all children commencing school. It measures developmental health and wellbeing
across five domains, these are: physical health and wellbeing, social competence, emotional
maturity, language and cognitive skills (school-based), and communication skills and general
knowledge. The 2018 data for Greater Bendigo, like other measures of health and wellbeing,
shows varied levels of developmental health and wellbeing across the municipality and over time.
The Australian Early Development Census shows that in 2018 the proportion of children in
Greater Bendigo vulnerable on the domain of Physical Health and Wellbeing was 9.3%,
higher than Victoria with 8.2%.
The same report showed that 9.8% of children in Greater Bendigo were vulnerable on the
domain of Social Competence, only slightly higher than Victoria with 8.8%.
In 2018, the proportion of children vulnerable on the domain of Emotional Maturity in
Greater Bendigo was 10.7%, higher than Victoria with 8.1%.
While 7.9% of children in Greater Bendigo were vulnerable on the domain of Language and
Cognitive Skills (school-based), more than 6.4% in Victoria.
The proportion of children vulnerable on the domain of Communication skills and General
Knowledge in Greater Bendigo in 2018 was 7.9%, similar to Victoria with 7.4%.
In 2018, the proportion of children vulnerable on one or more domains(s) in Greater
Bendigo was 22.8%, an increase of 1.7% from 2015, higher than Victoria with 19.9% were
vulnerable, which experienced no change from 2015 to 2018.
In the same year the proportion of children vulnerable on two or more domains in Greater
Bendigo was 10.1%, a decrease of 1.7% from 2015, equivalent to Victoria where 10.1%
were vulnerable, and the change from 2015 to 2018 was an increase of 0.2%.
The suburb with the highest proportion of children vulnerable on one or more domains(s) in
2018 was Heathcote and surrounds with 45.3%, while the suburb with the lowest proportion
of children vulnerable on one or more domains(s) was Lockwood-Ravenswood with 4.5%.
The suburb with the highest proportion of children vulnerable on two or more domains in
2018 was California Gully with 33.3%, while the suburb with the lowest proportion of
children vulnerable on two or more domains was Flora Hill with 2.6%.
Early Years Education and Care
Education is an important aspect of life as it is associated with better health throughout life. The
attendance of children in either kindergarten or primary school is an important indicator of future

9
life chances, and so too is the level of educational achievement such as levels of literacy and
numeracy.
In 2017 the kindergarten participation in the first year of enrolments for Greater Bendigo
was 97.6%, higher than Victoria with 93.4%.
The proportion of 5 to 11 year olds in Greater Bendigo attending primary school in 2016
was 82.9%, slightly lower than Victoria with 84.7%.
In 2015, the proportion of year 3 students in Greater Bendigo who met or exceeded the
benchmark for literacy was 93.9%, lower than Victoria with 95.8%. While the proportion of
year 3 students in Greater Bendigo who met or exceeded the benchmark for numeracy was
94.7%, lower than Victoria with 96%.
Early Childhood reforms
Through 2017/18 the Victorian government invested $202.1 million in kinder, Maternal and Child
Health (MCH), and parenting supports, to help get kids ready for kinder and school. Greater
Bendigo has been successful in securing funding to supplement existing services.
Additional funding has been made available to extend the hours of support of Maternal Child
Health nurses to make it available to families with children up to three years of age. This will aid
parents who are facing difficulties with breastfeeding, fussy eating, language development,
sleeping and settling, or managing toddler behaviour.
Additional funding has become available so that MCH nurses are able to support women and
children, and connect them to specialist support services. Studies show that pregnancy and the
early post-natal period is a time of heightened family violence risk. Through MCH nurses 100% of
families are screened for family violence and referred to support services.
The Victorian Government is investing $5 billion over ten years so that every child in the state will
have access to two years of kindergarten. This means that an extra year of play-based learning will
be added to Victorian children’s education, led by a qualified teacher. From 2022, three-year-olds
in Greater Bendigo will have access to at least five hours in a qualified kindergarten program, the
hours will then increase up to the full 15-hour program by 2029.

10
City of Greater Bendigo Early Years Data Profile
This data profile represents a snapshot of key indicators of the zero to eight year old age group
(early years) population of Greater Bendigo. However the age bracket of 0 to 9 is primarily used to
match the available five-year age groups of 0 to 4 and 5 to 9, and where this is not available, the 0
to 4 and 5 to 11 service groups are used.
This data snapshot is based on the most recent publically available data for each measure from a
range of government departments and agencies. All demographic figures referring to
numbers/percentages of residents are either usual residents or estimated residential population
data, unless otherwise stated. All Greater Bendigo statistics are compared where possible to
Victorian data.
Category Indicator CoGB
Measure
Vic
Measure
Greater Bendigo Profile
Greater Bendigo
Population
Demographics (ABS 2016
Census of Population &
Housing – Usual
Residents)1
Total population 110,477 5,926,637
Change in population 2011 to 2016 +9,866 increase +572,614
increase
Average annual growth rate between
2011 and 2016
+1.96% per
annum
+2.1% per
annum
Population of residents with Aboriginal
and Torres Strait Islander heritage
1,847 47,788
Percentage of residents with Aboriginal
and Torres Strait Islander heritage
1.7% 0.8%
Proportion born overseas 8.0% 28.3%
Proportion from non-English speaking
background
4.6% 21.9%
Proportion who require assistance with
core activities
5.9% 5.1%
Population Forecasts
2036 (Estimated
Residential Population)2
Population forecast for 2036 156,151 8,278,172
Change in population 2016 to 2036 +43,298 increase +2,351,548
increase
1 Atlas id, City of Greater Bendigo Social Atlas, ABS Census of Population & Housing, 2011 & 2016: http://atlas.id.com.au/bendigo
and Profile Id, City of Greater Bendigo Community Profile, ABS Census of Population & Housing, 2016: http://profile.id.com.au/bendigo and
1 ABS, Census of Population and Housing 2016, Cat 2071.0, Stories from the Census 2016,
Aboriginal and Torres Strait islander Population: http://www.abs.gov.au/ausstats/[email protected]/Lookup/by%20Subject/2071.0~2016~Main%20Features~Aboriginal%20and%20Torres%20Strait%20Islander%20Population%20Data%20Summary~10 2 Forecast id, City of Greater Bendigo, Population Forecasts, 2017: http://forecast.id.com.au/bendigo and Department of
Environment, Land, Water and Planning, Victoria in the Future 2016, Major Regions ERP Five Year Age Groups and Sex 2011 to 2051: https://www.planning.vic.gov.au/land-use-and-population-research/victoria-in-future-2016/victoria-in-future-data-tables

11
Category Indicator CoGB
Measure
Vic
Measure
Average annual growth rate between 2016 and 2036
+1.9% per annum +2.0% per annum
Suburb forecast to grow the most by
2036
Huntly:
+225.1% increase
--
Suburb forecast to grow the least by
2036
Kennington:
+3.4% increase
--
Disadvantage3
Level of relative disadvantage (SEIFA)
in 2016
983.1 1009.6
Most disadvantaged suburb (SEIFA) in
2016
Long Gully / West
Bendigo /
Ironbark:
863.0
--
Least disadvantaged suburb (SEIFA)
in 2016
Strathfieldsaye:
1090.6
--
Number of households in housing
stress in 2016 (Enumerated)
5,232 255,657
Percentage of households in housing
stress in 2016 (Enumerated)
11.9% 11.4%
Suburb with the highest level of
housing stress in 2016
North Bendigo
/California Gully:
16.3%
--
Suburb with the lowest level of housing
stress in 2016
Rural East:
4.2%
--
Households with
Children (ABS 2016
Census – Enumerated
and Usual Residents)4
Proportion of Couple households with
children under 15
18.3% 21.2%
Proportion of Single parent households
with children under 15
6.2% 4.6%
Suburb with the highest proportion of
Single parent households with children
under 15
Long Gully/West
Bendigo/Ironbark:
8.8%
--
3 Atlas id, City of Greater Bendigo Social Atlas, ABS Census of Population & Housing, 2011 & 2016: http://atlas.id.com.au/bendigo
and Profile Id, City of Greater Bendigo Community Profile, ABS Census of Population & Housing, 2011 & 2016: http://profile.id.com.au/bendigo 4 Atlas id, City of Greater Bendigo Social Atlas, ABS Census of Population & Housing, 2011 & 2016: http://atlas.id.com.au/bendigo
and Profile Id, City of Greater Bendigo Community Profile, ABS Census of Population & Housing, 2011 & 2016: http://profile.id.com.au/bendigo

12
Category Indicator CoGB
Measure
Vic
Measure
Proportion of residents providing
unpaid childcare (Usual Residents)
29.5% 27.6%
Proportion of mothers in the labour
force in 2016 (Usual Residents)
69.6% 67.5%
Suburb with the highest proportion of
mothers in the labour force in 2016
Strathfieldsaye:
82.0%
--
Suburb with the lowest proportion of
mothers in the labour force in 2016
(Usual Residents)
Heathcote and
District:
51.5%
--
Proportion of households with no
parent in employment in 20165
21.0% 19.2%
Proportion of low income households
in 2016 (Less than $650 per week)
21.0% 18.3%
Suburb with the highest proportion of
low income households in 2016
Heathcote &
District:
30.8%
--
Suburb with the lowest proportion of
low income households in 2016
Strathfieldsaye:
6.8%
--
Proportion of households living in
rented social housing in 2016
3.9% 2.8%
Household Forecasts
2036 (Estimated
Residential Population)6
Projected proportion of Couple
households with children under 15 in
2036
27.5% --
Projected proportion of Single parent
households with children under 15 in
2036
10.2% --
Suburb projected to have the highest
proportion of Couple households with
children under 15
Maiden Gully:
44.6%
--
Suburb projected to have the highest
proportion of Single parent households
with children under 15
Long Gully –
West Bendigo -
Ironbark:
16.0%
--
5 City of Greater Dandenong, Statistical Data for Victorian Communities, City of Greater Bendigo, 2011:
http://www.greaterdandenong.com/document/18464/statistical-data-for-victorian-communities 6 Forecast id, City of Greater Bendigo, Population Forecasts, 2017: http://forecast.id.com.au/bendigo

13
Category Indicator CoGB
Measure
Vic
Measure
Early Years Profile
Early Years Population (ABS
2011 & 2016 Census – Usual
Residents)7
Population of 0 to 9 year olds 14,385 756,981
0 to 9 year olds as a percentage of
population
6.5% 6.3%
Change in population of 0 to 9
years olds as a percentage from
2011 to 2016
+9.4% increase +10.6%
increase
Average annual growth rate of 0 to 9 year olds from 2011 to 2016
+1.9% per annum +2.1% per annum
Population of 0 to 4 year olds 7,075 385,310
0 to 4 year olds as a percentage of
population
6.4% 6.3%
Population of 5 to 9 year olds 7,310 371,671
5 to 9 year olds as a percentage of
population
6.6% 6.2%
Proportion of 0 to 9 year olds with
Aboriginal and Torres Strait
Islander heritage8
3.5% -
Proportion of 0 to 9 year olds who
require assistance with core
activities – insert into report
6.1% 5.0%
Proportion of 0 to 4 born overseas
in 2016
1.1% 1.0%
Proportion of 0 to 4 from non-
English speaking background in
2016
1.1% 0.8%
Proportion of 5 to 11 born overseas
in 2016
3.8% 3.8%
Proportion of 5 to 11 from non-
English speaking background in
4.5% 4.9%
7 Atlas id, City of Greater Bendigo Social Atlas, ABS Census of Population & Housing, 2011 & 2016: http://atlas.id.com.au/bendigo
and Profile Id, City of Greater Bendigo Community Profile, ABS Census of Population & Housing, 2011 & 2016: http://profile.id.com.au/bendigo and Department of Environment, Land, Water and Planning, Victoria in the Future 2016, Major Regions ERP Five Year Age Groups and Sex 2011 to 2051: https://www.planning.vic.gov.au/land-use-and-population-research/victoria-in-future-2016/victoria-in-future-data-tables 8 ABS, Census of Population and Housing, Greater Bendigo, Community Profile, 2016:
http://www.censusdata.abs.gov.au/census_services/getproduct/census/2016/communityprofile/LGA22620?opendocument

14
Category Indicator CoGB
Measure
Vic
Measure
2011
Suburb with the highest proportion
of 0 to 4 year olds in 2016
Epsom /Ascot:
9.8%
--
Suburb with the lowest proportion
of 0 to 4 year olds in 2016
Heathcote &
District:
3.2%
--
Suburb with the largest growth in 0
to 4 year olds between 2011 and
2016
Huntly:
+120.5% increase
--
Suburb with the least growth in 0 to
4 year olds between 2011 and 2016
Heathcote &
District:
-24.9% decrease
--
Suburb with the highest proportion
of 5 to 11 year olds in 2016
Maiden Gully:
13.3%
--
Suburb with the lowest proportion
of 5 to 11 year olds in 2016
Bendigo:
6.2%
--
Suburb with the largest growth in 5
to 11 year olds between 2011 and
2016
Huntly:
+89.9% increase
--
Suburb with the least growth in 5 to
11 year olds between 2011 and
2016
Bendigo:
-25.5% decrease
--
Early Years 0 to 9 years
Population Forecasts 2036
(Estimated Residential
Population)9
Projected population 0 to 9 in 2036 20,806 969,149
Projected population 0 to 9 year
olds as a percentage of population
in 2036
13.4% 11.7%
Change in 0 to 9 year old
population 2016 to 2036
5,798 increase 212,168 increase
Average annual growth rate between 2016 and 2036
1.4% per annum 1.1% per annum
Suburb projected to have the most
0 to 9 year olds in 2036
Strathfieldsaye:
2,161
--
9 Forecast id, City of Greater Bendigo, Population Forecasts, 2017: http://forecast.id.com.au/bendigo and Department of
Environment, Land, Water and Planning, Victoria in the Future 2016, Major Regions ERP Five Year Age Groups and Sex 2011 to 2051: https://www.planning.vic.gov.au/land-use-and-population-research/victoria-in-future-2016/victoria-in-future-data-tables

15
Category Indicator CoGB
Measure
Vic
Measure
Suburb projected to have the
fewest 0 to 9 year olds in 2036
East Bendigo:
321
--
Suburb projected to have the most
growth of 0 to 9 year olds by 2036
Huntly:
143.7% increase
--
Suburb projected to have the least
growth of 0 to 9 year olds by 2036
Long Gully/West
Bendigo/Ironbark:
-24.6% decrease
--
Health & Wellbeing
Average annual proportion of
babies born with low birth weight
2012 to 201410
6.7% 6.3%
Average annual infant death rate
2011 to 2015 (per 1,000)
4.3 per 1,000
births
2.9 per 1,000
births
Proportion of infants breastfed at 3
months of age in 201511
44.1% 51.4%
Proportion of infants breastfed at 6
months of age in 201512
31.5% 34.0%
Proportion of infants aged 0 - 1
years who received a home visit by
a maternal and child health nurse in
201713
99.5% 100%
Proportion of children attending the
3.5 year ages and stages visit in
201714
73.4% 62.9%
Proportion of children fully
immunised in the first year of age in
201515
92.3% 91.2%
Proportion of children fully
immunised in the second year of
age in 201516
90.7% 89.6%
Proportion of children fully
immunised in the fifth year of age
95.4% 92.6%
10
Public Health Information Development Unit (PHIDU), Social Health Atlases of Australia, LGAs, City of Greater Bendigo, 2014: http://www.phidu.torrens.edu.au/social-health-atlases/data 11
Victorian Child and Adolescent Monitoring System (VCAMS), City of Greater Bendigo, 2015: http://www.education.vic.gov.au/about/research/Pages/vcamsindicator.aspx 12
VCAMS 2015 13
VCAMS 2017 14
VCAMS 2017 15
PHIDU 2015 16
PHIDU 2015

16
Category Indicator CoGB
Measure
Vic
Measure
in 201517
Proportion of Aboriginal & Torres Strait Islander children fully immunised in the fifth year of age in 2015
18
88.0% 96.8%
Proportion of children (aged 3 to 17
years) meeting fruit dietary
guidelines in 201419
57.8% --
Proportion of children (aged 3 to 17
years) meeting vegetable dietary
guidelines in 201420
7.6% --
Proportion of children (aged 3 to 17 years) exercising daily for at least 30 minutes
21
38.5% --
Rate of substantiated child abuse
per 1,000 children (aged 0 to 17
years) in 201122
10.1 per 1,000
persons
6.7 per 1,000
persons
School Entrant Health
Questionnaire 201723
Proportion of children reported
being in excellent or very good
health in 2017
83.9% 85.3%
Proportion of children reported
being overweight in 2014
1.9% 2.2%
Proportion of children reported to
have allergies in 2017
9.3% 9.2%
Proportion of children reported to
have been told by a doctor they
have asthma
14.6% 12.2%
Proportion of parents concerned
about their child's oral health (e.g.,
teeth, gums etc.) in 2017
15.9% 14.0%
Proportion of children reported to
have difficulties with speech and/or
15.1% 14.1%
17
PHIDU 2014 18
https://beta.health.gov.au/health-topics/immunisation/childhood-immunisation-coverage/current-coverage-data-tables-for-aboriginal-and-torres-strait-islander-children 19
City of Greater Bendigo, Active Living Census 2014: http://www.bendigo.vic.gov.au/sites/default/files/2016-12/Active%20Living%20Census%20Topline%20Report.pdf 20
CoGB, Active Living Census 2014 21
CoGB, Active Living Census 2014 22
VCAMS 2011 23
Education Department, Victorian Government, School Entrant Health Questionnaire 2014 LGA Greater Bendigo 2014: http://www.education.vic.gov.au/about/research/Pages/reportdatahealth.aspx

17
Category Indicator CoGB
Measure
Vic
Measure
language in 2017
The proportion of parents
concerned about the behaviour of
their child in 2017
15.1% 12.6%
Proportion of children at high risk of
developmental or behavioural
problems in 2014
14.9% 15.5%
The proportion of children at
moderate risk of developmental or
behavioural problems in 2017
28.3% 28.6%
Australian Early
Development Census
Domains 201524
Proportion of children vulnerable on
the domain of Physical Health and
Wellbeing in 2018
8.8% 7.9%
Proportion of children vulnerable on
the domain of Social Competence
in 2018
8.9% 8.7%
Proportion of children vulnerable on
the domain of Emotional Maturity in
2018
9.6% 8.0%
Proportion of children vulnerable on
the domain of Language and
Cognitive Skills (school-based) in
2018
7.2% 6.3%
Proportion of children vulnerable on
the domain of Communication skills
and General Knowledge in 2018
7.9% 7.6%
Proportion of children vulnerable on
one or more domains(s) in 2018
20.8% 19.9%
Proportion of children vulnerable on
two or more domains in 2018
11.8% 9.9%
Change in proportion of children
vulnerable on one or more
domains(s) between 2015 and
2018
1.6% increase 0.4% increase
Change in proportion of children
vulnerable on two or more domains
between 2015 and 2018
2% increase 0.4% increase
24
Australian Early Development Census, 2018 - https://www.aedc.gov.au/data/data-explorer

18
Category Indicator CoGB
Measure
Vic
Measure
Suburb with the highest proportion
of children vulnerable on one or
more domains(s) in 2018
Flora Hill: 37.1% --
Suburb with the highest proportion
of children vulnerable on two or
more domains in 2018
Long Gully/West
Bendigo/Ironbark:
27.3%
--
Suburb with the lowest proportion
of children vulnerable on one or
more domains(s) in 2018
Elmore/
Goornong: 4.5%
--
Suburb with the lowest proportion
of children vulnerable on two or
more domains in 2018
Elmore/
Goornong: 0%
Huntly &
surrounds: 0%
--
Education & Care
Kindergarten participation in the
first year of enrolments25
97.6% 93.4%
Proportion of 5 to 11 year olds
attending primary school in 201626
82.9% 83.6%
Proportion of year 3 students who met or exceeded the benchmark for literacy in 2017
27
93.9% 95.8%
Proportion of year 3 students who met or exceeded the benchmark for numeracy in 2017
28
94.7% 96%
25
VCAMS 2017 26
Profile Id, City of Greater Bendigo Community Profile, ABS Census of Population & Housing, 2016:
http://profile.id.com.au/bendigo 27
VCAMS 2017 28
VCAMS 2017

19
People aged 0 to 11 years, 2016 City of Greater Bendigo - Usual residence
Area Number
Total population
Percent %
Bendigo 619 5,534 11.2
Eaglehawk - Eaglehawk North - Sailors Gully 990 6,412 15.4
East Bendigo 234 2,153 10.8
Elmore - Rural North 512 3,464 14.8
Epsom - Ascot 1,239 6,153 20.1
Flora Hill - Quarry Hill - Spring Gully - Golden Gully
1,343 9,487 14.2
Golden Square 1,272 8,864 14.3
Heathcote and District 396 3,929 10.1
Huntly 518 2,478 20.9
Kangaroo Flat - Big Hill 1,490 10,582 14.1
Kennington 719 5,668 12.7
Long Gully - West Bendigo - Ironbark 725 4,870 14.9
Maiden Gully 1,099 5,057 21.7
Marong - Rural West 803 4,508 17.8
North Bendigo - California Gully 1,234 8,457 14.6
Rural East 1,320 7,613 17.3
Strathdale 745 5,706 13.1
Strathfieldsaye 1,157 5,424 21.3
White Hills - Jackass Flat 766 4,320 17.7
Urban Bendigo 14,205 91,060 15.6
Rural Bendigo 2,976 19,617 15.2
Study Area - Kamarooka, Hunter and Drummartin
49 355 13.8
City of Greater Bendigo 17,116 110,469 15.5
Regional VIC 208,478 1,433,824 14.5
Bendigo SA4 24,411 162,106 15.1
Greater Melbourne 670,084 4,485,217 14.9
Victoria 879,225 5,926,637 14.8
Australia 3,539,502 23,401,878 15.1
Source: Australian Bureau of Statistics, Census of Population and Housing 2016. Compiled and presented in atlas.id by .id , the population experts.
https://home.id.com.au

20
Sources
Atlas id, City of Greater Bendigo Social Atlas, 2016: http://atlas.id.com.au/bendigo
Australian Bureau of Statistics, Census of Population and Housing, Greater Bendigo, 2016:
http://www.censusdata.abs.gov.au/census_services/getproduct/census/2016/communitypro
file/LGA22620?opendocument
Australia Bureau of Statistics, Census of Population and Housing 2016, Cat 2071.0, Stories
from the Census 2016, Aboriginal and Torres Strait islander Population:
http://www.abs.gov.au/ausstats/[email protected]/Lookup/by%20Subject/2071.0~2016~Main%20F
eatures~Aboriginal%20and%20Torres%20Strait%20Islander%20Population%20Data%20S
ummary~10
Australian Early Development Census, Greater Bendigo Community Profile, 2018:
https://www.aedc.gov.au/ClientData/CommunityProfiles/20025.pdf
Australian Early Development Census, National Report, 2018:
https://www.aedc.gov.au/data/data-explorer
City of Greater Bendigo, Active Living Census 2014:
http://www.bendigo.vic.gov.au/sites/default/files/2016-
12/Active%20Living%20Census%20Topline%20Report.pdf
City of Greater Dandenong, Statistical Data for Victorian Communities, City of Greater
Bendigo, 2016: http://www.greaterdandenong.com/document/18464/statistical-data-for-
victorian-communities
Department of Education, Victorian Government, School Entrant Health Questionnaire
2017 LGA City of Greater Bendigo 2017:
http://www.education.vic.gov.au/about/research/Pages/reportdatahealth.aspx
Department of Environment, Land, Water and Planning, Victorian Government, Victoria in
the Future 2016, Major Regions ERP Five Year Age Groups and Sex 2011 to 2051:
https://www.planning.vic.gov.au/land-use-and-population-research/victoria-in-future-
2016/victoria-in-future-data-tables
Forecast id, Greater Bendigo Population Forecast, 2017: http://forecast.id.com.au/bendigo
Profile id, City of Greater Bendigo, Community Profile, 2016:
http://profile.id.com.au/bendigo
Public Health Information Development Unit (PHIDU), Social Health Atlases of Australia,
LGAs, City of Greater Bendigo, 2014: http://www.phidu.torrens.edu.au/social-health-
atlases/data
Victorian Child and Adolescent Monitoring System (VCAMS), Victorian Government, City of
Greater Bendigo, 2011, 2015 & 2017:
http://www.education.vic.gov.au/about/research/Pages/vcamsindicator.aspx