
Case Studies in PQ Monitoring - Home - IEEE Power and ... · Case Studies in PQ Monitoring ... •...
19
Case Studies in PQ Monitoring Panel on PQ Monitoring in the Era of the Smart Grid 14PESGM2766 1 Jan Meyer Etienne Gasch Matthias Klatt Technische Universitaet Dresden, Germany
Transcript of Case Studies in PQ Monitoring - Home - IEEE Power and ... · Case Studies in PQ Monitoring ... •...

Case Studies in PQ Monitoring
Panel on PQ Monitoring in the Era of the Smart Grid
14PESGM2766
1
Jan MeyerEtienne GaschMatthias Klatt
Technische Universitaet Dresden, Germany

2
Agenda
• Objectives of Power Quality monitoring
• Case study I − Troubleshooting a HF disturbance
• Case study II− Benchmarking of MV distribution network

3
(1) Compliance verification− Assessment of compliance with EN 50160
(2) Performance analysis− Statistical survey of PQ levels in MV grids
(3) Site characterisation− Answering pre-connection questions of a customer regarding PQ
(4) Troubleshooting− Analysis of high voltage harmonics caused by resonances
(5) Advanced applications and studies− Analysis of prevailing current harmonic phase angle
(6) Active power quality management− Measurements to control voltage regulated distribution
transformer
Major monitoring objectives and examples

4
Agenda
• Objectives of Power Quality monitoring
• Case study I − Troubleshooting a HF disturbance
• Case study II− Benchmarking of MV distribution network

5
Network configuration and complaints• Small town (7000 inhabitants), urban LV grid
• Sudden occurrence of customer complaints:- Coffeemaker grinds coffee, throws it away, lets out water (I)- Professional hair dryer turns itself on and off (40x / day) (II)- CNC mill control malfunction (III)
• Complaints limited to a small area
• Measurement sites:a) LV bus barb) CNC mill POCc) Junction box

6
First troubleshooting measurement
Spectrum during the day(time of complaints) Time-dependency
• Measurements according to EN 50160 does not exceed any limits• Measurements with instrument with extended frequency range
identifies high HF emission level at 8kHz• Levels exist only on working days between 6am and 10pm
-> Origin of disturbance most likely an industrial customer • Easy identification by interviewing
-> Cause: New AFC without EMC filter at location III

7
Measurements at feeder end (8 kHz)
A. Initial situation• Without filter• Levels of up to
5 V at 8 kHz
B. Mitigation measure 1• Generic filter• Significant reduction
to levels below 1 V
C. Mitigation measure 2• Specific filter• Further reduction
to levels below 0,6V
A B C

8
Measurements at different locations (8 kHz)
Mitigation measure 1(Generic filter)
• Virtually no distortion level at LV busbar (a)
• Higher levels at feeder end (c)
• Highest levels at connection point of CNC mill (b)
Local phenomenon, no large propagation
a b cSite

9
Conclusions• Start measurements as close as possible to source of complaints• Measurements according to EN 50160 are usually not suitable to solve
customer complaints• The frequency range of “traditional” PQ monitors may not be sufficient to
identify a problem• Inspect data both in frequency domain and time domain
• Consider limitations of sensors and monitoring device (cf. IEC 61869-103)
35kV20kV10kV
Ratio
error
in
%ε
→V
Frequency in kHz →
Frequency response of voltage transformers
Signal dynamic of current measurement using Rogowski coils

10
Agenda
• Objectives of Power Quality monitoring
• Case study I − Troubleshooting a HF disturbance
• Case study II− Benchmarking of MV distribution network

11
Network operator has to replace energy meters in it‘sMV grid
New meter type has optional PQ-functionality at lowadditional costs (no IEC 61000-4-30 compliantimplementation)
Large data amounts expected Development of index set for PQ assessment
Initial situation and system concept
Primary objectives: Quantification of remaining Power Quality
reserve acc. to the relevant standards Flexible and intuitive reporting for
multiple sites
Secondary objectives: Assessment of behavior in non-covered
region above 95-%-percentile Identification of long-term trends Quantification of variations of time
(e.g. seasonal)

Tim
e
12
Concept of quality index (QI)
Each cube representsa single quality indexbased on weekly 95-
%-percentileaccording to EN
50160.
• Normalized for comparison, flexible to aggregate in multiple levels, easy to understand, direct representation of minimum remaining quality reserve
Example:Measured: 2.5 %Limit: 5 %Index: 50 %

13
Design of the monitoring system
Data set for example analysis:• 22 sites for 25 weeks• Calculation of single quality indices acc. to EN 50160• Exluding 50 site indices (maintanance work, to less data available, ...)
System layout:
Met
erin
g in
fras
truc
ture

14
Top level analyses
Distribution of individual indizes with benchmarked site
c.d.
f.
Trends

15
Aggregation according to PQ parameter
5 10 15 20
37
42
47
52
37
42
47
52
37
42
Messort →
Kal
ende
rwoc
he →
0.2
0.25
0.3
0.35
0.4
0.45
0.5
0.55
0.6
0.65
Tim
eCal
enda
r w
eek

16
Graphical presentation in stylized (fixed) schema• Qualitative representation of quality reserve by color code
(green: > 50%; yellow <50% and > 0%; red < 0%)
• Flexible aggregation for custom-defined regions
Power Quality status of a MV distribution network (120 monitors)
17
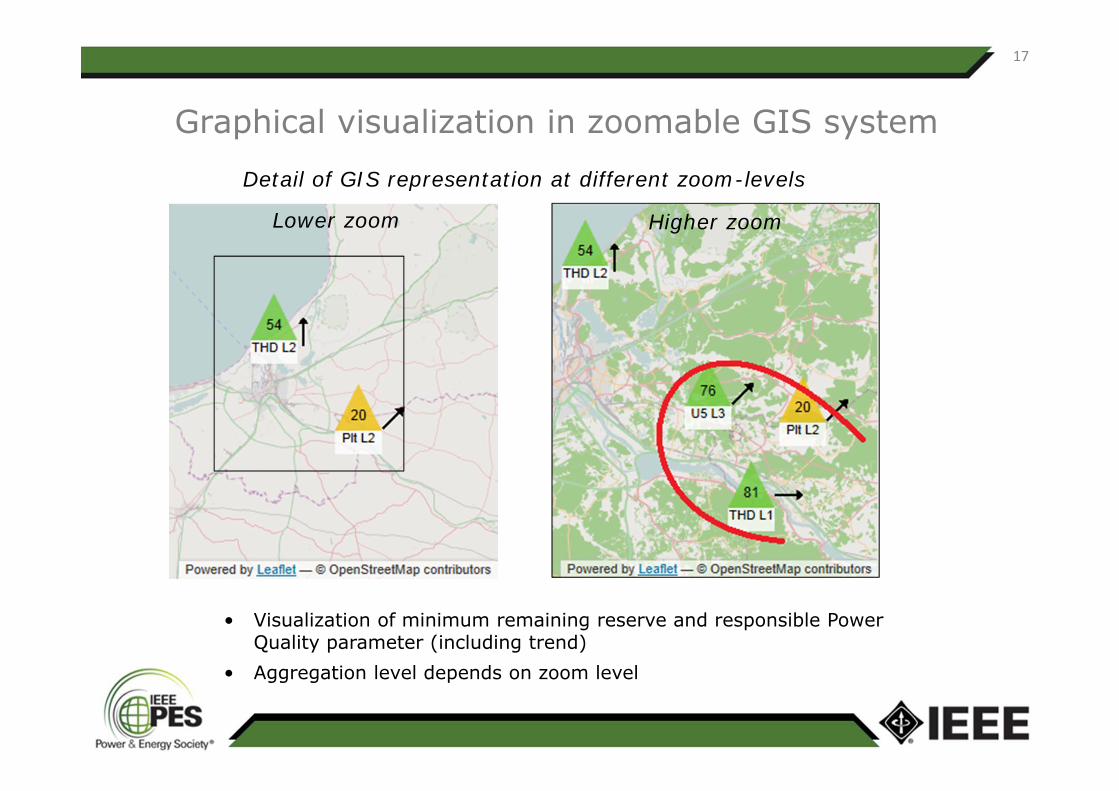
Graphical visualization in zoomable GIS system
• Visualization of minimum remaining reserve and responsible Power Quality parameter (including trend)
• Aggregation level depends on zoom level
Detail of GIS representation at different zoom-levels
Lower zoom Higher zoom

18
Conclusions• Integrating Power Quality functionality into other devices (like meters)
can be an affordable alternative to dedicated PQ monitors(Take care for correct IEC 61000-4-30 implementation)
• Too large data amounts should be treated in distributed way(e.g. one index per week transferred to a central system
• Selected sites have to cover the required population(e.g. measuring only LV busbars does not represent the Power Quality in the whole LV grid)
• Consequent use of „Web features“ (Top-Down-approach) together withpowerful search options improves efficiency of data analysis(only PDF reports are not sufficient)

19
Thank you for your attention !
Contact details:Jan MeyerTechnische Universität DresdenInstitute of Electrical Power Systems andHigh Voltage Engenieering01062 Dresden
tel. +49-351-463 35102fax. +49-351-463 37036
email: [email protected]