‘Building on our strengths’ Towards a more biologically...
44
South Australian IMOS ‘Building on our strengths’ Towards a more biologically - coloured SAIMOS SAIMOS Science Plan, Five Year Strategy and Beyond 2009-2013 Overview: IMOS Node: Southern Australian Integrated Marine Observing System Lead Institution: SARDI Aquatic Sciences/Flinders University Node Leader: A/Prof John Middleton, SARDI/Flinders University, 08 8207 5449/040 222 6490; [email protected] Deputy Node Leaders: Dr. Sophie Leterme, SARDI/Flinders University, 08 8201 5184; [email protected] A/Prof Laurent Seuront, Flinders University, [email protected] Collaborating Institutions: Marine and Freshwater Fisheries Research Institute Australian Fisheries Management Authority; S.A. Dept. Environment and Natural Resources; Primary Industry Resources S.A., Australian National University; Deakin University; University of Macquarie, University of Tasmania; CSIRO, Dept. Environment, Water, Heritage and the Arts, Curtin University Contributing authors: John Middleton, Sophie Leterme, Simon Goldsworthy, Charlie Huveneers, Laurent Seuront, Rob McCauley, Paul van Ruth, Andrew Levings Edited by: Louise Renfrey, SAIMOS Executive Officer G:\Oceanography\SAIMOS\IMOS-2\FINAL SAIMOS2 NODE PLAN\SAIMOS-II plan-FINALAugust2010v2.doc 1
Transcript of ‘Building on our strengths’ Towards a more biologically...
South Australian IMOS
‘Building on our strengths’ Towards a more biologically - coloured SAIMOS
SAIMOS
Science Plan, Five Year Strategy and Beyond 2009-2013
Overview: IMOS Node: Southern Australian Integrated Marine Observing System Lead Institution:
SARDI Aquatic Sciences/Flinders University
Node Leader:
A/Prof John Middleton, SARDI/Flinders University, 08 8207 5449/040 222 6490; [email protected]
Deputy Node Leaders:
Dr. Sophie Leterme, SARDI/Flinders University, 08 8201 5184; [email protected] A/Prof Laurent Seuront, Flinders University, [email protected]
Collaborating Institutions:
Marine and Freshwater Fisheries Research Institute Australian Fisheries Management Authority; S.A. Dept. Environment and Natural Resources; Primary Industry Resources S.A., Australian National University; Deakin University; University of Macquarie, University of Tasmania; CSIRO, Dept. Environment, Water, Heritage and the Arts, Curtin University
Contributing authors: John Middleton, Sophie Leterme, Simon Goldsworthy, Charlie Huveneers, Laurent Seuront, Rob McCauley, Paul van Ruth, Andrew Levings Edited by: Louise Renfrey, SAIMOS Executive Officer
G:\Oceanography\SAIMOS\IMOS-2\FINAL SAIMOS2 NODE PLAN\SAIMOS-II plan-FINALAugust2010v2.doc
1
Table of contents:
Important Acronyms 4
Summary 5
1 Socio-Economic Context 8
2 Scientific Background 9
2.1 Geographical scope of the Node 9
2.2 Climate Variability 9
2.3 Major Boundary Currents 10
2.4 Continental Shelf Processes 11
2.5 Biological response 15
2.6 Research Questions to be addressed by the Node 16
2.7 How will the Nodes activities fit within a national IMOS? 18
3 Pre-existing Observations 19
3.1 Pre-IMOS/SAIMOS Observations 19
3.2 SAIMOS Observations (until October 2009) 19
4 What observations does the Node require and how will they address the research questions? 20
4.1 Physical Oceanography - Boundary Currents, Coastal Shelf Processes 20
4.2 Biological Oceanography - Plankton, Microbes and Carbon Cycling 24
4.3 Biological Oceanography - Apex Predators 26
4.4 Observational Requirements: 29
5 Implementation Plan – July 2009-2013 32
5.1 Kangaroo Island Region 32
5.2 Bonney and Otway Coastal Regions. 35
5.3 Eastern GAB, slope and near oceanic waters to Sub-tropical Front 35
6 Describe how the data will be taken up and used by the Node 36
6.1 Impact and delivery through improved model output 36
6.2 Ensuring the data is used. 37
6.3 Partnering for sustained observing. 39
7 Describe what impact the IMOS observations will have regionally, nationally and internationally: short and long term 40
8 Governance, structure and funding of the Node. 41
G:\Oceanography\SAIMOS\IMOS-2\FINAL SAIMOS2 NODE PLAN\SAIMOS-II plan-FINALAugust2010v2.doc
2

9 References 41
G:\Oceanography\SAIMOS\IMOS-2\FINAL SAIMOS2 NODE PLAN\SAIMOS-II plan-FINALAugust2010v2.doc
3
Important Acronyms AATAMS – Australian Animal Tagging and Monitoring System ACCESS - Australian Community Climate Earth-System Simulator ACORN - Australian Coastal Ocean Radar Network ACW –Australian Circumpolar Wave ANFOG – Australian National Facility for Ocean Gliders Apex Predators – e.g., sea-lions or seals BC – Boundary Current BoM – Bureau of Meteorology CSIRO –Commonwealth Scientific and research Organisation CTW – Coastal Trapped Wave DAFF – Department of Agriculture, Fisheries and Forestry DENR – Department of Environment and Natural Resources (S.A.) DSTO – Defence Science and Technology Organisation EAC – East Australian Current EIF – Education Investment Fund EGAB – Eastern Great Australian Bight FC – Flinders Current FRDC – Fisheries research and Development Corporation GAB – Great Australian Bight HF RADAR – High Frequency Ocean RADAR IMOS – Integrated Marine Observing System LC - Leeuwin Current LUC - Leeuwin Undercurrent MAFFRI – Marine and Freshwater Fisheries Research Institute MAPGAB - monitoring apex predators of the Great Australian Bight MB – Middleton and Bye (2007) NTC – National Tidal Facility OTN – Ocean Tracking Network SAIMOS – Southern Australian Integrated Marine Observing System SARDI – South Australian research and Development Institute TAFI – Tasmanian Aquaculture and Fisheries Institute WAIMOS – West Australian Integrated Marine Observing System
G:\Oceanography\SAIMOS\IMOS-2\FINAL SAIMOS2 NODE PLAN\SAIMOS-II plan-FINALAugust2010v2.doc
4

Summary The SAIMOS five to ten year science and observational plan detailed below has been designed to determine: a) The temporal and spatial variability of both shelf currents and the slope, Flinders
Current, their connectivity to the Southern Ocean, Leeuwin and East Australian Currents and modulation by far-field forcing,
b) How key biological patterns and processes respond to the above-mentioned physical forcing.
SAIMOS research themes
1. Multi‐decadal ocean change
Temperature, Salinity, Carbon, Ph
4. Continental shelf processes
Up/Downwelling, cross‐shelf exchange, coastal currents, particulate
transport
5. Major Boundary CurrentLeeuwin and Flinders Current
2. Climate variabilitySeasonal, Intra‐seasonal,
ENSO, ACW
3. Biological responsesProductivity, abundance, Distribution (pelagic)Nutrients, Microbes,
Plankton,Apex predators
Research themes for SAIMOS
The research themes are summarised above and a plot of the region including place names is given in Fig. 1 below. Schematic plots of the observational platforms for 2009-2013 and beyond are given in Figures 15 and 16, where the implementation of SAIMOS is summarised. The physical observational program will allow for the determination of the dynamics and nature of upwelling for the region, including the role of the Flinders Current, canyons, wind-forcing and ENSO events. Upwelling events are likely to underpin the planktonic ecosystem of the region that now supports a South Australian (S.A.) fishery worth more than $320M annually. We will maintain the assessment of nutrient concentrations and the abundance and community composition of picophytoplankton and phytoplankton communities. All these information will be collated to improve our understanding of the role of nutrient enrichments and the related structure and function of the plankton ecosystem in seeding higher trophic levels, a unique integrated approach at both the national and international levels. An extension includes the use of tagged apex predators that will collect CTD data and provide direct observations at biological hotspots that will enhance the mooring and glider data stream. Passive acoustic moorings will provide indices of residence on the Bonney coast by great whales and fishes. Through AATAMS, curtains of acoustic
G:\Oceanography\SAIMOS\IMOS-2\FINAL SAIMOS2 NODE PLAN\SAIMOS-II plan-FINALAugust2010v2.doc
5
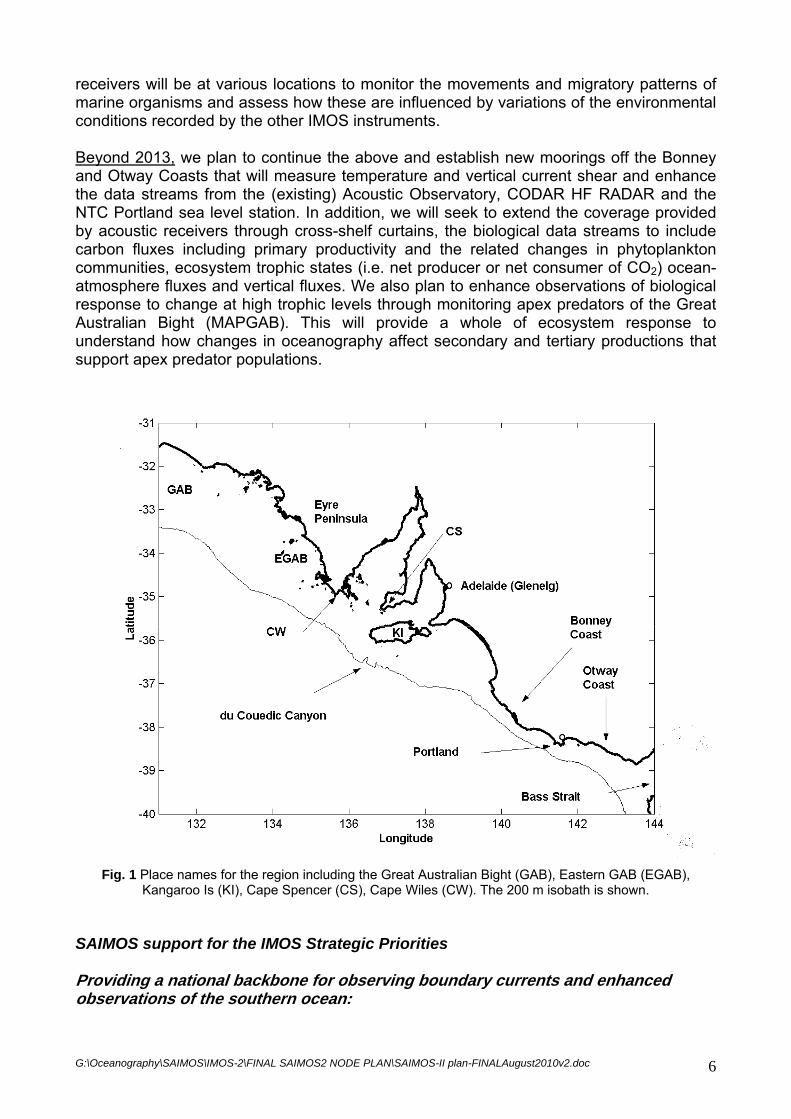
receivers will be at various locations to monitor the movements and migratory patterns of marine organisms and assess how these are influenced by variations of the environmental conditions recorded by the other IMOS instruments. Beyond 2013, we plan to continue the above and establish new moorings off the Bonney and Otway Coasts that will measure temperature and vertical current shear and enhance the data streams from the (existing) Acoustic Observatory, CODAR HF RADAR and the NTC Portland sea level station. In addition, we will seek to extend the coverage provided by acoustic receivers through cross-shelf curtains, the biological data streams to include carbon fluxes including primary productivity and the related changes in phytoplankton communities, ecosystem trophic states (i.e. net producer or net consumer of CO2) ocean-atmosphere fluxes and vertical fluxes. We also plan to enhance observations of biological response to change at high trophic levels through monitoring apex predators of the Great Australian Bight (MAPGAB). This will provide a whole of ecosystem response to understand how changes in oceanography affect secondary and tertiary productions that support apex predator populations.
Fig. 1 Place names for the region including the Great Australian Bight (GAB), Eastern GAB (EGAB),
Kangaroo Is (KI), Cape Spencer (CS), Cape Wiles (CW). The 200 m isobath is shown. SAIMOS support for the IMOS Strategic Priorities Providing a national backbone for observing boundary currents and enhanced observations of the southern ocean:
G:\Oceanography\SAIMOS\IMOS-2\FINAL SAIMOS2 NODE PLAN\SAIMOS-II plan-FINALAugust2010v2.doc
6

Support for the IMOS priorities will be achieved through the data streams derived from the shelf and slope moorings, the National reference station and survey work on the shelf and Bonney Coast and through the use of tagged apex predators and gliders to provide data for the shelf slope and sub-tropical convergence zone. Ongoing development of regional nodes: The enhanced SAIMOS Node plan now includes over 7 different institutions. We are in discussions with DSTO and colleagues at the University of Adelaide so as to grow the Node through development of capability in gliders, HF RADAR and other observing platforms. The tagged apex predator data streams represent a new enhancement. Engagement with Victoria will continue at a modest level through the glider missions and proposed new moorings on the Bonney and Otway coasts. The University of Adelaide, the Department for the Environment and Natural Resources, and CSIRO are also providing additional acoustic receivers to extend the acoustic coverage within the SAIMOS region. Exploring the potential for whole-of-system approaches: The biogeochemical sampling of nutrients and phytoplankton species and abundance will be extended to primary productivity and carbon cycling after 2013 and will be related to the physical processes. Beyond 2013, monitoring apex predators of the Great Australian Bight (MAPGAB) will provide capacity of whole of system approach to assessing the implications of physical and biological changes at lower trophic levels on high trophic levels apex predators. Driving down the cost per observation: Additional sensors (biological and AATAMS) will be deployed on existing moorings and multiple use of water samples made for the production of biological, nutrient and isotope data streams. Glider retrievals will be made during SAIMOS cruises. The use of apex predator CTD data provides a means to sample the marine environment at unsurpassed resolution and spatial scales, add observational power at places and times not possible using existing platforms and at a fraction of the cost. Through data analyses and regional hydrodynamic/biogeochemical modelling, the observational strategies will be modified so as to be sustainable in the long term and to ensure that key drivers of the marine environment are observed while those of a secondary nature are dropped: where possible, the use of cheaper proxies will be examined. Impact and delivery through improved model output: The SAIMOS data streams have led to an additional $2M in funding for research projects – see section 6.1 for more detail. Ensuring data are used: Numerous presentations have been made to the research, government and industry communities on SAIMOS. The data is being used by those active in SAIMOS. The uptake by the broader community is beginning and at present is to be used for bio-fuel microalgae prospecting, acidification studies and desalination site appraisal – see section 6.2 for detail. Partnering for sustained observing: SAIMOS now involves more than 10 different institutions with in-kind support for the mooring program alone at around $2.1M – see section 6.3 for detail.
G:\Oceanography\SAIMOS\IMOS-2\FINAL SAIMOS2 NODE PLAN\SAIMOS-II plan-FINALAugust2010v2.doc
7
1 Socio-Economic Context The estuarine and marine waters of South Australia and western Victoria encompass a vast region and diverse ecosystems including the Lower Lakes and Murray Mouth, S.A.’s unique gulfs, numerous off-shore islands and a large portion of the Great Australian Bight. Southern Australia's coastal, estuarine and marine waters have significant environmental, economic, social, and cultural value to South Australians and Victorians. Southern Australia’s coastline spans approximately 5,000 km (including islands) and varies from cliffs, rocky shores, and sandy beaches in the Otway, South-East and West Coast, to mud flats and mangrove habitats in the upper Gulf St Vincent and Spencer Gulf. The related marine environment extends over 60,000 km2 of State waters and supports a diverse range of habitats including seagrass meadows, benthic sand habitats, sponge gardens and a variety of intertidal and sub tidal reef habitats. Over 100 estuaries which are significant breeding and nursery habitats for a broad range of ecologically diverse species are also found across the State. The regions waters are internationally acknowledged for their unique diversity. They support more than 6,000 invertebrate species, 1,200 algal species, 350 fish species, 16 breeding seabird species, 33 mammal species and 12 seagrass species (Australia’s Biodiversity 1993, Edyvane 1999a, b). In addition, the level of endemism found in South Australian waters is unique, with 75% of the red algae, 85% of the fish species and 95% of seagrasses found nowhere else in the world, giving them local, national and international significance. In comparison, the Great Barrier Reef shares more than 80% of its fish, coral reefs and other marine organisms with other countries in the tropics (Phillips 2001). The uniqueness of South Australia marine waters, together with the increasing environmental threats related to them supporting more than 90% of South Australia population and a range of activities including commercial fishing, aquaculture, shipping, mining, tourism, science, education and a wide range of recreational pursuit, also led the South Australian Government to commit to the development of marine protected areas, including 19 new marine parks by 2010. Finally, the shelf waters off the Kangaroo Island-Eyre Peninsula region in South Australia’s waters, where most of SAIMOS activities will be conducted, support one of Australia’s largest commercial fisheries ($320M yr-1), most diverse marine ecosystems and the greatest density of apex predators such as whales, seals and sharks in Australia. As a conclusion, the development of relevant management, conservation and sustainability strategies requests an in-depth understanding of the nature of ocean circulation in this region, and how ocean circulation impacts the biological patterns and processes that underpin the overall productivity of the ecosystems. National Priorities The sustained observations of physical and biogeochemical systems undertaken by SAIMOS align with a number of national initiatives and priorities. These include: - National Framework for Australian Climate Change Science through a)
measurements of ocean temperature, salinity and acidity in the Southern Ocean (through tagged mammals and moorings) and b) provision of data for the National Climate Change Adaptation Research Facility and DAFF Climate Change Research Programs (see 6.2) and c) ACCESS model verification.
G:\Oceanography\SAIMOS\IMOS-2\FINAL SAIMOS2 NODE PLAN\SAIMOS-II plan-FINALAugust2010v2.doc
8
- National Marine Bioregional Planning (through plankton species identification and demonstration of oceanographic connectivity between the Eastern, Southern and Western shelves)
- Higher education training in marine observing systems.
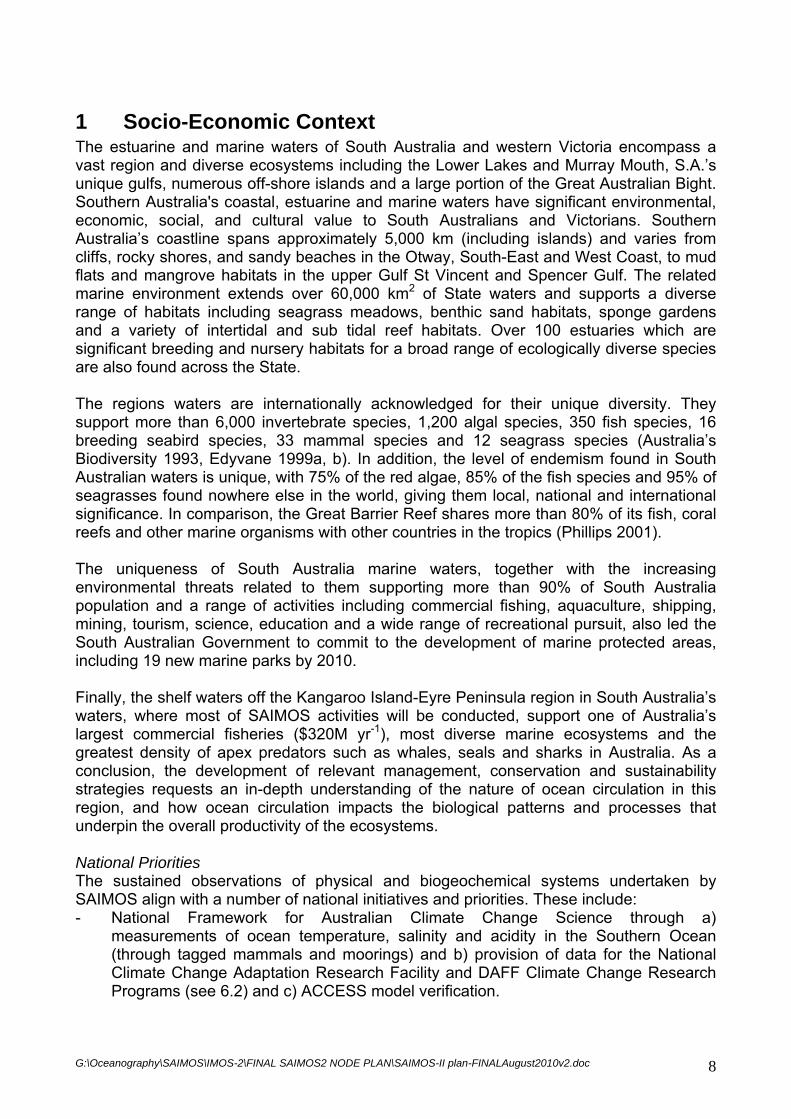
2 Scientific Background 2.1 Geographical scope of the Node Uniquely, the SAIMOS node region lies along the world’s longest zonal, non-polar continental margin. The systems of boundary currents, associated transport of marine biota and ecosystems define its geographical extent to range from Cape Leeuwin in the west to Tasmania in the east. The region is exposed to forcing by the Southern Ocean as well as by oceanic boundary currents that enter from the west and east and that can be modulated by El Nino events in the western Pacific. The oceanography and ecosystems of the region are somewhat similar to eastern boundary currents, where upwelling sustains planktonic systems that support pelagic fish such as sardines. These in turn provide the fundamental food source for higher predators including tuna, sharks, seals and seabirds and whales. Indeed in some ways the offshore extent of SAIMOS might be defined by the foraging habits of New Zealand fur seals that reside along the southern shelves. During winter, these animals travel as far as the sub-tropical front (~ 50o S) to feed. The range of apex predators is enormous as indicated by Fig. 2.
Fig. 2 Distribution of satellite tracks of seven apex predators, Australian sea lions, New Zealand
fur seals, little penguins, short-tailed shearwaters, crested terns, short-finned mako and blue sharks. Image represents over 500 deployments off the South Australian coast.
In the following, we will make extensive reference to the review article by Middleton and Bye (2007), [hereafter MB], that broadly summarises our present knowledge of the ocean circulation of the region and which has identified a number of research questions.
2.2 Climate Variability ENSO Events
G:\Oceanography\SAIMOS\IMOS-2\FINAL SAIMOS2 NODE PLAN\SAIMOS-II plan-FINALAugust2010v2.doc
9
As noted, the ocean currents of the SAIMOS region appear to be influenced by ENSO/El Nino events in the Pacific, whereby a relaxation of equatorial winds drives an eastward flow of deep warm water. The thermocline in the western Pacific is thus raised and this signal propagates around the shelf slope of Papua New Guinea, the west coast of Australia and as far as Cape Otway in Victoria (Clark and Li 2004, Middleton et al 2007; Levings and Gill 2010). It seems most likely that the raised thermocline enhances wind-forced upwelling and reduces wintertime (poleward) shelf currents along Australia’s west and southern shelves: the impact on boundary currents are discussed further below. Wind Fields Climate related changes of winds in the Pacific, Indian Ocean and Southern Ocean may also be important to changes in wind stress curl, Sverdrup transport and changes in the strengths of the boundary currents that impact on those of the SAIMOS Node region. For example, the EAC has strengthened over the last 60 years and this may have led to an increase in the Tasman Outflow and the Flinders Current (Hill et al 2008). – see below; and the future prognosis for climate change for southern Australian waters (CSIRO Global Climatic Model 3.5; Gordon et al. 2002) includes a strengthening of upwelling favourable winds. Other suggested changes include a strengthening of upwelling favourable winds off the S.A. region. The Antarctic Circumpolar Wave An additional form of large scale forcing involves the Antarctic Circumpolar Wave (ACW). This wave, postulated to result from an interaction of the oceanic and atmospheric boundary layers, has a four year period and amplitude of 0.5 oC off South Australia (White and Peterson 1996). The impact of this wave on shelf and slope circulation is not known.
2.3 Major Boundary Currents The Flinders Current, Leeuwin Current and Tasman Outflow As noted, the slope region of Australia’s southern shelves hosts the Flinders Current (FC) that appears to be fed in the east by the Tasman Outflow, a remnant of the EAC. Further west, the equatorward Sverdrup transport in the Southern Ocean is necessarily turned to the west to reinforce the FC (Middleton and Cirano 2002). Uniquely, the FC is perhaps the only “small sister” to the EAC and other great western boundary currents of the world (MB). Limited data (MB) suggests it extends to depths of 500 m and forms the Leeuwin UnderCurrent (LUC) in the western Great Australian Bight (GAB): details are to be determined. As with the EAC and LUC, the bottom boundary layer of the FC is upwelling favourable so that onshore exchange of nutrients will be enhanced. In common with these other boundary currents, it also flows with the shelf slope on the right, so that upwelling through canyons can also occur. During winter, the LC enters the GAB as a shelf current and extends as far as the Eyre Peninsula (Cirano and Middleton 2004). To the south east, the mean winter winds extend this shelf BC into Bass Strait and also along the west coast of Tasmania (where it is known as the Zeehan Current). Evidence suggests that the shelf currents during winter and LC off Perth, are both modulated by 4 to 7 year ENSO events that can affect the alongshore transport of marine biota (eg., W.A. Salmon, Rock Lobster; MB) from Cape Leeuwin to S.A., although this has yet to be quantified. During summer El Nino events, the thermocline is also raised off in the west Pacific and also off S.A. by up to 100 m so that colder more nutrient rich water is available to the shelf ecosystems: the opposite to that found off Peru.
G:\Oceanography\SAIMOS\IMOS-2\FINAL SAIMOS2 NODE PLAN\SAIMOS-II plan-FINALAugust2010v2.doc 10

The boundary currents may are also subject to the Antarctic Circumpolar Wave with temperature changes along Australia’s southern shelves of up to 1 oC. This wave propagates around the Antarctic with a period of 4 years, may be tied to the ENSO cycle (Middleton et al 2007), although its impact on boundary circulation is unknown. Eddy Processes in Boundary Currents Recent evidence for quasi-stationary, 70km scale eddies along the southern shelves is given in the altimeter analyses of Ridgeway and Condie (2004). For the winter period, a sequence of high pressure eddies is found off the topographic promontories associated with the Eyre Peninsula, Kangaroo Island and the Bonney Coast. Between these high pressure eddies, low pressure eddies are found. Cirano and Middleton (2004) found similar high pressure (low pressure) eddies in their numerical model of the winter circulation and attributed their generation to vortex stretching (squashing).
Fig. 3 The summer time (February 2008) SST for the SAIMOS region. Arrows
denote estimated surface velocities (courtesy David Griffin, CSIRO). During summer, eddies are also found along with a notable (upwelled) surface filament off the Bonney Coast (eg., Fig. 3). For both winter and summer, such high pressure (low pressure) eddies will enhance (retard) the FC. Both the eddies and FC are much weaker than those found off the east and west coast of Australia with amplitudes of order 10 cm/s. Nonetheless, they may be important to localised upwelling through interaction with canyons and other topographic irregularities.
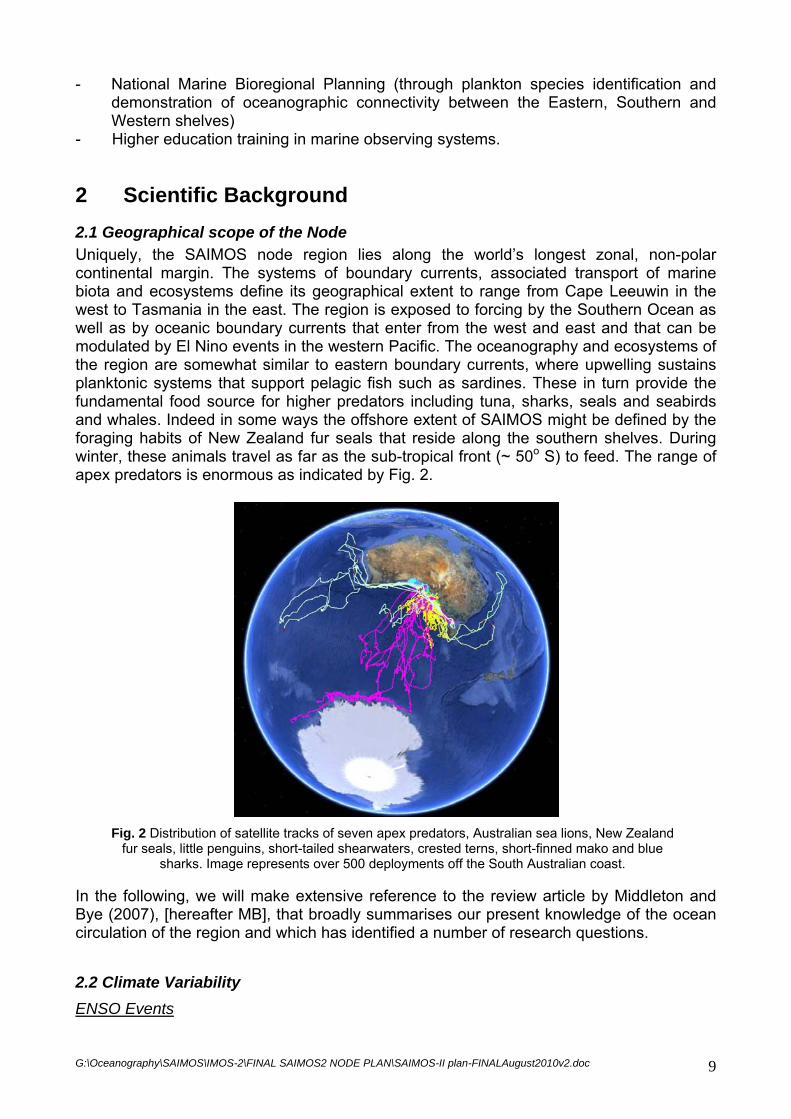
2.4 Continental Shelf Processes Upwelling and downwelling The Kangaroo Island-Eyre Peninsula region hosts one of Australia’s iconic and distinct marine upwelling systems (Kaempf et al. 2004). Both historical and SAIMOS data (Fig. 4) indicate that upwelling originates to the south and south-east of Kangaroo Is, is largely sub-surface and is directed along the 100 m isobath to the north and north-west (Fig. 5). In addition, the results of the numerical simulations (Fig. 6) indicate that the low-frequency weather-band flow (associated with upwelling) is essentially directed along isobaths. These results intrinsically provided the rationale behind the choice of deploying the SAIMOS key reference station in the upwelling plume and on the 100 m isobath (Fig. 7).
G:\Oceanography\SAIMOS\IMOS-2\FINAL SAIMOS2 NODE PLAN\SAIMOS-II plan-FINALAugust2010v2.doc 11
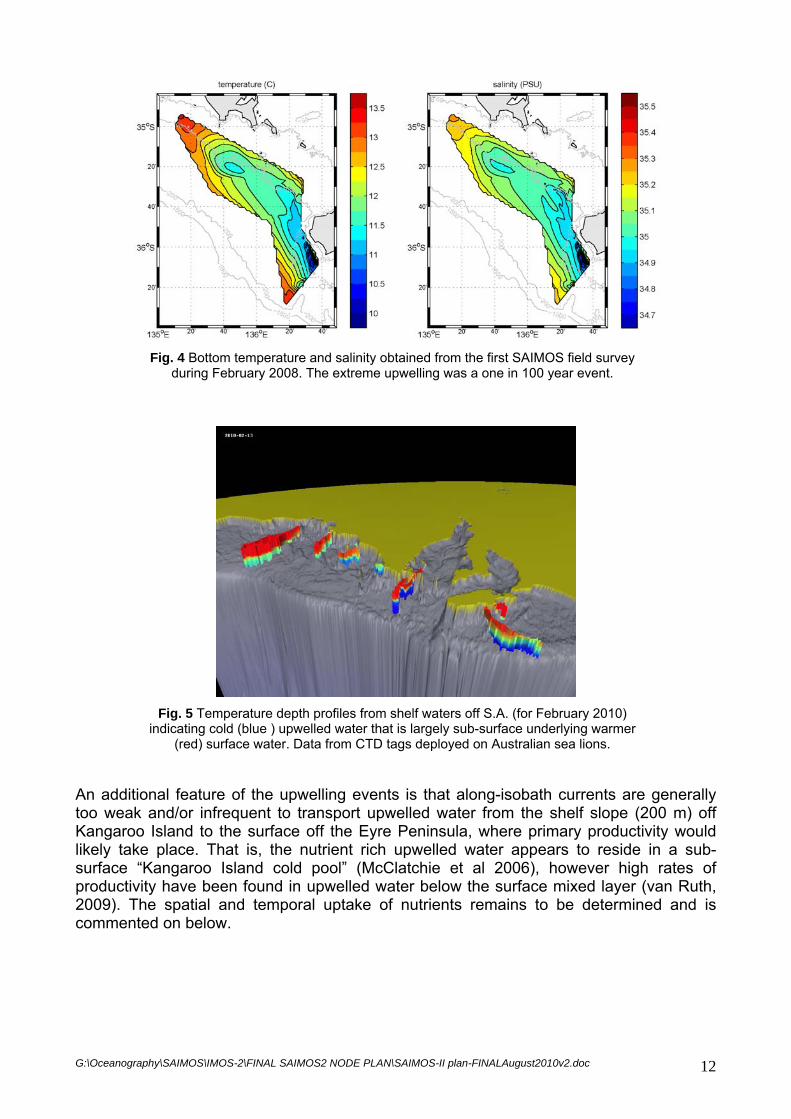
Fig. 4 Bottom temperature and salinity obtained from the first SAIMOS field survey
during February 2008. The extreme upwelling was a one in 100 year event.
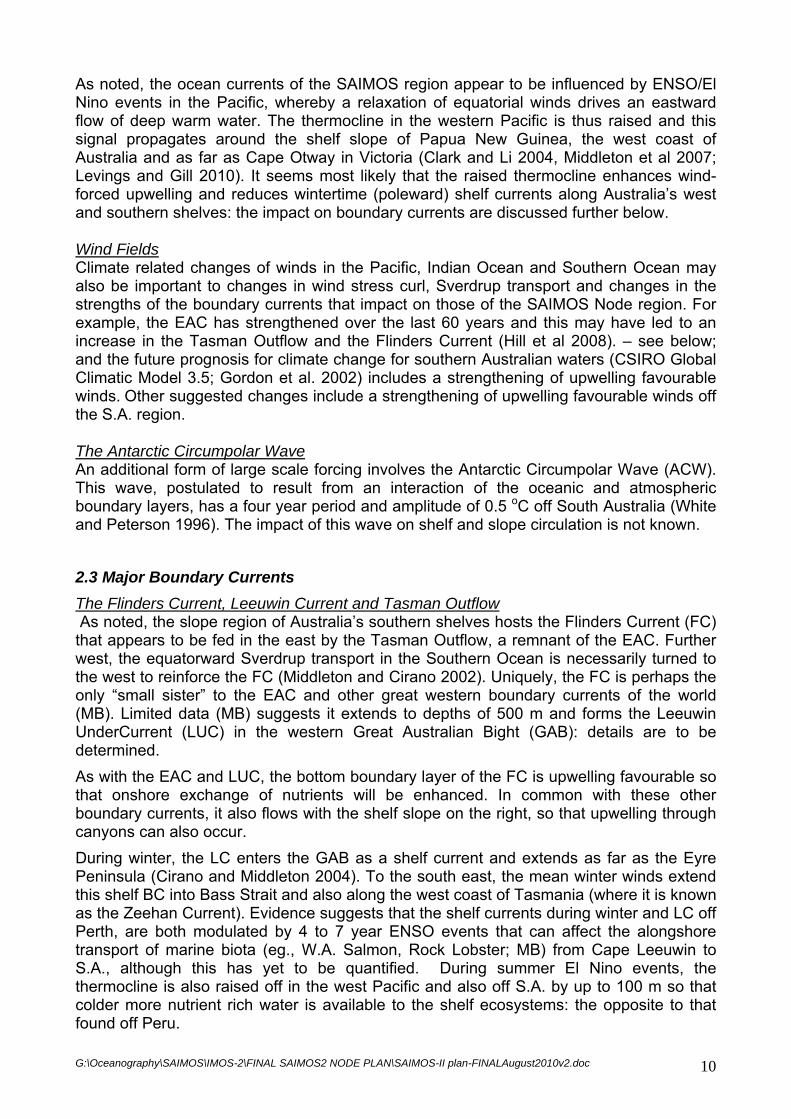
Fig. 5 Temperature depth profiles from shelf waters off S.A. (for February 2010)
indicating cold (blue ) upwelled water that is largely sub-surface underlying warmer (red) surface water. Data from CTD tags deployed on Australian sea lions.
An additional feature of the upwelling events is that along-isobath currents are generally too weak and/or infrequent to transport upwelled water from the shelf slope (200 m) off Kangaroo Island to the surface off the Eyre Peninsula, where primary productivity would likely take place. That is, the nutrient rich upwelled water appears to reside in a sub-surface “Kangaroo Island cold pool” (McClatchie et al 2006), however high rates of productivity have been found in upwelled water below the surface mixed layer (van Ruth, 2009). The spatial and temporal uptake of nutrients remains to be determined and is commented on below.
G:\Oceanography\SAIMOS\IMOS-2\FINAL SAIMOS2 NODE PLAN\SAIMOS-II plan-FINALAugust2010v2.doc 12
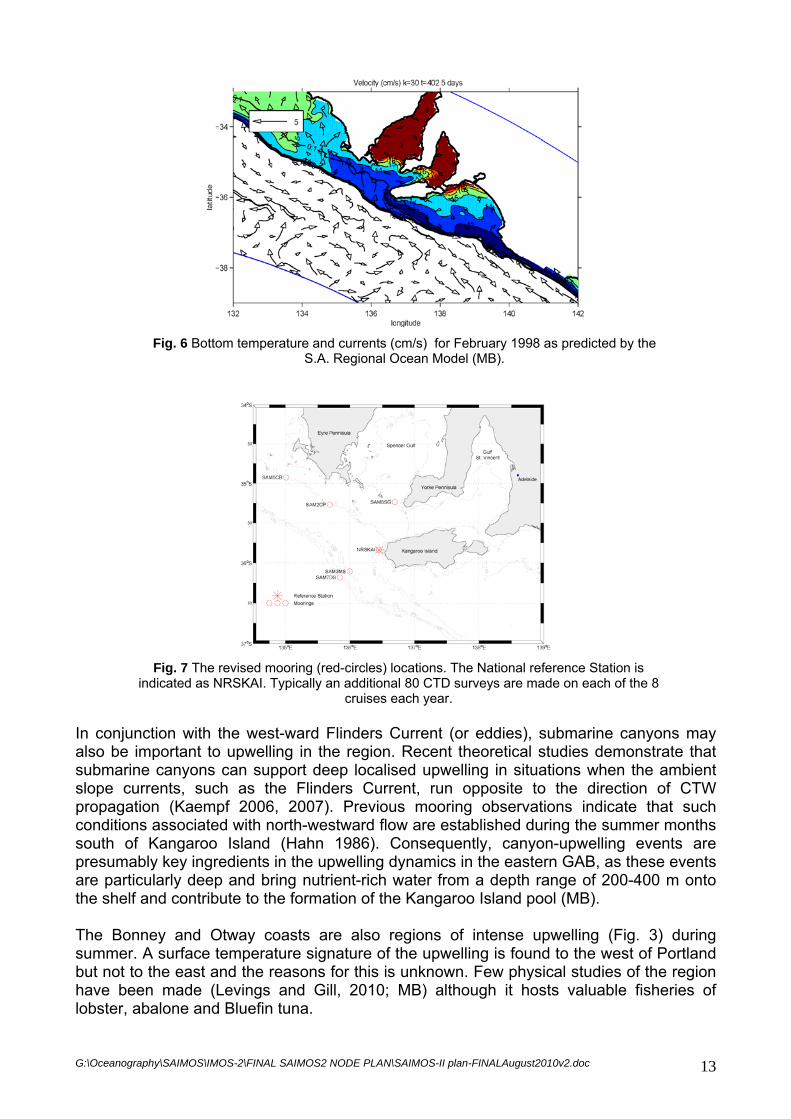
Fig. 6 Bottom temperature and currents (cm/s) for February 1998 as predicted by the
S.A. Regional Ocean Model (MB).
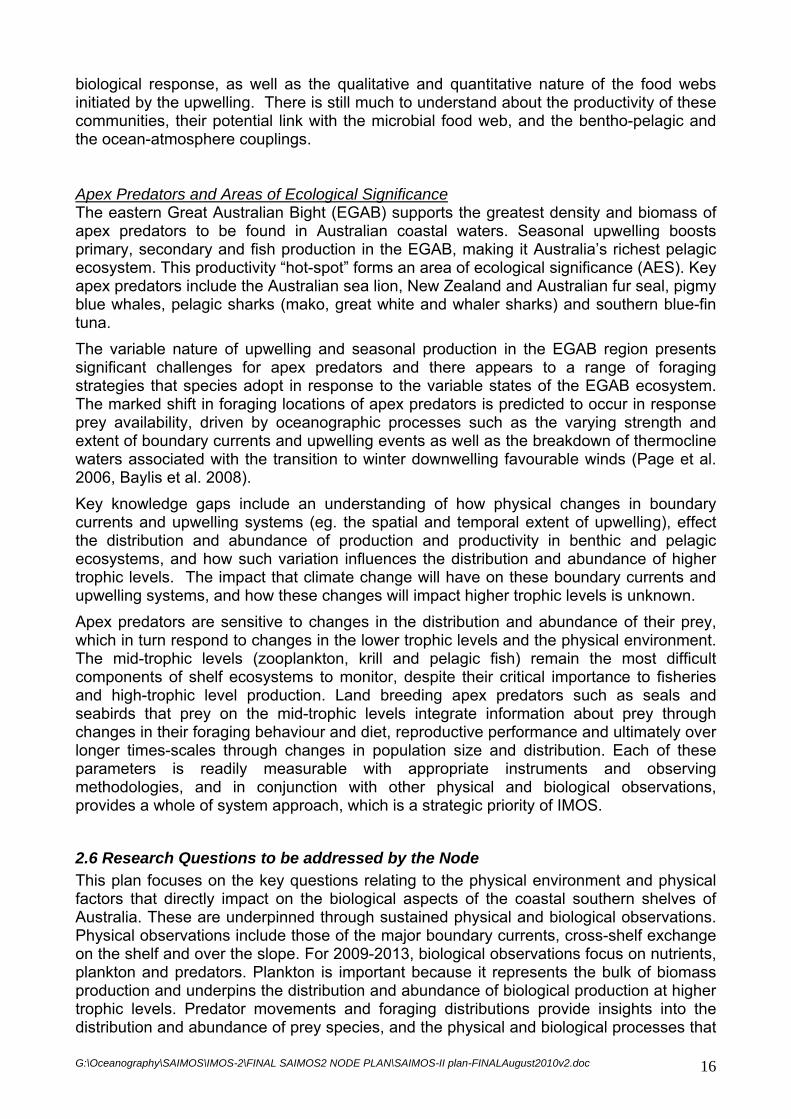
Fig. 7 The revised mooring (red-circles) locations. The National reference Station is
indicated as NRSKAI. Typically an additional 80 CTD surveys are made on each of the 8 cruises each year.
In conjunction with the west-ward Flinders Current (or eddies), submarine canyons may also be important to upwelling in the region. Recent theoretical studies demonstrate that submarine canyons can support deep localised upwelling in situations when the ambient slope currents, such as the Flinders Current, run opposite to the direction of CTW propagation (Kaempf 2006, 2007). Previous mooring observations indicate that such conditions associated with north-westward flow are established during the summer months south of Kangaroo Island (Hahn 1986). Consequently, canyon-upwelling events are presumably key ingredients in the upwelling dynamics in the eastern GAB, as these events are particularly deep and bring nutrient-rich water from a depth range of 200-400 m onto the shelf and contribute to the formation of the Kangaroo Island pool (MB). The Bonney and Otway coasts are also regions of intense upwelling (Fig. 3) during summer. A surface temperature signature of the upwelling is found to the west of Portland but not to the east and the reasons for this is unknown. Few physical studies of the region have been made (Levings and Gill, 2010; MB) although it hosts valuable fisheries of lobster, abalone and Bluefin tuna.
G:\Oceanography\SAIMOS\IMOS-2\FINAL SAIMOS2 NODE PLAN\SAIMOS-II plan-FINALAugust2010v2.doc 13

In winter the winds become downwelling favourable, and in association with coastal cooling, water generally becomes well mixed over the shelf down to depths of 200-300 m (MB). However, it is also known that the cold, salty, dense water formed in Spencer Gulf (Fig. 7) during winter can cascade out onto the shelf. Analyses of SAIMOS data, together with numerical models of the region, show that the density current consists of a sequence of low pressure (salty) and high pressure (fresh) eddies (diameters 20 km) that propagate out onto the shelf. The eddies are in turn formed within the Gulf through a process of geostrophic adjustment and then baroclinic instability (Teixeira 2010). This dense water outflow was confirmed using SAIMOS data collected in the winter of 2008, (Fig. 8). As a consequence, the du Couedic Canyon (Fig. 1) also appears to represent a focal point for the outflow of the dense water. The wintertime flushing of detritus and carbon from Spencer Gulf may be significant to the overall carbon budget for the region. During summer, exchange with the Gulf is minimal so that a strong seasonal signal in carbon fluxes is expected.
Fig. 8 Bottom temperature and salinity obtained from the SAIMOS winter field survey during August 2008.
The cold, salty outflow from Spencer Gulf is evident. Shelf Currents As noted, during winter, the LC enters the GAB as a shelf current and extends as far as the Eyre Peninsula (Cirano and Middleton 2004). To the south east, the mean winter winds extend this shelf BC into Bass Strait and also along the west coast of Tasmania (where it is known as the Zeehan Current). The mean eastward shelf currents are typically 20 cm s-1 during winter and 2-3 times that found in summer, with the latter flowing from east to west. Analyses of the region suggest that the mean shelf currents, upwelling and the Flinders Current are also subject to significant El Niño influences via West Australian shelf-slope currents. Internal and Coastal Trapped Waves (CTWs) The southward facing shelves of the region are also exposed to internal waves and tides that may be important to slope boundary layer mixing and possibly important to the global heat balance. Such internal waves and associated mixing have been found elsewhere (eg., the N.W. shelf, Hawaii) although we know nothing about their importance for Australia’s southern shelves. The shelf currents are also modulated by intense Coastal Trapped Waves (CTWs) that enter the GAB from Cape Leeuwin and by those locally generated by intense storms. These waves have typical velocities of 25 cm s-1 with annual extreme values of up to 50-90 cm s-1. On the shelf, water is advected back and forth along isobaths with periods of 5-20 days, although such waves can be important to cross-shelf exchange. In turn, the
G:\Oceanography\SAIMOS\IMOS-2\FINAL SAIMOS2 NODE PLAN\SAIMOS-II plan-FINALAugust2010v2.doc 14

waves generated along the southern shelves drive CTWs within Bass Strait and on the NSW shelf (Middleton and Black 1994). The CTWs can also be very important to setting the degree of upwelling (Middleton and Leth 2004) through the set-up (or otherwise) of alongshore divergence of the shelf velocity field. Such divergence can “feed” the offshore surface Ekman transport and shut-down upwelling over the slope. The role of CTWs in setting the degree of upwelling off the S.A., Bonney and Otway coasts remains to be determined.
2.5 Biological response Nutrients and Chemistry The Kangaroo Island - Eyre Peninsula region has traditionally been perceived as a region of limited biological activity due to low nutrient availability (Motoda et al., 1978; Young et al., 2001). However, recent evidence for the occurrence of coastal upwelling in summer-autumn characterised by low surface water temperatures and elevated concentrations of chlorophyll a (Kaempf et al., 2004; McClatchie et al., 2006) suggests that during this period, surface waters may be enriched with nutrients and may promote high levels of primary productivity. These upwelling events are unique as they only occur 2 to 4 times a year over periods of 3 to 10 days (MB) and the upwelled waters are transported over large distances (up to 200-400 km over a period of 10 days; MB) through the wide continental shelf which supports one of Australia’s largest commercial fisheries and highly diverse ecosystems, including a variety of whale, dolphin, pinniped and shark species. Plankton Preliminary work conducted by van Ruth (2009) has indicated that during the summer/autumn upwelling season, two distinct water masses can be identified in the shelf waters of the eastern Great Australian Bight (EGAB). A surface layer of warmer, more saline, less dense water with origins in the central Great Australian Bight overlies a bottom layer of colder, less saline, denser water upwelled from off the shelf south of Kangaroo Island. The euphotic depths are also generally 10 to 20 m greater than the depth of the surface mixed layer, suggesting that potentially nutrient rich upwelled water may available to primary producers within the euphotic zone. This also suggests that high levels of primary productivity may be occurring in the waters below the surface mixed layer. Indeed, fluorescence data from CTD depth profiles revealed a deep chlorophyll maximum in the waters below the surface mixed layer. Modelled rates of primary productivity indicate that the contribution of the surface mixed and bottom layers of the euphotic zone to total primary productivity in the EGAB can vary considerably between years. At times, the surface mixed layer accounted for less than 40% of total productivity despite the fact that it made up more than 50% of the euphotic zone. Overall primary productivity in the EGAB was heavily influenced by the presence of the upwelled water mass, but did not appear to require that water mass to reach the surface. High rates of primary productivity appear to be achievable after the first upwelling event which drives the formation of the Kangaroo Island Pool (van Ruth, 2009). Preliminary work conducted on phytoplankton and zooplankton communities has shown that the coastal waters of the eastern Great Australian Bight (EGAB) have a potential productivity that rivals the most productive regions of the ocean. However, productivity levels vary considerably both spatially and temporally, with the highest levels restricted to areas influenced by the upwelling plume, and associated with upwelling events (van Ruth 2009). Variations in primary productivity are implicitly related to variations in meteorology and oceanography in the region, which drive the supply of nutrients to the phytoplankton. In this context it is also critical to understand the lag between an upwelling event and the
G:\Oceanography\SAIMOS\IMOS-2\FINAL SAIMOS2 NODE PLAN\SAIMOS-II plan-FINALAugust2010v2.doc 15
biological response, as well as the qualitative and quantitative nature of the food webs initiated by the upwelling. There is still much to understand about the productivity of these communities, their potential link with the microbial food web, and the bentho-pelagic and the ocean-atmosphere couplings. Apex Predators and Areas of Ecological Significance The eastern Great Australian Bight (EGAB) supports the greatest density and biomass of apex predators to be found in Australian coastal waters. Seasonal upwelling boosts primary, secondary and fish production in the EGAB, making it Australia’s richest pelagic ecosystem. This productivity “hot-spot” forms an area of ecological significance (AES). Key apex predators include the Australian sea lion, New Zealand and Australian fur seal, pigmy blue whales, pelagic sharks (mako, great white and whaler sharks) and southern blue-fin tuna. The variable nature of upwelling and seasonal production in the EGAB region presents significant challenges for apex predators and there appears to a range of foraging strategies that species adopt in response to the variable states of the EGAB ecosystem. The marked shift in foraging locations of apex predators is predicted to occur in response prey availability, driven by oceanographic processes such as the varying strength and extent of boundary currents and upwelling events as well as the breakdown of thermocline waters associated with the transition to winter downwelling favourable winds (Page et al. 2006, Baylis et al. 2008). Key knowledge gaps include an understanding of how physical changes in boundary currents and upwelling systems (eg. the spatial and temporal extent of upwelling), effect the distribution and abundance of production and productivity in benthic and pelagic ecosystems, and how such variation influences the distribution and abundance of higher trophic levels. The impact that climate change will have on these boundary currents and upwelling systems, and how these changes will impact higher trophic levels is unknown. Apex predators are sensitive to changes in the distribution and abundance of their prey, which in turn respond to changes in the lower trophic levels and the physical environment. The mid-trophic levels (zooplankton, krill and pelagic fish) remain the most difficult components of shelf ecosystems to monitor, despite their critical importance to fisheries and high-trophic level production. Land breeding apex predators such as seals and seabirds that prey on the mid-trophic levels integrate information about prey through changes in their foraging behaviour and diet, reproductive performance and ultimately over longer times-scales through changes in population size and distribution. Each of these parameters is readily measurable with appropriate instruments and observing methodologies, and in conjunction with other physical and biological observations, provides a whole of system approach, which is a strategic priority of IMOS.
2.6 Research Questions to be addressed by the Node This plan focuses on the key questions relating to the physical environment and physical factors that directly impact on the biological aspects of the coastal southern shelves of Australia. These are underpinned through sustained physical and biological observations. Physical observations include those of the major boundary currents, cross-shelf exchange on the shelf and over the slope. For 2009-2013, biological observations focus on nutrients, plankton and predators. Plankton is important because it represents the bulk of biomass production and underpins the distribution and abundance of biological production at higher trophic levels. Predator movements and foraging distributions provide insights into the distribution and abundance of prey species, and the physical and biological processes that
G:\Oceanography\SAIMOS\IMOS-2\FINAL SAIMOS2 NODE PLAN\SAIMOS-II plan-FINALAugust2010v2.doc 16
drive their distribution and relative abundance. The key questions of this science plan include: Physical Oceanography – Boundary Currents, Coastal Shelf Processes
2009-13 and beyond - What is the temporal and spatial variability and nature of the FC/LC and coastal
shelf boundary currents including effects of seasonal and ENSO forcing? - Are internal waves significant and are they a source of shelf-slope boundary
mixing? - Is the Antarctic Circumpolar Wave detectable and significant? - What is the connectivity of the boundary currents to those off W.A and the Tasman
Outflow both from a physical viewpoint and from the perspective of the transport of marine biota, pathogens and invasive species?
- What is the temporal and spatial variability and nature of cross-shelf exchange (upwelling and downwelling) including carbon, for the Kangaroo Island – Eyre Peninsula region and what role do canyons, the gulfs and CTWs play?
Beyond 2013 - What is the temporal and spatial variability and nature of cross-shelf exchange
(upwelling and downwelling) for the Bonney and Otway Coastal regions? Biological Oceanography – Plankton, Microbes and Carbon Cycling
2009-13 and beyond - How variations in oceanic nutrient supply (such as through the upwelled Kangaroo
Island cold pool) impact of phytoplankton communities? What roles do canyons and gulfs play as a source of nutrients?
- What is the temporal and spatial variability in phytoplankton communities on the coastal shelf? What is the impact of the FC/LC and coastal shelf boundary currents on these communities?
Beyond 2013 - What are the impact of viral infection and the subsequent lysis of marine microbes
and other organisms? How does this impact the aquatic food web and predators on the coastal shelf?
- How are variations in primary productivity related to variations in oceanic nutrient supply and what are the lags of biological response?
- What are the critical fluxes such as primary productivity and the related changes in phytoplankton communities, ocean-atmosphere fluxes and vertical fluxes?
- What is the temporal and spatial variability in secondary producers (e.g. zooplankton) on the coastal shelf? How this variability impacts on fish communities?
- What is the space-time dynamic of the trophic state of S.A. shelf waters, and do they act as a source or a sink of CO2?
Biological Oceanography - Apex Predators
2009-13 and beyond - What are the key physical oceanographic features that underpin the distribution,
key foraging locations, movements and migratory patterns of apex predators? - How do foraging distributions and movements of different apex predator species
respond to the spatial and temporal variability in boundary currents and upwelling intensity?
- What are the likely physical and biological implications of climate change on the spatial and temporal distribution of benthic and pelagic production, and how will this impact the foraging distributions and movements of apex predator populations?
G:\Oceanography\SAIMOS\IMOS-2\FINAL SAIMOS2 NODE PLAN\SAIMOS-II plan-FINALAugust2010v2.doc 17

- How does exploitation of the Bonney coast upwelling by great whales vary across years? How does visitation of the Bonney coast by pygmy blue whales fit with seasonal migrations along the eastern and western Australian coasts? Can the presence of whales or fish choruses known to occur along the shelf edge, be used as an indicator of productivity or vice/versa?
Beyond 2013 - How does the breeding success and trends in abundance of apex predator
populations respond to the spatial and temporal variability in boundary currents and upwelling intensity?
- What are the likely implications of climate change on the status, distribution and abundance of apex predator populations?
The detailed questions are presented in section 4 along with the observational strategy needed.
2.7 How will the Nodes activities fit within a national IMOS? As noted, the SAIMOS region, and associated boundary currents connect to both the eastern and western shelves as well as the Southern Ocean at weather-band, seasonal and ENSO time scales. The questions regarding the extent and nature of alongshore connectivity will also highlight further the integrated nature of the SAIMOS and WAIMOS regions. In addition, the sustained observations of the planktonic ecosystems and predator populations will provide knowledge of the current climate of these systems and a benchmark against changes that may arise from climate induced changes in alongshore transport and cross-shelf exchange. Notably, the apex predator data will extend well into the Southern Ocean (Fig. 2), a priority area for IMOS. Apex predator CTD data (current) and proposed (beyond) monitoring of apex predators in the GAB (MAPGAB) will compliment the southern seals as oceanographic samplers apex predator monitoring in the Southern Ocean of the Bluewater and Climate Node. At the scale of the Australian continent, the passive acoustic observatories will provide abundance indexes on several (migratory) great whale species allowing seasonal movements, abundance trends and patterns in these to be followed and linked to the physical environment. At the regional scale, the physical data streams will be invaluable to the validation of ocean models such as Bluelink. A further aim of IMOS is to build local capability and capacity. Shaun Byrnes has been employed by Flinders University and SARDI to assist ANFOG and has now developed capability in glider deployments and retrievals so that glider deployments and retrievals can be done during SAIMOS mooring service and field survey missions. This capability will also enable glider data to inform SAIMOS field surveys (and vice versa). Dr David Liebing, (DSTO, Adelaide) has indicated that they wish to see how their glider facility can be developed in an optimal way with ANFOG. Professor Douglas Gray (University of Adelaide) heads the Adelaide Centre for HF RADAR. SAIMOS has encouraged Professor Gray and ACORN to see how they might jointly extend national capability in RADAR.
G:\Oceanography\SAIMOS\IMOS-2\FINAL SAIMOS2 NODE PLAN\SAIMOS-II plan-FINALAugust2010v2.doc 18

3 Pre-existing Observations 3.1 Pre-IMOS/SAIMOS Observations Before IMOS, the only sustained observations for the region were:
- The de Couedic wave-rider buoy (~1992 – present; BoM) - The tide gauge network (~ 1992 – present; Port Lincoln, Adelaide, Victor Harbour
and Portland; NTC; Flinders Ports Corporation) - The SARDI (summer) annual CTD surveys from Kangaroo Island to the head of
the bight -100 shelf repeat stations (1998- present; SARDI).
3.2 SAIMOS Observations (until October 2009) SAIMOS observations that have been obtained so far include:
- Reference Station: The South Australian reference station sampled 11 times; 7 times in 2008 (February, March, April, August, October, November, December) and 4 times so far in 2009 (January, February, March, June). We have now turned over the SAIMOS National Reference Station providing a full year of current and CTD data. Over 52 months of mooring data has been collected without loss.
- Field sampling: Eleven cruises have been successfully conducted; 7 in 2008 (February, March, April, August, October, November, December) and 4 so far in 2009 (January, February, March, June). During each of these cruises, samples were taken to monitor the spatial and temporal dynamics of (i) the physical oceanography of South Australia shelf waters and (ii) the biological oceanography in terms of phytoplankton biomass and community composition, viruses, bacteria, nano- and pico-plankton as well as suspended (organic and inorganic) matter and nutrients (eg., Fig. 6).
- Gliders: Four successful glider missions have been run through ANFOG and Shaun Byrnes (SAIMOS) now has all skills needed for both retrievals and deployments.
- HF RADAR: SAIMOS personal have obtained government permissions for RADAR installations at Cape Wiles and Cape Spencer (February 2009) and have assisted ACORN in these RADAR installations and the CODAR installations for the Bonney Coast.
- Passive Acoustic Observatory: four loggers were deployed SW of Portland on 05- May-2009 in 160 m of water just inside the shelf break, using staff and a vessel out of Portland. The grid was set in a 2 km triangle with one logger in the centre, allowing a source tracking capability. Data is stored aboard the four noise loggers. The grid is due for a turn-around in Jan-2009 whence data will be available, then every ten months until the duration of funding.
- AATAMS: SARDI staff successfully recovered, serviced, and downloaded the ten receivers deployed off Glenelg Beach by AATAMS personnel. Each receiver had recorded at least one white shark with a total of 277 transmissions detected by this line. Interestingly, one white shark swam up and down the line for approximately a month from mid-August to mid-September. The receivers were re-deployed and will be serviced and downloaded again around January–February 2010. Ten CTD tags were deployed on marine predators to provide cross-shelf profiles throughout South Australia.
G:\Oceanography\SAIMOS\IMOS-2\FINAL SAIMOS2 NODE PLAN\SAIMOS-II plan-FINALAugust2010v2.doc 19
4 What observations does the Node require and how will they address the research questions?
The observational strategy below addresses the key research questions noted above and builds on the interdisciplinary surveys begun in February 2008. In the following we restate these research questions followed by the observational strategy needed to answer them. Observational design is addressed and further detailed in section 5 – The Implementation Plan. A summary of the observational equipment requirements to produce the data streams is given at the end of this section. A summary of priority for each data stream is given in Table 1 at the end of this section.
4.1 Physical Oceanography - Boundary Currents, Coastal Shelf Processes
4.1.1 Research questions and observational strategy 2009-2013 and beyond Research Question:
What is the temporal and spatial variability and nature of the FC/LC and coastal shelf boundary currents including effects of seasonal and ENSO forcing?
Observational Strategy: We will increase the number of moorings maintained continuously from two to three (including the reference station). This will involve one additional deep water mooring on the 200 m isobath and located between the NRS and inshore of the deep slope (600 m isobath) mooring (see Fig. 7). These moorings will consist of upward looking ADCPs, CTDs and temperature loggers so as to resolve temporal and cross-shelf variability of the currents. CTD loggers on apex predators will compliment mooring data and expand the geographic distribution of observations. In addition, the data will be supplemented by that from satellites (altimeter and SST) as well as the sea glider rostered for SAIMOS use (Fig. 9): the path shown allows for measurement of both cross- and along slope variability in CTD and fluorescence.
Research Questions:
Are internal waves significant and are they a source of shelf-slope boundary mixing? Observational Strategy:
The significance of internal waves will be determined for the deep shelf slope sites using the ADCP, CTD and temperature logger data through several short (2-3 days) mooring deployments during summer and with sampling intervals at seconds or less. The logger and CTD data collected will provide evidence of the extent of bottom mixing.
Research Questions:
Is the Antarctic Circumpolar Wave detectable and significant? Observational Strategy:
Repeated mooring deployments, temperature measurements, CTD loggers on apex predators and CTD surveys will, over 8 to12 years, allow for the detection of the 4 year period Antarctic Circumpolar Wave, 4 to7 year period ENSO events and determination of the impact on the shelf and slope circulation.
G:\Oceanography\SAIMOS\IMOS-2\FINAL SAIMOS2 NODE PLAN\SAIMOS-II plan-FINALAugust2010v2.doc 20

Research Questions:
What is the connectivity of the boundary currents to those off W.A and the Tasman Outflow both from a physical viewpoint and from the perspective of the transport of marine biota, pathogens and invasive species.
Observational Strategy: Connectivity with the boundary currents off Western Australia will be determined using data from both SAIMOS and WAIMOS: we have agreed with WAIMOS on the need for both deep slope moorings with ADCPs and temperature loggers. Two new deep slope mooring arrays are planned by the Bluewater Node for the southern tip of Tasmania and Leeuwin Current (beyond 2013) and will allow the connectivity of the FC with the Tasman Outflow and Leeuwin Current to be determined.
Research Questions: What is the temporal and spatial variability and nature of cross-shelf exchange (upwelling and downwelling) including carbon, for the Kangaroo Island – Eyre Peninsula region and what role do canyons, the gulfs and CTWs play?
Observational Strategy: The role of canyons in upwelling will be investigated using CTD surveys and the sea glider allocated to SAIMOS (Fig. 9). Both cross- and alongshore variability can be measured with the (repeat) mission path shown. For the Kangaroo Island - Eyre Peninsula region, the slope data streams noted above will be supplemented using the shelf moorings, Slocum gliders, HF RADAR (Fig. 11) and the eight CTD field surveys that SAIMOS currently undertakes each year. As shown in Figures 4 and 6, we have already identified paths of upwelling and downwelling for the Kangaroo Island - Eyre Peninsula region and the shelf moorings are deployed along isobaths to measure the former. The NRS off Kangaroo Island is deployed at a choke point of isobaths and thus the along shore flow. In addition, it sits in the western part of the Kangaroo Island cold pool, (McClatchie et al 2006). The Slocum glider path allows for the determination of cross- and along-shelf variability.
G:\Oceanography\SAIMOS\IMOS-2\FINAL SAIMOS2 NODE PLAN\SAIMOS-II plan-FINALAugust2010v2.doc 21

A
B
Fig. 9 A schematic path of the Sea Glider (A) and for the Portland to Eyre Peninsula region and (B) the detail of the mission path for the
Kangaroo Is region including traverses of canyons.
The additional use of tagged apex predator CTD data will also be most useful in informing of the location of productivity hot-spots and possible associated upwelling. The role of the gulfs in cross-shelf exchange of nutrients and carbon will be determined from existing SAIMOS data and with a mooring deployed at the mouth of the gulf. [Supplemental data streams to be collected outside of IMOS will be obtained from inside Spencer Gulf. These together with hydrodynamic models will allow the impact of gulf-shelf exchange to be determined (see section 6 below).]
G:\Oceanography\SAIMOS\IMOS-2\FINAL SAIMOS2 NODE PLAN\SAIMOS-II plan-FINALAugust2010v2.doc 22

Fig. 10 The Slocum glider path adopted in 2009.
4.1.2 Research questions and observational strategy beyond 2013 Research Questions:
What is the temporal and spatial variability and nature of cross-shelf exchange (upwelling and downwelling) for the Bonney and Otway Coastal regions.
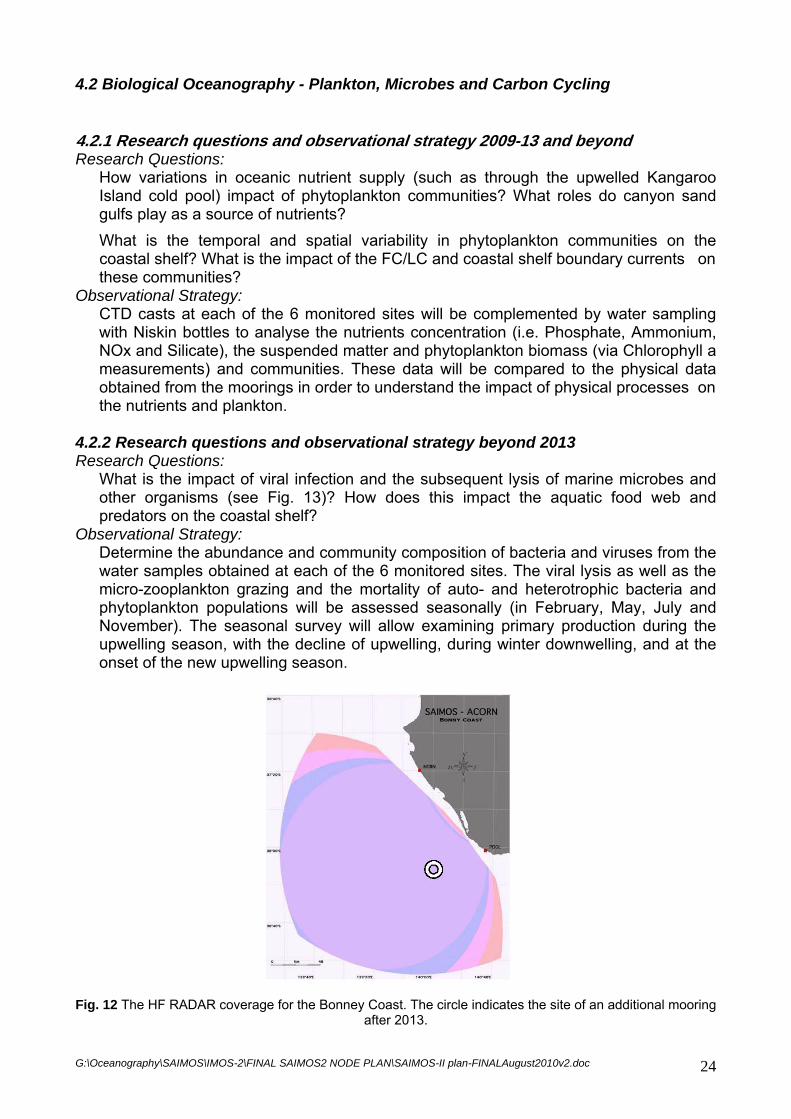
Observational Strategy: For the Bonney Coast, the CODAR RADAR system will provide data that will allow surface currents to be mapped and related to satellite SST. In addition, sea level data is available from the NTC Portland monitoring station. Bottom temperature data is also been obtained from the Acoustic Observatory off Portland. To supplement these data streams a new mooring (after June 2013) will be deployed on the shelf (Fig. 12) so as to provide the supplementary vertical current structure to that of the RADAR. A part-time, local employee (Andrew Levings) is already engaged for maintenance of the Acoustic Observatory and will be employed for mooring servicing. For the Otway Coast, 6 new CTD moorings will, after June 2013, gather data over 3 cross-shelf transects that will, in conjunction with that above, allow for the determination of the spatial and temporal variability of upwelling to be determined.
Fig. 11 The day (night) coverage of the WERA RADAR as indicated by the
intersection of the red (white) arcs
G:\Oceanography\SAIMOS\IMOS-2\FINAL SAIMOS2 NODE PLAN\SAIMOS-II plan-FINALAugust2010v2.doc 23
4.2 Biological Oceanography - Plankton, Microbes and Carbon Cycling
4.2.1 Research questions and observational strategy 2009-13 and beyond Research Questions:
How variations in oceanic nutrient supply (such as through the upwelled Kangaroo Island cold pool) impact of phytoplankton communities? What roles do canyon sand gulfs play as a source of nutrients? What is the temporal and spatial variability in phytoplankton communities on the coastal shelf? What is the impact of the FC/LC and coastal shelf boundary currents on these communities?
Observational Strategy: CTD casts at each of the 6 monitored sites will be complemented by water sampling with Niskin bottles to analyse the nutrients concentration (i.e. Phosphate, Ammonium, NOx and Silicate), the suspended matter and phytoplankton biomass (via Chlorophyll a measurements) and communities. These data will be compared to the physical data obtained from the moorings in order to understand the impact of physical processes on the nutrients and plankton.
4.2.2 Research questions and observational strategy beyond 2013 Research Questions:
What is the impact of viral infection and the subsequent lysis of marine microbes and other organisms (see Fig. 13)? How does this impact the aquatic food web and predators on the coastal shelf?
Observational Strategy: Determine the abundance and community composition of bacteria and viruses from the water samples obtained at each of the 6 monitored sites. The viral lysis as well as the micro-zooplankton grazing and the mortality of auto- and heterotrophic bacteria and phytoplankton populations will be assessed seasonally (in February, May, July and November). The seasonal survey will allow examining primary production during the upwelling season, with the decline of upwelling, during winter downwelling, and at the onset of the new upwelling season.
Fig. 12 The HF RADAR coverage for the Bonney Coast. The circle indicates the site of an additional mooring
after 2013.
G:\Oceanography\SAIMOS\IMOS-2\FINAL SAIMOS2 NODE PLAN\SAIMOS-II plan-FINALAugust2010v2.doc 24
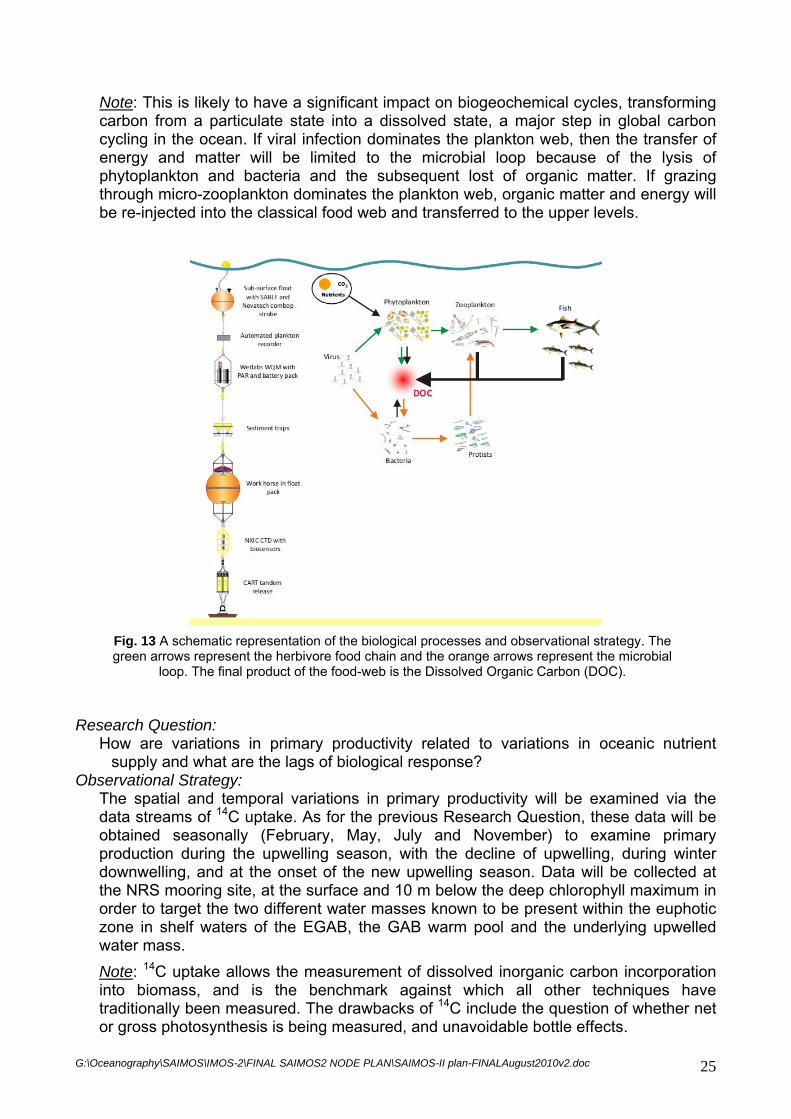
Note: This is likely to have a significant impact on biogeochemical cycles, transforming carbon from a particulate state into a dissolved state, a major step in global carbon cycling in the ocean. If viral infection dominates the plankton web, then the transfer of energy and matter will be limited to the microbial loop because of the lysis of phytoplankton and bacteria and the subsequent lost of organic matter. If grazing through micro-zooplankton dominates the plankton web, organic matter and energy will be re-injected into the classical food web and transferred to the upper levels.
Fig. 13 A schematic representation of the biological processes and observational strategy. The green arrows represent the herbivore food chain and the orange arrows represent the microbial
loop. The final product of the food-web is the Dissolved Organic Carbon (DOC).
Research Question: How are variations in primary productivity related to variations in oceanic nutrient supply and what are the lags of biological response?
Observational Strategy: The spatial and temporal variations in primary productivity will be examined via the data streams of 14C uptake. As for the previous Research Question, these data will be obtained seasonally (February, May, July and November) to examine primary production during the upwelling season, with the decline of upwelling, during winter downwelling, and at the onset of the new upwelling season. Data will be collected at the NRS mooring site, at the surface and 10 m below the deep chlorophyll maximum in order to target the two different water masses known to be present within the euphotic zone in shelf waters of the EGAB, the GAB warm pool and the underlying upwelled water mass. Note: 14C uptake allows the measurement of dissolved inorganic carbon incorporation into biomass, and is the benchmark against which all other techniques have traditionally been measured. The drawbacks of 14C include the question of whether net or gross photosynthesis is being measured, and unavoidable bottle effects.
G:\Oceanography\SAIMOS\IMOS-2\FINAL SAIMOS2 NODE PLAN\SAIMOS-II plan-FINALAugust2010v2.doc 25

Research Question:
What are the critical fluxes such as primary productivity and the related changes in phytoplankton communities, ocean-atmosphere fluxes and vertical fluxes?
Observational Strategy: In addition to the pCO2 mooring maintained at that NRS site, data from 3 Autonomous Plankton Recorders will be collected from the three continuously maintained moorings to assess primary and secondary primary productivity. These moorings are the (national Reference Station (NRS), and the moorings off the Eyre Peninsula and at the mouth of Spencers Gulf. These moorings will also have temperature loggers so that the depth of the surface mixed layer can be monitored.
Research Question:
What is the temporal and spatial variability in secondary producers (e.g. zooplankton) on the coastal shelf? How this variability impacts on fish communities?
Observational Strategy: As stated above, 3 Autonomous Plankton Recorders will be collected from the three continuously maintained moorings to assess primary and secondary primary productivity. This will allow the assessment of the temporal and spatial variability of the plankton species (i.e. phytoplankton and zooplankton) larger than 270μm. These data will be compared to the physical data obtained from the moorings in order to understand the impact of physical processes on the nutrients and plankton. In addition, at each of the 6 monitored sites, a bongo net will be towed in order to sample zooplankton species at 2 different depths (above and below the Deep Chlorophyll Maximum).
Research Questions:
What is the space-time dynamic of the trophic state of S.A. shelf waters, and do they act as a source or a sink of CO2?
Observational Strategy: Assess the respiration and production rates of the planktonic community (fraction smaller than 60 µm) through dissolved oxygen consumption measurements. Those measurements will be conducted non-intrusively through the use of oxygen optodes sensors following light and dark incubations. This will be conducted seasonally (in February, May, July and November) to examine respiration/production during the upwelling season, with the decline of upwelling, during winter downwelling, and at the onset of the new upwelling season. Using the above data, we can then assess the trophic status of the system, i.e. net autotrophic or net heterotrophic and convert this into data streams of a CO2 budget that will vary in space and time.
4.3 Biological Oceanography - Apex Predators
4.3.1 Research questions and observational strategy 2009-2013 and beyond Research Question:
What are the key physical oceanographic features that underpin the distribution, key foraging locations, movements and migratory patterns of apex predators?
Observational Strategy:
G:\Oceanography\SAIMOS\IMOS-2\FINAL SAIMOS2 NODE PLAN\SAIMOS-II plan-FINALAugust2010v2.doc 26

CTD tags will be deployed on Australian sea lions to assist in monitoring the spatial and temporal extent of upwelling in the EGAB between November and May each season. The aim is to provide sustained observations (continuous and simultaneous cross-shelf sampling) of CTD over a ~7 month period across seven sites (analogous to XBT lines) between the Bonney Coast and the head of the Bight (Fig. 5 & 14). Sea lion data will be augmented by deployments of instruments onto other apex predators (including short-finned mako and new Zealand fur seals), which can sample slope waters off the EGAB and near oceanic waters down to the Subtropical Front. Data will allow us to identify key regions of production and hot-spots of predator activity and to identify regions where strategic placement of existing observing platforms, such as fixed moorings or directed ship-based research, may be made. The approach of sustained observations using instrumented apex predators is part of the AATAMS southern seals as oceanographic samplers which has links to the Bluewater and Climate Change Node. Observations of shelf, slope and oceanic waters to the subtropical frontals compliment observations as part of Bluewater and Climate Change Node.
Fig. 14 Examples of over 7,800 temperature-depth profiles (blue cold, red warm) collected by seven Australian sea lion males fitted with CTD tags, over the EGAB region between November and July.
Research Question:
How do foraging distributions and movements of different apex predator species respond to the spatial and temporal variability in boundary currents and upwelling intensity?
Observational Strategy: Bio-logging instruments (GPS tracking with temperature depth sensors) will be deployed on New Zealand fur seals and mako sharks throughout the year to collect information on the physical habitats they use. Previous tracking data indicates that female New Zealand fur seals forage over the shelf during periods of upwelling, but switch their foraging effort to subtropical front waters during winter/spring. Likewise, mako sharks migrate to the S.A. shelf region for the summer-autumn period. By deploying temperature-depth sensors we will be able to track changes in the physical environment used by these predators. We will compare data collected on the shelf from sea lion CTD tags and other facilities (moorings gliders, satellite imagery) to describe the dynamics of shelf and pelagic habitats available throughout the year and provide context for the switch in foraging locations. The strategy is to collect sustained
G:\Oceanography\SAIMOS\IMOS-2\FINAL SAIMOS2 NODE PLAN\SAIMOS-II plan-FINALAugust2010v2.doc 27
observations of these key foraging grounds and oceanographic associations across multiple seasons. The approach of sustained observations using instrumented apex predators is part of the AATAMS southern seals as oceanographic samplers which has links to the Bluewater and Climate Change Node.
Research Question:
What are the likely physical and biological implications of climate change on the spatial and temporal distribution of benthic and pelagic production, and how will this impact the foraging distributions and movements of apex predator populations?
Observational Strategy: Acoustic receivers will also be used to investigate the residence time, movements, migratory routes and inter-connectivity between a range of different habitats of several predators (e.g., white sharks, whaler sharks, southern blue-fin tuna, mulloways, snappers, gulper sharks, and whitefin swell sharks) and how these changes with varying oceanographic conditions monitored through the oceanographic moorings, the gliders, the apex predator CTD tags, and coastal radar. In Western Australia, AATAMS has already deployed an acoustic receiver network combining curtains outside Ningaloo Reef to an array inside the lagoon. Similarly, northern Queensland recently obtained funds to assess inter-connectivity between inside and outside tropical islands. A similar approach will be used in S.A. combining already existing receivers with newly deployed receivers to link the oceanographic observations to the detections obtained from tagged organisms. The already deployed receivers include receivers located at the entrance of the Gulfs (i.e. Neptune Islands), off the continental shelf edge southwest of Cape Wiles (Fig. 1) and off Glenelg Beach (Adelaide).
4.3.2 Research questions and observational strategy beyond 2013 Research Question:
How does the breeding success and trends in abundance of apex predator populations respond to the spatial and temporal variability in boundary currents and upwelling intensity? What are the likely implications of climate change on the status, distribution and abundance of apex predator populations?
Observational Strategy: Apex predators are sensitive to changes in the distribution and abundance of their prey, which in turn respond to changes in the lower trophic levels and the physical environment. The observation strategy is to collect sustained observations of selected apex predator population response to oceanographic change, including climate change (monitoring of apex predators in the GAB, MAPGAB). This will be achieved by monitoring one land-breeding pelagic predator (New Zealand fur seal) and one land-breeding benthic predator (Australian sea lion). Changes in pup production of New Zealand fur seals and Australian sea lions have been monitored on Kangaroo Island since 1988, and monitoring will be maintained through this strategy. The fur seal and sea lion breeding colonies are only 20 km apart. New Zealand fur seal pup growth rates and Australian sea lion age-specific survival and fecundity rates (as part of ongoing demographic monitoring) will also be undertaken. These observations are designed to provide indices of whole of ecosystem response to climate change and compliment the monitoring of apex predators in the Southern Ocean program (part of the Bluewater and Climate change Node Plan).
Research Question:
What are the likely physical and biological implications of climate change on the spatial and temporal distribution of benthic and pelagic production, and how will this impact the foraging distributions and movements of apex predator populations?
G:\Oceanography\SAIMOS\IMOS-2\FINAL SAIMOS2 NODE PLAN\SAIMOS-II plan-FINALAugust2010v2.doc 28
Observational Strategy: This acoustic network will be upgraded with an additional three coastal curtains deployed on north and south of the Glenelg curtain improving its utility and enabling directionality of movements to be determined. One receiver will be deployed on each of the six SAIMOS moorings to directly link detections obtained with oceanographic observations, whereas five more receivers will be deployed at key foraging areas along the South Australian coastline. One cross-shelf curtain of approximately 30 receivers will be deployed off Portland detecting any tagged organism migrating east- or westwards. Timing of detections will be compared to strengths and incursion of boundary currents and the Bonney upwelling.
Research question:
How does exploitation of the Bonney coast upwelling by great whales vary across years? How does visitation of the Bonney coast by pygmy blue whales fit with seasonal migrations along the eastern and western Australian coasts? Can the presence of whales or fish choruses known to occur along the shelf edge be used as an indicator of productivity or vice/versa?
Observational Strategy: Maintain the current passive acoustic observatories to 2013 and beyond to gain a long time-series data set.
4.4 Observational Requirements: In summary (Table 1), the number of moorings off Kangaroo Island is to be kept constant by relocating SAM4CY to SAM3MS. Temperature loggers are to be added to the shelf moorings so as to better monitor the shelf/slope currents and thermocline displacement. In addition, we aim to maintain three moorings continuously, instead of two and plan a new mooring off the Bonney Coast, (after June 2013) collocated with other existing or planned moorings. No other enhancement of the physical component of the SAIMOS mooring facility is envisaged and all other equipment (baring replacements) has been ordered. The biological focus will grow from the identification of the spatial and temporal species of phytoplankton to viruses/bacteria/zooplankton and to include primary and secondary productivity after 2013. This will be achieved by complementary analyses of the water samples from the Niskin bottles, a supplementary net towing and by loading 3 autonomous plankton recorders onto existing moorings. Through AATAMS, deep-diving apex predators will be fitted with CTD loggers to provide real time cross shelf profiles of CTD and CTD data on “hot-spots” of biological activity. These data will provide unsurpassed spatial coverage of CTD profiles and help refine future SAIMOS observing systems. In addition, data on the movements of pelagic fish will be obtained through AATAMS for the Portland and Kangaroo Island – Eyre Peninsula regions.
G:\Oceanography\SAIMOS\IMOS-2\FINAL SAIMOS2 NODE PLAN\SAIMOS-II plan-FINALAugust2010v2.doc 29
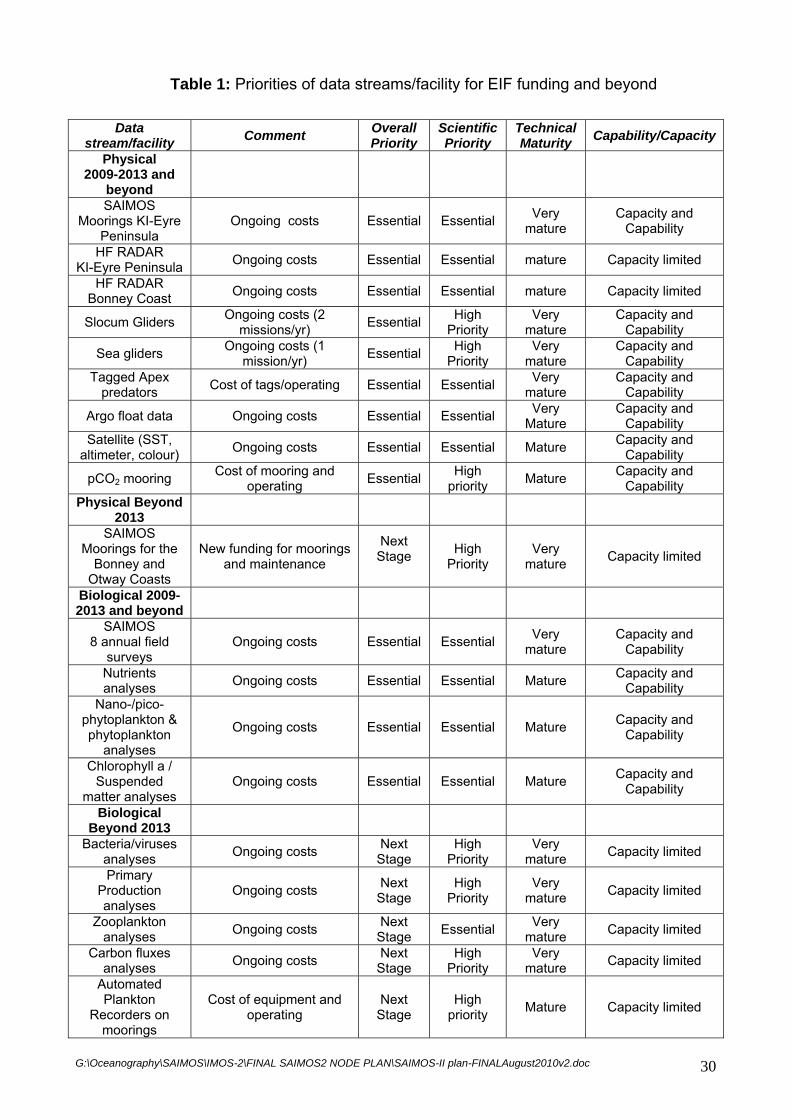
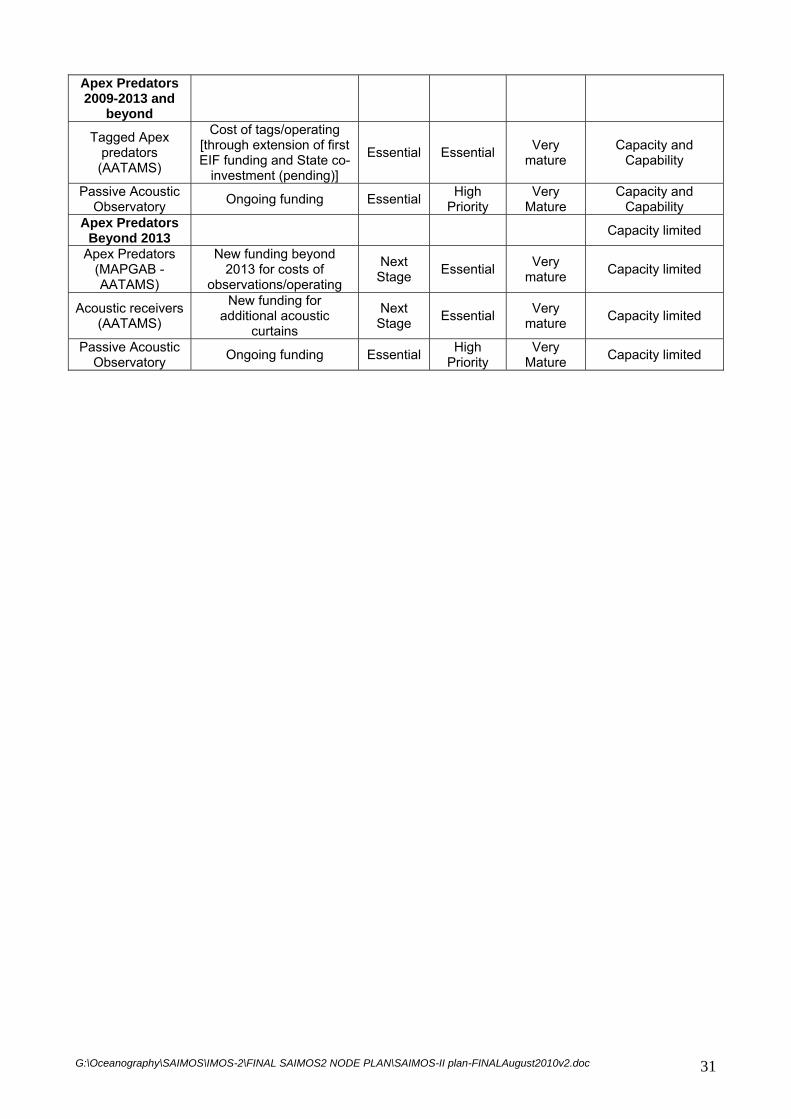
Table 1: Priorities of data streams/facility for EIF funding and beyond
Data stream/facility Comment Overall
Priority Scientific Priority
Technical Maturity Capability/Capacity
Physical 2009-2013 and
beyond
SAIMOS Moorings KI-Eyre
Peninsula Ongoing costs Essential Essential Very
mature Capacity and
Capability
HF RADAR KI-Eyre Peninsula Ongoing costs Essential Essential mature Capacity limited
HF RADAR Bonney Coast Ongoing costs Essential Essential mature Capacity limited
Slocum Gliders Ongoing costs (2 missions/yr) Essential High
Priority Very
mature Capacity and
Capability
Sea gliders Ongoing costs (1 mission/yr) Essential High
Priority Very
mature Capacity and
Capability Tagged Apex
predators Cost of tags/operating Essential Essential Very mature
Capacity and Capability
Argo float data Ongoing costs Essential Essential Very Mature
Capacity and Capability
Satellite (SST, altimeter, colour) Ongoing costs Essential Essential Mature Capacity and
Capability
pCO2 mooring Cost of mooring and operating Essential High
priority Mature Capacity and Capability
Physical Beyond 2013
SAIMOS Moorings for the
Bonney and Otway Coasts
New funding for moorings and maintenance
Next Stage
High Priority
Very mature Capacity limited
Biological 2009-2013 and beyond
SAIMOS 8 annual field
surveys Ongoing costs Essential Essential Very
mature Capacity and
Capability
Nutrients analyses Ongoing costs Essential Essential Mature Capacity and
Capability Nano-/pico-
phytoplankton & phytoplankton
analyses
Ongoing costs Essential Essential Mature Capacity and Capability
Chlorophyll a / Suspended
matter analyses Ongoing costs Essential Essential Mature Capacity and
Capability
Biological Beyond 2013
Bacteria/viruses analyses Ongoing costs Next
Stage High
Priority Very
mature Capacity limited
Primary Production analyses
Ongoing costs Next Stage
High Priority
Very mature Capacity limited
Zooplankton analyses Ongoing costs Next
Stage Essential Very mature Capacity limited
Carbon fluxes analyses Ongoing costs Next
Stage High
Priority Very
mature Capacity limited
Automated Plankton
Recorders on moorings
Cost of equipment and operating
Next Stage
High priority Mature Capacity limited
G:\Oceanography\SAIMOS\IMOS-2\FINAL SAIMOS2 NODE PLAN\SAIMOS-II plan-FINALAugust2010v2.doc 30
Apex Predators 2009-2013 and
beyond
Tagged Apex predators (AATAMS)
Cost of tags/operating [through extension of first EIF funding and State co-
investment (pending)]
Essential Essential Very mature
Capacity and Capability
Passive Acoustic Observatory Ongoing funding Essential High
Priority Very
Mature Capacity and
Capability Apex Predators
Beyond 2013 Capacity limited
Apex Predators (MAPGAB - AATAMS)
New funding beyond 2013 for costs of
observations/operating
Next Stage Essential Very
mature Capacity limited
Acoustic receivers (AATAMS)
New funding for additional acoustic
curtains
Next Stage Essential Very
mature Capacity limited
Passive Acoustic Observatory Ongoing funding Essential High
Priority Very
Mature Capacity limited
G:\Oceanography\SAIMOS\IMOS-2\FINAL SAIMOS2 NODE PLAN\SAIMOS-II plan-FINALAugust2010v2.doc 31
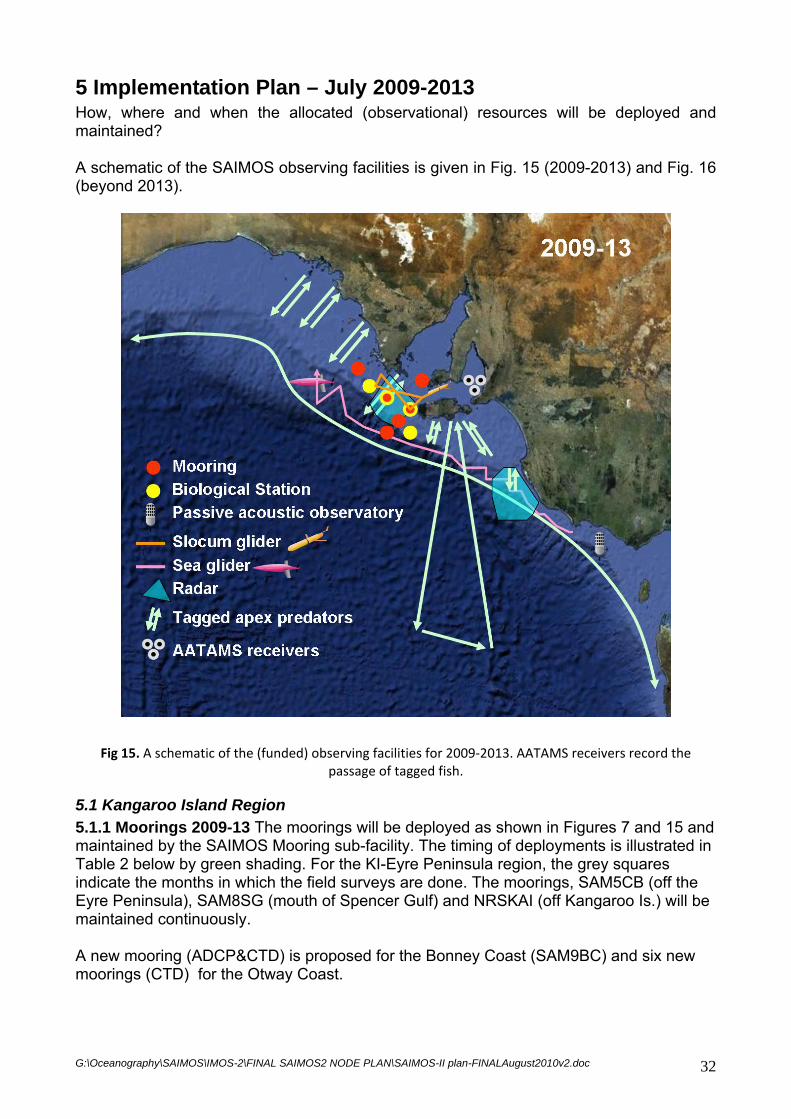
5 Implementation Plan – July 2009-2013 How, where and when the allocated (observational) resources will be deployed and maintained? A schematic of the SAIMOS observing facilities is given in Fig. 15 (2009-2013) and Fig. 16 (beyond 2013).
Fig 15. A schematic of the (funded) observing facilities for 2009‐2013. AATAMS receivers record the passage of tagged fish.
5.1 Kangaroo Island Region 5.1.1 Moorings 2009-13 The moorings will be deployed as shown in Figures 7 and 15 and maintained by the SAIMOS Mooring sub-facility. The timing of deployments is illustrated in Table 2 below by green shading. For the KI-Eyre Peninsula region, the grey squares indicate the months in which the field surveys are done. The moorings, SAM5CB (off the Eyre Peninsula), SAM8SG (mouth of Spencer Gulf) and NRSKAI (off Kangaroo Is.) will be maintained continuously. A new mooring (ADCP&CTD) is proposed for the Bonney Coast (SAM9BC) and six new moorings (CTD) for the Otway Coast.
G:\Oceanography\SAIMOS\IMOS-2\FINAL SAIMOS2 NODE PLAN\SAIMOS-II plan-FINALAugust2010v2.doc 32
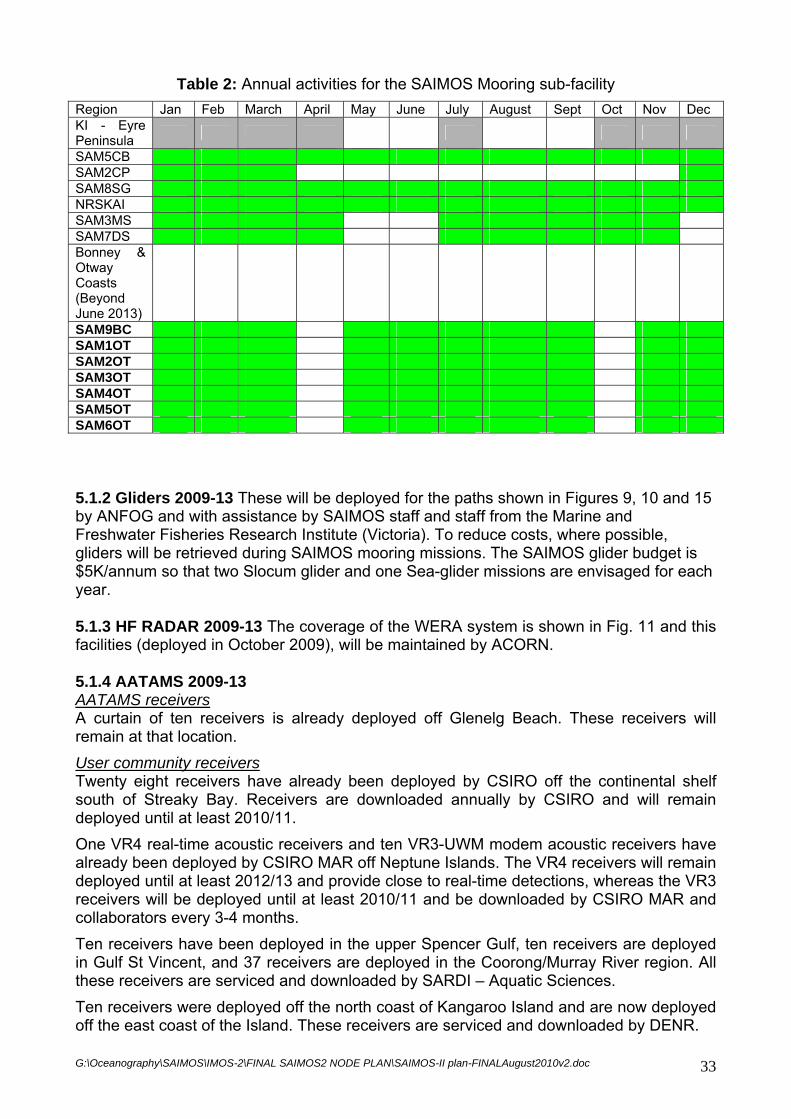
Table 2: Annual activities for the SAIMOS Mooring sub-facility Region Jan Feb March April May June July August Sept Oct Nov Dec KI - Eyre Peninsula
SAM5CB SAM2CP SAM8SG NRSKAI SAM3MS SAM7DS Bonney & Otway Coasts (Beyond June 2013)
SAM9BC SAM1OT SAM2OT SAM3OT SAM4OT SAM5OT SAM6OT 5.1.2 Gliders 2009-13 These will be deployed for the paths shown in Figures 9, 10 and 15 by ANFOG and with assistance by SAIMOS staff and staff from the Marine and Freshwater Fisheries Research Institute (Victoria). To reduce costs, where possible, gliders will be retrieved during SAIMOS mooring missions. The SAIMOS glider budget is $5K/annum so that two Slocum glider and one Sea-glider missions are envisaged for each year. 5.1.3 HF RADAR 2009-13 The coverage of the WERA system is shown in Fig. 11 and this facilities (deployed in October 2009), will be maintained by ACORN.
5.1.4 AATAMS 2009-13 AATAMS receivers A curtain of ten receivers is already deployed off Glenelg Beach. These receivers will remain at that location. User community receivers Twenty eight receivers have already been deployed by CSIRO off the continental shelf south of Streaky Bay. Receivers are downloaded annually by CSIRO and will remain deployed until at least 2010/11. One VR4 real-time acoustic receivers and ten VR3-UWM modem acoustic receivers have already been deployed by CSIRO MAR off Neptune Islands. The VR4 receivers will remain deployed until at least 2012/13 and provide close to real-time detections, whereas the VR3 receivers will be deployed until at least 2010/11 and be downloaded by CSIRO MAR and collaborators every 3-4 months. Ten receivers have been deployed in the upper Spencer Gulf, ten receivers are deployed in Gulf St Vincent, and 37 receivers are deployed in the Coorong/Murray River region. All these receivers are serviced and downloaded by SARDI – Aquatic Sciences. Ten receivers were deployed off the north coast of Kangaroo Island and are now deployed off the east coast of the Island. These receivers are serviced and downloaded by DENR.
G:\Oceanography\SAIMOS\IMOS-2\FINAL SAIMOS2 NODE PLAN\SAIMOS-II plan-FINALAugust2010v2.doc 33
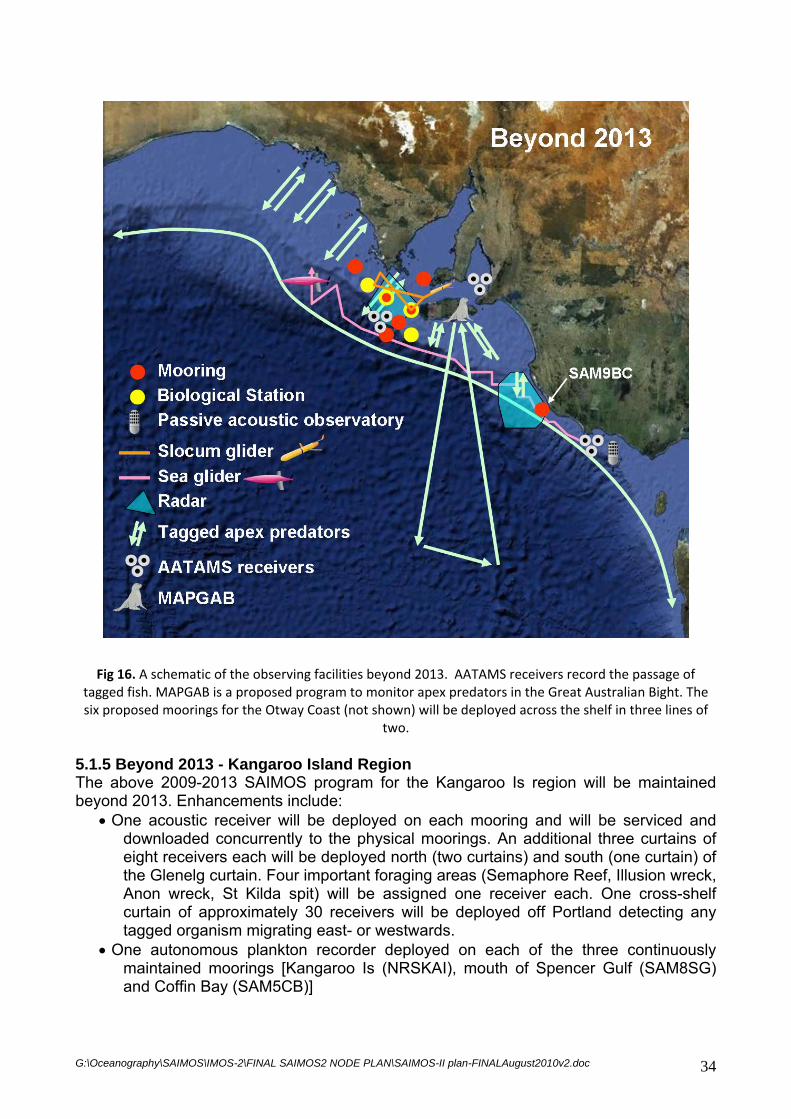
Fig 16. A schematic of the observing facilities beyond 2013. AATAMS receivers record the passage of tagged fish. MAPGAB is a proposed program to monitor apex predators in the Great Australian Bight. The six proposed moorings for the Otway Coast (not shown) will be deployed across the shelf in three lines of
two.
5.1.5 Beyond 2013 - Kangaroo Island Region The above 2009-2013 SAIMOS program for the Kangaroo Is region will be maintained beyond 2013. Enhancements include:
• One acoustic receiver will be deployed on each mooring and will be serviced and downloaded concurrently to the physical moorings. An additional three curtains of eight receivers each will be deployed north (two curtains) and south (one curtain) of the Glenelg curtain. Four important foraging areas (Semaphore Reef, Illusion wreck, Anon wreck, St Kilda spit) will be assigned one receiver each. One cross-shelf curtain of approximately 30 receivers will be deployed off Portland detecting any tagged organism migrating east- or westwards.
• One autonomous plankton recorder deployed on each of the three continuously maintained moorings [Kangaroo Is (NRSKAI), mouth of Spencer Gulf (SAM8SG) and Coffin Bay (SAM5CB)]
G:\Oceanography\SAIMOS\IMOS-2\FINAL SAIMOS2 NODE PLAN\SAIMOS-II plan-FINALAugust2010v2.doc 34
5.2 Bonney and Otway Coastal Regions. 5.2.1 Gliders 2009-13 will be deployed for the paths shown in Fig. 8 by ANFOG and with assistance by SAIMOS Mooring staff (Shaun Byrnes) and the Marine and Freshwater Fisheries Research Institute (Victoria). Where possible, vessels hired for mooring deployments will be used. 5.2.2 HF RADAR 2009-13. The coverage is shown in Fig. 12 and this CODAR facility (installed July 2010) will be maintained by ACORN. 5.2.3 Passive Acoustic Observatory: Is installed and now instrumented with temperature loggers. 5.2.4 Beyond 2013 – Bonney and Otway Coastal Regions The above glider and RADAR observing systems will be maintained. Enhancements include:
• Moorings : For the Bonney Coast a bottom mounted ADCP and CTD will be deployed within the range of the CODAR RADAR. Andrew Levings (Portland) will be employed to maintain the new mooring (Table 2), that will be retrieved, serviced and redeployed sometime in February-March, July-August and November-December so that six, one-day vessel trips are needed.
• Moorings: For the Otway Coast, the 6 CTD moorings will be deployed along the three cross-shelf transects. These will also be serviced every 6 months by Andrew Levings with support from the SAIMOS mooring sub-facility.
5.3 Eastern GAB, slope and near oceanic waters to Sub-tropical Front 5.3.1 Apex predators 2009-13 Conductivity, temperature and depth (CTD) tags will be deployed onto male Australian sea lions to collect cross-shelf transects with vertical CTD profiles with high resolution and broad temporal and spatial coverage Tag deployment will cover the period from November to May to coincide with seasonal upwelling events, along Australia’s southern shelves, the focus being the Flinders’ Current upwelling in the EGAB. The primary purpose of the CTD tags deployments is to provide sustained oceanographic observations and monitor the spatial and temporal extent of upwelling between November and May of 2009/10, 2010/11, 2011/12, 2012/13. This will be augmented by the deployment of temperature-depth tags onto mako sharks to provide sustained observations of slope waters off Australia’s southern shelves, and GPS temperature loggers onto female New Zealand fur seals over winter months to collect sustained observations of sub-tropical front waters. The number of bio-logging tags to be deployed on apex predators (Australian sea lions, New Zealand fur seals, and mako sharks) is indicated in the table. Locations indicated in footnotes.
Table 3: List of apex predator species to be tagged, tag type, habitat and number of tags
to be deployed each year between 2009-2013. Species Tag type Habitat 2009/10 2010/11 2011/12 2012/13 Australian sea lion1 PTT CTD Shelf 7 5-71 5-71 5-71 Short-finned mako 2 PTT Temp Slope 5 5 5 New Zealand fur seal2 GPS Temp Oceanic 5 5 5
1 7 tags with State co-investment (DFEEST), 5 if only first EIF funds. 2 Pending State co-investment (DFEEST
G:\Oceanography\SAIMOS\IMOS-2\FINAL SAIMOS2 NODE PLAN\SAIMOS-II plan-FINALAugust2010v2.doc 35

5.3.2 Beyond 2013 – Eastern GAB Beyond 2013, the above 2009-2013 observing activities will continue. Enhancements include:
• monitoring of apex predators in the GAB (MAPGAB) will consist of annual monitoring of New Zealand fur seal pup production at Cape Gantheuame, Kangaroo Island in January, and pup mass in January, May and September (pre-weaning). Australian sea lion breed ~17.5 months when pup production and fecundity (pupping rates of tagged females) will be surveyed at Seal Bay (Kangaroo Island). All pups that survive the breeding season are micro-chipped and remote aerials with data loggers monitor survival cohort and age-specific survival. These observations will provide indices of whole of ecosystem response to climate change within the pelagic (New Zealand fur seal) and benthic (Australian sea lion) realm, and compliment the monitoring of apex predators in the Southern Ocean program (MAPSO, part of the Bluewater and Climate change Node Plan).
6 Describe how the data will be taken up and used by the Node 6.1 Impact and delivery through improved model output Semi-global models - Bluelink: As part of the South East (Climate) Adaptation Program (SEAP) - an initiative of Victorian agencies, TAFI, CSIRO, FRDC and SARDI), the IMOS data will be used to validate the Bluelink model. Regional models: The data from SAIMOS and elsewhere has and will be used to update and validate a S.A. Regional Ocean Model (SAROM). An additional component of this model is a Nitrogen, Phytoplankton, Zooplankton (NPZ) model for the SAIMOS region. These models are under development though funding of $416K by Marine Innovation South Australia and through the SEAP program ($35K). SAROM will be used to answer some of research questions raised above particularly the relationship between cross-shelf exchange and planktonic response. In the simplest context, the model results can also inform SAIMOS on better timing and placement of observational sensors. In the longer term, a data assimilating SAROM can be used to determine what observable data streams can statistically provide the best skill in predicting other data streams that are key to the shelf/slope system and cross-shelf exchange. The impact of SAIMOS through the development of SAROM has been significant and led to additional research projects and data streams. In summary:
- Carrying Capacity of Spencer Gulf (FRDC, PIRSA -$1.2M): data from Spencer Gulf will be used to validate at high resolution version of SAROM so as to determine the optimal feed inputs for existing and proposed Aquaculture zones. (SARDI and Flinders University)
- Optimising the prawn harvest in Spencer Gulf (FRDC, - $300K): SAROM will be used to examine prawn larval dispersal to determine optimal strategies of prawn harvest, (SARDI).
G:\Oceanography\SAIMOS\IMOS-2\FINAL SAIMOS2 NODE PLAN\SAIMOS-II plan-FINALAugust2010v2.doc 36

Spatial distribution of foraging effort - apex predator models: Satellite derived location data will be used to develop models of the spatial distribution of foraging effort of apex predators. These models will integrate data on depth, temperature, salinity and thermocline depth. Model results will be important in determining the role of physical oceanographic features that underpin the distribution, key foraging locations, movements and migratory patterns of apex predators, and the likely consequences on their distribution and abundances that will result from climate change.
6.2 Ensuring the data is used. The SAIMOS node has been pro-active in promoting the use of the data streams to both the research community and industry. In the following we list several major projects that are making use of the SAIMOS data streams followed by student projects and training in field work and data analysis. 6.2.1 Major Projects The following projects will make use of the SAIMOS data streams:
- The South-East Climate Adaptation Program. (MAFFRI, TAFI, CSIRO, SARDI). This multi-disciplinary 3-year project seeks to provide adaptation strategies to climate change for the SE region of Australia. In the first instance, the IMOS data streams will be used to validate the Bluelink and SAROM models (Hobday and Middleton).
- Sustainability of the rock lobster resource in the south-eastern Australia (FRDC,
$501K) This program will look in part at the effects of environmental variables (eg., bottom temperature, current strength) on lobster catch rates off the Bonney Coast. (MAFFRI, CSIRO, TAFI, SARDI). The planned extension of SAIMOS to the Bonney and Otway Coasts will provide data streams for projects such as this in the future.
- Transects for Environmental Monitoring and Decision Making. This program is being
developed and involves setting up long-term monitoring of the terrestrial and marine environment for the purposes of monitoring climate and climate change. Monitoring and north-south transects of the Gulfs within S.A. are also proposed and a potential link to IMOS noted (SA Govt, DEH, SARDI, NRM, DWLBC and S.A. Universities)
- BioFuel Prospecting. The Algal Fuels Consortium (SARDI, Flinders and CSIRO) has
a $10.1M budget (S.A. Government and Commonwealth) into biofuels from microalgae. A portion of the water samples collected by SAIMOS will be forwarded to them for research into identifying promising microalgae for the production of biofuels.
- “Predicting impacts of global climate change on coastal waters, using southern
Australian aquaculture as an example: risk assessment, business susceptibility and ecological assays” Bradshaw, Clarke and Fernandes. This (proposed) 3 year project will use a portion of water samples collected by SAIMOS to determine the temporal and spatial variability of acidification.
- S.A. Water, a government department, will use the mooring data collected off the
Eyre Peninsula to determine the suitability of the region as a host for a desalination plant.
G:\Oceanography\SAIMOS\IMOS-2\FINAL SAIMOS2 NODE PLAN\SAIMOS-II plan-FINALAugust2010v2.doc 37

- From individuals to populations: multi-scale approaches to ensure long-term persistence of whaler sharks (ARC Linkage project between Flinders University and the University of Adelaide)
- Acoustic telemetry in Northern Spencer Gulf, SA: contributions to understanding
spawning aggregative behaviour of snapper (Chrysophrys auratus) and their interactions with White sharks (Carcharodon carcharias).
- Understanding the residence time and movement patterns of whaler sharks
(Carcharhinus spp.) along the Adelaide metropolitan beaches. - Population size, structure and habitat preferences of common dolphins in South
Australia: enhancing the assessment, reduction and mitigation of fisheries operational interactions. This project will be undertaken by Drs Kerstin Bilgmann, Luciana Mollrer and Guido Parra (Flinders) with funding by the Australian Antarctic Division, Australian Marine Mammal Centre. They plan to use the SAIMOS trips to collect biopsy samples to conduct a population size estimate based on genetic mark-recapture methods. This would then be compared with our population size estimates conducted by distance sampling from aerial surveys. They will also investigate correlates of dolphin distribution and abundance with the physical/chemical/biological data collected by SAIMOS.
6.2.2 Student Projects PhD - Laura Richardson, Water Mass Connectivity and Mixing: isotope and hydrographic analyses, SARDI/ANU, March 2009-February 2013, Supervisors: J. Middleton, B. Opdyke - Virginie van Dongen-Vogels, Impact of physical forcings (upwelling/downwelling) and nutrients availability on the space-time dynamics of picophytoplankton communities, Flinders University , January 2008-July 2011, Supervisors: L. Seuront, S. Leterme - James Patterson, Coastal upwelling and its effects on marine microbial processes, Flinders University, February 2008 - November 2011, Supervisors: L. Seuront, J. Mitchell - Carlos Teixeira, The Ocean Circulation of Spencer Gulf: a numerical study, UNSW, August 2006-August 2010, Supervisors: J. Middleton Honours - Nathavong Navong, Impact of upwelling events on the phytoplankton communities off the South Australian continental shelf, Flinders University , Febrary - October 2010, Supervisors: S. Leterme, C. James Student Training in field work (all students are Flinders students unless otherwise indicated): Undergraduate: Simon Jacobs; Aidan Moyse; Lewis Beaumont; Sarah Pearson; Tamsyne Smith-Harding; Nick Manganello*; Mike Fleischmann* * AustraLearn exchange students
G:\Oceanography\SAIMOS\IMOS-2\FINAL SAIMOS2 NODE PLAN\SAIMOS-II plan-FINALAugust2010v2.doc 38

6.2.3 Other - Commonwealth and State managed fisheries and aquaculture and will use the data streams of the status, trends and health of apex predator populations to assist in ongoing assessments and the ecological sustainable development (e.g. SA sardine fishery, small pelagic fishery – FRDC $1.1 M). Commonwealth and State marine parks will use these data as a performance indicator of marine parks, and more broadly of ecosystem health. - The AATAMS community and network encompass over 110 scientists from about 35 institutions. The receivers as part of the South Australian network will be able to detect any fish tagged by these 110 scientists, who will utilise the detections obtained to infer large-scale movements and changes in residence times or migratory patterns.
6.3 Partnering for sustained observing. Partner Institutions include: Flinders University, University of Adelaide, Marine and Freshwater Fisheries Research Institute (DPI Vic), Curtin University, Macquarie University, University of Tasmania, Deakin University, CSIRO, A.F.M.A and the S.A. government organisations, Dept. Further Education Employment, Science and Training, Dept. for Environment and Natural Resources, Primary Industry, Resources and Agriculture, SARDI). SAIMOS Advisory board members are also drawn from DSTO, the Bureau of Meteorology and the National Tidal Facility. The Blue Whale Study Inc.: now a recognised research institute. Co-investments made: The partnership is led by SARDI and Flinders who will, by June 2013 contribute $2.1M in-kind to the moorings component of SAIMOS alone. Louise Renfrey is seconded full time as SAIMOS Executive Officer. Both Flinders and SARDI have contributed $2.5K each year to support the Node and glider deployments as well as $5K each year to support the HF RADAR installations and maintenance. In addition, the S.A. Government contributed $516,000 towards the purchase of the WERA HF RADAR system. Marine Innovation South Australia (MISA) also provides salaries for Node members who provide in-kind to SAIMOS and to carry out research on the SAIMOS data. These include Middleton, Luick, James, Leterme, Seuront, Huvaneers, Goldsworthy, van Ruth. John Middleton spends 50% of his time on SAIMOS management – a significant commitment: this will be reduced to 30% by 2013. Additional in-kind commitments for the enhancement are to be made by Huveneers and Goldsworthy (Flinders/SARDI) to the AATAMS facility. $10,000/year will be provided by Flinders University and DENR to service and download additional receivers deployed along the South Australian coastline. Industry Engagement: We have begun engagement with marine industry through presentations and meetings with representatives in Adelaide, the Eyre Peninsula, Kangaroo Is and surrounding regional areas. We will be meeting with representatives in the South East in the near future. The purpose of these meetings is to explain what SAIMOS is, provide them with a sense of “ownership” and to seek their help in the future development of SAIMOS. The fishing industries represent the greatest potential source of in-kind through their routine vessel usage. Initial discussions have been most positive, but it will take some time to build true mutually beneficial partnerships. Dr Andrew Levings SAIMOS Node member), is a life member of the Portland Professional Fishermens Association and previously led the
G:\Oceanography\SAIMOS\IMOS-2\FINAL SAIMOS2 NODE PLAN\SAIMOS-II plan-FINALAugust2010v2.doc 39

FRDC Fisheries Biology of the Giant Crab project which mobilised industry resources along the entire southern Australian coast. He can provide invaluable assistance to improve industry participation.
7 Describe what impact the IMOS observations will have regionally, nationally and internationally: short and long term 7.1 Short term: 5 to 10 years Over this period, the SAIMOS data streams will enable many of the key science questions to be addressed and answered. In particular, data over the 5 to 10 year period will enable the climate of, and relationships between, the physical and ecosystems to be determined. Impacts over this time frame include: - In conjunction with hydrodynamic and biogeochemical model development, the SAIMOS data will be of great use in providing improved tools to better inform the management of S.A.’s and western Victoria’s marine environment and fisheries. - The HF Ocean RADAR data will be of benefit to marine industry by allowing marine vessel operators to identify favourable current flows so as to minimise fuel costs. - The existence of the SAIMOS data streams has already led to additional investment of $1.2M by government and the FRDC in the IS-2 Carry Capacity project for Spencer Gulf (see section 6.1 above). - At a national level, the SAIMOS observations will link to those off W.A. and Tasmania to provide the first quantitative measure of connectivity through our “shared” Tasman Outflow, Flinders and Leeuwin Currents and ENSO forcing. - Bio-logging and monitoring of apex predator populations will provide critical data on the habitat needs, and oceanographic and ecological factors that underpin the high trophic levels in this Area of Ecological Significance. At a regional and national level such information will be critical to managing human utilisation of marine resources to ensure sustainability, and in the management of marine parks. At an international level there is a growing development of programs that simultaneously monitor the at sea movements of multiple species from multiple regions in order to identify regions and marine features that are Area of Ecological Significance (eg. TOPP, MEOPP, SeaOS, GTOPP). - The increased acoustic coverage provided by the receivers from the South Australian network will fill in a coverage gap identified by AATAMS and the user community. The compatibility of the receivers deployed with the equipment used nationally and internationally (eg. OTN) will provide sustained observing for tagged predators regionally, nationally, and internationally. Interstate migrations have already been recorded by acoustic receivers, whereas international interest in acoustic telemetry has grown exponentially with the OTN and the increased number of tagged organisms around the world. - The passive acoustic observatory will provide indexes of several great whale species which migrate nationally along the southern, western and eastern Australian coasts (ie. pygmy blue, dwarf minke, Antarctic minke and humpback whales) and internationally, into the southern ocean (ie. Antarctic minke, humpback and true blue whales). The SAIMOS observations will be a key piece in understanding movements and local habitat utilisation by these whales.
G:\Oceanography\SAIMOS\IMOS-2\FINAL SAIMOS2 NODE PLAN\SAIMOS-II plan-FINALAugust2010v2.doc 40

7.2 Long term: 20 years and beyond Over decades, the data streams will enable the determination of the climate change of the physical and ecosystems and identification of how these changes are occurring and how the ecosystems are responding. The strengths of the major boundary currents may change in response to basin scale changes in winds and wind stress curl. Warmer waters may be driven further south although upwelling may be enhanced. Regime shifts in phytoplankton abundance and species may occur with unknown consequences for populations and distributions of zooplankton, pelagic fish and apex predators. It is expected that such impacts will be determined by analyses of the data streams being collected at the national level by both the coastal and bluewater nodes.
8 Governance, structure and funding of the Node. 8.1 The Node Funding: each of SARDI and Flinders University contribute $2.5K each year to support SAIMOS Node activities including glider deployments/retrievals. Membership: the node membership is open to all and is achieved by registration of email address with SARDI. Governance: Draft Node plans are submitted to the membership for discussion and input to ensure the plans reflect the wishes of the broader research community. A SAIMOS Advisory Committee exists to provide the Node Leader with advice from the broader, environmental, industry and management community. The Node and Deputy Node leaders are elected by ballot of the membership through emails to an independent returning officer (John Nairn, BoM). 8.2 Stakeholder engagement and co-investments Detailed under section 6.3.
9 References Australia’s Biodiversity, an Overview of Selected Significant Components (1993)
Biodiversity Series, Paper Number 2. Department of the Environment, Sport and Territories, Canberra
Baylis, A.M.M., Page, B. and Goldsworthy , S.D. 2008. Effect of seasonal changes in upwelling activity on the foraging locations of a wide-ranging central-place forager, the New Zealand fur seal. Canadian Journal of Zoology 86(8): 774-789
Cirano, M. and J. F. Middleton, 2004: The Mean Wintertime Circulation Along Australia's Southern Shelves: a numerical study. J. Phys. Oceanogr., 34(3), 668-684. Clarke, A. J. and J. Li, 2004: El Nino/La Nina shelf edge flow and Australian western rock lobsters. Geophys. Res. Letters, 31, L11301, doi:10.1029/2003GLO18900. Edyvane, K., 1999a. Conserving Marine Biodiversity in South Australia – Part 1 –
Background, Status and Review of Approach to Marine Biodiversity Conservation in South Australia, SARDI Report Number 38, PIRSA.
Edyvane, K., 1999b. Conserving Marine Biodiversity in South Australia – Part 2 – Identification of Areas of High Conservation Value in South Australia, SARDI Report Number 39, PIRSA.
G:\Oceanography\SAIMOS\IMOS-2\FINAL SAIMOS2 NODE PLAN\SAIMOS-II plan-FINALAugust2010v2.doc 41
Gordon, H., Siobhan O’Farrell, Mark Collier, Martin Dix, Leon Rotstayn, Eva Kowalczyk, Tony Hirst and Ian Watterson (2010). The CSIRO Mk3.5 Climate Model, Centre for Australian Weather and Climate Research, Tech. Rep. No. 021
Hahn, S. D. 1986:. Physical Structure of the Waters of the South Australian Continental Shelf. Res. Rep. 45, Flinders Inst. for Atmos. and Marine Sciences. Flinders University, South Australia, 284 pp.
Hill, K. L., S. R. Rintoul, R. Coleman, and K. R. Ridgway (2008). Wind forced low frequency variability of the East Australia Current, Geophysical Research Letters 35, L08602, doi:10.1029/2007GL032912.
Hindell, M. A., Bradshaw, C., Harcourt, R. G., and Guinet, C. (2003). Ecosystem monitoring: are seals a potential tool for monitoring change in marine systems? (In “Marine Mammals and Humans: Fisheries, tourism and management”. Eds. Gales, N., Hindell, M., and Kirkwood, R.). CSIRO Publications. pp. 330-343.
Kaempf, J., M. Doubell, et al. (2004). "Evidence of a large seasonal coastal upwelling system along the southern shelf of Australia." Geophysical Research Letters 31(9
Kaempf, J. (2006). "Transient wind-driven upwelling in a submarine canyon: A process-oriented modelling study." Journal of Geophysical Research-Oceans 111(C11).
Kaempf, J. (2007). "On the magnitude of upwelling fluxes in shelf-break canyons." Continental Shelf Research 27(17): 2211-2223. Levings, A.H. and Gill, P.C. (2010). Seasonal winds drive water temperature cycle and migration patterns of southern Australian giant crab Pseudocarcinus gigas. In Biology and Management of Exploited Crab Populations under Climate Change. Editors G.H. Kruse, G.L. Eckert, R.J. Foy, R.N. Lipcius, B. Sainte-Marie, D.L. Stram, and D. Woodby. Alaska Sea Grant College Program (in press). McClatchie, S., J.F. Middleton, and T. Ward, 2006: Water mass analysis and alongshore
variation in upwelling intensity in the eastern Great Australian Bight. J. Geophys. Res., 111, C08007, doi:10.1029/2004JC002699
McIntosh RR (2007) The life history and population demographics of the Australian sea lion, Neophoca cinerea. La Trobe University, Bundoora, Victoria
McLeay L, Page B, Goldsworthy SD, Ward TM, Paton D, Waterman M and Murray MD. 2009. Demographic and morphological responses to prey depletion in a crested tern Sterna bergii population. ICES Journal of Marine Science, 66: 237–247.
Middleton, J.F., and K. P. Black, 1994: The Low Frequency Circulation in and around Bass Strait: a numerical study. Cont. Shelf Res., 14, 1495-1521.
Middleton, J. F. and M. Cirano, 2002: A Boundary Current along Australia's Southern Shelves: the Flinders Current. J. Geophys. Res. 107(C9), doi:10.1029. Middleton, J. F. and O. Leth, 2004, Wind-forced set-up of upwelling, geographical origins and numerical models: the role of bottom drag, J. Geophys. Res., 109, C12019, doi:10.1029/2003JC002126. Middleton, J. F., and J.T Bye, 2007: The Physical Oceanography of Australia’s Southern
Shelves: a review. Progress in Oceanography, Volume 75, Issue 1, October 2007, Pages 1-41
Middleton J. F., C. Arthur, P. van Ruth, T. Ward, J. McClean, M. Maltrud, P. Gill, S. Middleton, 2007: ENSO effects and upwelling along Australia’s southern shelves. J Phys. Oceanogr, 37(10). p.2458
Motoda, S., Kawamura, T. and Taniguchi, A. (1978). Differences in productivities between the Great Australian Bight and the Gulf of Carpentaria, Australia, in Summer. Marine Biology 46: 93-99.
Page B, McKenzie J, Sumner MD, Coyne M and Goldsworthy SD. 2006. Spatial separation of foraging habitats among New Zealand fur seals. Marine Ecology Progress Series 323: 263-279
G:\Oceanography\SAIMOS\IMOS-2\FINAL SAIMOS2 NODE PLAN\SAIMOS-II plan-FINALAugust2010v2.doc 42

G:\Oceanography\SAIMOS\IMOS-2\FINAL SAIMOS2 NODE PLAN\SAIMOS-II plan-FINALAugust2010v2.doc 43
Phillips JA (2001) Marine macroalgal biodiversity hotspots: why is there high species richness and endemism in southern Australian marine benthic flora? Biodiversity and Conservation, 10, 1555–1577.
Rennie, S., Hanson C.E., McCauley R.D., Pattiaratchi C., Burton C., Bannister J., Jenner C.,. Jenner M.-N. (2009) Physical properties and processes in the Perth Canyon, Western Australia: Links to water column production and seasonal pygmy blue whale abundance. J. Mar Systems 77:21-44
Southern Bluefin Tuna Recruitment Monitoring and Tagging Program. Report of the Eleventh Workshop. Hobart, CSIRO.
Teixiera, C. E. P.,(2010) Ocean Dynamics of Spencer Gulf: a numerical study. UNSW PhD thesis, submitted August 2010.
van Ruth (2009). Spatial and temporal variation in primary and secondary productivity in the eastern Great Australian Bight. PhD thesis, the University of Adelaide, 192pp.
Ward T, Goldsworthy SD and Page B (2004) Trophodynamics of the GAB: Assessing the Need for an Ecological Allocation in the SA Pilchard Fishery. Final report to the FRDC, PN 2003/072. 161 pp.
Young, J., Nishida, T. and Stanley, C. (2001). A preliminary survey of the summer hydrography and plankton biomass of the eastern Great Australian Bight, Australia.

TABLE 4: Observations required by the Node Facility Observations required by the Node
NCRIS Funded (already allocated to Jun11)
EIF first $8M funded (already allocated to Jun10)
(see Appendix 1 of the Guidelines)
Extension of existing facility infrastructure out to 2013.
Enhancements of existing Facilities / new infrastructure required 2010-2013
Argo
SOOP Melbourne-Adelaide SOOP: Continuous Plankton recorder data
SOTS
ANFOG 2 Slocum glider missions/yr 1 Seaglider mission/yr 2 Slocum glider missions/yr
1 Seaglider mission/yr
AUV Nil
ANMN
SAIMOS sub-facility field surveys and mooring data Passive Acoustics
SAIMOS sub-facility field surveys and mooring data Passive Acoustics
SAIMOS sub-facility primary production data, isotope data, DNA phytoplankton data (present and ancient) Carbon and Acidification Facility 1 pCO2 mooring NCOTS 1 sediment trap
ACORN
WERA RADAR off Capes Spencer and Wiles CODAR RADAR off the Bonney Coast
WERA RADAR off Capes Spencer and Wiles CODAR RADAR off the Bonney Coast
AATAMS AATAMS array off S.A. CTD tagging of apex predators AATAMS array off S.A.
Monitoring of fish movements through additional acoustic receivers CTD tagging of apex predators Monitoring indicators of ecosystem change in apex predators (MAPGAB)
FAIMMS SRS SST, colour and altimeter data SST, colour and altimeter data
G:\Oceanography\SAIMOS\IMOS-2\FINAL SAIMOS2 NODE PLAN\SAIMOS-II plan-FINALAugust2010v2.doc 44