Banks' Payments-Driven Revenues · PDF fileStudi es Functions at the Federal Reserve Bank of...
30
1 Banks’ Payments-Driven Revenues Lawrence J. Radecki Research and Markets Analysis Group Federal Reserve Bank of New York 33 Liberty Street New York, New York 10045 Telephone: (212) 720-5656 Fax: (212) 720-8363 E-mail: [email protected] Abstract The amount of fee income earned by the banking sector suggests that the significance of payment services has been understated or overlooked. This paper attempts to develop a clearer picture of the importance of payment services to the industry by delineating the payments area broadly and by analyzing data disclosed in bank holding company annual reports on sources of noninterest income. We find that payment services bring in from one-third to two-fifths of the combined operating revenue of the twenty-five largest bank holding companies. This contribution to revenue is considerably larger than commonly appreciated and indicates that the production and distribution of payment services is one of the core activities of commercial banks. The greater-than-expected importance of payment services has several implications for the identification and measurement of the banking sector’s output and for theories of the fundamental nature of commercial banking. JEL codes: G20, G21 Keywords: Banks, Deposits, Payments The views expressed in this paper are those of the author and do not necessarily reflect the position of the Federal Reserve Bank of New York, the Federal Reserve System, or their staffs. The author thanks the members of the Banking Studies and Payments Studies Functions at the Federal Reserve Bank of New York and the System Research Committee on Bank Structure and Regulation for their comments.
-
Upload
phungtuong -
Category
Documents
-
view
213 -
download
0
Transcript of Banks' Payments-Driven Revenues · PDF fileStudi es Functions at the Federal Reserve Bank of...
1
Banks’ Payments-Driven Revenues
Lawrence J. Radecki
Research and Markets Analysis GroupFederal Reserve Bank of New York
33 Liberty StreetNew York, New York 10045
Telephone: (212) 720-5656 Fax: (212) 720-8363E-mail: [email protected]
Abstract
The amount of fee income earned by the banking sector suggests that the significance ofpayment services has been understated or overlooked. This paper attempts to developa clearer picture of the importance of payment services to the industry by delineating thepayments area broadly and by analyzing data disclosed in bank holding company annualreports on sources of noninterest income.
We find that payment services bring in from one-third to two-fifths of the combinedoperating revenue of the twenty-five largest bank holding companies. This contribution torevenue is considerably larger than commonly appreciated and indicates that theproduction and distribution of payment services is one of the core activities of commercialbanks. The greater-than-expected importance of payment services has severalimplications for the identification and measurement of the banking sector’s output and fortheories of the fundamental nature of commercial banking.
JEL codes: G20, G21
Keywords: Banks, Deposits, Payments
The views expressed in this paper are those of the author and do not necessarily reflect
the position of the Federal Reserve Bank of New York, the Federal Reserve System, or
their staffs. The author thanks the members of the Banking Studies and Payments
Studies Functions at the Federal Reserve Bank of New York and the System Research
Committee on Bank Structure and Regulation for their comments.

2
Recently, however, researchers have given greater attention to payment system1
issues. For surveys of the issues, see Berger, Hancock, and Marquardt (1996) andHancock and Humphrey (1998).
Introduction
Banks’ lending activities draw the attention of supervisors, lawmakers, researchers,
and the press, but a very substantial and growing portion of the industry’s total revenue
is received in the form of fee income. The amount of fee, or noninterest, income earned
by the banking sector suggests that the significance of payment services has been
understated or overlooked. A lack of good information on the payments area may partly
explain a failure to gauge the size of this business line correctly. In reports to supervisory
agencies, banking organizations provide data bearing primarily on their safety and
soundness. By the design of the reports, banks transmit information on profitability,
capital, and the size and condition of the loan portfolio. Limited information can be
extracted from regulatory reports on individual business lines; in fact, they imply that banks
receive just seven percent of their net revenue from payment services.
A narrow delineation of payment, or transaction, services may also contribute to a
poor appreciation of this banking function. While checking accounts are universally
recognized as a payment service, credit cards, corporate trust accounts, and securities
processing should also be treated as parts of a bank’s payments business. The common
but limited definition of the payments area reflects the focus of banking research.
Economists offer two explanations for the prominence of commercial banks in the financial
sector. First, by developing their skills at screening applicants, monitoring borrowers, and
obtaining repayment, commercial banks became the dominant lender to relatively small-
sized borrowers. Second, because investors demand protection against the risk that they
may need liquidity earlier than anticipated, bank deposits are a special and highly desired
type of financial instrument. While insightful, neither rationale explains why commercial
banks provide payment services on a large scale, or why they perform payment services
together with deposit-taking and information-intensive lending.1
The purpose of this paper is to develop a clearer picture of the importance of
payment services to the banking industry. This purpose is served by taking a broad view
3
of the payments business and applying information provided by large bank holding
companies (BHCs) in their annual reports. BHCs have made concerted efforts to improve
their financial disclosures and they now furnish detailed material, far beyond what is filed
in regular reports to supervisors, on sources of noninterest income and the amounts
earned. This information is used to estimate the size of the payments area.
In the first section of the paper, we clarify our delineation of the payments area.
Then in the second section we review aggregate data on noninterest revenue. We also
examine the categories of noninterest income used in supervisory reporting to better
understand what is captured in each. In the third section, we classify and measure
sources of payments-driven revenue. Information appearing in the annual reports of BHCs
is employed to estimate the amounts that payment services contribute to the industry’s
revenue stream. Our estimates show that aggregate payments-driven revenue is
considerably larger than commonly appreciated and that the production and distribution
of payment services are one of the core activities of commercial banking. In the last
section we draw some implications from the greater-than-expected importance of payment
services for the identification and measurement of the banking sector’s output and theories
of the fundamental nature of commercial banking.
I. Delineation of payment services
Everyone is familiar with the fact that banks provide payment services by
safekeeping, administering, reporting on, and transferring money held in a deposit
account. Less fully appreciated are the various payment services performed outside a
deposit account relationship. These payment services fall into two basic types: securities
handling and credit cards.
Banks furnish a set of securities handling services to their corporate and
institutional customers, including pension funds, mutual funds, and endowments. These
services involve safekeeping, administering, reporting on, and transferring ownership and
settling trades of financial and real assets held in a trust department account. Additional
services are performed on behalf of an issuer of debt or equity securities. Because of the
essential similarities to deposit account services, we consider these trust department
4
Total assets at year-end 1996 is the criterion used to determine the twenty-five2
largest BHCs. Together the top twenty-five BHCs control almost two-thirds of totalassets held by all BHCs and a little more than half of all bank and thrift deposits.
services as part of the payments business. Likewise, because of the essential similarities
to payments initiated electronically from a deposit account, credit card transactions must
be counted among the payment services that banks perform for retail customers. In effect,
we are delineating payment services to encompass transferring money held in a deposit
account, transferring money and assets held in a custodial account, and transferring
money in accord with the terms of a credit agreement.
By developing a broad definition of payment services, we are making a sharper
distinction between payment and liquidity services. A bank’s liquidity services are viewed
as the production of liabilities that have certainty of value, are readily redeemable, and can
be converted into cash with small transactions costs. In this context, accepting time
deposits with maturities as short as seven days while holding nonmarketable assets
constitutes the production of liquidity services. At the same time, transaction services
involve more activities than just the actual transfer of currency or federal funds to execute
a Fedwire instruction, clear and settle a personal check, or meet a cash withdrawal at the
teller window. In the future, the definition of transaction services will probably need to be
expanded to comprise new systems that are currently under development or going through
market tests. These new systems include multi-purpose stored-value cards and electronic
forms of currency and checks for use over the Internet.
II. Data sources
Our starting point for assessing the importance of the payments business is
information on noninterest income conveyed through regulatory reporting. The supervisory
agencies collect data from BHCs through the Y9C report, which is filed quarterly. These
data show that the twenty-five largest BHCs earned a combined total of $62.4 billion of
noninterest income during 1996. (See the appendix for a list of the top twenty-five bank
holding companies. )2
Besides the total amount of noninterest income earned, a BHC records its
5
A seventh category, net realized gains on transactions involving held-to-3
maturity securities and available-for-sale securities, could be added. The gains madeon sales of securities held outside the trading account can be thought of as anadditional source of noninterest income. In fact, several BHCs include these securitiesgains in the figure for noninterest income they show in their annual reports.
The Y9C report provides additional information through a supplementary4
schedule on which a BHC identifies and records figures for its largest sources of “allother noninterest income.”
composition by following a schedule of six categories:3
(1) service charges on deposit accounts in domestic offices,
(2) income from fiduciary (trust department) activities,
(3) trading revenue,
(4) net gains from foreign currency transactions conducted outside the tradingaccount,
(5) other fee income, and
(6) all other noninterest income.4
For the twenty-five largest BHCs, table 1 shows the breakdown of noninterest income
among these six components. Out of total noninterest income, the group of BHCs
collected only $9.5 billion from fees on deposit accounts in domestic offices. At first
glance, it appears that the largest BHCs derive just 15.3 percent of noninterest income --
and a mere 6.8 percent of operating revenue -- from payment services.
Additional revenue from payment services
The amount recorded as “deposit account fees” understates the revenue derived
from payment services. According to the instructions to the filers of the Y9C report, this
category captures only those maintenance and activity fees that a bank collects directly
from an owner of a deposit account at the same bank. But a bank can receive
remuneration for payment services in three other ways and the associated revenues
appear in other categories of income.
(1) Some fees triggered by deposit account activity are not reported in thecategory “deposit account fees.”
6
See Bank for International Settlements, 1994, and Edwards and Eller, 1996.5
While banks are correctly following the instructions for filling out the schedule for
noninterest income, some activity fees wind up in the “other fee” category.
“Misclassifications” occur because it is not the account holder who actually pays the
activity fee, or it is not the bank providing the customer’s deposit account that collects the
activity fee.
(2) Some payment services are performed outside a deposit accountrelationship.
Some payment services are linked to a credit card account or a trust account instead of
a deposit account, or in some cases, the payment service is separate from any account
held at the bank. Thus banks do not report these revenues as “deposit account fees.”
(3) Compensation for payment services takes the form of net interestincome instead of noninterest income.
Banks receive a portion of their payment-related revenue as foregone interest on deposits
or extra interest on loans, not in the form of a fee, commission, or other charge to the
customer. This revenue would never appear on a schedule reporting noninterest income.
In sum, the figures collected quarterly for revenue earned through “fees on deposit
accounts” are potentially misleading. On the surface, the schedule for noninterest income
developed by supervisory agencies implies that this category represents the bulk of
payments-driven revenue. But the Y9C report delineates this category too narrowly to
capture all noninterest income earned from payment services, and by definition it does not
capture remuneration in the form of interest income.
Bank holding company annual reports
To measure the amount of payments-driven revenue earned by the largest BHCs,
we rely on information disclosed in their annual reports. During the past several years,
BHCs have taken significant steps to improve their financial disclosures. Their efforts5
have been made in concert with initiatives by the Securities and Exchange Commission,
the Financial Accounting Standards Board, the Federal Reserve System, and other
7
Some additional information on payments-related revenue can be extracted6
from line of business results disclosed in annual reports.
entities, both public and private, to promote advances in accounting, reporting, and
disclosure practices. Consequently, BHCs are providing more meaningful information on
sources of noninterest revenue as well as off-balance-sheet activities, risk measurement
and management methods, and results by line of business.
Particularly valuable to this study is detailed information on the business activities
that bring in noninterest income and the amounts earned. For example, the BankAmerica
Corporation shows figures on twenty categories of noninterest income in its annual report
and thereby names a source for 86 percent of its total noninterest income of $5.4 billion
(table 2). Similarly, the Chase Manhattan Corporation shows figures on twenty-one
categories and names a source for 88 percent of its $7.5 billion of noninterest income
(table 3). Both firms supplement quantitative disclosures with definitions and other
qualitative information. The combination of data and supporting material makes it possible
to estimate the amounts of payments-related revenue included in the categories “fiduciary
fees,” “other fee income,” and “all other noninterest income.”6
In preparing a disclosure, each BHC chooses categories that correspond to its main
sources of noninterest income. In addition, each BHC exercises its own judgment to
determine the types of information and level of detail that would help shareholders,
analysts, and others interested in understanding the performance of the company and its
strategy. Because each BHC has a different mix of business lines and makes an
independent judgment regarding what is genuinely useful, the formats of the disclosures
are not uniform across BHCs. Consequently, disclosures of noninterest income are not
strictly comparable across the industry, which imparts some imprecision to our estimates.
Furthermore, because each BHC is free to delineate its own set of categories, we
encounter an additional complication. The categories of noninterest income appearing in
an annual report do not necessarily bear a direct correspondence to categories defined
by the Y9C report. In several cases, a category used by a BHC spans categories
appearing in the Y9C report. Nevertheless, we believe that sufficient information can be
extracted from annual reports to serve the purpose of this study.
8
A card-issuing bank may assess fees on its own deposit account holders for7
use of an ATM or debit card, but this revenue would be recorded in “fees on deposit
III. Estimating the volume of payments-driven revenue
In this section, sources of payments-driven revenue are examined in the order they
appeared earlier. First, we estimate “missed” deposit account activity fees and fees for
payment services performed outside of a deposit account relationship. Then we measure
interest income earned as compensation for payment services. For some types of
payment services, the amount of revenue received is determined directly from the annual
reports by adding up figures shown for a specific category of noninterest income. For
other types, the amount earned is estimated by taking information on a subset of the
twenty-five BHCs and extrapolating a combined total for the group.
Deposit account fees placed in the “other fee” category
The figure reported for “deposit account fees” does not capture all the revenue that
a bank receives in the form of account maintenance and activity fees. In addition to those
fees that a bank collects directly from its own deposit account customers, a bank charges
fees for transactions initiated by customers of other banks or from the receivers of
payments. Examples of these sources of fee income include:
o Interchange and merchant discount fees generated by use of an off-
line debit card. A card-issuing bank collects an interchange fee from
a merchant, not from its customer who initiates the transaction. In
addition, the bank handling or “acquiring” a debit card transaction on
behalf of a merchant collects a discount fee from the merchant.
o Automatic teller machine (ATM) interchange fees and point-of-sale
(POS) interchange and acquirer fees. When a bank’s ATM is used by
a deposit account customer of another bank, the owner collects an
interchange fee from the card-issuing bank. Similarly, when a bank’s
POS device is used by a deposit account customer of another bank,
the owner collects both an interchange fee and a merchant’s fee for
handling the transaction.7

9
accounts” since a card-issuer collects directly from its customers.
A bank’s ATM surcharge fee usually applies only to customers of other banks, 8
but sometimes it applies to a bank’s own customers for use of certain off-site ATMs.
o ATM surcharge fees. These are fees imposed on users of a bank’s
ATM who are deposit account holders at another bank. 8
Although all large banks with retail operations collect revenue from ATM and POS
transactions, information on this type of noninterest income is relatively sparse in annual
reports. Only six of the twenty-three banks with substantial retail operations identify a
specific amount of revenue brought in by debit-ATM card transactions or electronic
banking. Although several others cite a rise in electronic banking fees to explain an
increase in noninterest income from the previous year, they simply record the revenue in
the residual subcategory “other fee income.” Among the BHCs that do disclose a specific
figure, these fees are on average equal to 28 percent of deposit account fees. To
approximate what the twenty-three BHCs earned in aggregate from electronic banking, we
assume that the other seventeen BHCs earn proportional amounts of revenue from fees
for electronic banking services. Therefore, we estimate that these fees came to $2.6
billion during 1996, a healthy supplement to the $9.5 billion of deposit account fees.
Banks may not be forthcoming about this source of revenue because they do not
want to draw attention to the amount they charge customers for electronic banking. The
industry has been criticized for setting what are said to be excessively high fees for basic
banking services and for electronic access. The public finds ATM surcharges to be
especially irksome because the installation of ATMs is supposed to cut operating
expenses and allow banks to lower, not raise, deposit account fees.
Credit card fees
As argued earlier, transactions executed through credit cards must be included
among the payment services performed for retail customers. But the dual nature of a
bank-issued general-purpose credit card, combining a source of credit with a means of
payment, makes it difficult to isolate the revenue earned specifically for transaction

10
It should be noted that the normal use of a charge card requires extensions of9
credit by the card-issuer. Because a merchant receives payment from a card-issuingbank well before a cardholder remits money to the card-issuer, extensions of credit area matter of course.
Credit card associations also collect a fee on each transaction to pay for10
promotional activities, fraud prevention, and arranging interbank settlements.
services. Nevertheless, we feel we can separate the revenues covering the cost of
payment services from the revenues covering the cost of credit.
A credit card essentially combines a charge card, whose balance must be paid in
full monthly, and a revolving line of credit. Keeping in mind the distinction between these9
two types of payment cards, it appears that nearly all of the noninterest revenue generated
by credit cards can be attributed to their use as a payment device rather than tapping a
credit line. In other words, noninterest revenue brought in by credit cards would still flow
to banks if the cards were transformed into charge cards and a customer made separate
arrangements to secure a revolving line of credit. We estimate credit card revenues under
this assumption.
Noninterest revenue derived from the use of credit cards is recorded in “other fees”
and takes several forms:
o Fees for handling transactions on behalf of merchants. A bank charges a merchant
for obtaining payment from a card-issuer and transferring funds into a deposit
account designated by the merchant.
o Fees for handling transactions on behalf of cardholders. A card-issuing bank
receives an interchange fee for settling a transaction with a merchant, extending
credit to a cardholder during the grace period, and supporting a cardholder’s
account. 10
o Fees for late payments, exceeding the account’s limit, and annual account
maintenance. A card-issuing bank collects these fees from cardholders.
A card-issuing bank may also earn fee income for servicing securitized credit card
receivables, but analysis of these revenues is deferred to the section dealing with interest
earned as compensation for payment services.
Among the twenty-five largest BHCs, twenty-two show an amount for credit card

11
One BHC shows a figure for credit card loans on the Y9C and not in its annual11
report, but the amount is trivial. The total of credit card loans shown in the Y9C report,however, is about 30 percent larger than the total obtained from the annual reports. One reason the Y9C figures are larger is that data are reported as of the end of theyear and are swollen during the holiday shopping season, whereas the annual reportfigures are usually an average for the year. Another reason is that the category used inthe Y9C report is defined to include not only credit cards but also other revolvingconsumer credit plans; the figures in the annual reports may refer strictly to creditcards. Finally, some of the largest credit card issuers bought portfolios from otherissuers over the course of the year.
This estimate could be on the low side because some credit card fees are not12
identified and are left out of the calculations. For example, one bank states that latefees and charges for exceeding one’s account limit are not recorded in “credit cardrevenue” but in an unspecified component of “other fee” category. On the other hand,estimated credit card fees may be too high because figures for merchant fees andinterchange fees could include revenue derived from debit card usage.
receivables outstanding. These loans, which appear on a bank’s balance sheet, totaled11
$101.6 billion for 1996. A larger amount, $156.1 billion, is reported for the group’s
combined managed credit card receivables, which includes securitized receivables.
Eighteen BHCs out of the twenty-two showing credit card loans disclose the amount of
noninterest revenue that comes specifically from credit cards. In four cases, however, the
figure includes an amount for servicing securitized receivables that cannot be broken out.
We will work with data on credit card fees provided by the fourteen BHCs that either
do not securitize any of their receivables or exclude revenue earned by servicing their
securitized receivables. These fourteen BHCs held $62.6 billion of credit card receivables
on their balance sheets and securitized an additional $25.8 billion of receivables. From
total managed receivables, they earned $3.1 billion of fee income, equal to 3.46 percent
of managed receivables. By applying this percentage to the total volume of managed
credit card receivables held by all twenty-five BHCs, we estimate that the group earned
a combined $5.4 billion from credit card fees, which is more than half as large as the $9.5
billion earned through fees on deposit accounts. Thus fees collected on credit card
transactions supplement deposit account fees nicely.12
Fee income for securities handling and other processing services

12
Other services offered through a trust department would include portfolio13
management, securities lending, and financial advice.
The securities handling services performed by a bank’s trust department can be
classified as:13
(1) Master trust and custody: acting as custodian or safekeeper, recordkeeper,
and administrator (involving disbursements, tax payments, and accounting
services) of securities and other assets, and providing trade execution,
settlement, cash management, foreign exchange execution, and information
services (including investment performance measurement and customized
reporting) for private pension plans, public pension plans, and institutional
trust funds.
(2) Global custody: acting as custodian for foreign assets, which requires
multicurrency reporting, accounting, and cash management.
(3) Corporate trust: acting as trustee, fiscal agent, paying agent, registrar, and
defeasance escrow agent for the issuer of bonds, commercial paper, or other
debt instruments.
(4) Stock transfer: acting as transfer agent and dividend paying agent for an
equity issuer. Mutual fund services are a type of stock transfer service.
In addition to securities processing, BHCs provide wholesale or institutional customers,
including depository institutions, other processing services through subsidiaries. These
include the processing of checks, airline coupons, remittances with their accompanying
documents, and ATM, POS, and credit card transactions.
Nineteen BHCs in the group state an amount of noninterest income earned by
handling securities and performing related services. (The others may earn some revenue
this way but do not disclose an amount.) Eight BHCs specialize in wholesale payment
services, produce them on a large scale, and earn more from these services than they do
from deposit account fees. Collectively for the nineteen BHCs, this business line brings
in $6.5 billion of noninterest revenue, almost three-quarters as large as deposit account
fees.
13
Corestates acknowledges implicit interest as compensation for payment14
services in its 1996 annual report: “Service charges on deposit accounts, paid in fees,decreased $0.7 million, or 0.3%, [to $243.7 million] in 1996, compared to an increase of$4.6 million, or 1.9%, in 1995. After adding the value of service charges paid throughthe maintenance of deposit balances by commercial and correspondent customers,which is included in net interest income, total service charge compensation for 1996was $470.4 million, up $19.6 million, or 4.4%, from 1995 reflecting growth in transactionvolume.” (page 39)
Studies of the demand for money also recognize the phenomenon of implicit15
interest on deposit accounts. They estimate the amount of implicit interest earned ondemand deposits for the purpose of calculating the opportunity cost of holding money.
Interest income earned in return for payment services
An estimate of payments-driven revenue that only takes noninterest income into
account understates the total amount of revenue brought in by payment services. This is
because a component of net interest income is actually compensation for a payment
service, not an extension of credit. Depositors compensate banks by foregoing interest
on their balances in addition to paying explicit account maintenance and activity fees.14
Customers earn no interest on demand deposits and earn below market rates on deposits
in NOW, savings, and money market accounts. Interest revenue substitutes for higher
explicit fees. In an analogous way, credit card customers compensate banks for
transactional services by paying interest on their balances that is above the cost of just the
loan. Again interest revenue substitutes for explicit maintenance and activity fees.
Therefore, to construct a comprehensive figure for the contribution of payment services
to operating revenue, the amount of net interest revenue generated by payment services
must be broken out of total net interest income.15
To estimate foregone interest on deposit accounts, we first assume that deposits
in all accounts that have payment capabilities, principally checkwriting privileges and
immediate remote withdrawal or transfer, implicitly earn the federal funds rate. We also
assume that the sum of foregone interest and explicit fees equals all maintenance and
activity costs incurred by a bank. Under these assumptions, the twenty-five BHCs earned
$15.5 billion of foregone interest on $295.5 billion of demand deposits and $13.3 billion
of foregone interest on deposits of $502.6 billion in NOW, money market, and conventional

14
Berger and Humphrey (1992) report comparable figures for all commercial16
banks. They estimate forgone interest on demand, savings, time, and other deposits tobe $41.9 billion in 1988, compared with $9.4 billion of fees on deposit accounts.
savings accounts. By comparison, the $28.8 billion of interest foregone is almost three
times as large as the fees collected on deposit accounts.16
Foregone interest from deposit accounts may seem extraordinarily large, but it must
cover the sizable expenses of running a bank’s branch network, whose primary purpose
is to handle the transaction needs of household and small business customers. In
analyzing banks’ retail operations, industry sources estimate that a large BHC bears
annual noninterest expenses at a typical branch on the order of $1 million to 1½ million:
half incurred at the branch itself and half at headquarters and centralized operating
facilities. If a branch holds $50 million of retail deposits, the implied noninterest expense
ratio is 2 to 3 percent of deposits. Some expenses are recovered by collecting fees on
deposit accounts and for ancillary services offered at the branch office. The remainder
must be recovered through foregone interest. Since no explicit interest is paid on demand
deposits, they earn a high rate of foregone interest (equal to the federal funds rate, which
averaged more than 5.00 percent during 1996), but they also have high maintenance and
activity expenses. Although they have lower maintenance and activity costs, savings,
money market, and NOW accounts bring in less foregone interest per dollar of deposit
because some interest is paid on balances held in these accounts.
Credit cards
As described above, foregone interest earned on deposits is calculated by applying
a market-based interest rate uniformly to all core deposits. A parallel calculation to
determine the extra interest revenue collected from credit card holders cannot be carried
out for two reasons. First, no readily observable consumer loan rate is available to serve
as a benchmark. Second, a benchmark rate would vary across households because some
are much better credit risks than others.
A substitute method is used to estimate the amount of extra interest paid on credit
card balances. It relies on information on revenue earned for servicing securitized credit

15
Issuers of charge cards cannot cover transactions costs by collecting interest17
as issuers of general-purpose credit cards can. This would seem to explain whycharge card issuers set higher annual fees and higher merchant discount fees thancredit card issuers.
These six BHCs hold nearly half of the top twenty-five BHCs’ combined credit18
card receivables. Individually, they securitized between 5 and 45 percent of their creditcard receivables. On average, they securitized 35 percent.
card receivables. In a securitization, most of the interest paid by cardholders passes to
the owner of the security, who funds the loans and bears the credit risk. A smaller portion
of the interest paid by cardholders is retained by the card-issuing bank. The card-issuer’s
revenue from securitized receivables is used to estimate the extra interest paid for
payment services rendered through the card. In other words, the retained portion of
interest paid is, in theory, the amount cardholders would be assessed in explicit activity
fees and maintenance charges on their accounts if interest were not used instead.17
Ten of the twenty-two BHCs offering credit card accounts securitized part of their
receivables. Six of these ten disclose detailed information on the volumes of their
securitization programs and the impact on net interest income, provisions for loan losses,
and noninterest revenue. On average, securitization reduces net interest income by an18
amount equal to 8.33 percent of the dollar volume securitized. More than half of this
reduction, 5.50 percent of the dollar volume securitized, reflects provisioning for loan
losses. The card-issuer pockets the remainder (plus a small residual), 3.05 percent, and
records it as noninterest income. It serves as our estimate of extra interest paid on all
credit card receivables. Applying the estimate of 3.05 percent to the entire $156.1 billion
of managed credit card receivables implies that the group of twenty-five BHCs collected
$4.8 billion of extra interest from cardholders as compensation for payment services.
Because extra interest paid on credit card balances is determined from a residual,
it is probable that our estimate captures more than just the interest paid to cover the costs
of performing payment services. The residual may pick up excess profits from credit card
operations, an implicit charge for the unused portion of a cardholder’s credit line, the cost
of maintaining a loan account, and compensation for any residual credit risk retained by
a card issuer. For this reason, it is proper to consider the estimate of $4.8 billion as the
16
Industry consultants have also prepared estimates of payment system19
revenues, but they have a wider scope than this study. Bowers and Devine (1995)placed total payment system revenues at $84 billion in 1993. This figure, however,appears to include all interest paid on credit card balances and mixes credit serviceswith payment services. The Bank Administration Institute and Payment Systems, Inc.,have completed a study, “Profiting from Change in the U.S. Payments System,”described by Chambliss and Taylor (1997), which estimates that the banking industry’sfee income from payment services was $22 billion in 1996 and interest income frompayment services was $78 billion. Their estimate of total payments-driven fee incomelooks low compared to ours, which is based on just the twenty-five largest BHCs. Theirinterest income figure appears to include all interest paid on credit card balances, andlikewise mixes credit services with payment services.
upper bound of extra interest paid by cardholders.
Summing up
By adding up all the pieces of revenue identified above, we find that payment
services contribute as much as $57.6 billion, or 41.1 percent, to the combined operating
revenue of $140.2 billion earned by the twenty-five largest BHCs (table 4). Payment
services bring in $24.0 billion in the form of fee income, which is a little less than 40
percent of the group’s combined noninterest income. A larger amount, between $28.8
billion and $33.6 billion, is received as interest revenue, accounting for 37.0 percent to
43.2 percent of the group’s combined net-net interest income. Among categories of
payment services, deposit accounts yield the most revenue, $40.9 billion, although only
$12.1 billion comes from service charges. Credit cards bring in between $5.4 billion and
$10.2 billion and securities handling and other processing services another $6.5 billion.19
The very substantial amount of revenue derived from payment services indicates
that their production and distribution constitute one of the main business activities of
commercial banks. The size of payments-related income also implies that lending
contributes less revenue than is commonly believed. The income from payment services
together with fee income from other non-credit services -- including insurance, securities
underwriting, brokerage, advisory services, equity investments, and portfolio management
-- may account for half or more of combined operating revenues. Income earned by
extending credit probably contributes the single largest share of operating revenue, but

17
Given the contribution that payments-related income makes to operating20
revenue, BHCs are taking substantial business risks whenever they make importantdecisions regarding the payments business. BHCs must decide which services to offerand on what scale, what hardware and software investments to make, whether toproduce in-house or outsource some aspects of these services, and which partners totake on in joint ventures. The business risks in the payments area have differentdimensions from those in lending or trading, but they are present nonetheless.
it is clearly an oversimplification to characterize banking organizations as financial
institutions that take in deposits in order to make loans.
The significance of payments-driven revenue helps explain the intense intra-
industry and inter-industry competition that has broken out in the payments area. Large
banks are working hard to promote electronic payments media despite projections of slow
consumer acceptance and uncertain cost effectiveness. The objective appears to be to
eventually take business away from competitors as well as create new demands for
transaction services. Furthermore, efforts to develop new payment systems are not only
an offensive maneuver, but also a defensive stratagem. The payments business has
attracted the attention of firms outside the industry, in particular, “technology” firms
committed to developing new payment systems. Banks are fighting to hold on to their20
position in the payments area and to keep nonfinancial firms from encroaching on this
essential business line.
IV. Implications
Surveys of research on financial intermediation highlight many interesting but
unresolved issues. This paper’s findings on the amount of revenue derived from payment
services point to three topics that deserve a fresh look: (1) the specification and
measurement of bank output, (2) the contribution of off-balance-sheet activities to bank
output and operating revenue, and (3) characteristics that distinguish commercial banks
from other financial intermediaries.
Measurement of banking output
It is often said that commercial banking is a service industry for which it is especially
troublesome to identify and measure output. One approach researchers take to this

18
problem is to stress a bank’s role as an intermediary between borrowers and savers and
measure output by the dollar volume of loans or assets recorded on the balance sheet.
Deposits are treated as an input. An intermediation approach is appealing for its simplicity
but is not congruent with the main findings of this paper. The vital contribution made by
payment services signifies that this approach to banking is too narrow, at least for the
group of institutions studied here.
Some researchers have taken a value-added approach instead, which in principle
can treat both asset and liability categories as outputs. This flexibility leads to a better
theoretical model of a banking firm because payment services can be recognized as
outputs. A value-added approach, however, may still be inadequate when put in practice.
Researchers generally conduct econometric studies by forming a short list of outputs; for
example, demand deposits, savings and small time deposits, real estate loans, commercial
and industrial loans, and consumer installment loans. Implicit in this specification is the
restriction that payment services are supplied in proportion to the volume of core deposits.
This constraint makes the value-added model too limiting, given the heterogeneity in both
the amount and mix of payment services produced by the top twenty-five BHCs.
The variation in payments-driven revenue across individual banks is highlighted in
table 5. The top twenty-five banking organizations are ranked in the table, not by size, but
by share of operating revenue contributed by the payments business. The bank that is
most dependent on the payment business earns three-quarters of its operating revenue
from this business line. The magnitude of payments-driven revenue at this bank reflects
its specialization in both credit cards and securities processing. Several other banks
among the top twenty-five also earn more than ten percent of their operating revenue from
either credit cards or securities processing. The outputs generating these revenues are
not highly correlated with the dollar volume of any asset or liability reported on the balance
sheet. Nor will these outputs be correlated with figures for categories of off-balance-sheet
instruments. Consequently, a value-added approach remains flawed even if more balance
sheet items or instrument categories are specified.
Against this background, studies of productivity, economies of scale and scope, and
the effects of consolidation and technological change look to be less reliable than

19
previously thought. Similarly, studies comparing the efficiency of banking organizations
look questionable. Their findings of high and variable degrees of inefficiency across a
sample of banks may actually reflect differences in the amount and mix of payment
services they produce. In addition, studies assessing the effects of investment in new
systems and equipment may not find efficiency gains if they occur predominantly in the
payments area and payment services are not recognized as bank outputs.
Importance of off-balance-sheet activities
Reacting to the growing contribution that noninterest income makes to operating
revenue, some researchers have sought to refine the measurement of bank output. They
have developed two methods of recognizing off-balance-sheet activities. The first takes
into account the credit exposure that off-balance-sheet instruments present to a bank. The
potential credit exposure from unused credit lines and other lending commitments and the
implicit credit exposure from interest rate swaps and other derivative contracts are added
to loans recorded on the balance sheet. The resulting quantity is interpreted as an
augmented measure of credit intermediation and bank output (Edwards and Mishkin,
1995). The second method treats off-balance-sheet instruments as a separate bank
output. The quantity of output embodied in off-balance-sheet instruments is approximated
by a volume of hypothetical on-balance-sheet loans -- the volume needed to yield net
interest income equal to a bank’s reported noninterest income. The volume of hypothetical
on-balance-sheet assets is then considered to be a component of bank output along with
volumes of loans and deposits (Clark and Siems, 1997).
Our review of noninterest income earned through payment services reveals that
both approaches are flawed. The problem with the first approach is that off-balance-sheet
instruments that present credit risk are not the main source of noninterest income. Many
other bank products besides derivative contracts and loan substitutes bring in noninterest
income and we have identified several of these as payment services. Consequently,
important outputs are still unrecognized, although adding off-balance-sheet credit
exposure to loan volumes may be a valid adjustment to make in pursuit of a
comprehensive measure of bank lending. The problem with the second approach is that

20
Three other BHCs disclose a figure that is not comprehensive but only covers21
fees earned from letters of credit and acceptances. Bank of Boston Corporation showsthat it earned $68 million from “letters of credit and acceptance fees” (5 percent of itstotal noninterest income); KeyCorp $16 million from “letters of credit fees” (1½ percentof its total noninterest income); and Wachovia Corporation $25 million from “bankersacceptances and letter of credit fees” (3 percent of its total noninterest income).
it assumes that all noninterest income is generated by off-balance-sheet instruments that
present credit risk. Converting all noninterest income earned into a balance-sheet-
equivalent volume of loans overstates lending and understates the size of other business
lines.
Derivative contracts and loan substitutes
Because a surprisingly large portion of noninterest income is payments-driven, the
contributions made by loan commitments and derivatives trading may be less than
generally assumed. To find the amount of revenue earned from these activities, we again
turn to BHC annual reports. Three BHCs among the largest twenty-five disclose a
comprehensive figure for fee income earned from off-balance-sheet forms of lending:
BankAmerica, Chase Manhattan, and J.P. Morgan. BankAmerica states that during 1996
it earned $345 million of noninterest income from fees collected for “off-balance-sheet
lending activities,” Chase Manhattan identifies $330 million from “letters of credit and
acceptances” and $120 million from “loan commitment fees,” and J.P. Morgan mentions
$156 million earned primarily from ”commitments to extend credit, standby letters of credit
and securities lending indemnifications.” The amounts disclosed represent, respectively,
6 percent, 6 percent, and 3 percent of each company’s total noninterest income. These21
small percentages indicate that off-balance-sheet credit instruments do not bring in
sufficient fee revenue to be a major factor behind the rising long-term trend in noninterest
income.
Measuring trading revenue is straightforward because figures are presented in
regulatory reports and shareholders’ annual reports. But BHCs do not typically separate
revenue earned by trading derivatives from revenue earned by trading conventional
securities. If we assume arbitrarily that half of total trading revenue is obtained from
21
In the course of reviewing the development of the U.S. payment system,22
Goodfriend (1991) explored reasons why “payment services and information-intensivelending have been provided jointly by the same set of institutions, i.e., banks.”
derivative contracts, the twenty-five BHCs earned almost $4 billion from dealing in off-
balance-sheet instruments. This represents 6 percent of total noninterest income earned
by the group. In light of the shares of noninterest income brought in by trading and loan
commitments, we conclude that the contribution that these off-balance-sheet activities
make to operating revenue has been exaggerated.
The essence of commercial banking
The sizable contribution made by payment services to the revenue stream of large
BHCs also leads us to reconsider the problem of delineating the essential features of
commercial banks. What is called for is an integrated theory of commercial banking, one
that explains why commercial banks provide payment services in large scale and that
identifies the characteristics needed to succeed in payment services as well as taking
deposits and intermediating credit. In an attempt to explain the coincidence of payment22
services and lending in a single financial intermediary, we offer the following solution: the
know-how required to succeed in the payments business is the ability to control losses
efficiently. Losses from payments activities can arise from fraud, operational glitches,
systemic breakdowns, and failures of counterparties to perform as obligated on account
of bankruptcy or other reasons. The skills necessary in the payments area encompass
both preventing losses and recovering funds in the event of a loss. This means that a
bank’s personnel must be able to prevent fraud, write contracts that offer legal protection,
assess credit risk, get back funds that should not have been sent out, and claim
compensation for damages. These skills would seem to carry over to the lending
business, where a bank must also know how to prevent losses and make recoveries. The
common set of skills required by these two business lines may be the explanation for the
fact that commercial banks provide both lending and payment services, which

22
Fama (1985) conjectured that a bank’s ability to view a firm’s deposit account23
activity is what gives it an edge over nonbank financial intermediaries, as well as otherbanks, in lending to holders of a deposit account at the same bank. Nakamura (1993)assembled quantitative information that supports the view that at least small bankshave an advantage owing to their handling of a loan applicant’s deposit accounts.
distinguishes banks from other classes of financial intermediaries.23
Conclusion
This paper set out to gauge the importance of the payments business to the banking
industry, measured in terms of the revenue that payment services generate. Our first step
was to set the limits of the payments area broadly to include not only deposit accounts, but
also securities processing and credit cards. We then turned to BHC annual reports to
supplement information collected through regulatory reporting on the revenues earned
from payment services.
By adding up all the pieces of fee income and interest income that is earned as
compensation for transactional services, we find that the payments business generates
between one-third and two-fifths of the combined operating revenue of the twenty-five
largest BHCs. Payment services thus make a significant and surprisingly large
contribution to the industry’s revenue stream.
Looking forward, the payments franchise may produce an even greater proportion
of banks’ operating income. First, if current trends persist, trading of financial instruments
will expand and banks will handle larger volumes of transactions and earn more fee
income. Second, as higher proportions of household-to-business and business-to-
business payments are converted to electronic formats, bank customers will make and
receive payments faster and more conveniently. For improved payment services, banks
should be able to raise their fees.
Based on the revenues they now yield, payment services constitute one of the
integral activities of the banking industry and are on an equal footing with credit services.
This means the production and distribution of payment services should be incorporated
in both theoretical and empirical research on the banking sector. By excluding payment
services in a model of a banking firm, a researcher may be overlooking one of its defining

23
characteristics.

24
Appendix
The twenty-five largest bank holding companies as of year-end 1996, measured by totalassets:
The Chase Manhattan CorporationCiticorpBankAmerica CorporationJ.P. Morgan & Company, IncorporatedNationsbank Corporation
First Union CorporationBankers Trust New York CorporationWells Fargo & CompanyFirst Chicago NBD CorporationBanc One Corporation
Fleet Financial Group, IncorporatedNorwest CorporationPNC Bank Corporation KeycorpBank of Boston Corporation
Bank of New York Company, IncorporatedSuntrust Banks, Incorporated Republic New York Corporation National City CorporationWachovia Corporation
Corestates Financial CorporationMellon Bank CorporationBarnett Banks, IncorporatedBoatmen’s Bancshares, IncorporatedFirst Bank System, Incorporated
25
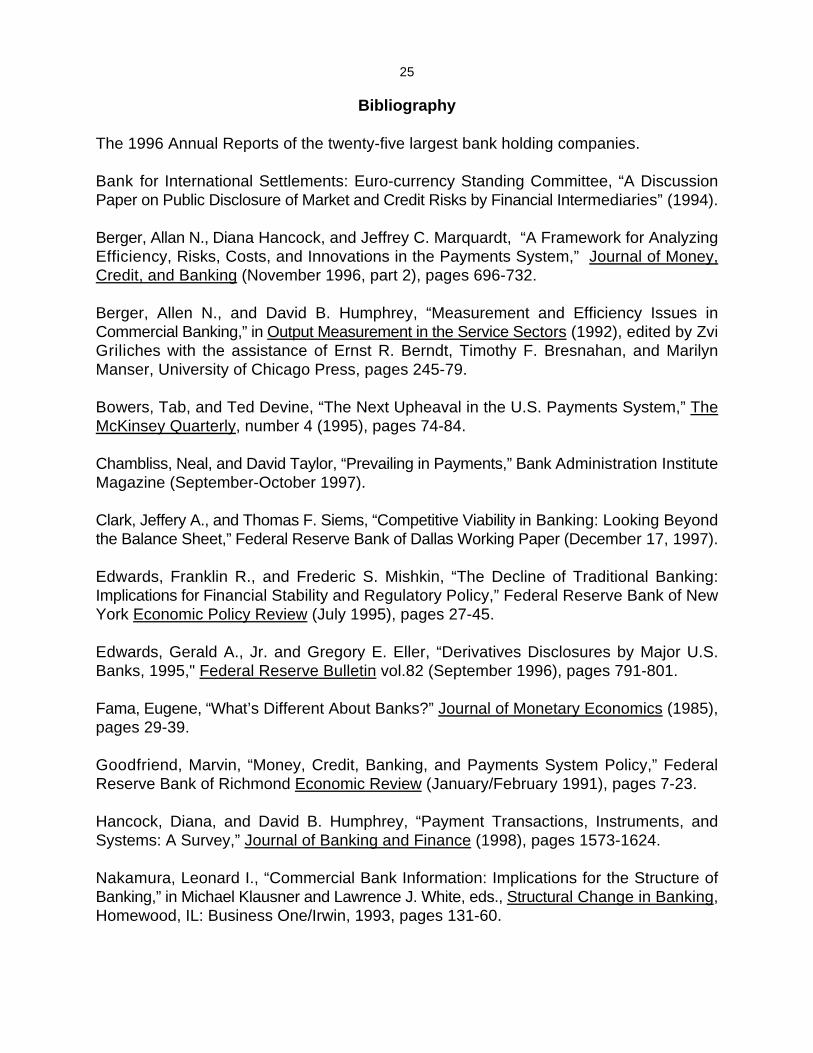
Bibliography
The 1996 Annual Reports of the twenty-five largest bank holding companies.
Bank for International Settlements: Euro-currency Standing Committee, “A DiscussionPaper on Public Disclosure of Market and Credit Risks by Financial Intermediaries” (1994).
Berger, Allan N., Diana Hancock, and Jeffrey C. Marquardt, “A Framework for AnalyzingEfficiency, Risks, Costs, and Innovations in the Payments System,” Journal of Money,Credit, and Banking (November 1996, part 2), pages 696-732.
Berger, Allen N., and David B. Humphrey, “Measurement and Efficiency Issues inCommercial Banking,” in Output Measurement in the Service Sectors (1992), edited by ZviGriliches with the assistance of Ernst R. Berndt, Timothy F. Bresnahan, and MarilynManser, University of Chicago Press, pages 245-79.
Bowers, Tab, and Ted Devine, “The Next Upheaval in the U.S. Payments System,” TheMcKinsey Quarterly, number 4 (1995), pages 74-84.
Chambliss, Neal, and David Taylor, “Prevailing in Payments,” Bank Administration InstituteMagazine (September-October 1997).
Clark, Jeffery A., and Thomas F. Siems, “Competitive Viability in Banking: Looking Beyondthe Balance Sheet,” Federal Reserve Bank of Dallas Working Paper (December 17, 1997).
Edwards, Franklin R., and Frederic S. Mishkin, “The Decline of Traditional Banking:Implications for Financial Stability and Regulatory Policy,” Federal Reserve Bank of NewYork Economic Policy Review (July 1995), pages 27-45.
Edwards, Gerald A., Jr. and Gregory E. Eller, “Derivatives Disclosures by Major U.S.Banks, 1995," Federal Reserve Bulletin vol.82 (September 1996), pages 791-801.
Fama, Eugene, “What’s Different About Banks?” Journal of Monetary Economics (1985),pages 29-39.
Goodfriend, Marvin, “Money, Credit, Banking, and Payments System Policy,” FederalReserve Bank of Richmond Economic Review (January/February 1991), pages 7-23.
Hancock, Diana, and David B. Humphrey, “Payment Transactions, Instruments, andSystems: A Survey,” Journal of Banking and Finance (1998), pages 1573-1624.
Nakamura, Leonard I., “Commercial Bank Information: Implications for the Structure ofBanking,” in Michael Klausner and Lawrence J. White, eds., Structural Change in Banking,Homewood, IL: Business One/Irwin, 1993, pages 131-60.
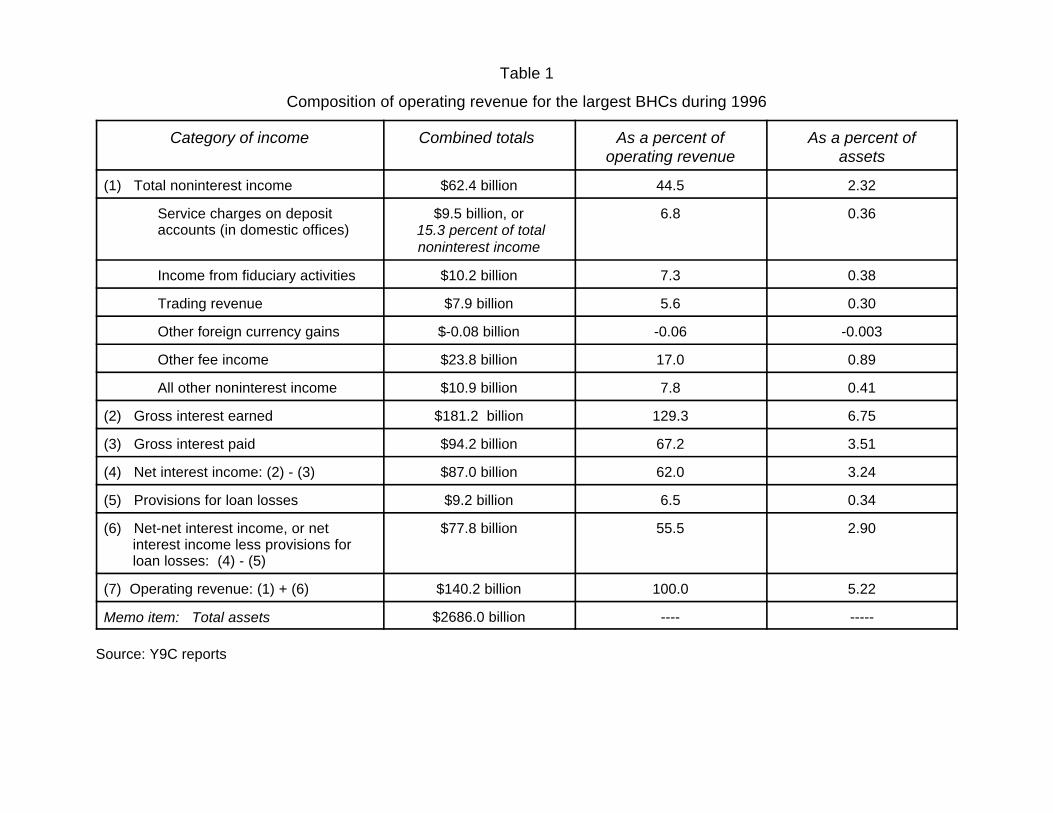
Table 1
Composition of operating revenue for the largest BHCs during 1996
Category of income Combined totals As a percent of As a percent ofoperating revenue assets
(1) Total noninterest income $62.4 billion 44.5 2.32
Service charges on deposit $9.5 billion, or 6.8 0.36 accounts (in domestic offices) 15.3 percent of total
noninterest income
Income from fiduciary activities $10.2 billion 7.3 0.38
Trading revenue $7.9 billion 5.6 0.30
Other foreign currency gains $-0.08 billion -0.06 -0.003
Other fee income $23.8 billion 17.0 0.89
All other noninterest income $10.9 billion 7.8 0.41
(2) Gross interest earned $181.2 billion 129.3 6.75
(3) Gross interest paid $94.2 billion 67.2 3.51
(4) Net interest income: (2) - (3) $87.0 billion 62.0 3.24
(5) Provisions for loan losses $9.2 billion 6.5 0.34
(6) Net-net interest income, or net $77.8 billion 55.5 2.90 interest income less provisions for loan losses: (4) - (5)
(7) Operating revenue: (1) + (6) $140.2 billion 100.0 5.22
Memo item: Total assets $2686.0 billion ---- -----
Source: Y9C reports
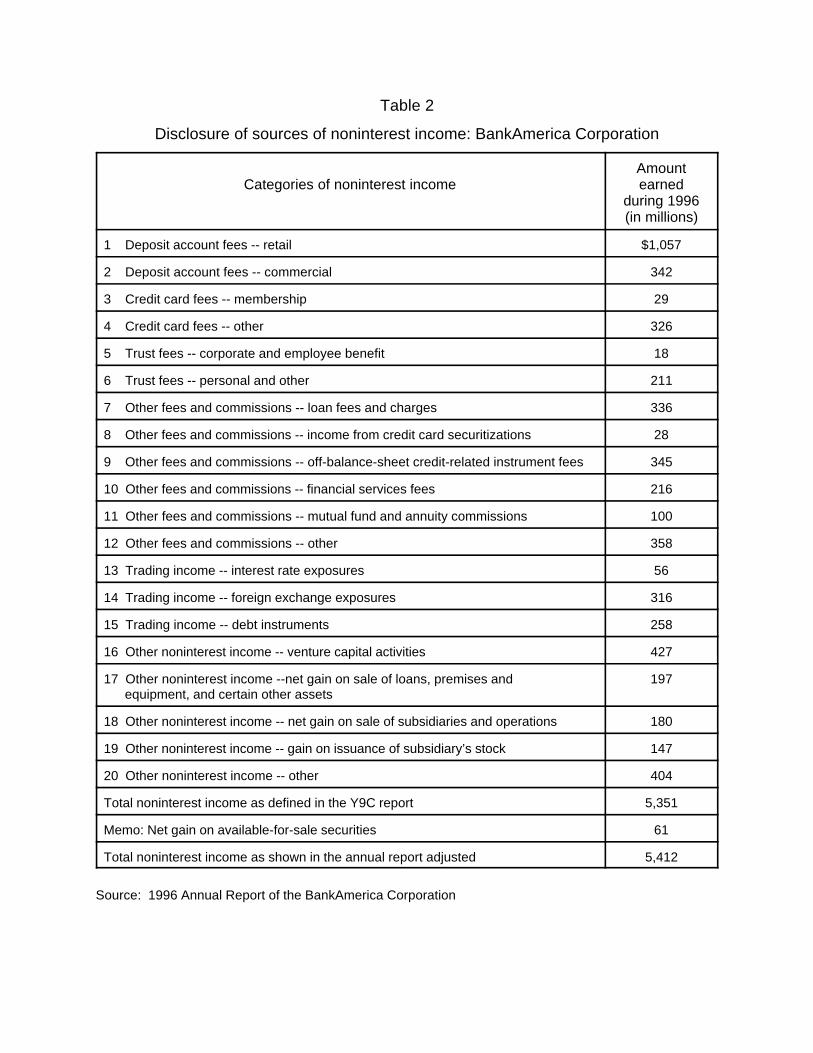
Table 2
Disclosure of sources of noninterest income: BankAmerica Corporation
Categories of noninterest income earnedAmount
during 1996(in millions)
1 Deposit account fees -- retail $1,057
2 Deposit account fees -- commercial 342
3 Credit card fees -- membership 29
4 Credit card fees -- other 326
5 Trust fees -- corporate and employee benefit 18
6 Trust fees -- personal and other 211
7 Other fees and commissions -- loan fees and charges 336
8 Other fees and commissions -- income from credit card securitizations 28
9 Other fees and commissions -- off-balance-sheet credit-related instrument fees 345
10 Other fees and commissions -- financial services fees 216
11 Other fees and commissions -- mutual fund and annuity commissions 100
12 Other fees and commissions -- other 358
13 Trading income -- interest rate exposures 56
14 Trading income -- foreign exchange exposures 316
15 Trading income -- debt instruments 258
16 Other noninterest income -- venture capital activities 427
17 Other noninterest income --net gain on sale of loans, premises and 197 equipment, and certain other assets
18 Other noninterest income -- net gain on sale of subsidiaries and operations 180
19 Other noninterest income -- gain on issuance of subsidiary’s stock 147
20 Other noninterest income -- other 404
Total noninterest income as defined in the Y9C report 5,351
Memo: Net gain on available-for-sale securities 61
Total noninterest income as shown in the annual report adjusted 5,412
Source: 1996 Annual Report of the BankAmerica Corporation

Table 3
Disclosure of sources of noninterest income: Chase Manhattan Corporation
Categories of noninterest income earnedAmount
during 1996(in millions)
1 Corporate finance and syndication fees $929
2 Trust, custody, and investment management fees 909
3 Mutual fund fees 83
4 Other trust fees 184
5 Credit card revenue -- from securitized receivables 318
6 Credit card revenue -- all other 745
7 Service charges on deposit accounts 394
8 Fees for other financial services -- commissions on letters of credit and 330 acceptances
9 Fees for other financial services -- fees in lieu of compensating balances 295
10 Fees for other financial services -- mortgage servicing fees 204
11 Fees for other financial services -- loan commitment fees 120
12 Fees for other financial services -- other fees 580
13 Trading income -- interest rate contracts 535
14 Trading income -- foreign exchange contracts 444
15 Trading income -- debt instruments and other 994
16 Other noninterest income -- gains from equity-related investments 726
17 Other noninterest income -- net losses on emerging market securities sales -80
18 Other noninterest income -- residential mortgage origination/sales activities 63
19 Other noninterest income -- loss on sale of a building in Japan -60
20 Other noninterest income -- from credit card securitizations 23
21 Other noninterest income -- all other revenue 344
Total noninterest income as defined in the Y9C report 7,477
Memo: Securities gains 135
Total noninterest income as shown in the annual report 7,512
Source: 1996 Annual Report of the Chase Manhattan Corporation
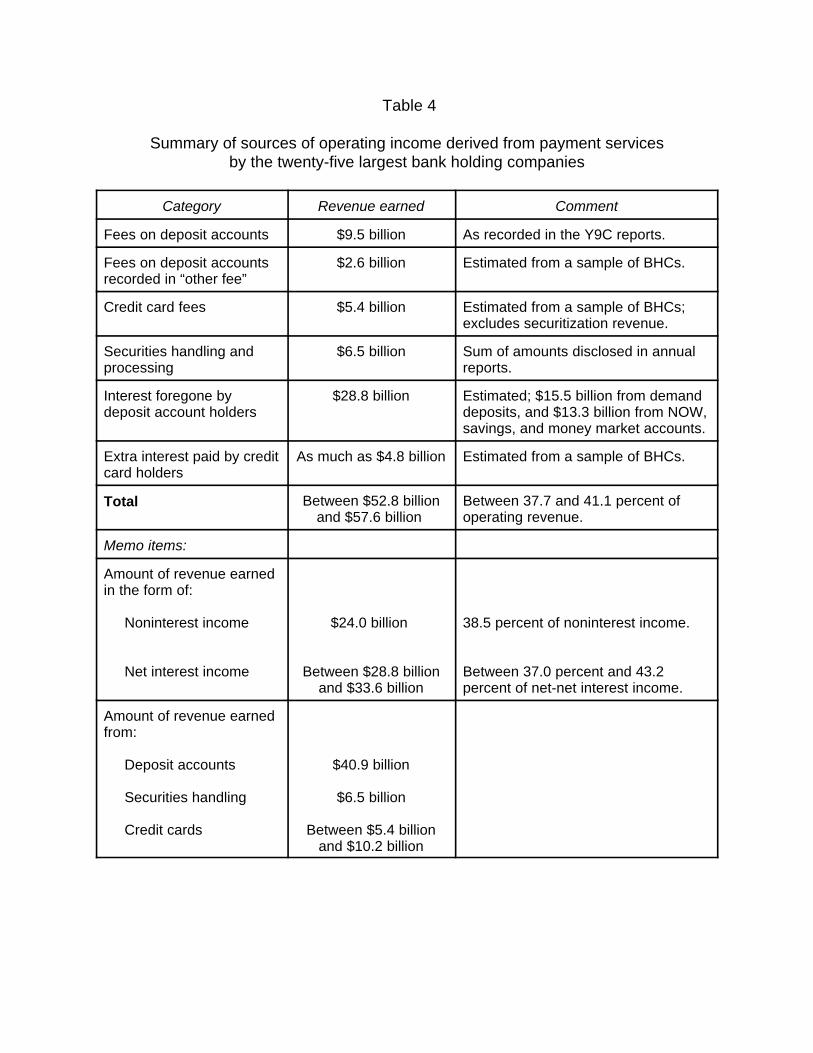
Table 4
Summary of sources of operating income derived from payment servicesby the twenty-five largest bank holding companies
Category Revenue earned Comment
Fees on deposit accounts $9.5 billion As recorded in the Y9C reports.
Fees on deposit accounts $2.6 billion Estimated from a sample of BHCs.recorded in “other fee”
Credit card fees $5.4 billion Estimated from a sample of BHCs;excludes securitization revenue.
Securities handling and $6.5 billion Sum of amounts disclosed in annualprocessing reports.
Interest foregone by $28.8 billion Estimated; $15.5 billion from demanddeposit account holders deposits, and $13.3 billion from NOW,
savings, and money market accounts.
Extra interest paid by credit As much as $4.8 billion Estimated from a sample of BHCs.card holders
Total Between $52.8 billion Between 37.7 and 41.1 percent ofand $57.6 billion operating revenue.
Memo items:
Amount of revenue earnedin the form of:
Noninterest income $24.0 billion 38.5 percent of noninterest income.
Net interest income Between $28.8 billion Between 37.0 percent and 43.2and $33.6 billion percent of net-net interest income.
Amount of revenue earnedfrom:
Deposit accounts $40.9 billion
Securities handling $6.5 billion
Credit cards Between $5.4 billionand $10.2 billion

Table 5
Sources of payments-driven revenue across bank holding companies
Top 25 BHCs Payments- Deposit Credit card Securities Operatingranked by driven account revenue as a processing revenueshare of revenue as a revenue as a percent of revenue as a (in billions)
payments- percent of percent of operating percent ofdriven operating operating revenue operating
revenues revenues revenue revenue
1 74.9 39.1 10.4 25.4 $3.42 58.3 33.5 22.0 2.8 5.23 56.1 40.2 3.6 12.3 3.04 54.9 40.4 14.5 ---- 2.25 49.6 44.7 4.8 0.1 6.7
6 49.0 39.5 3.7 5.8 2.87 47.6 34.7 12.9 ---- 6.28 47.4 43.3 4.1 ---- 2.59 46.8 40.2 5.9 0.7 9.4
10 46.1 31.8 6.7 7.6 2.6
11 44.4 21.0 10.4 13.0 14.812 44.0 29.1 4.4 10.6 3.313 43.5 41.0 2.5 ---- 2.514 43.4 37.4 6.0 ---- 6.915 42.5 37.9 3.9 0.7 5.3
16 42.4 37.8 4.4 0.1 13.617 39.7 37.5 1.7 0.5 2.318 37.6 32.6 2.0 3.1 3.819 37.0 32.3 3.1 1.6 3.820 33.9 12.6 15.3 6.0 18.3
21 33.0 29.9 2.6 0.6 3.622 29.3 26.4 1.7 1.2 5.923 28.4 7.9 0.0 20.5 3.924 20.3 20.3 0.0 ---- 1.425 4.5 1.9 0.0 2.6 6.8