August 6, 2020 - Seeking Alpha
50
August 6, 2020
Transcript of August 6, 2020 - Seeking Alpha

August 6, 2020

AGENDA
INTRODUCTION
BUSINESS UPDATE
FINANCIAL UPDATE
OPERATIONAL UPDATE
OUTLOOK
01
02
03
04
05
2

INTRODUCTION

MANAGEMENT FOCUSNAVIGATING TOWARD LONG-TERM SUCCESS
4

EXECUTE THROUGH COVID-19STORE FLEET LARGELY OPERATIONAL AT THE END OF Q2
0%
10%
20%
30%
40%
50%
60%
70%
80%
90%
100%
January: First stores in China closed
May:Business in Greater China
returned to growth
March: As stores in China re-opened,
Rest of World closed down
5
83%
17%
Illustrative.
January February March April May June0%
100%
50%
Open Closed
April:>70% of global store fleet
closed
June:Store fleet largely
operational

HEALTH AND SAFETY IN OUR STORESExecuting store re-opening in accordance with social distancing measures and local regulations
HEALTH AND SAFETY IN OUR OFFICESProviding workplace flexibility and safe in-office environment
SUPPLY CHAIN RESPONSIBILITYSupporting our supply chain partners and their workers through best-practice sharing
6
EXECUTE THROUGH COVID-19PROTECTING OUR PEOPLE, COMMUNITIES AND PARTNERS REMAINS TOP PRIORITY

HEALTH AND SPORTS EVEN MORE IMPORTANT TO CONSUMERSAround 50% of age group 18-34 plan to exercise more as a result of the coronavirus pandemic
FASHION SHIFT TOWARD ATHLEISURE SET TO ACCELERATE Around 75% of surveyed companies plan to shift employees to permanently remote positions post-coronavirus
FAST-FORWARD OF DIGITAL TRANSFORMATIONadidas digital sales penetration more than 1/3 in H1 when combining own e-com and partners’ online revenues
~
>
~
7
SHAPE STRUCTURAL TRENDSLONG-TERM INDUSTRY TRENDS SUPPORTING FUTURE GROWTH

8
CREATE LASTING CHANGE NOWWE ARE A DIVERSE COMPANY WITH ZERO TOLERANCE FOR DISCRIMINATION AND RACISM
Around 90% of our employees hold international passports
Employees from more than 100 nations work at the company’s global HQ
Women represent 34% of management positions globally
>
~

COMMITMENTS GLOBALLY
WE INVEST $ 120 MILLION IN OUR BLACK COMMUNITIES OVER 5 YEARS
We increase funding for our programs that support, empower and elevate the Black community
WE INVEST IN UNIVERSITY SCHOLARSHIPS
We finance 50 scholarships each year for Black students at partner schools
WE INCREASE THE DIVERSITY OF OUR EMPLOYEES
We fill a minimum of 30% of all new positions in the US with Black and Latinx people and target 12% leadership representation by 2025
WE MAKE JUNETEENTH A PAID HOLIDAY
Our offices, distribution centers and retail stores will be closed onJune 19 to commemorate the end of slavery in the United States
COMMITMENTS IN THE UNITED STATES
9
CREATE LASTING CHANGE NOWCOMMITMENTS TO DRIVE FURTHER CHANGE
WE ESTABLISH A COMMITTEE TO ACCELERATE INCLUSION & EQUALITY
Committee to focus on advancement of underrepresented groups; sponsored by the CEO and consisting of diverse representatives
WE STRENGTHEN OUR GLOBAL ANTI-DISCRIMINATION POLICY
Independent third-party firm to govern the investigation of cases; strict non-retaliation policy to protect employees that report violations
WE REFORM OUR HIRING AND CAREER DEVELOPMENT PROCESSES
Removing hiring bias, increasing representation and oversight;new mentoring and talent programs for Black and Latinx employees
WE CELEBRATE DIVERSITY
Celebrating Black History Month, Lunar New Year, International Women’s Day, Pride, Hispanic Heritage Month and Diwali, among others

BUSINESS UPDATE
CONSUMER HIGHLIGHTS Q2 2020
11

GREATER CHINA RECOVERY AHEAD OF INITIAL PLAN
Return to growth in May paving the way for flat quarter
GROSS MARGIN FACING HEADWINDS
From promotional activity, adverse FX and inventory allowances −
−INVENTORIES REACHING EXPECTED PEAK LEVEL DURING Q2
Plans to manage down inventories toward year-end in place
DTC BUSINESS UP SLIGHTLY DUE TO DIGITAL ACCELERATION
Exceptional growth in e-com compensates for store closures
+ − NORTH AMERICA LAGGING BEHIND OTHER MAJOR MARKETS
Store fleet not yet fully operational due to external developments
+
FINANCIAL FLEXIBILITY SAFEGUARDED
Through disciplined cash and cost management+
IMPACTFUL CONSUMER MARKETING AND PRODUCT LAUNCHES
Despite lockdowns and store closures in most parts of the world+
PROFITABILITY IN NEGATIVE TERRITORY
Due to revenue shortfall and coronavirus-related charges−
STRENGTHS & WEAKNESSESQ2 2020
12
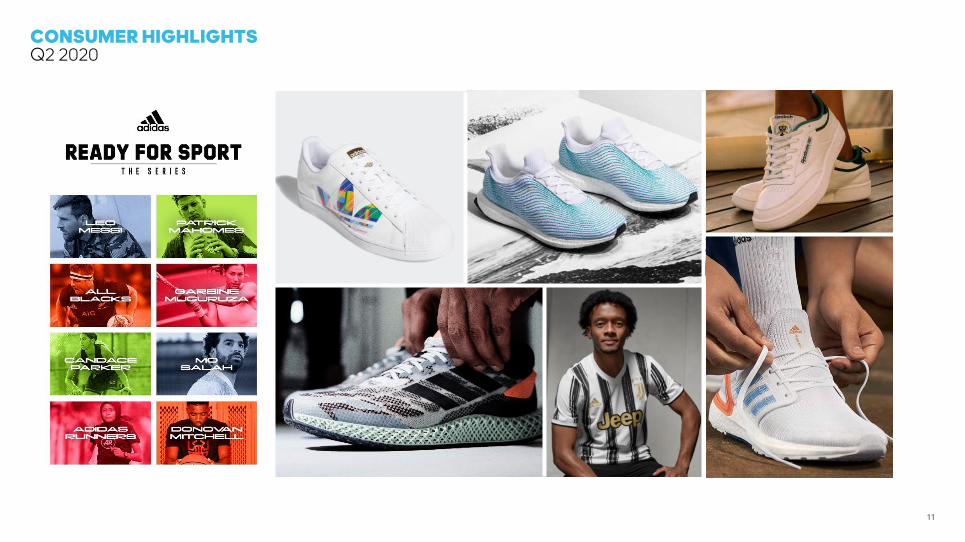
P&L AT A GLANCEQ2 2020
REVENUES DECREASE 34% CURRENCY-NEUTRALAnd 35% in euro terms to € 3.579 billion
GROSS MARGIN DOWN 2.4PP TO 51.0%Headwinds from promotional activity, adverse FX and inventory allowances
OPERATING LOSS OF € 333 MILLIONDue to revenue shortfall and coronavirus-related charges
NET LOSS FROM CONTINUING OPERATIONSOf € 306 million
BASIC EPS FROM CONTINUING OPERATIONSOf negative € 1.45
1313

STRATEGIC GROWTH AREASQ2 2020
Currency-neutral. 14
ADIDAS NORTH AMERICADespite triple-digit e-com growth
E-COMMERCETriple-digit growth in April and May
GREATER CHINADouble-digit growth in May and June

ADIDAS AND REEBOK BRAND PERFORMANCEMORE PRONOUNCED DECLINE FOR REEBOK DUE TO HIGHER NORTH AMERICA EXPOSURE
Currency-neutral. 15
% %
REEBOK REVENUESADIDAS REVENUES

FINANCIAL UPDATE

REVENUE GROWTH BY MARKET SEGMENTCORONAVIRUS HAD A GLOBAL IMPACT IN Q2
-38%
Net sales development currency-neutral. 17
Operating margin: -1.8% (-13.2pp)
-64%Operating margin: -10.5% (-25.1pp)
Operating margin: -21.2% (-49.7pp)
-16%Operating margin: 31.0% (-3.9pp)
-34%Operating margin: 24.0% (-2.3pp)
-40%Operating margin: 2.7% (-22.5pp)
-60%

P&L OVERVIEWQ2 RESULTS REFLECT MATERIAL NEGATIVE CORONAVIRUS IMPACT
NET SALES
GROSS MARGIN
OTHER OPERATING EXPENSES
(in % of sales)
Q2 2020 Q2 2019 Y-O-Y
5,509 -35%3,579
53.5%51.0% -2.4pp
2,3462,189 -7%
42.6%61.1% +18.6pp
(€ in millions)
OPERATING MARGIN
-333 n.a.643OPERATING LOSS/PROFIT
11.7%-9.3% -21.0pp
MARKETING AND POINT-OF-SALE EXPENSES
-306 n.a.462NET LOSS/INCOME from continuing operations
-1.45 n.a.2.33BASIC EPS from continuing operations (€)
OPERATING OVERHEAD EXPENSES
(in % of sales)
(in % of sales)
744560 -25%
13.5%15.6% +2.1pp
1,6021,628 +2%
29.1%45.5% +16.4pp
18
Underlying decline more than offset by business-driven and coronavirus-related increases
– details on separate slide
Slight increase when excluding inventory allowances
– details on separate slide
Including negative impact of around € 250 million* due to
coronavirus-related costs
*Reflecting the combined impact from the increase in inventory and bad debt allowances as well as the impairment of retail stores and the Reebok trademark.

GROSS MARGIN DEVELOPMENT DECOMPOSEDSLIGHT INCREASE WHEN EXCLUDING INVENTORY ALLOWANCES
19
Gross marginQ2 2019
Channel & market mix
Gross margin Q2 2020
53.5%
51.0%
Sourcing & Other
FX impact
Inventory allowances
Pricing mix
Illustrative.

OVERHEAD COST DEVELOPMENT DECOMPOSEDDOUBLE-DIGIT UNDERLYING DECLINE MASKED BY E-COM GROWTH AND CORONAVIRUS-RELATED COSTS
20
€ in billions
OOHQ2 2019
Underlying decline
OOH Q2 2020
1.6 1.6
Business-driven
Coronavirus-related
1
2
3
DECOMPOSITIONQ2 OOH DEVELOPMENT
Underlying decline resulting from tactical measures
▪ T&E as well as other discretionary spend reduced materially
▪ Personnel expenses down despite largely stable headcount
▪ Reduction and delay of retail expansion as well as IT projects
1
Business-driven increase
▪ Support of exceptional e-com growth
▪ Volume-driven increase of logistics and freight costs
Coronavirus-related increase
▪ Impairment of retail stores and Reebok trademark
▪ Higher bad debt allowances
2
3
Illustrative.

NET DEBT AND EQUITY POSITIONNET DEBT INCREASES BY € 1,154 MILLION YEAR-ON-YEAR
21(Net debt)/net cash at quarter-end, € in millions.
-1.028
-735
89
362
-792
Q2/16 Q2/17 Q2/18 Q2/19 Q2/20
-1,154
Net debt
At € 792 million
Equity position
At € 6,230 million
Equity ratio
At 30.7%
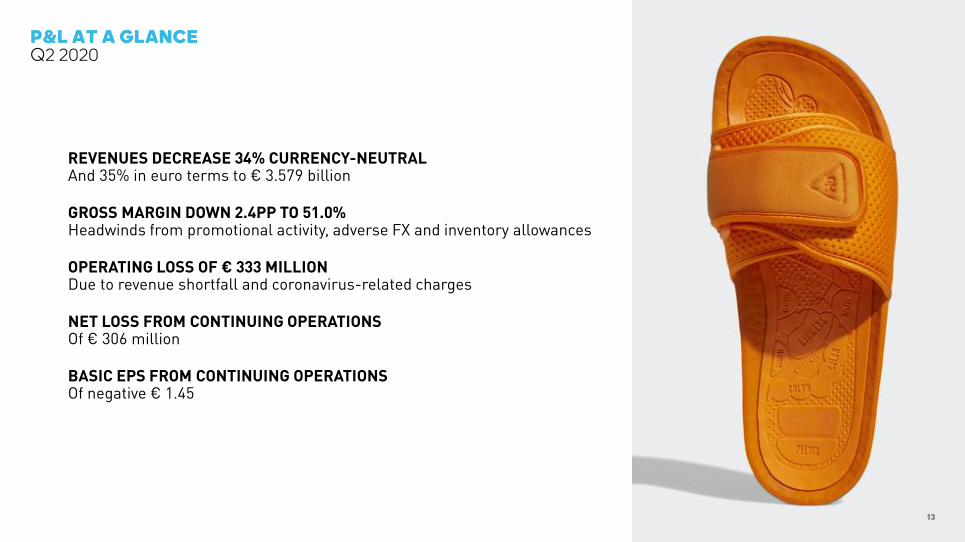
21,4%
20,4%20,1%
18,3%
21,5%
Q2/16 Q2/17 Q2/18 Q2/19 Q2/20
Average operating working capital = sum of operating working capital at quarter-end / 4.
AVERAGE OPERATING WORKING CAPITALEFFECTIVE CASH MEASURES PARTLY OFFSET INVENTORY INCREASE
Receivables down 31% c.n. year-on-year
Execution of cash measures and fewer shipments
Payables up 23% c.n. year-on-year
Reflecting measures to manage cash outflows
22
Inventories up 49% c.n. year-on-year
Plans to manage down toward year-end in place
+3.3PP
OPERATIONAL UPDATE

24
EXECUTE THROUGH COVID-19STRIKING THE BALANCE BETWEEN SHORT AND LONG TERM
1 2 3 4
Dec 2019 Q2 2020
Normalized level
Peak level
Dec 2020
25
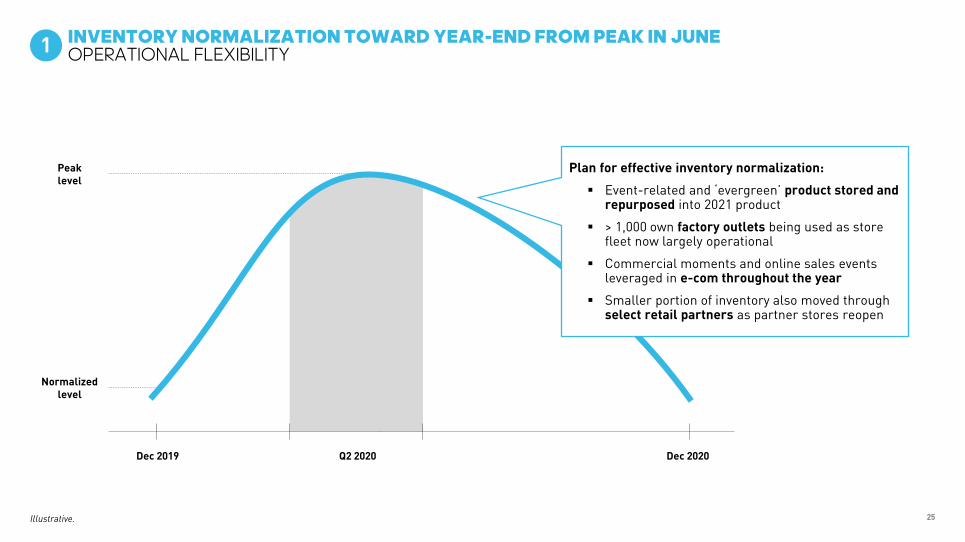
INVENTORY NORMALIZATION TOWARD YEAR-END FROM PEAK IN JUNEOPERATIONAL FLEXIBILITY
Illustrative.
1
Plan for effective inventory normalization:
▪ Event-related and ‘evergreen’ product stored and repurposed into 2021 product
▪ > 1,000 own factory outlets being used as store fleet now largely operational
▪ Commercial moments and online sales events leveraged in e-com throughout the year
▪ Smaller portion of inventory also moved through select retail partners as partner stores reopen

FLEXIBLY DRIVING OUR PRODUCT PIPELINEOPERATIONAL FLEXIBILITY
26
1

27
Reduce
outflows
Increase
inflows
Additional
financing
▪ Push e-com
▪ Prioritize China and other open markets
▪ Intensify credit collection efforts
▪ Trade payables: proactive adjustment of order book
▪ OPEX: cut discretionary spend, reduce management compensation, make use of short-time working, cancel marketing activities
▪ CAPEX: stop retail expansion/remodeling, IT projects
▪ Draw committed and uncommitted credit lines
▪ Repatriate cash from foreign entities
▪ Bridge financing through KfW syndicated loan
SHORT-TERM CASH MEASURES FINANCIAL FLEXIBILITY2

28
NO OPERATING CASH OUTFLOW IN Q2 DESPITE MATERIAL NET SALES DECLINEFINANCIAL FLEXIBILITY2
Illustrative.
-1.1-0.8
-1.9
0
Q1 Q2
Net sales change year-on-year
Net cash (used in) / generated from operating activities
No operating cash outflow in Q2 thanks to execution of cost
and cash measures
€ in billions

29
Total cash March 31, 2020
Operating cashflowTotal cash
June 30, 2020
-0.1
2.0 2.0
Investing cashflow
€ in billions
0
0.1
Financing cashflow
CASH POSITION STABLE AT € 2.0 BILLIONFINANCIAL FLEXIBILITY2
30
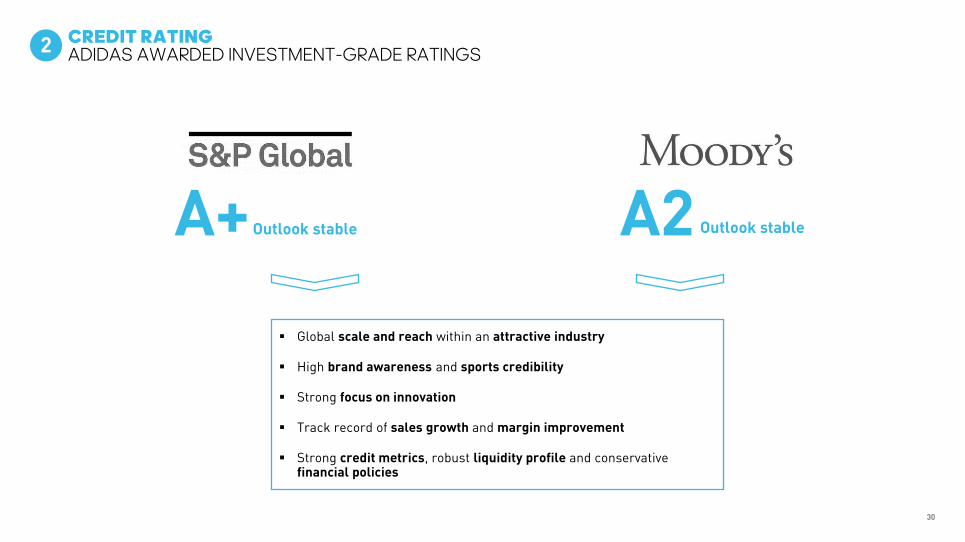
CREDIT RATINGADIDAS AWARDED INVESTMENT-GRADE RATINGS2
A+Outlook stable A2 Outlook stable
▪ Global scale and reach within an attractive industry
▪ High brand awareness and sports credibility
▪ Strong focus on innovation
▪ Track record of sales growth and margin improvement
▪ Strong credit metrics, robust liquidity profile and conservative financial policies

DIGITAL BRAND BUILDING DRIVES COMMERCIAL SUCCESSDIGITAL OPPORTUNITIES
31
3
BRAND-BUILDING PLATFORMS COMMERCIAL PLATFORMS
AD
IDA
S A
PP
CR
EA
TO
RS
CL
UB
>50% sales growthin the adidas app
in 2020 so far
>4x >50% of online salesthrough Creators Club
members
>60%
SO
CIA
L M
ED
IA
RU
NN
ING
& T
RA
ININ
G A
PP
>50% video viewsfor the #hometeam
campaign
~400m >50% Training app usage more than tripled in March-May with
>90% organic traffic
>3x
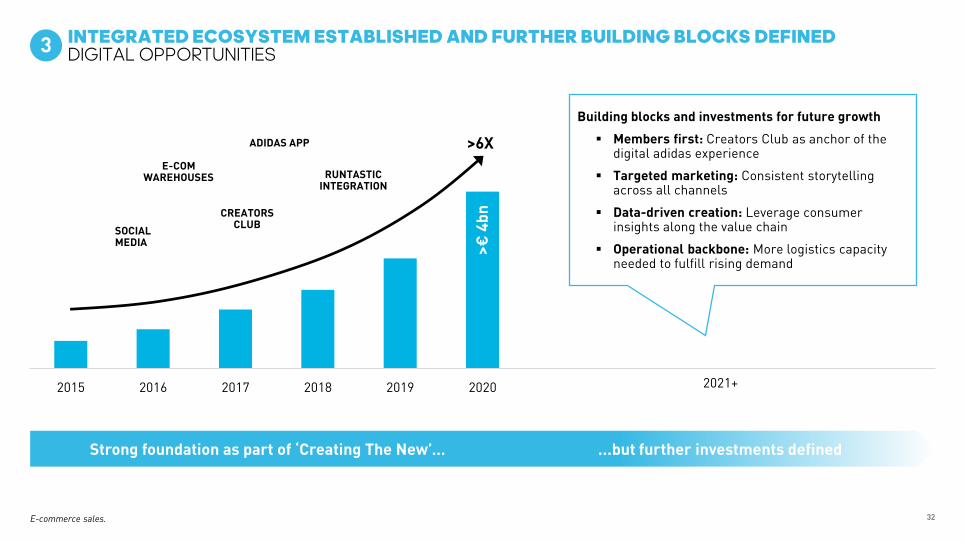
INTEGRATED ECOSYSTEM ESTABLISHED AND FURTHER BUILDING BLOCKS DEFINEDDIGITAL OPPORTUNITIES
32
3
E-commerce sales.
2015 2016 2017 2018 2019 2020 2021+
Strong foundation as part of ‘Creating The New’… ...but further investments defined
>€
4b
n
>6X
Building blocks and investments for future growth
▪ Members first: Creators Club as anchor of the digital adidas experience
▪ Targeted marketing: Consistent storytelling across all channels
▪ Data-driven creation: Leverage consumer insights along the value chain
▪ Operational backbone: More logistics capacity needed to fulfill rising demand
ADIDAS APP
RUNTASTICINTEGRATION
CREATORSCLUB
E-COMWAREHOUSES
SOCIALMEDIA

COMMERCIALIZING DIGITAL CAPABILITIES THROUGH RAPID CREATIONDIGITAL OPPORTUNITIES3
33

WINNING WITH THE WINNERS THROUGH DIGITAL SELL-IN PROCESS DIGITAL OPPORTUNITIES
34
3

35
92%
8%
January February March April May July
STORE OPENING TREND POSITIVE THROUGHOUT JULYRETAIL RECOVERY4
June
July:Positive store opening trend
throughout July
Open Closed
0%
100%
50%
January: First stores in China closed
May:Business in Greater China
returned to growth
March: As stores in China re-opened,
Rest of World closed down
April:>70% of global store fleet
closed
June:Store fleet largely
operational
Illustrative.

OWN RETAIL TRAFFIC AND CONVERSION TRENDRETAIL RECOVERY
36
4
ASIA-PACIFIC EUROPE NORTH AMERICA
Jan Feb Mar Apr May Jun Jan Feb Mar Apr May Jun Jan Feb Mar Apr May Jun
Conversion rate vs. PY (%) Traffic vs. PY (%)
Illustrative.

OUTLOOK
38
RDY

39RUNNING

OUTDOOR 40

41
CLUBS

ZX 2K BOOST 42

43
HYPE

44
SUPERSTAR
CLEAN CLASSICS
45

REEBOK
46
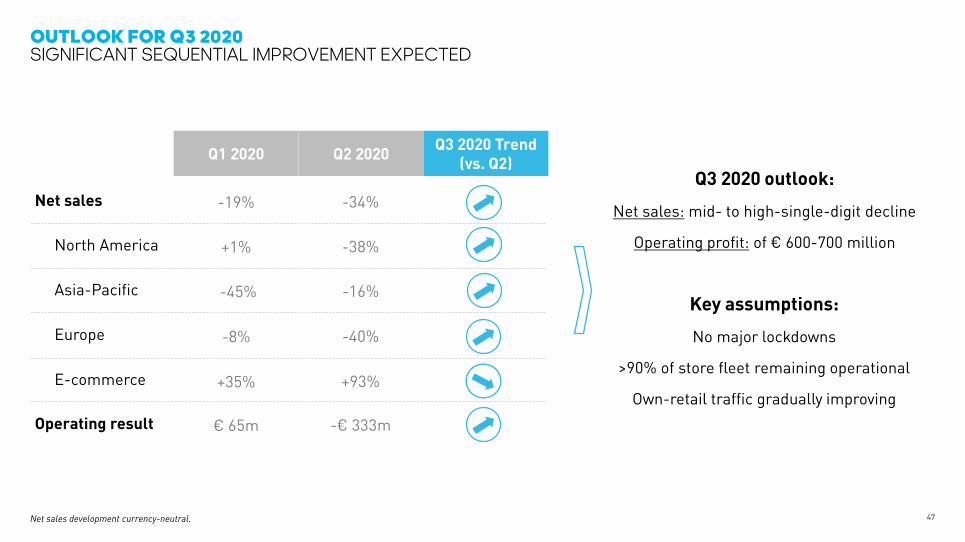
OUTLOOK FOR Q3 2020SIGNIFICANT SEQUENTIAL IMPROVEMENT EXPECTED
47
Key assumptions:
No major lockdowns
>90% of store fleet remaining operational
Own-retail traffic gradually improving
Q1 2020
Net sales
North America
Asia-Pacific
Europe
-19%
+1%
-45%
-8%
+35%
Q2 2020Q3 2020 Trend
(vs. Q2)
-34%
-38%
-16%
-40%
+93%
Operating result € 65m -€ 333m
E-commerce
Q3 2020 outlook:
Net sales: mid- to high-single-digit decline
Operating profit: of € 600-700 million
Net sales development currency-neutral.

48
-19%
0.1
-34%
-0.3
Net sales change year-on-year currency-neutral
Operating profit
OUTLOOK FOR Q3 2020RETURN TO DOUBLE-DIGIT OPERATING MARGIN IN Q3 IMPLIED
€ in billions
Mid- to high-single-digit decline
€ 600-700 million
Q1 Q2 Q3
Improvement of around € 1.0 billion

Sufficient short-term flexibility to keep navigating to long-term success
Exceptional growth in e-com enabled by integrated digital ecosystem
Shaping structural sport and lifestyle trends amplified by the pandemic
Business normalization on track with store fleet now largely operational
Creating lasting change for diversity and inclusion now
2
3
4
5
1
49
SUMMARY

Q&A