APPLICATION OF GRAVIMETRY AND ELECTRIC TOMOGRAPHY METHODS ... · application of gravimetry and...
12
73 EARTH SCIENCES RESEARCH JOURNAL Earth Sci. Res. J. Vol. 9, No. 2 (Dec. 2005): 73-84 APPLICATION OF GRAVIMETRY AND ELECTRIC TOMOGRAPHY METHODS TO OBTAIN STRATIGRAFIC PROFILES: CASE STUDY AT UNIVERSITY OF QUINDÍO AND PUERTO ESPEJO AREA, ARMENIA-COLOMBIA Erika Cristina Jaramillo Giraldo 1 , Ximena Vega Manchola 1 and Hugo Monsalve Jaramillo 1 1 Centro de Estudios e Investigaciones de la Facultad de Ingeniería (Research Center at University of Quindío)- CEIFI, Quimbaya Group e-mail: [email protected] - e-mail: [email protected]. RESUMEN Se describe la metodología usada para desarrollar campañas geofísicas de resistividad y gravimetría aplicadas al subsuelo. Estos son métodos totalmente indirectos cuyo propósito es determinar los contrastes de densidad y resistividad en el subsuelo, para relacionarlas con los diferentes tipos de suelos en las áreas de estudio, localizadas al sur y norte de la ciudad de Armenia-Quindío (Puerto Espejo y Universidad del Quindío respectivamente), para determinar la geometría de perfiles longitudinales basados en pozos geotécnicos existentes los cuales solo proveen información unidimensional. La importancia del subsuelo es analizada usando métodos eléctricos de resistividad y gravimetría en proyectos de ingeniería civil. Los factores más importantes que influencian los cambios en la resistividad eléctrica y valores gravimétricos para diferentes materiales geológicos también son analizados, así como los rangos de variación de estos valores, dependiendo de las condiciones climáticas y la formación de capas en cada área de estudio. Para la tomografía eléctrica, se usa el arreglo electródico Wenner-Schlumberger debido a su alta resolución vertical y horizontal. Para el método gravimétrico, se usa la técnica microgravimétrica porque permite mayor detalle en capas superficiales del subsuelo. Los resultados obtenidos son presentados en perfiles eléctricos y gravimétricos en Puerto Espejo y la Universidad del Quindío, los cuales fueron útiles como parámetros de calibración de los rangos de resistividad y gravimetría para los tipos de suelos encontrados en estas áreas de Colombia, dependiendo también de los factores de humedad y temperatura. El análisis y discusión de los resultados es lo que finalmente permite obtener conclusiones, importante para la escogencia de métodos de exploración geofísica como una alternativa para familiarizarse con las estructuras localizadas en el subsuelo. Palabras clave: Gravimetría, tomografía eléctrica, perfiles estratigráficos, abanico volcaniclástico, escarpe, Armenia (Colombia). ABSTRACT The methodology used to develop resistivity and gravimetry geophysical surveying applied to the sub-surface is described. These are totally indirect methods whose purpose is to determine the density and resistivity (Manuscript received May 2005, Paper accepted October 2005)
Transcript of APPLICATION OF GRAVIMETRY AND ELECTRIC TOMOGRAPHY METHODS ... · application of gravimetry and...

73
EARTH SCIENCES RESEARCH JOURNAL
Earth Sci. Res. J. Vol. 9, No. 2 (Dec. 2005): 73-84
APPLICATION OF GRAVIMETRY AND ELECTRIC TOMOGRAPHY METHODS TO OBTAIN STRATIGRAFIC PROFILES: CASE STUDY AT UNIVERSITY OF QUINDÍO
AND PUERTO ESPEJO AREA, ARMENIA-COLOMBIA
Erika Cristina Jaramillo Giraldo1, Ximena Vega Manchola1 and Hugo Monsalve Jaramillo1
1Centro de Estudios e Investigaciones de la Facultad de Ingeniería (Research Center at University of Quindío)- CEIFI, Quimbaya Group
e-mail: [email protected] - e-mail: [email protected].
RESUMEN
Se describe la metodología usada para desarrollar campañas geofísicas de resistividad y gravimetría aplicadas al subsuelo. Estos son métodos totalmente indirectos cuyo propósito es determinar los contrastes de densidad y resistividad en el subsuelo, para relacionarlas con los diferentes tipos de suelos en las áreas de estudio, localizadas al sur y norte de la ciudad de Armenia-Quindío (Puerto Espejo y Universidad del Quindío respectivamente), para determinar la geometría de perfiles longitudinales basados en pozos geotécnicos existentes los cuales solo proveen información unidimensional. La importancia del subsuelo es analizada usando métodos eléctricos de resistividad y gravimetría en proyectos de ingeniería civil. Los factores más importantes que influencian los cambios en la resistividad eléctrica y valores gravimétricos para diferentes materiales geológicos también son analizados, así como los rangos de variación de estos valores, dependiendo de las condiciones climáticas y la formación de capas en cada área de estudio.Para la tomografía eléctrica, se usa el arreglo electródico Wenner-Schlumberger debido a su alta resolución vertical y horizontal. Para el método gravimétrico, se usa la técnica microgravimétrica porque permite mayor detalle en capas superficiales del subsuelo.Los resultados obtenidos son presentados en perfiles eléctricos y gravimétricos en Puerto Espejo y la Universidad del Quindío, los cuales fueron útiles como parámetros de calibración de los rangos de resistividad y gravimetría para los tipos de suelos encontrados en estas áreas de Colombia, dependiendo también de los factores de humedad y temperatura. El análisis y discusión de los resultados es lo que finalmente permite obtener conclusiones, importante para la escogencia de métodos de exploración geofísica como una alternativa para familiarizarse con las estructuras localizadas en el subsuelo.
Palabras clave: Gravimetría, tomografía eléctrica, perfiles estratigráficos, abanico volcaniclástico, escarpe, Armenia (Colombia).
ABSTRACT
The methodology used to develop resistivity and gravimetry geophysical surveying applied to the sub-surface is described. These are totally indirect methods whose purpose is to determine the density and resistivity
(Manuscript received May 2005, Paper accepted October 2005)

74
Erika Cristina Jaramillo Giraldo, Ximena Vega Manchola and Hugo Monsalve Jaramillo
contrasts in the sub-surface, in order to relate them with the different types of soils in the areas of study, located South and North In Armenia-Quindío (Puerto espejo and University of Quindío respectively), to determine the geometry of longitudinal profiles based on existing geotechnical boreholes which only provide unidimensional information.The importance of sub-surface is analyzed, using electric resistivity and gravimetry methods in Civil Engineering projects. The most important factors influencing the changes in electric resistivity and gravimetry values for differerent geological materials are also analyzed, as well as the ranges of variation of these values, depending on climate conditions and formation of layers in each area of study.For the electric tomography, the electrodic array Wenner-Schlumberger is used due to its high vertical and horizontal resolution. For the gravimetric method, the microgravimetry technic is used because this allows better detail in shallow layers of the sub-surface.Results obtained are presented in electric and gravimetric profiles in Puerto Espejo and University of Quindío, which are useful as calibration parameters of resistivity and gravity ranges for the types of soils found in these areas in Colombia, depending also on the humidity and temperature factors. The analysis and discussion of results is what finally permits to obtain conclusions, important for choosing the methods of geophysical exploration as an alternative to get familiar with the structures located in the sub-surface.
Key words: Gravimetry, electric tomography, stratigrafic profiles, volcaniclastic fan, scarp, Armenia (Colombia).
© 2005 ESRJ - Unibiblos
INTRODUCTION
The city of Armenia, Colombia has been the location of several studies (INGEOMINAS, 1999, Espinosa, 2000, Monsalve y Vargas, 2002) as a result of the most recent earhquake in Quindío departament (25-01-1999, Mw=6.2). For this reason, scientists and investigators have tried to improve general knowledge in geophysical and geological aspects in Quindío departament. The most recent interest for the understanding of the sub-surface in Armenia has been the Geophysical And Structural Modeling Of Urban Area and Surroundings in Armenia project, which includes the present study, where the physical methods of gravimetry and electric tomograpy are used, to obtain stratigraphic profiles.The geophysical surveying methods, among which we can mention the electric resistivity and gravimetry, measure a series of physical properties of objects or structures in the sub-surface, that make them different from the surrounding site.The exploration of these contrasts between the properties of diverse materials and the encasing rocks is common in the exploitation of natural resources (petroleum, underground water, minerals etc) and in prospection of support for Civil Engineering, just like
the surveying for the study of conditions for dams or buildings foundations, or the level of soil saturation. The objective of geolectric and gravimetric prospection is to know the dimensions and depth of structures in the sub-surface, taking as reference the resistivity and gravity data, obtained in the site using different techniques. When geoelectric and gravimetric data are correctly analyzed with modern methods and using the appropriate mathematical and computational tools, they provide a cartography of gravity of the sub-surface, which permits to have a clearer idea of geometric characteristics of every layer below. The methodoly used to obtain geophysical imaging of sub-surface using gravimetry and electric tomography applied to University of Quindío and Puerto Espejo, is described in general. In the same way, we present the results obtained from the the analyses and discussions are presented regarding these results.The present study finally considers the electric tomography and gravimetry as tools, having a high potential in the survey of sub-surface, allowing to obtain stratigraphic profiles in two dimensions that represent in a more exact way the real geometry of the layers. This is done in a better form than with currently available geotechnical methods.

75
Aplication of Gravimetry and Electric Tomography Methods to Obtain Stratigrafic Profiles: Case Study at University of Quindío and Puerto Espejo Area, Armenia-Colombia
LOCATION
The area under study is specifically located at University of Quindío and Puerto Espejo, located Northwest and Southwest in Armenia-Quindío –Colombia respectively, areas that have relatively flat topographies. Inside each of these areas there is a geotechnical borehole, drilled during the seismic
microzonification of Armenia-Quindío project (AIS, 1999).Figure 1 shows the location of the two zones under study and the soils that support them. Figure 2 shows the geotechnical boreholes in them.The geographycal coordinates of gravimetric and tomographic profiles and the geotechnical boreholes are shown in chart 1.
CHART 1. GEOGRAPHICAL COORDINATES OF FINAL AND INITIAL STATIONS FOR EVERY GRAVIMETRIC PROFILE OF GEOTECHNICAL BOREHOLES (P4: PUERTO ESPEJO AND P6: UNIVERSITY OF QUINDÍO) AND THE MIDPOINTS OF EVERY TOMOGRAPHIC PROFILE
Location Puerto Espejo University of Quindío
Gravimetry
N (m) 4° 31’ 5.65’’ - 4° 31’ 10.02’’ 4° 33’ 14.93’’ – 4° 33’ 23.12’’
E (m) 72° 42’ 44.36’’ - 72° 42’ 29.40’’ 72° 39’ 43.75’’ – 72° 39’ 30.85’’
Electric Tomography
Pto. medio
N 4º 31.296’ 4º 33.466’
W 75º 42.849’ 75º 39.903’
Geotechnical boreholes
N (m) 4° 31’ 7.22’’ 4° 33’ 22.25’’
E (m) 72° 42’ 43.19’’ 72° 39’ 36.04’’
Figure 1. Location of tomographic and gravimetric profiles at University of Quindío and in Puerto Espejo (modified from INGEOMINAS, 1999).

76
Erika Cristina Jaramillo Giraldo, Ximena Vega Manchola and Hugo Monsalve Jaramillo
Figure 2. Boreholes P4 and P6 corresponding to Puerto Espejo and University of Quindío.
GEOLOGICAL SETTING
The outcrops in the study area are geological formations belonging to Cretaceous period (Arquía complex), Terciary period (fluvio volcanic and volcanic deposits) and Quaternary period (Quindío fan). These are, residual and saprofit deposits, coluvial deposits, pyroclastic fall deposits, alluvial sediments, and recent fluviotorrential sediments of Quindío river.The area of interest is located on a large volcano-sedimentary deposit, formed by alternation of py-roclastic flow deposits, laharic and fluviotorrential, alluvial and glacial materials in smaller proportion, mostly covered by volcanic tuffs (ash, , lapilli and volcanic dust), that covered a paleo-topography, generating round and low grade hills, which are the geographical shapes that characterize the region. The materials forming the big volcanic-sedimentary deposit come from the Central Cordillera, located East and north- East of Quindío. These deposits are mostly products of volcanic activity originated at Nevado del Quindío, Santa Isabel, and Cerro Santa Rosa volcanoes (González and Nuñez, 1991).
Espinosa (in press), assigns this unit the name of Quindío fan and makes a morphological difference with others, concluding that its thickness is not con-stant, reffering to an increase from the apex, associated with distance to volcanic centers. Espinosa’s work defines the terracing (see Figure 3) of Quindío and Pereira fans as a series of descending levels from the apex to the distal part, for this reason, the Quindío fan is divided in three sub-groups named as proximal, intermediate and distal fans, so that the closest fan to the apex is encased in an older unit. In the same form, the degree of incision in the oldest units (closest to the apex) is much bigger than that of recent units due to its bigger exposition to alluvial erosion.
Figure 3. Formation of fans, note the terracing between the most recent units (4 and 3) in respect to the oldest (1 and 2) (Espinosa, in press).

77
Aplication of Gravimetry and Electric Tomography Methods to Obtain Stratigrafic Profiles: Case Study at University of Quindío and Puerto Espejo Area, Armenia-Colombia
METHODOLOGY
Figure 4 shows the methodology used in gravimetric surveying. The objective of the study was to deter-mine the contrast of densities and geometry (orienta-tion and aproximate thickness) of sub-surface layers for the zones of Puerto Espejo and University of Quindío. Its reach permitted to classify the study as
Local Type, for this reason the technique used was micro-gravimetryRelative gravity testing was done every 10m along profiles of about 500m in longitude, using a Worden gravimeter. The cycles were done in periods of less than 2 hours and by the same surveyor, seeking to minimize the level of human error.
Gravimetric Profiles
Figure 4. Flow diagram for the construction of gravimetric profiles.
Tomographic Profiles
Figure 5. Flow diagrams for the construction of tomographic profiles.

78
Erika Cristina Jaramillo Giraldo, Ximena Vega Manchola and Hugo Monsalve Jaramillo
The Bouguer anomaly data obtained, along with known geologic information of the region, were processed using a computer program for inversion of gravimetric data (GM-SYS V.3.6), from which a geological model of the zones was obtained.Figure 5 shows the methodology used in tomo-graphic exploration. The objective of the study was to determine the contrast in resistivity in the sub-surface layers in two dimensions, confirming the presence of materials associated to those found in geotechnical and geological studies for the zone. The method used to determine the stratigraphic profiles was the electric resistivity, since the objec-tive was to find the geometry of the layers trough the contrast in their resistivities. The method of electric tomography was applied , using the Wenner-Schlumberguer array due to the fact that bi-dimen-sional profiles were needed and for the necessity of obtaining complementation parameters to regional geotechnical and geological studies which are uni-dimensional. This array provides a good resolution in both vertical and horizontal directions. For the area of University of Quindio, a 180m profile was made (see Figure 1), with electrode
spacing of 5 meters, reaching a 38.7 meter deep research , while in Puerto Espejo the profile reached 144 meters, with a spacing between electrodes of 4 meters and a 31 meter depth. The data of appar-ent resistivity obtained in the processing of the information were used to find the values of real resistivity using a program specialized in inversion (RES2DINV, V. 3.48).
RESULTS
GRAVIMETRY
Measured Bouguer anomaly values in the range of -33,23 to -22,29 mgal in Puerto Espejo and 57,79 a 65,27 mgal at University of Quindío, resulted in the following models:. Puerto espejo zoneThe profile shown in Figure 3 is extended along a gravimetric line with a longitude of 543,68 meters, heights between 1327,52 and 1349,16 meters above sea level and the values for Bouguer anomalies increase to the North of the profile as shown in Figure 6.
Figure 6. Model of densities distributions in Puerto espejo and its anomaly adjustment (above).

79
Aplication of Gravimetry and Electric Tomography Methods to Obtain Stratigrafic Profiles: Case Study at University of Quindío and Puerto Espejo Area, Armenia-Colombia
The geometry of the layers was stablished, obtainig values in density between 1.5 and 1.75 g/cm3, increasing with depth. Four layers relatively horizontal for the profile were obtained (see Figure 6.), which show an increase in thickness of the fan to the South, presenting a lightly dipping structure. The deposits found in this regions were associated to La Florida fan, which belongs to the group of distals fans.The first layer, with a density of 1.5 g/cm3 shows uniformity in thickness (17 m. aproximately) as shown in geotechnical borehole (see Figure 2) associated to volcanic ash. For this profile, the presence of
Arquia Complex is observed below 100m depth approximately, in the North direction of the profile and shows a tendency to deepen in the South direction, due to accumulation of Quaternary deposits.
University of Quindío
The profile shown in Figure 5 is extended along a gravimetric line with a longitude of 581,06 meters, heights between 1511.67 and 1544,725 meters above sea level, presenting Bouguer anomalies in the range of 57,79 to 65,27 mGal, from North to South respectively, as shown in Figure 7.
Figure 7. Model of densities distributions at University of Quindío and its respective anomalie adjustment(above).
The values for density obtained are in the range 1.5 to 1.75 g/cm3 increasing as depth increases. Five relatively horizontal layers were also obtained (see Figure 7), these show an increase in the thickness of the layers toward south, showing a slightly dip-ping surface. The deposits found in this sector were associated to Circasia fan, which belongs to the intermediate fan group.
The first layer presenting a density of 1.5 g/cm3 shows a variation in depth from 11 to 24 m. Confirm-ing the thickness of volcanic ashes (21 m.) indicated in geotechnical boreholes P6 (see Figure 2), increas-ing thickness toward North. The presence of Arquia Complex is after the 200m deep. Aproximately in the North side, with tendency to deepen to the South direction of the profile, due to accumulation of Quaternary deposits.

80
Erika Cristina Jaramillo Giraldo, Ximena Vega Manchola and Hugo Monsalve Jaramillo
ELECTRIC TOMOGRAPHY
A model with real distribution of resistivity in the layers of the sub-surface was obtained for every zone under study, which is represented by the variation in colors. After analyzing tomographic profiles with the corresponding mechanical boreholes, the resistivity ranges for every type of soil were computed. The variables involved were: Natural humidity, unitary weight, bearing capacity, S- wave speed and RQD (R=?, Q=?, D=?).
Puerto Espejo
The correlation of data obtained in mechanical boreholes P4 and the resistivity values found, allowed to obtain a definitive model for Puerto Espejo, which reflects a great influence of natural humidity in the values of resistivity in the upper layers. This can be observed in the graph obtained during the analysis (Figure 8), while in lower layers, the dominant factor is the degree of cementation and meteorization.
Figure 8. Variation in resistivity with natural Humidity.
Although the variation of resistivity with natural humidity is not linear, there is a tendency in the resistivity, to decrease while humidity increases. A
model was obtained in which 7 areas were found (see Figure 9) every one with special characteristics as described:
Figure 9. Areas differenciation according to resistivity and natural humidity ranges for Tomographic Profile in Puerto espejo.

81
Aplication of Gravimetry and Electric Tomography Methods to Obtain Stratigrafic Profiles: Case Study at University of Quindío and Puerto Espejo Area, Armenia-Colombia
- Area 1
Presents the lowest humidity condition, being reflected in the largest resistivity range, which is, between 4500 and 9500 Ohm-m and is associated to lime sandstones.
- Area 2
Exhibits an intermediate humidity condition and resistivity values between 2200 and 4500 Ω.m., which is associated to sandy limestone and lime clays.
- Area 3
Exhibits the highest humidity conditions, as reflected by the smallest resistivity range, this is, between 335 and 2200 Ω.m. and is associated to Sandy limestone and lime clays.
- Area 4
Shows a high humidity condition and certain degree of cementation. Due to the position of this area inside the layer of the volcanic ashes, cementation
is dominant over humidity, which is reflected in an increase in the resistivity range (4500 a 9500 Ω.m.), associated to cemented sandy limestone.Below the volcanic ashes layer, there is a lithological material stratum which shows a constrast with the alter(?) and that corresponds to residual soil with resistivity values ranging between 9500 and 26300 Ω.m., the aproximate thickness is 8 m. (see Figure 2).Finally, a layer presenting the highest resistivity values in the whole tomographic profile (from 26300 Ω.m. and aheah), which is associated to volcanic flow after 26 m in depth (see Figure 2).
University of Quindío
The correlation of data obtained in borehole P6 along with the resistivity values found, determined the defínitive model for University of Quindío, where a high influence of natural humidity is observed in resistivity values for upper layers, from which we produced the graph represented in Fig. 10. on the other hand, it was possible to note that the dominant factor in lower layers is the degree of cementation and meteorization, same as in the model found for Puerto Espejo.
Figure 10. Variation of Resistivity with Natural Humidity.
For this sector there is a linear variation of resistivity with the humidity, presenting an inverse variation of resistivity values with natural humidity. We can see here that the atypical values belonging to residual soil
and volcanic flow do not make part of the chart, since these deposits are deeper, and there is no significant influence of natural humidity, but there is a high influence of cementation and metheorization.
82
Erika Cristina Jaramillo Giraldo, Ximena Vega Manchola and Hugo Monsalve Jaramillo
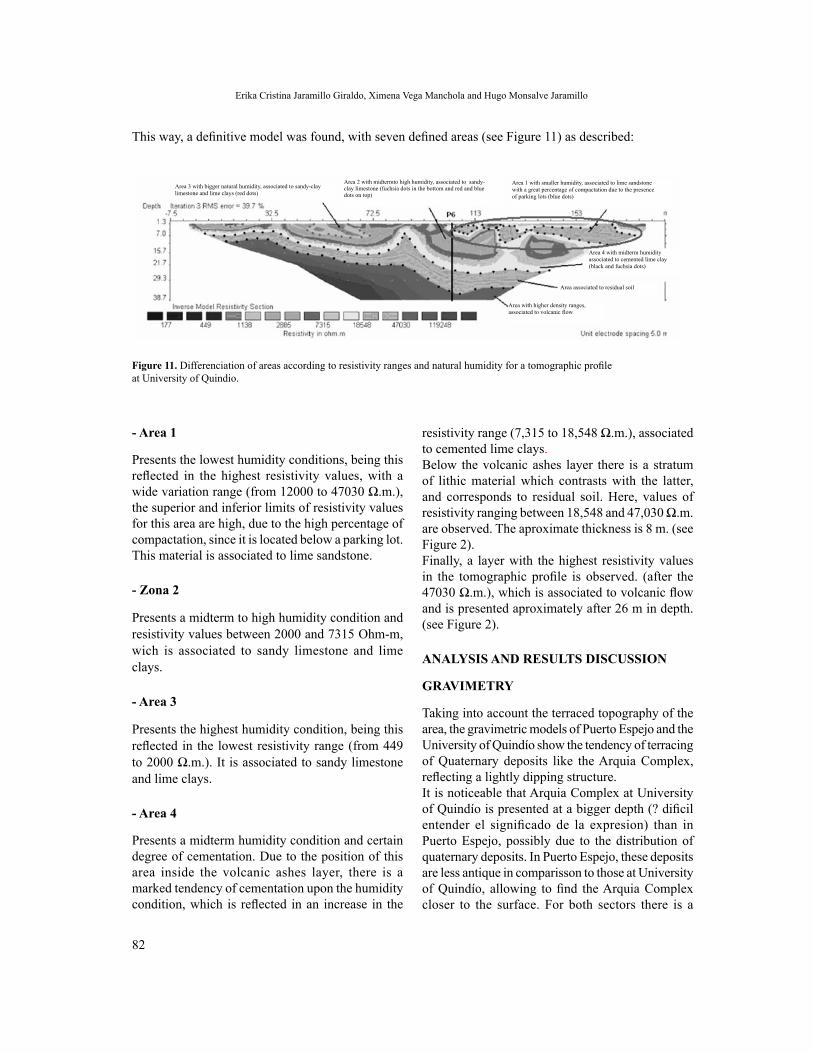
This way, a definitive model was found, with seven defined areas (see Figure 11) as described:
- Area 1
Presents the lowest humidity conditions, being this reflected in the highest resistivity values, with a wide variation range (from 12000 to 47030 Ω.m.), the superior and inferior limits of resistivity values for this area are high, due to the high percentage of compactation, since it is located below a parking lot. This material is associated to lime sandstone.
- Zona 2
Presents a midterm to high humidity condition and resistivity values between 2000 and 7315 Ohm-m, wich is associated to sandy limestone and lime clays.
- Area 3
Presents the highest humidity condition, being this reflected in the lowest resistivity range (from 449 to 2000 Ω.m.). It is associated to sandy limestone and lime clays.
- Area 4
Presents a midterm humidity condition and certain degree of cementation. Due to the position of this area inside the volcanic ashes layer, there is a marked tendency of cementation upon the humidity condition, which is reflected in an increase in the
Figure 11. Differenciation of areas according to resistivity ranges and natural humidity for a tomographic profile at University of Quindio.
resistivity range (7,315 to 18,548 Ω.m.), associated to cemented lime clays.Below the volcanic ashes layer there is a stratum of lithic material which contrasts with the latter, and corresponds to residual soil. Here, values of resistivity ranging between 18,548 and 47,030 Ω.m. are observed. The aproximate thickness is 8 m. (see Figure 2).Finally, a layer with the highest resistivity values in the tomographic profile is observed. (after the 47030 Ω.m.), which is associated to volcanic flow and is presented aproximately after 26 m in depth. (see Figure 2).
ANALYSIS AND RESULTS DISCUSSION
GRAVIMETRY
Taking into account the terraced topography of the area, the gravimetric models of Puerto Espejo and the University of Quindío show the tendency of terracing of Quaternary deposits like the Arquia Complex, reflecting a lightly dipping structure.It is noticeable that Arquia Complex at University of Quindío is presented at a bigger depth (? dificil entender el significado de la expresion) than in Puerto Espejo, possibly due to the distribution of quaternary deposits. In Puerto Espejo, these deposits are less antique in comparisson to those at University of Quindío, allowing to find the Arquia Complex closer to the surface. For both sectors there is a

83
Aplication of Gravimetry and Electric Tomography Methods to Obtain Stratigrafic Profiles: Case Study at University of Quindío and Puerto Espejo Area, Armenia-Colombia
tendency in the layers to increase their thickness toward the South direction of the profiles, reflecting a slightly dipping surface, indincating the form how the deposits have been accumulated. The micro gravimetry method allowed to analyze the layers of the sub-surface in both sectors in a more detailed way, although superficial. The comparison between the different profiles found however, with the existing ones, was only established to a maximum depth of 40 meters aproximately, since this was the biggest depth found in geotechnical boreholes so as in the tomographic survey.
ELECTRIC TOMOGRAPHY
It is observed that the range of values in resistivity of the sub-surface at University of Quindío is bigger with respect to that of Puerto Espejo, possibly due to soil characteristics and age of the deposits, those at University of Quindío are older, which is reflected in the cementation range, one of the most influencing factors in the increase of resistivity. The age of shallow deposits analyzed at University of Quindio is relflected in a higher degreee of compactation, which has a direct influence in the increase of resistivity ranges.Both models show a dominant tendency of natural humidity in the variation of resistivity values in the volcanic ashes layer, allowing to diffrenciate permeable soil from those non permeable, while in the lower layers (residual soil and volcanic flow) the dominant factor is the degree of cementation and meteorization.The electric tomography method allowed to view the transition between the different layers of the soil. (volcanic ashes, residual soil and volcanic flow), this is evidenced by the strong contrast in the resistivity values mapped. The anomalies found in every profile demonstrates the effectivity of the electric resistivity method in the survey of underground structures since it is possible to observe a good resolution of geometry and depth, providing Civil engineers with an reliable alternative in the analysis of foundations, piping, ducts, or underground structures.A limitation in the electric tomography works applied to Civil Engineering is the necessity to be carried out on a natural surface (soil) (??)
CONCLUSIONS
-The ranges of apparent resistivity for certain types of geologycal material and minerals found reported by various authors differ with the values found in the present study, we suggest this is because in those refferences the conditions under which the resistivity values were obtained are not considered. Moreover, these studies have been made in other countries were the composition of the layers of the sub-surface may be different to those of this geographycal region.-Analyzing the tomographic profile, according to the geotechnical data from the area under study, its is observed that in the layers of volcanic ashes, (upper layers) the dominant factor in the variation of the resistivity is the Natural Humidity, while in the lower layers like residual soil and volcanic flow the metheorization degree is dominant.- The Electric Tomography method is useful as a tool of sub-surface surveying at shallow levels and the construction of stratigraphic profiles, an appropriate calibration of the ranges of resistivity is necessary however for the soils of the municipality and for different seasons of the year in order to consider climate factors.- It is useful to know the tendencies of the sub-surface structures using the electric tomography in Civil Enginnering, and more specifically in Geotechnics, because the level of uncertainty in excavations is reduced for the foundation. With this, the number of tests is also reduced as well as the cost of construction projects.- The gravimetric method is of great help for geological characterization studies as well as for the seismic microzoning, because it permits to identify the more dense layers of the sub-surface associated to rock formation such as Arquía complex and diffrenciate them from the less dense like Quindío fan. - Due to the difference in characteristics between soils at University of Quindío and Puerto Espejo, there is a variation in the ranges of resistivity, being reduced in Puerto Espejo. At University of Quindío, the resistivity ranges obtained for the same type of soil in Puerto Espejo were wider.- It can be observed that the thickness of the volcanic-sedimentary deposits, corresponding to densities between 1.5 and 1.75 g/cm3, is strongly related to the location of each area under study in respect to volcanic centers that originated them. For this reason,

84
Erika Cristina Jaramillo Giraldo, Ximena Vega Manchola and Hugo Monsalve Jaramillo
the gravimetric profile of Puerto Espejo presents smaller thickness for those deposits, since this area is located at a distal fan (La Florida), while the thickness determined for deposits below University of Quindío is larger because they are located in a midterm fan (Circasia), being consequently older.
REFERENCES
• AIS, Asociación Colombiana de Ingeniería Sísmica. 1999. Estudio de Microzonificación Sísmica para Orientar la Reconstrucción de Armenia – Quindío. Informe Técnico-Científico. Bogota.
• Burger H. R., 1992. Exploration geophysics of shallow subsurface, Prentice-Hall. 489p. Englewood Cliffs-New Jersey.
• Chica A., 1998. Geofisica Aplicada –Magnetometría y Gravimetría-. Cuadernos de Ingeniería geológica. No. 5. 125 p. Medellín, Colombia.
• Duyoner, M. y Aguirre, Y. (19997) Identificación y caracterización macroscópica de la secuencia de tefras de la ciudad de Armenia (CRQ).
• Espinosa, A., 2000. Mapa Preliminar de Fallas Activas del Quindío, Zona Central. Informe Final Proyecto 152, Universidad del Quindío, Armenia, 70 p., inédito.
• Espinosa, A. (En prensa). Un modelo del Cuaternario del Quindío y Risaralda. Revista de la Academia Colombiana de Ciencias Exactas, Físicas y Naturales. Bogotá.
• Espitia, M. y Caro, P. Capítulo 1 Geología local y tectónica en Ingeominas, (1999) Vol II.
• GM-SYS, Gravity and magnetics Modeling System. Versión No. 3.60. Mike Gemperle, Gerry Connard, Milt Sagen, and Myungmun Bae Northwest Geophysical Associates, Inc.
• Loke, M. H. 1999. Electrical Imaging Survey for Envi-romental and Engineerimg Studies: A Practical Guide to 2-D and 3-D Surveys. Malasia. p 58.
• Monsalve-Jaramillo, H. y Vargas-Jiménez, C.A. 2002. El Sismo de Armenia (25-01-99, Mw=6.2): Análisis telesísmico y características de las ondas de cuerpo. Revista IPGH, No 57, 21-56.
• Núñez, A. y González, H. 1991. Memorias mapa ge-ológico generalizado del departamento del Quindío. INGEOMINAS, Bogotá.