Apple Inc. (AAPL)
22
-
Upload
wendy-ferguson -
Category
Documents
-
view
30 -
download
2
description
Apple Inc. (AAPL). Covering Analyst: Cameron Schwartz [email protected]. Company Overview. Incorporated in 1977 to sell personal computer kits by Steve Jobs and Steve Wozniak Jobs leaves company in 1985 Jobs returns in 1996, becomes CEO in 1997 - PowerPoint PPT Presentation
Transcript of Apple Inc. (AAPL)

Company Overview
› Incorporated in 1977 to sell personal computer kits by Steve Jobs and Steve Wozniak
› Jobs leaves company in 1985
› Jobs returns in 1996, becomes CEO in 1997
› iPod launch in 2001 sets path for series of revolutionary product launches
› Largest publicly traded corporation by market capitalization: $554.4 Billion – More than 4% of S&P 500 MarketCap since February

Apple’s Products
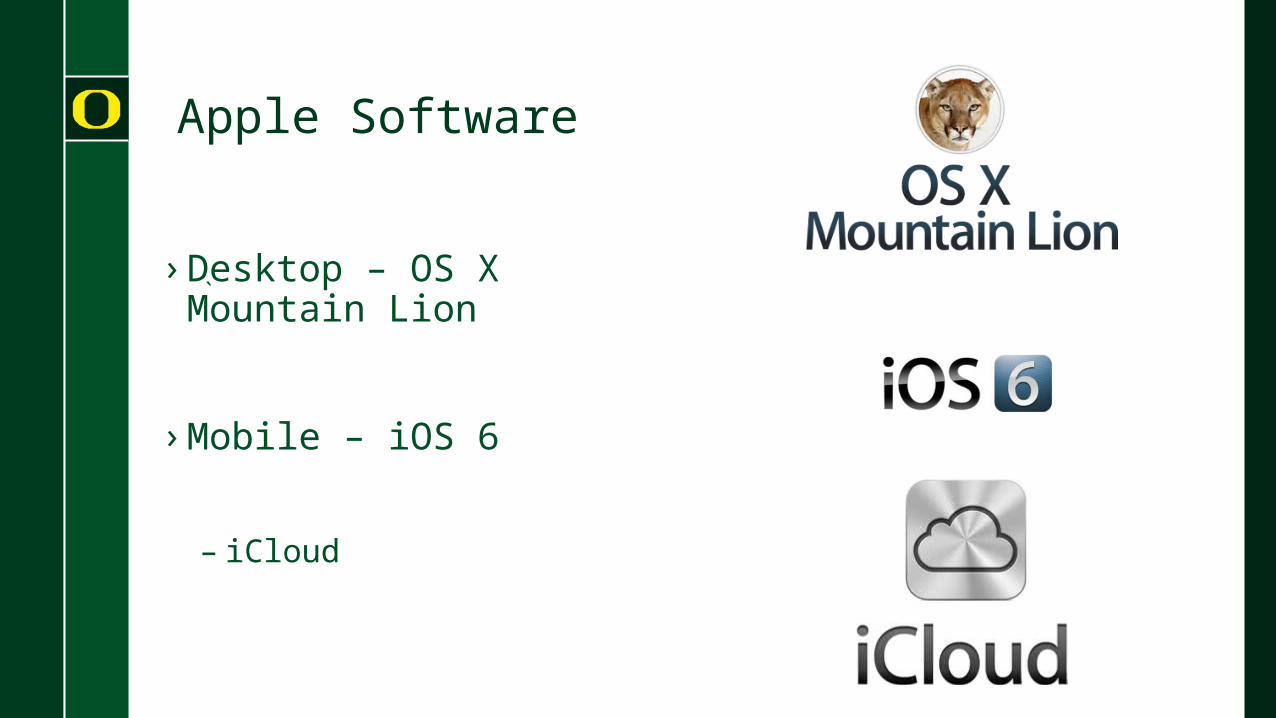
Apple Software
`› Desktop – OS X Mountain
Lion
› Mobile – iOS 6
– iCloud
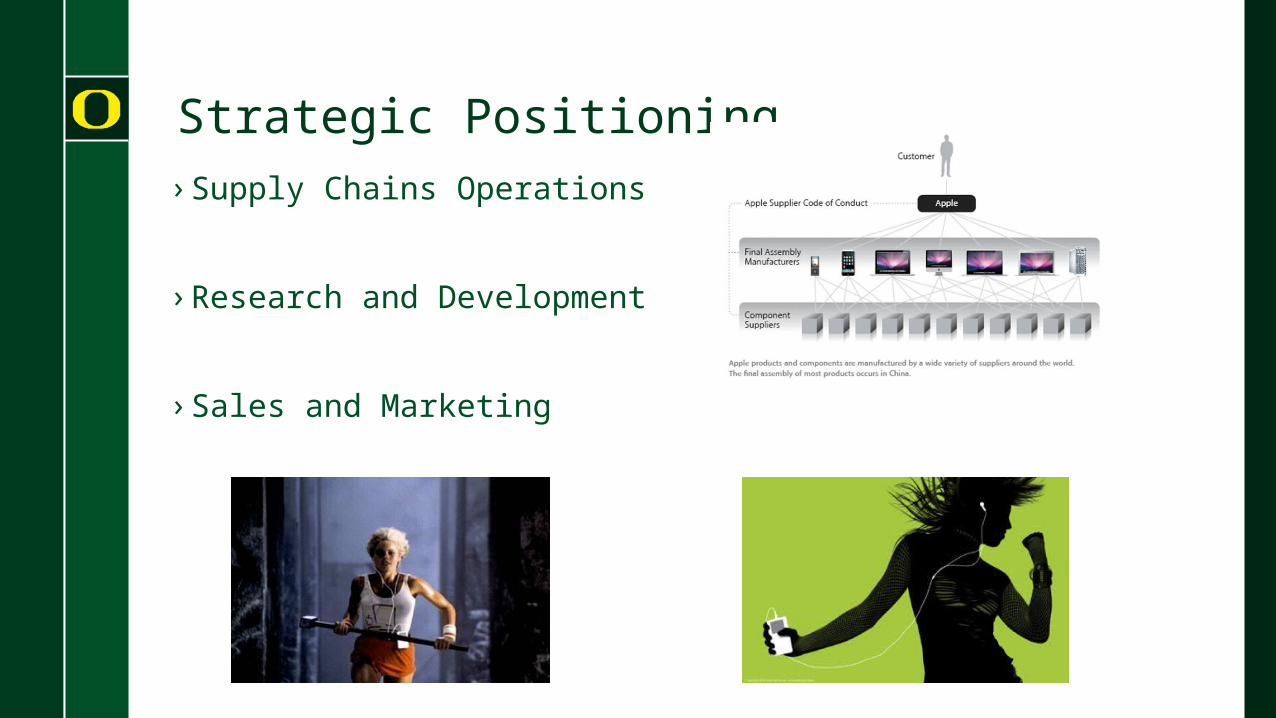
Strategic Positioning› Supply Chains Operations
› Research and Development
› Sales and Marketing

Business Growth Strategies› Innovation
› Retail Stores
› Educational Institutions
› Asia-Pacific

Industry
› PC Market Growth Slowing – (5.1%) until 2017– Tablet Market Growing
› Smartphone Market Growing– Market Research projects 16% CAGR

Competitors
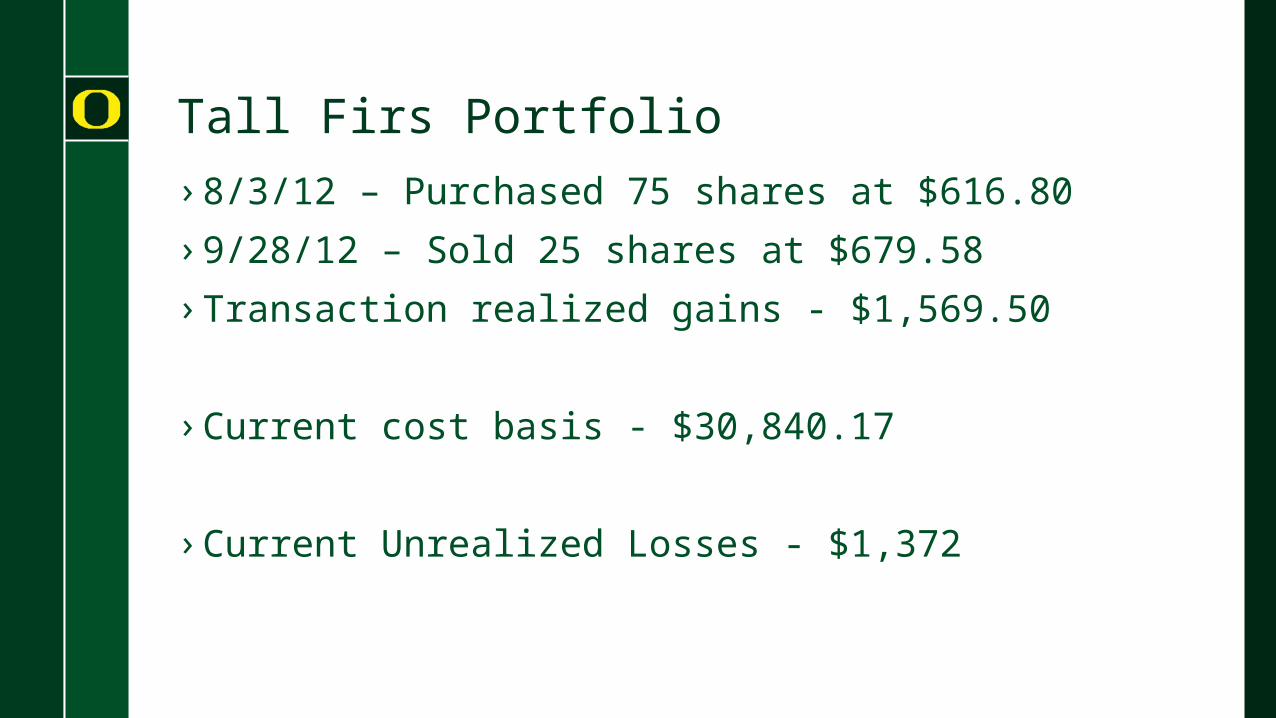
Tall Firs Portfolio
› 8/3/12 – Purchased 75 shares at $616.80
› 9/28/12 – Sold 25 shares at $679.58
› Transaction realized gains - $1,569.50
› Current cost basis - $30,840.17
› Current Unrealized Losses - $1,372
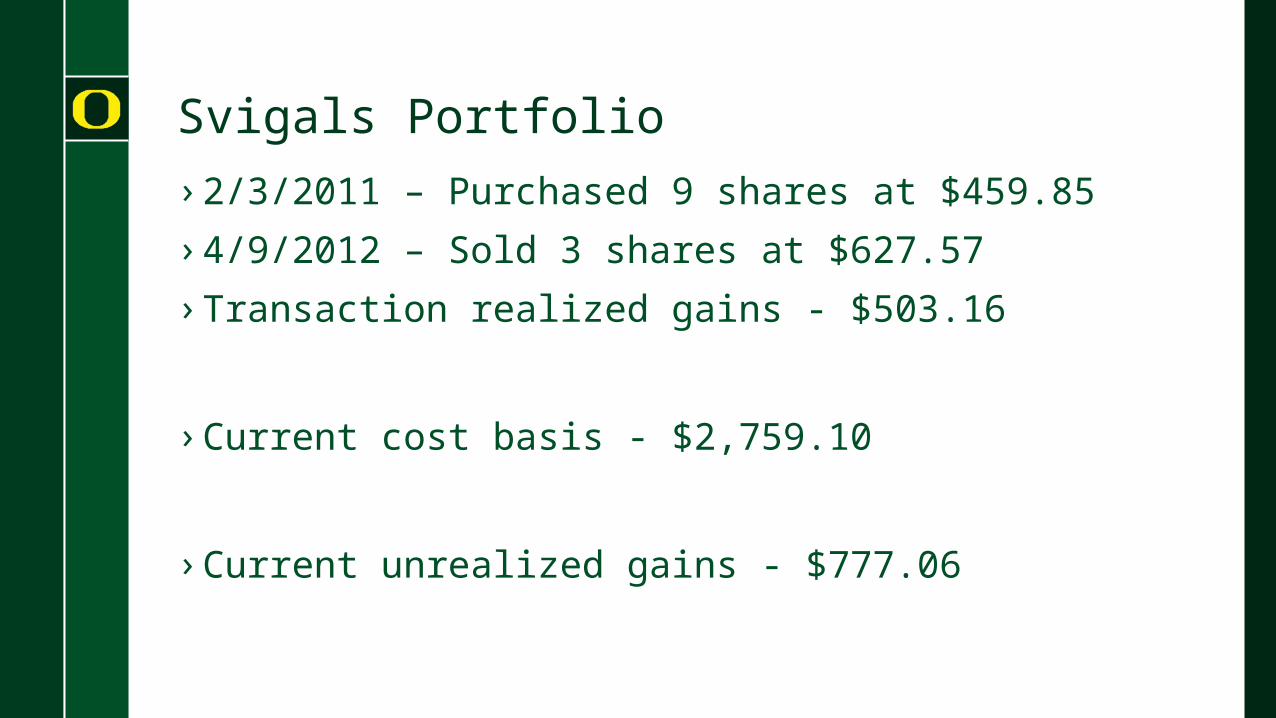
Svigals Portfolio
› 2/3/2011 – Purchased 9 shares at $459.85
› 4/9/2012 – Sold 3 shares at $627.57
› Transaction realized gains - $503.16
› Current cost basis - $2,759.10
› Current unrealized gains - $777.06
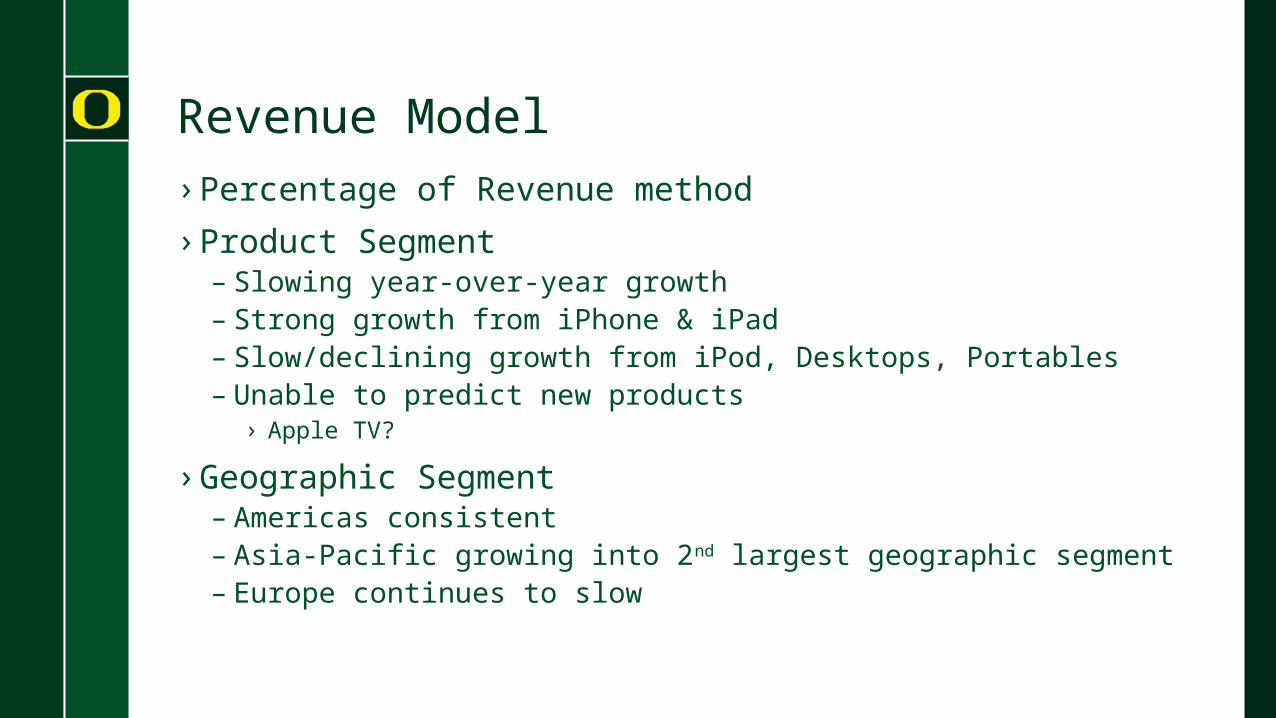
Revenue Model› Percentage of Revenue method
› Product Segment– Slowing year-over-year growth– Strong growth from iPhone & iPad– Slow/declining growth from iPod, Desktops, Portables– Unable to predict new products
› Apple TV?
› Geographic Segment– Americas consistent– Asia-Pacific growing into 2nd largest geographic segment– Europe continues to slow
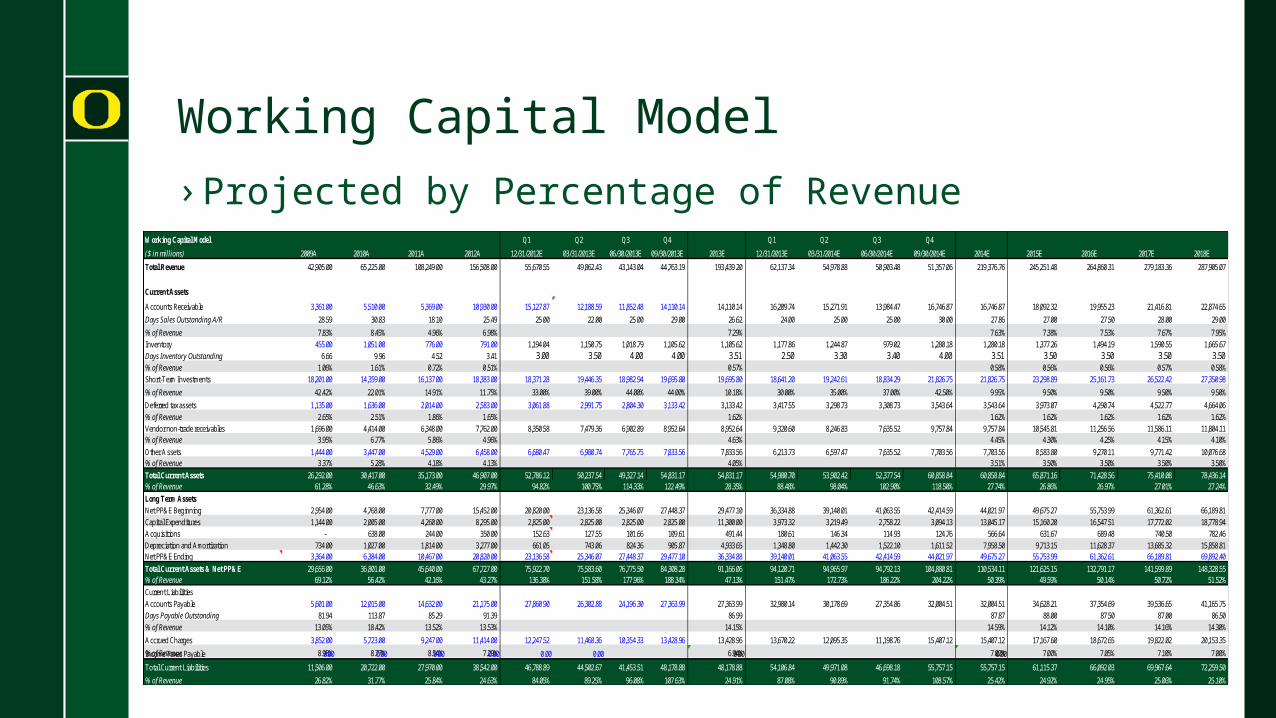
Working Capital Model
› Projected by Percentage of RevenueWorking Capital Model Q1 Q2 Q3 Q4 Q1 Q2 Q3 Q4
($ in millions) 2009A 2010A 2011A 2012A 12/31/2012E 03/31/2013E 06/30/2013E 09/30/2013E 2013E 12/31/2013E 03/31/2014E 06/30/2014E 09/30/2014E 2014E 2015E 2016E 2017E 2018E
Total Revenue 42,905.00 65,225.00 108,249.00 156,508.00 55,670.55 49,862.43 43,143.04 44,763.19 193,439.20 62,137.34 54,978.88 50,903.48 51,357.06 219,376.76 245,251.48 264,860.31 279,183.36 287,905.07
Current Assets
Accounts Receivable 3,361.00 5,510.00 5,369.00 10,930.00 15,127.87 12,188.59 11,852.48 14,110.14 14,110.14 16,209.74 15,271.91 13,984.47 16,746.87 16,746.87 18,092.32 19,955.23 21,416.81 22,874.65
Days Sales Outstanding A/R 28.59 30.83 18.10 25.49 25.00 22.00 25.00 29.00 26.62 24.00 25.00 25.00 30.00 27.86 27.00 27.50 28.00 29.00
% of Revenue 7.83% 8.45% 4.96% 6.98% 7.29% 7.63% 7.38% 7.53% 7.67% 7.95%
Inventory 455.00 1,051.00 776.00 791.00 1,194.04 1,150.75 1,018.79 1,105.62 1,105.62 1,177.86 1,244.87 979.02 1,280.18 1,280.18 1,377.26 1,494.19 1,590.55 1,665.67
Days Inventory Outstanding 6.66 9.96 4.52 3.41 3.00 3.50 4.00 4.00 3.51 2.50 3.30 3.40 4.00 3.51 3.50 3.50 3.50 3.50 % of Revenue 1.06% 1.61% 0.72% 0.51% 0.57% 0.58% 0.56% 0.56% 0.57% 0.58%
Short-Term Investments 18,201.00 14,359.00 16,137.00 18,383.00 18,371.28 19,446.35 18,982.94 19,695.80 19,695.80 18,641.20 19,242.61 18,834.29 21,826.75 21,826.75 23,298.89 25,161.73 26,522.42 27,350.98
% of Revenue 42.42% 22.01% 14.91% 11.75% 33.00% 39.00% 44.00% 44.00% 10.18% 30.00% 35.00% 37.00% 42.50% 9.95% 9.50% 9.50% 9.50% 9.50%
Deferred tax assets 1,135.00 1,636.00 2,014.00 2,583.00 3,061.88 2,991.75 2,804.30 3,133.42 3,133.42 3,417.55 3,298.73 3,308.73 3,543.64 3,543.64 3,973.07 4,290.74 4,522.77 4,664.06
% of Revenue 2.65% 2.51% 1.86% 1.65% 1.62% 1.62% 1.62% 1.62% 1.62% 1.62%
Vendor non-trade receivables 1,696.00 4,414.00 6,348.00 7,762.00 8,350.58 7,479.36 6,902.89 8,952.64 8,952.64 9,320.60 8,246.83 7,635.52 9,757.84 9,757.84 10,545.81 11,256.56 11,586.11 11,804.11 % of Revenue 3.95% 6.77% 5.86% 4.96% 4.63% 4.45% 4.30% 4.25% 4.15% 4.10%
Other Assets 1,444.00 3,447.00 4,529.00 6,458.00 6,680.47 6,980.74 7,765.75 7,833.56 7,833.56 6,213.73 6,597.47 7,635.52 7,703.56 7,703.56 8,583.80 9,270.11 9,771.42 10,076.68 % of Revenue 3.37% 5.28% 4.18% 4.13% 4.05% 3.51% 3.50% 3.50% 3.50% 3.50%
Total Current Assets 26,292.00 30,417.00 35,173.00 46,907.00 52,786.12 50,237.54 49,327.14 54,831.17 54,831.17 54,980.70 53,902.42 52,377.54 60,858.84 60,858.84 65,871.16 71,428.56 75,410.08 78,436.14 % of Revenue 61.28% 46.63% 32.49% 29.97% 94.82% 100.75% 114.33% 122.49% 28.35% 88.48% 98.04% 102.90% 118.50% 27.74% 26.86% 26.97% 27.01% 27.24%
Long Term Assets
Net PP&E Beginning 2,954.00 4,768.00 7,777.00 15,452.00 20,820.00 23,136.58 25,346.07 27,448.37 29,477.10 36,334.88 39,140.01 41,063.55 42,414.59 44,021.97 49,675.27 55,753.99 61,362.61 66,189.81
Capital Expenditures 1,144.00 2,005.00 4,260.00 8,295.00 2,825.00 2,825.00 2,825.00 2,825.00 11,300.00 3,973.32 3,219.49 2,758.22 3,094.13 13,045.17 15,160.20 16,547.51 17,772.02 18,778.94
Acquisitions - 638.00 244.00 350.00 152.63 127.55 101.66 109.61 491.44 180.61 146.34 114.93 124.76 566.64 631.67 689.48 740.50 782.46
Depreciation and Amortization 734.00 1,027.00 1,814.00 3,277.00 661.05 743.06 824.36 905.87 4,933.65 1,348.80 1,442.30 1,522.10 1,611.52 7,958.50 9,713.15 11,628.37 13,685.32 15,858.81 Net PP&E Ending 3,364.00 6,384.00 10,467.00 20,820.00 23,136.58 25,346.07 27,448.37 29,477.10 36,334.88 39,140.01 41,063.55 42,414.59 44,021.97 49,675.27 55,753.99 61,362.61 66,189.81 69,892.40
Total Current Assets & Net PP&E 29,656.00 36,801.00 45,640.00 67,727.00 75,922.70 75,583.60 76,775.50 84,308.28 91,166.06 94,120.71 94,965.97 94,792.13 104,880.81 110,534.11 121,625.15 132,791.17 141,599.89 148,328.55 % of Revenue 69.12% 56.42% 42.16% 43.27% 136.38% 151.58% 177.96% 188.34% 47.13% 151.47% 172.73% 186.22% 204.22% 50.39% 49.59% 50.14% 50.72% 51.52%
Current Liabilities
Accounts Payable 5,601.00 12,015.00 14,632.00 21,175.00 27,860.90 26,302.88 24,196.30 27,363.99 27,363.99 32,980.14 30,178.69 27,354.86 32,004.51 32,004.51 34,628.21 37,354.69 39,536.65 41,165.75
Days Payable Outstanding 81.94 113.87 85.29 91.39 86.99 87.87 88.00 87.50 87.00 86.50
% of Revenue 13.05% 18.42% 13.52% 13.53% 14.15% 14.59% 14.12% 14.10% 14.16% 14.30%
Accrued Charges 3,852.00 5,723.00 9,247.00 11,414.00 12,247.52 11,468.36 10,354.33 13,428.96 13,428.96 13,670.22 12,095.35 11,198.76 15,407.12 15,407.12 17,167.60 18,672.65 19,822.02 20,153.35
% of Revenue 8.98% 8.77% 8.54% 7.29% 6.94% 7.02% 7.00% 7.05% 7.10% 7.00%Income Taxes Payable 0.00 0.00 0.00 0.00 0.00 0.00 0.00 0.00
Total Current Liabilities 11,506.00 20,722.00 27,970.00 38,542.00 46,788.89 44,502.67 41,453.51 48,178.88 48,178.88 54,106.84 49,971.08 46,698.18 55,757.15 55,757.15 61,115.37 66,092.03 69,967.64 72,259.50
% of Revenue 26.82% 31.77% 25.84% 24.63% 84.05% 89.25% 96.08% 107.63% 24.91% 87.08% 90.89% 91.74% 108.57% 25.42% 24.92% 24.95% 25.06% 25.10%
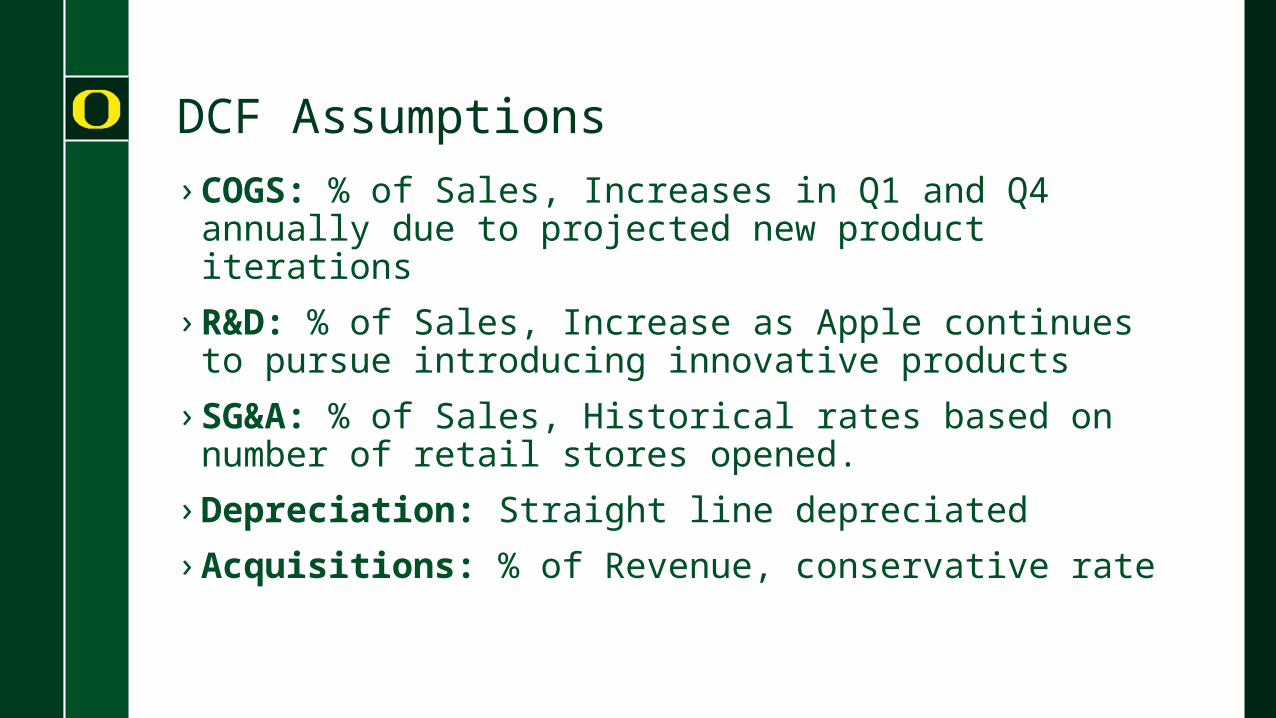
DCF Assumptions
› COGS: % of Sales, Increases in Q1 and Q4 annually due to projected new product iterations
› R&D: % of Sales, Increase as Apple continues to pursue introducing innovative products
› SG&A: % of Sales, Historical rates based on number of retail stores opened.
› Depreciation: Straight line depreciated
› Acquisitions: % of Revenue, conservative rate
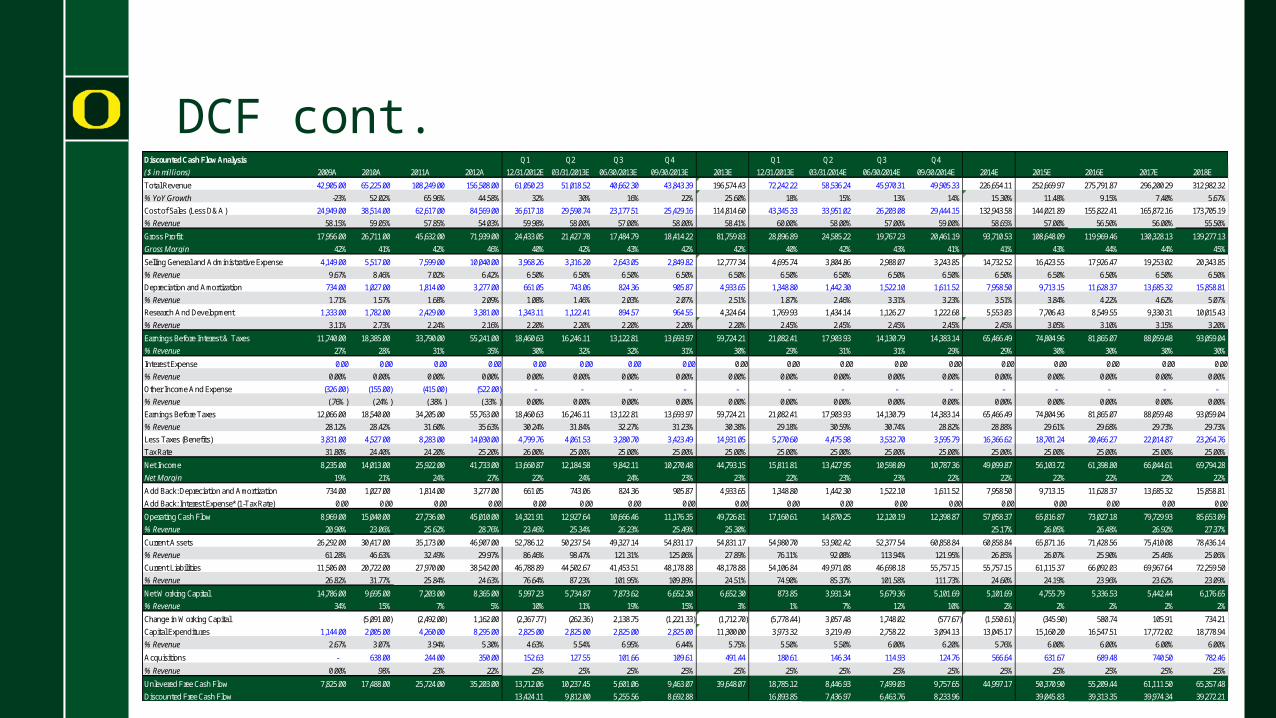
DCF cont.Discounted Cash Flow Analysis Q1 Q2 Q3 Q4 Q1 Q2 Q3 Q4
($ in millions) 2009A 2010A 2011A 2012A 12/31/2012E 03/31/2013E 06/30/2013E 09/30/2013E 2013E 12/31/2013E 03/31/2014E 06/30/2014E 09/30/2014E 2014E 2015E 2016E 2017E 2018E
Total Revenue 42,905.00 65,225.00 108,249.00 156,508.00 61,050.23 51,018.52 40,662.30 43,843.39 196,574.43 72,242.22 58,536.24 45,970.31 49,905.33 226,654.11 252,669.97 275,791.87 296,200.29 312,982.32
% YoY Growth -23% 52.02% 65.96% 44.58% 32% 30% 16% 22% 25.60% 18% 15% 13% 14% 15.30% 11.48% 9.15% 7.40% 5.67%
Cost of Sales (Less D&A) 24,949.00 38,514.00 62,617.00 84,569.00 36,617.18 29,590.74 23,177.51 25,429.16 114,814.60 43,345.33 33,951.02 26,203.08 29,444.15 132,943.58 144,021.89 155,822.41 165,872.16 173,705.19
% Revenue 58.15% 59.05% 57.85% 54.03% 59.98% 58.00% 57.00% 58.00% 58.41% 60.00% 58.00% 57.00% 59.00% 58.65% 57.00% 56.50% 56.00% 55.50%
Gross Profit 17,956.00 26,711.00 45,632.00 71,939.00 24,433.05 21,427.78 17,484.79 18,414.22 81,759.83 28,896.89 24,585.22 19,767.23 20,461.19 93,710.53 108,648.09 119,969.46 130,328.13 139,277.13
Gross Margin 42% 41% 42% 46% 40% 42% 43% 42% 42% 40% 42% 43% 41% 41% 43% 44% 44% 45%
Selling General and Administrative Expense 4,149.00 5,517.00 7,599.00 10,040.00 3,968.26 3,316.20 2,643.05 2,849.82 12,777.34 4,695.74 3,804.86 2,988.07 3,243.85 14,732.52 16,423.55 17,926.47 19,253.02 20,343.85
% Revenue 9.67% 8.46% 7.02% 6.42% 6.50% 6.50% 6.50% 6.50% 6.50% 6.50% 6.50% 6.50% 6.50% 6.50% 6.50% 6.50% 6.50% 6.50%
Depreciation and Amortization 734.00 1,027.00 1,814.00 3,277.00 661.05 743.06 824.36 905.87 4,933.65 1,348.80 1,442.30 1,522.10 1,611.52 7,958.50 9,713.15 11,628.37 13,685.32 15,858.81
% Revenue 1.71% 1.57% 1.68% 2.09% 1.08% 1.46% 2.03% 2.07% 2.51% 1.87% 2.46% 3.31% 3.23% 3.51% 3.84% 4.22% 4.62% 5.07%
Research And Development 1,333.00 1,782.00 2,429.00 3,381.00 1,343.11 1,122.41 894.57 964.55 4,324.64 1,769.93 1,434.14 1,126.27 1,222.68 5,553.03 7,706.43 8,549.55 9,330.31 10,015.43
% Revenue 3.11% 2.73% 2.24% 2.16% 2.20% 2.20% 2.20% 2.20% 2.20% 2.45% 2.45% 2.45% 2.45% 2.45% 3.05% 3.10% 3.15% 3.20%
Earnings Before Interest & Taxes 11,740.00 18,385.00 33,790.00 55,241.00 18,460.63 16,246.11 13,122.81 13,693.97 59,724.21 21,082.41 17,903.93 14,130.79 14,383.14 65,466.49 74,804.96 81,865.07 88,059.48 93,059.04
% Revenue 27% 28% 31% 35% 30% 32% 32% 31% 30% 29% 31% 31% 29% 29% 30% 30% 30% 30%
Interest Expense 0.00 0.00 0.00 0.00 0.00 0.00 0.00 0.00 0.00 0.00 0.00 0.00 0.00 0.00 0.00 0.00 0.00 0.00
% Revenue 0.00% 0.00% 0.00% 0.00% 0.00% 0.00% 0.00% 0.00% 0.00% 0.00% 0.00% 0.00% 0.00% 0.00% 0.00% 0.00% 0.00% 0.00%
Other Income And Expense (326.00) (155.00) (415.00) (522.00) - - - - - - - - - - - - - -
% Revenue (.76%) (.24%) (.38%) (.33%) 0.00% 0.00% 0.00% 0.00% 0.00% 0.00% 0.00% 0.00% 0.00% 0.00% 0.00% 0.00% 0.00% 0.00%
Earnings Before Taxes 12,066.00 18,540.00 34,205.00 55,763.00 18,460.63 16,246.11 13,122.81 13,693.97 59,724.21 21,082.41 17,903.93 14,130.79 14,383.14 65,466.49 74,804.96 81,865.07 88,059.48 93,059.04
% Revenue 28.12% 28.42% 31.60% 35.63% 30.24% 31.84% 32.27% 31.23% 30.38% 29.18% 30.59% 30.74% 28.82% 28.88% 29.61% 29.68% 29.73% 29.73%
Less Taxes (Benefits) 3,831.00 4,527.00 8,283.00 14,030.00 4,799.76 4,061.53 3,280.70 3,423.49 14,931.05 5,270.60 4,475.98 3,532.70 3,595.79 16,366.62 18,701.24 20,466.27 22,014.87 23,264.76
Tax Rate 31.80% 24.40% 24.20% 25.20% 26.00% 25.00% 25.00% 25.00% 25.00% 25.00% 25.00% 25.00% 25.00% 25.00% 25.00% 25.00% 25.00% 25.00%
Net Income 8,235.00 14,013.00 25,922.00 41,733.00 13,660.87 12,184.58 9,842.11 10,270.48 44,793.15 15,811.81 13,427.95 10,598.09 10,787.36 49,099.87 56,103.72 61,398.80 66,044.61 69,794.28
Net Margin 19% 21% 24% 27% 22% 24% 24% 23% 23% 22% 23% 23% 22% 22% 22% 22% 22% 22%
Add Back: Depreciation and Amortization 734.00 1,027.00 1,814.00 3,277.00 661.05 743.06 824.36 905.87 4,933.65 1,348.80 1,442.30 1,522.10 1,611.52 7,958.50 9,713.15 11,628.37 13,685.32 15,858.81
Add Back: Interest Expense*(1-Tax Rate) 0.00 0.00 0.00 0.00 0.00 0.00 0.00 0.00 0.00 0.00 0.00 0.00 0.00 0.00 0.00 0.00 0.00 0.00
Operating Cash Flow 8,969.00 15,040.00 27,736.00 45,010.00 14,321.91 12,927.64 10,666.46 11,176.35 49,726.81 17,160.61 14,870.25 12,120.19 12,398.87 57,058.37 65,816.87 73,027.18 79,729.93 85,653.09
% Revenue 20.90% 23.06% 25.62% 28.76% 23.46% 25.34% 26.23% 25.49% 25.30% 25.17% 26.05% 26.48% 26.92% 27.37%
Current Assets 26,292.00 30,417.00 35,173.00 46,907.00 52,786.12 50,237.54 49,327.14 54,831.17 54,831.17 54,980.70 53,902.42 52,377.54 60,858.84 60,858.84 65,871.16 71,428.56 75,410.08 78,436.14
% Revenue 61.28% 46.63% 32.49% 29.97% 86.46% 98.47% 121.31% 125.06% 27.89% 76.11% 92.08% 113.94% 121.95% 26.85% 26.07% 25.90% 25.46% 25.06%
Current Liabilities 11,506.00 20,722.00 27,970.00 38,542.00 46,788.89 44,502.67 41,453.51 48,178.88 48,178.88 54,106.84 49,971.08 46,698.18 55,757.15 55,757.15 61,115.37 66,092.03 69,967.64 72,259.50
% Revenue 26.82% 31.77% 25.84% 24.63% 76.64% 87.23% 101.95% 109.89% 24.51% 74.90% 85.37% 101.58% 111.73% 24.60% 24.19% 23.96% 23.62% 23.09%
Net Working Capital 14,786.00 9,695.00 7,203.00 8,365.00 5,997.23 5,734.87 7,873.62 6,652.30 6,652.30 873.85 3,931.34 5,679.36 5,101.69 5,101.69 4,755.79 5,336.53 5,442.44 6,176.65
% Revenue 34% 15% 7% 5% 10% 11% 19% 15% 3% 1% 7% 12% 10% 2% 2% 2% 2% 2%
Change in Working Capital (5,091.00) (2,492.00) 1,162.00 (2,367.77) (262.36) 2,138.75 (1,221.33) (1,712.70) (5,778.44) 3,057.48 1,748.02 (577.67) (1,550.61) (345.90) 580.74 105.91 734.21
Capital Expenditures 1,144.00 2,005.00 4,260.00 8,295.00 2,825.00 2,825.00 2,825.00 2,825.00 11,300.00 3,973.32 3,219.49 2,758.22 3,094.13 13,045.17 15,160.20 16,547.51 17,772.02 18,778.94
% Revenue 2.67% 3.07% 3.94% 5.30% 4.63% 5.54% 6.95% 6.44% 5.75% 5.50% 5.50% 6.00% 6.20% 5.76% 6.00% 6.00% 6.00% 6.00%
Acquisitions - 638.00 244.00 350.00 152.63 127.55 101.66 109.61 491.44 180.61 146.34 114.93 124.76 566.64 631.67 689.48 740.50 782.46
% Revenue 0.00% .98% .23% .22% .25% .25% .25% .25% .25% .25% .25% .25% .25% .25% .25% .25% .25% .25%
Unlevered Free Cash Flow 7,825.00 17,488.00 25,724.00 35,203.00 13,712.06 10,237.45 5,601.06 9,463.07 39,648.07 18,785.12 8,446.93 7,499.03 9,757.65 44,997.17 50,370.90 55,209.44 61,111.50 65,357.48
Discounted Free Cash Flow 13,424.11 9,812.00 5,255.56 8,692.88 16,893.85 7,436.97 6,463.76 8,233.96 39,045.83 39,313.35 39,974.34 39,272.21
Beta
Beta SD Weighting
1 Year Daily 1.04 20.00%
1 Year Weekly 1.08 30.00%
3 Year Daily 0.92 30.00%
3 Year Weekly 1.10 20.00%
Apple Inc. Beta 1.028
Implied Price Undervalued/(Overvalued)
Terminal Growth Rate Terminal Growth Rate
923 2.0% 2.5% 3.0% 3.5% 4.0%
0.83 858.74 888.80 923.13 962.73 1008.91
0.93 858.74 888.80 923.13 962.73 1008.91
1.03 858.74 888.80 923.13 962.73 1008.91
1.13 858.74 888.80 923.13 962.73 1008.91
1.23 858.74 888.80 923.13 962.73 1008.91Adju
sted B
eta
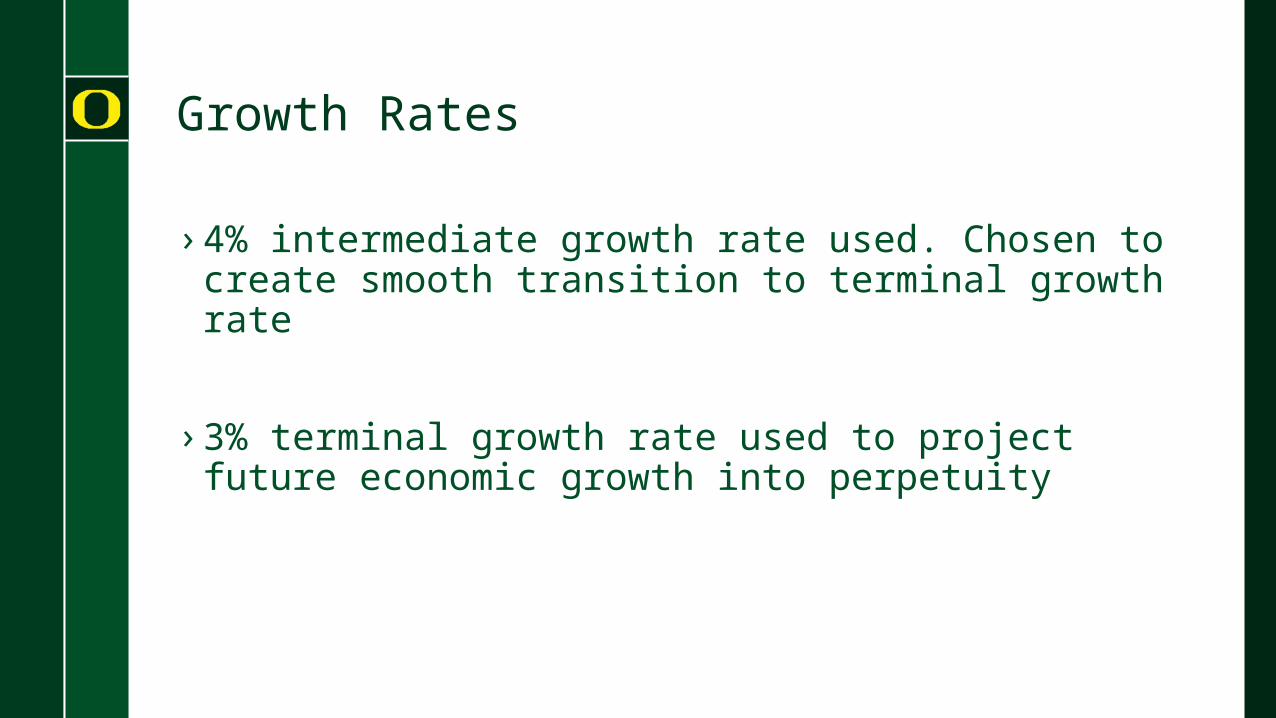
Growth Rates
› 4% intermediate growth rate used. Chosen to create smooth transition to terminal growth rate
› 3% terminal growth rate used to project future economic growth into perpetuity
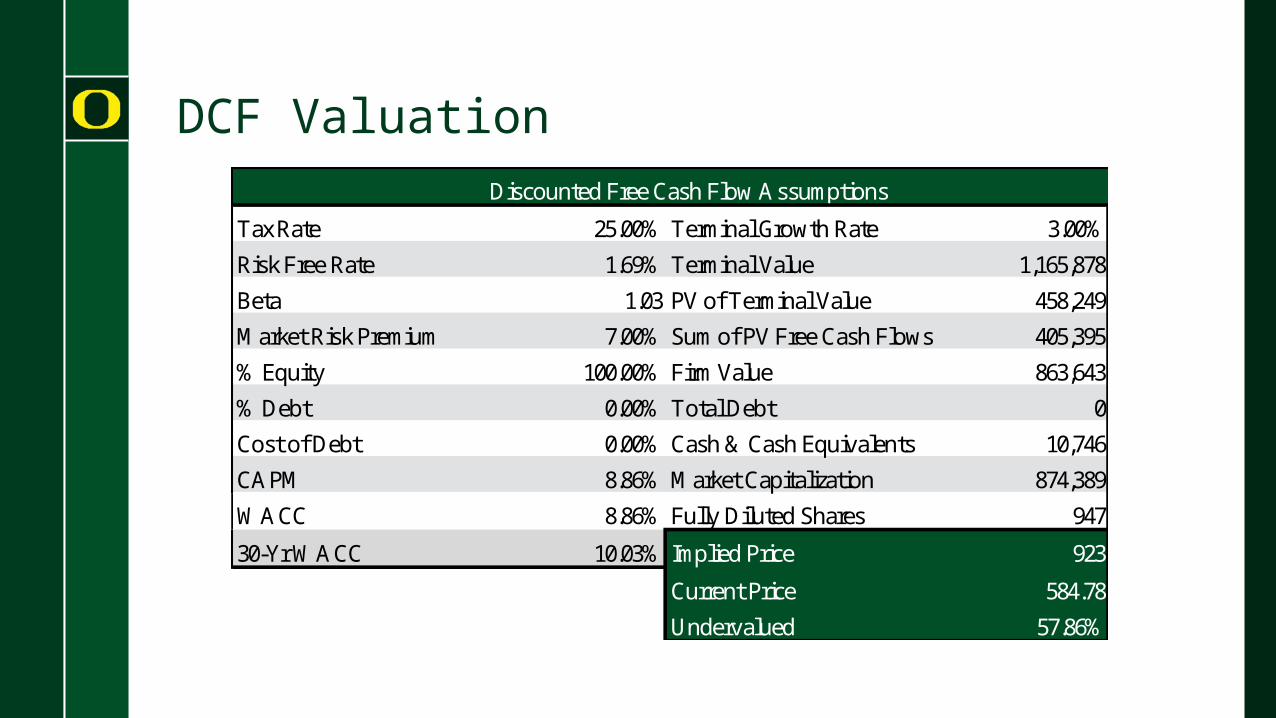
DCF ValuationDiscounted Free Cash Flow Assumptions Considerations
Tax Rate 25.00% Terminal Growth Rate 3.00%
Risk Free Rate 1.69% Terminal Value 1,165,878
Beta 1.03 PV of Terminal Value 458,249
Market Risk Premium 7.00% Sum of PV Free Cash Flows 405,395
% Equity 100.00% Firm Value 863,643
% Debt 0.00% Total Debt 0
Cost of Debt 0.00% Cash & Cash Equivalents 10,746
CAPM 8.86% Market Capitalization 874,389
WACC 8.86% Fully Diluted Shares 947
30-Yr WACC 10.03% Implied Price 923
Current Price 584.78
Undervalued 57.86%
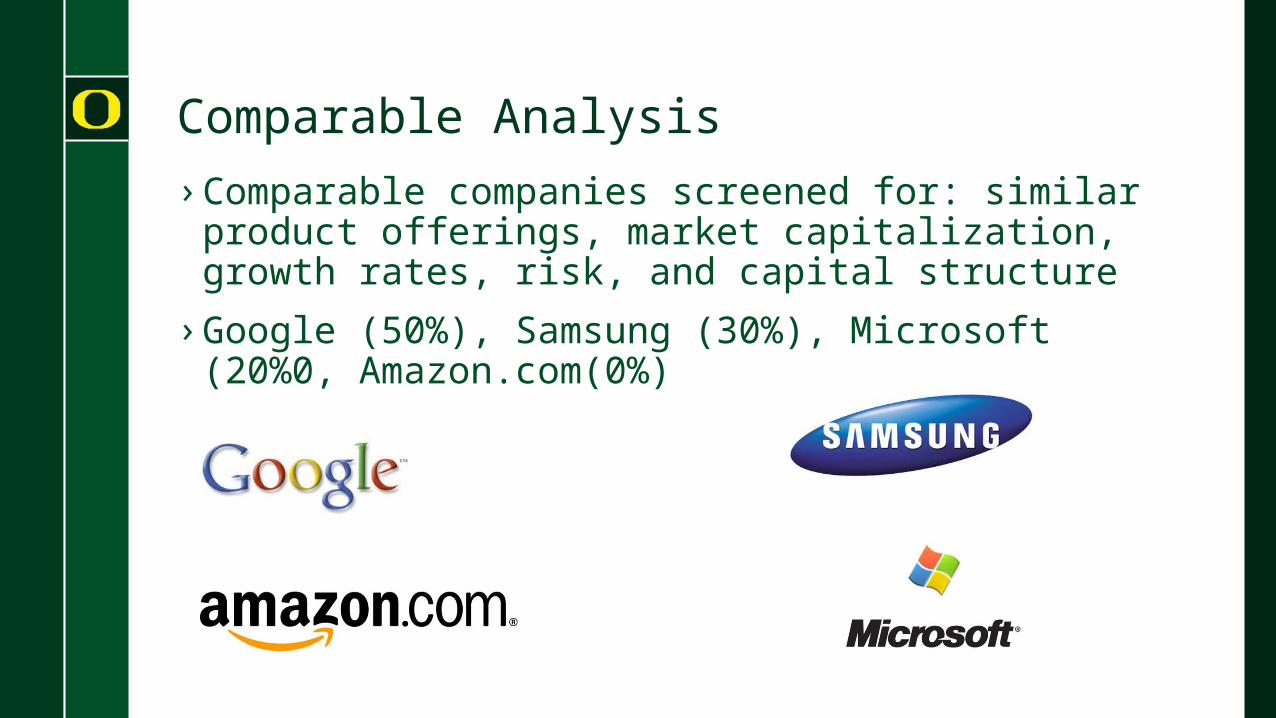
Comparable Analysis
› Comparable companies screened for: similar product offerings, market capitalization, growth rates, risk, and capital structure
› Google (50%), Samsung (30%), Microsoft (20%0, Amazon.com(0%)
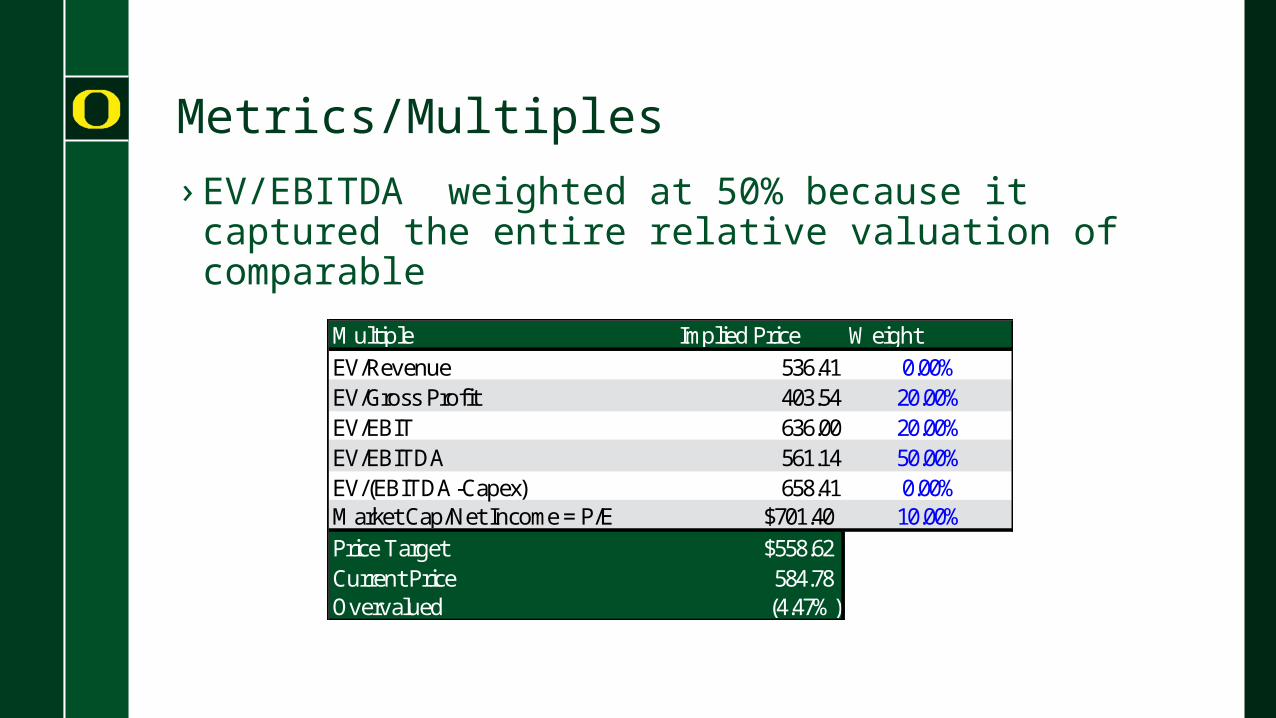
Metrics/Multiples
› EV/EBITDA weighted at 50% because it captured the entire relative valuation of comparable
Multiple Implied Price Weight
EV/Revenue 536.41 0.00%EV/Gross Profit 403.54 20.00%EV/EBIT 636.00 20.00%EV/EBITDA 561.14 50.00%EV/(EBITDA-Capex) 658.41 0.00%Market Cap/Net Income = P/E $701.40 10.00%
Price Target $558.62Current Price 584.78Overvalued (4.47%)
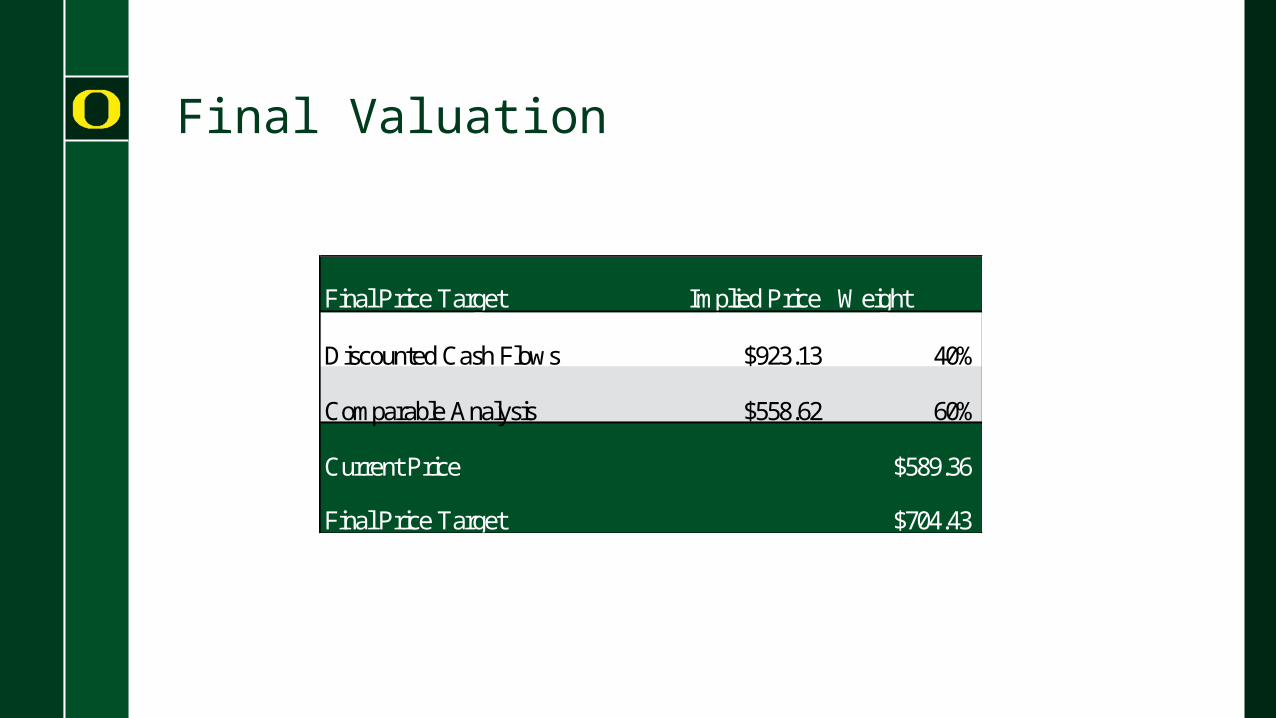
Final Valuation
Final Price Target Implied Price Weight
Discounted Cash Flows $923.13 40%
Comparable Analysis $558.62 60%
Current Price $589.36
Final Price Target $704.43

Recommendation
› Based on my current valuation I recommend a hold of Apple stocks for both portfolios
› Apple’s is viewed as a premium product by all consumers and is positioned well to capitalize on international expansion, especially in China

Questions?