NN AAPL 130122 A For Apple
34
noname Investment Research Buy A For Apple Company Report Apple meteoric growth in the last five years have been driven by introduction of successful products namely iPhone in 2007 and iPad in 2010. Between 2007 and 2012, Apple revenue increased 6.5x from USD24bn to USD156bn and net income increased 12x from USD3.5bn to USD42bn. While we expect iPhone and iPad to remain dominant, it will now be increasingly di fficult to significantly increase Apple large USD156bn revenue. As such, we expect Apple revenue growth to be more subdued moving forward. Nevertheless, Apple is currently trading at net cash P/E of only 8x. China sales could provide an upside surprise and cash hoard of USD120bn provides downside protection Overall, we have a BUY on Apple with a fair value of USD600. Apple Inc Date: 22 January 2013 Fair value USD600 Previous FV N/A Share price USD500 Yield <1% Capital gain +20% T otal return +20% Conviction Average Stock code AAPL US Market cap USD470bn Analyst Robin Hu robin@n onameresear ch.com
-
Upload
nonameresearch -
Category
Documents
-
view
227 -
download
0
Transcript of NN AAPL 130122 A For Apple
7/29/2019 NN AAPL 130122 A For Apple
http://slidepdf.com/reader/full/nn-aapl-130122-a-for-apple 1/34
nonameInvestment
Research
Buy
A For Apple
Company Report
Apple meteoric growth in the last five years have been driven by
introduction of successful products namely iPhone in 2007 and
iPad in 2010. Between 2007 and 2012, Apple revenue increased6.5x from USD24bn to USD156bn and net income increased 12x
from USD3.5bn to USD42bn.
While we expect iPhone and iPad to remain dominant, it will now
be increasingly difficult to significantly increase Apple large
USD156bn revenue. As such, we expect Apple revenue growth to
be more subdued moving forward.
Nevertheless, Apple is currently trading at net cash P/E of only 8x.
China sales could provide an upside surprise and cash hoard of
USD120bn provides downside protection
Overall, we have a BUY on Apple with a fair value of USD600.
Apple Inc
Date: 22 January 2013
Fair value USD600
Previous FV N/A
Share price USD500
Yield <1%
Capital gain +20%
Total return +20%
Conviction Average
Stock code AAPL US
Market cap USD470bn
AnalystRobin Hu

7/29/2019 NN AAPL 130122 A For Apple
http://slidepdf.com/reader/full/nn-aapl-130122-a-for-apple 2/34
2
Quantitative Overview
Qualitative OverviewLooking Ahead
Valuation and Conclusion
7/29/2019 NN AAPL 130122 A For Apple
http://slidepdf.com/reader/full/nn-aapl-130122-a-for-apple 3/34
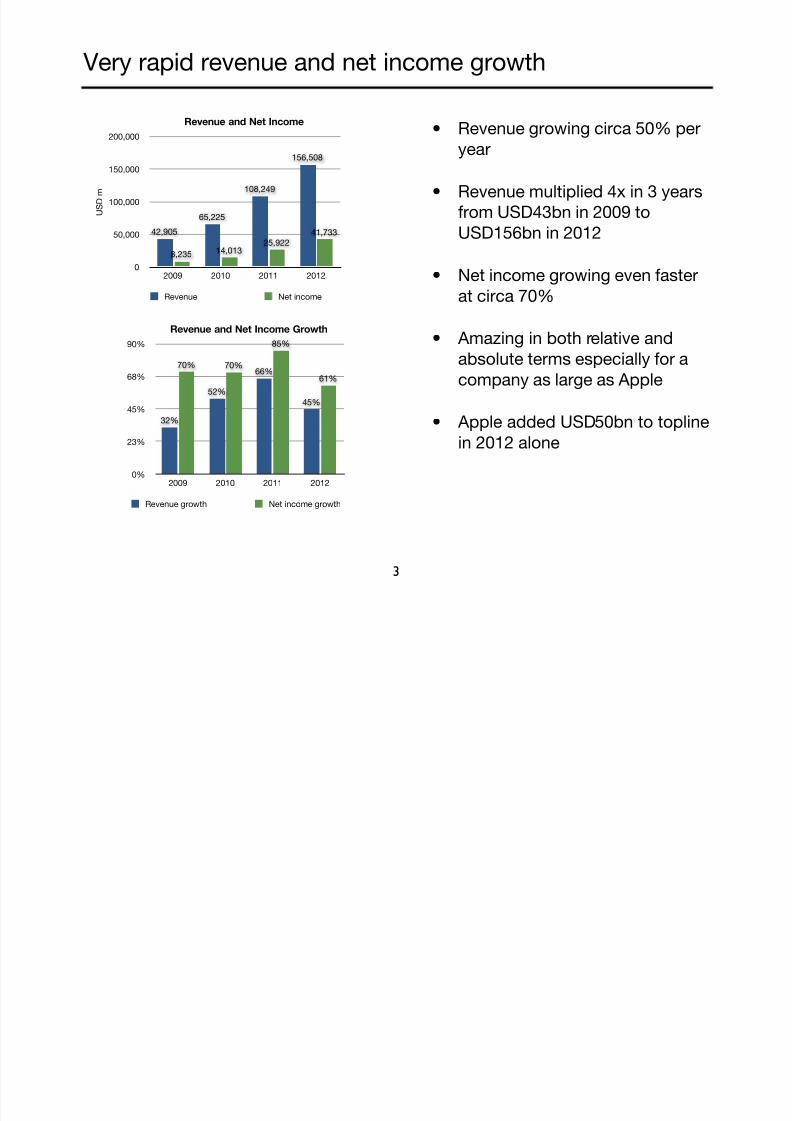
Very rapid revenue and net income growth
• Revenue growing circa 50% per
year
• Revenue multiplied 4x in 3 years
from USD43bn in 2009 to
USD156bn in 2012
• Net income growing even fasterat circa 70%
• Amazing in both relative and
absolute terms especially for a
company as large as Apple
• Apple added USD50bn to topline
in 2012 alone
3
0%
23%
45%
68%
90%
2009 2010 2011 2012
61%
85%
70%70%
45%
66%
52%
32%
Revenue and Net Income Growth
Revenue growth Net income growth
0
50,000
100,000
150,000
200,000
2009 2010 2011 2012
41,733
25,92214,0138,235
156,508
108,249
65,225
42,905
Revenue and Net Income
U S D m
Revenue Net income
7/29/2019 NN AAPL 130122 A For Apple
http://slidepdf.com/reader/full/nn-aapl-130122-a-for-apple 4/34
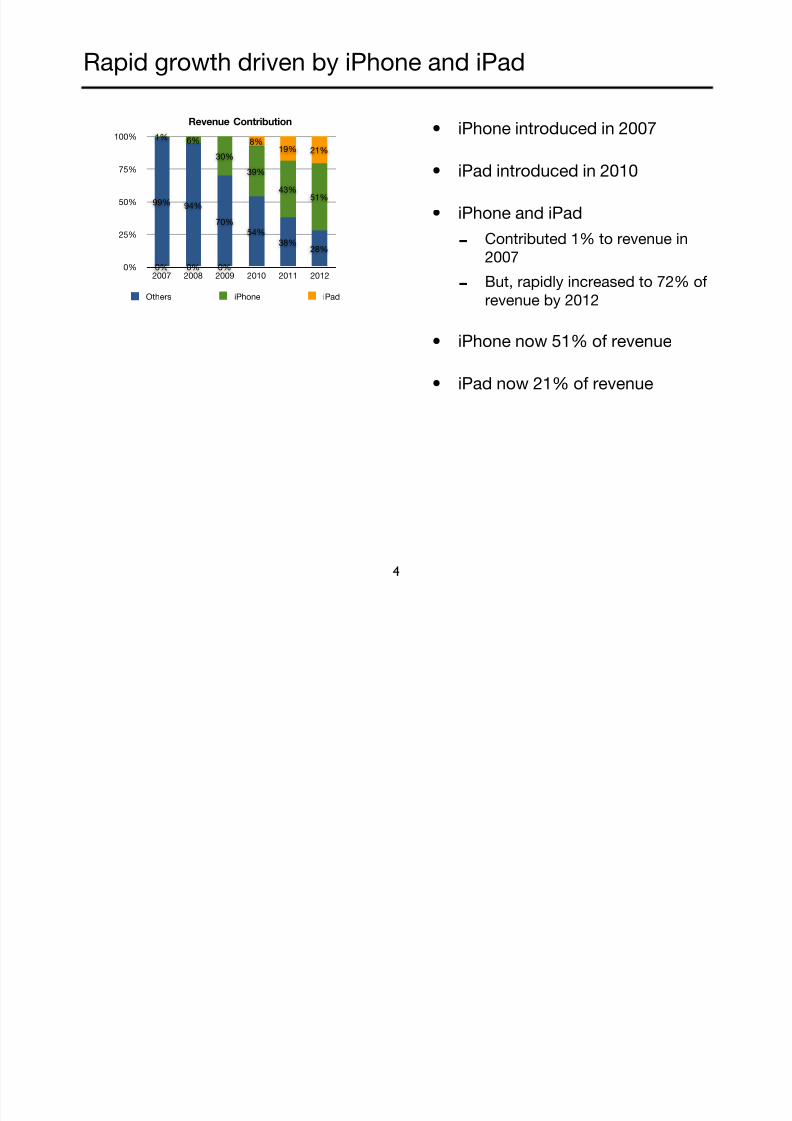
Rapid growth driven by iPhone and iPad
• iPhone introduced in 2007
• iPad introduced in 2010
• iPhone and iPad
-Contributed 1% to revenue in
2007
-
But, rapidly increased to 72% ofrevenue by 2012
• iPhone now 51% of revenue
• iPad now 21% of revenue
4
0%
25%
50%
75%
100%
2007 2008 2009 2010 2011 2012
21%19%8%
0%0%0%
51%43%
39%
30%
6%1%
28%38%
54%
70%
94%99%
Revenue Contribution
Others iPhone iPad
7/29/2019 NN AAPL 130122 A For Apple
http://slidepdf.com/reader/full/nn-aapl-130122-a-for-apple 5/34
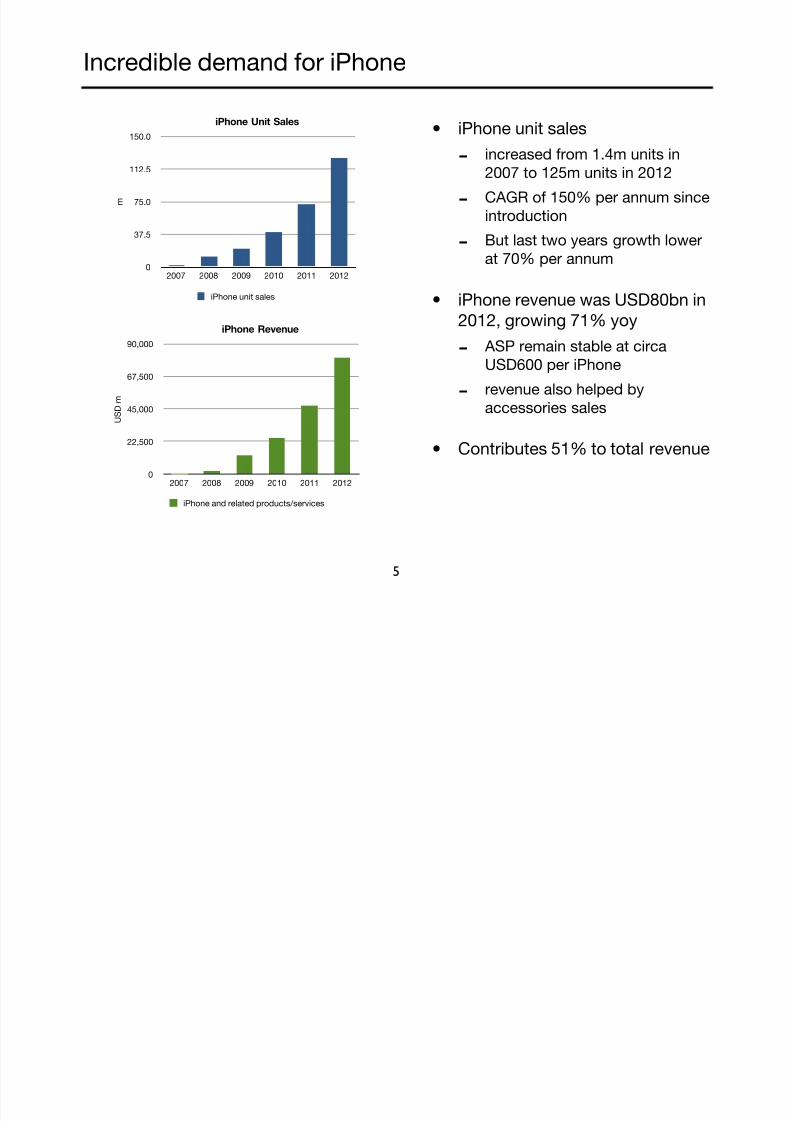
Incredible demand for iPhone
• iPhone unit sales
-increased from 1.4m units in
2007 to 125m units in 2012
-CAGR of 150% per annum since
introduction
-But last two years growth lower
at 70% per annum
• iPhone revenue was USD80bn in
2012, growing 71% yoy
- ASP remain stable at circa
USD600 per iPhone
-revenue also helped by
accessories sales
• Contributes 51% to total revenue
5
0
22,500
45,000
67,500
90,000
2007 2008 2009 2010 2011 2012
iPhone Revenue
U S
D m
iPhone and related products/services
0
37.5
75.0
112.5
150.0
2007 2008 2009 2010 2011 2012
iPhone Unit Sales
m
iPhone unit sales
7/29/2019 NN AAPL 130122 A For Apple
http://slidepdf.com/reader/full/nn-aapl-130122-a-for-apple 6/34
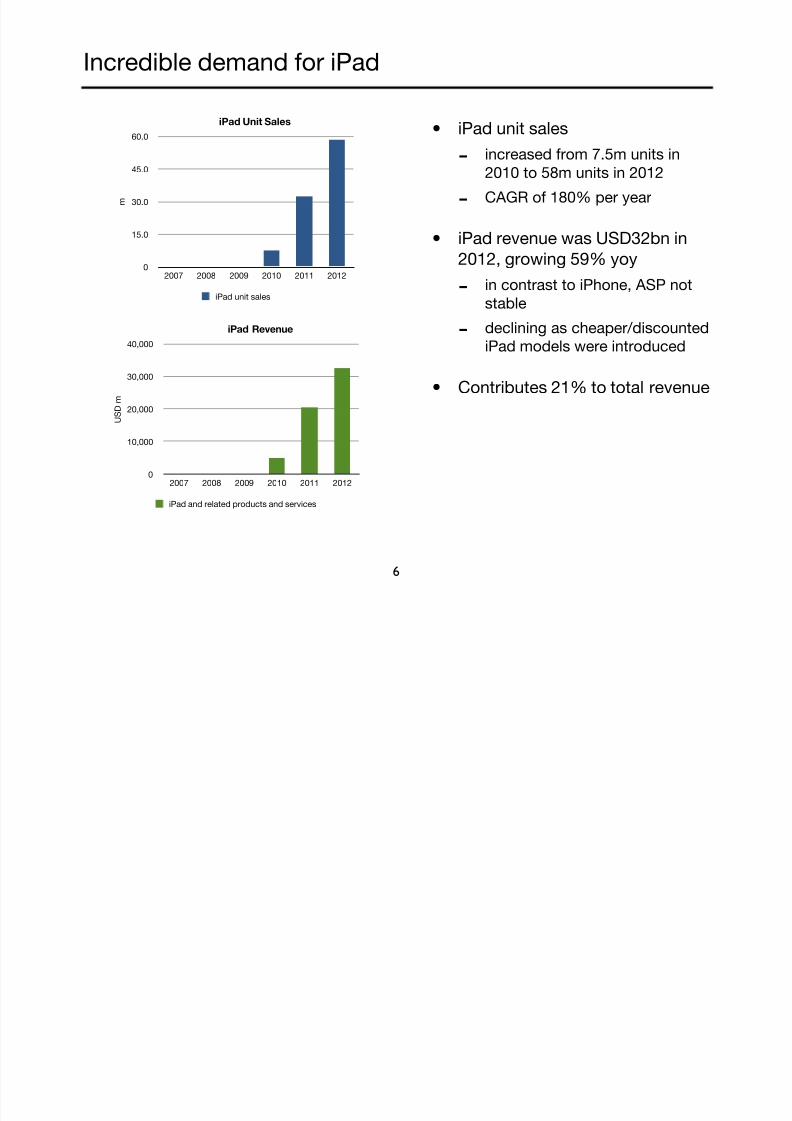
Incredible demand for iPad
• iPad unit sales
-increased from 7.5m units in
2010 to 58m units in 2012
-CAGR of 180% per year
• iPad revenue was USD32bn in
2012, growing 59% yoy
-
in contrast to iPhone, ASP not
stable
- declining as cheaper/discounted
iPad models were introduced
• Contributes 21% to total revenue
6
0
15.0
30.0
45.0
60.0
2007 2008 2009 2010 2011 2012
iPad Unit Sales
m
iPad unit sales
0
10,000
20,000
30,000
40,000
2007 2008 2009 2010 2011 2012
iPad Revenue
U S
D m
iPad and related products and services
7/29/2019 NN AAPL 130122 A For Apple
http://slidepdf.com/reader/full/nn-aapl-130122-a-for-apple 7/34
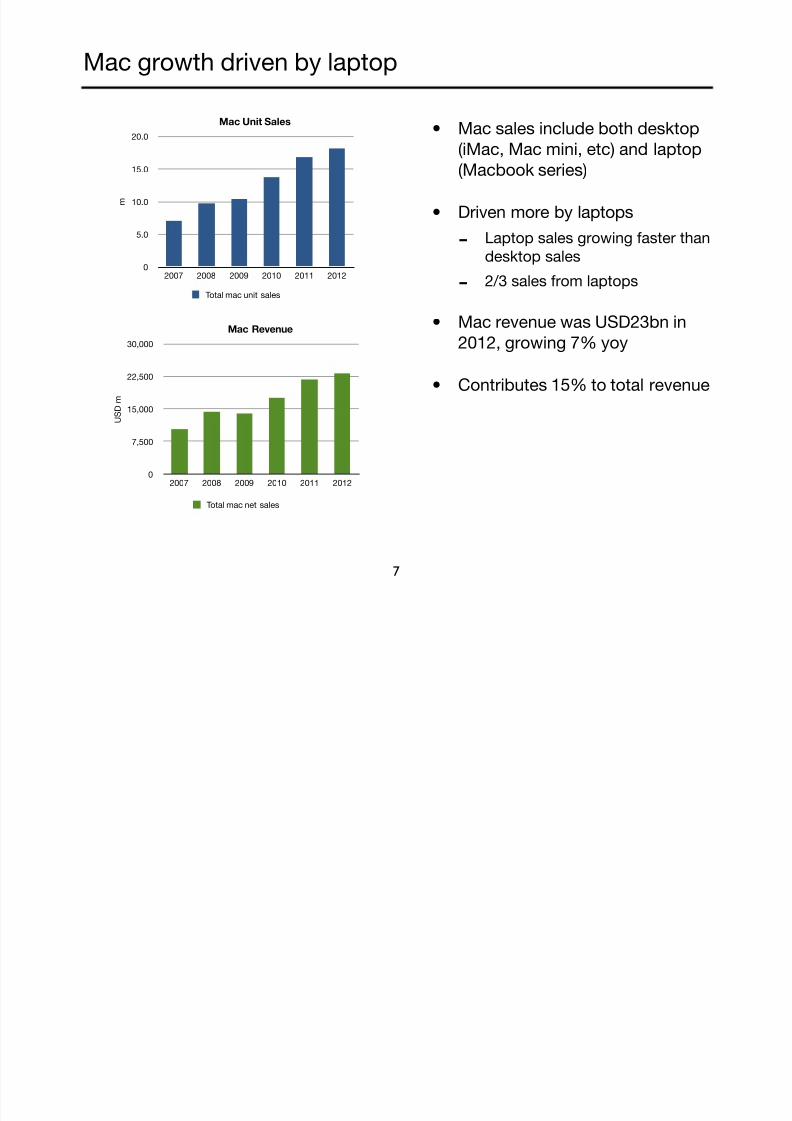
Mac growth driven by laptop
• Mac sales include both desktop
(iMac, Mac mini, etc) and laptop
(Macbook series)
• Driven more by laptops
-Laptop sales growing faster than
desktop sales
-
2/3 sales from laptops
• Mac revenue was USD23bn in
2012, growing 7% yoy
• Contributes 15% to total revenue
7
0
5.0
10.0
15.0
20.0
2007 2008 2009 2010 2011 2012
Mac Unit Sales
m
Total mac unit sales
0
7,500
15,000
22,500
30,000
2007 2008 2009 2010 2011 2012
Mac Revenue
U S
D m
Total mac net sales
7/29/2019 NN AAPL 130122 A For Apple
http://slidepdf.com/reader/full/nn-aapl-130122-a-for-apple 8/34
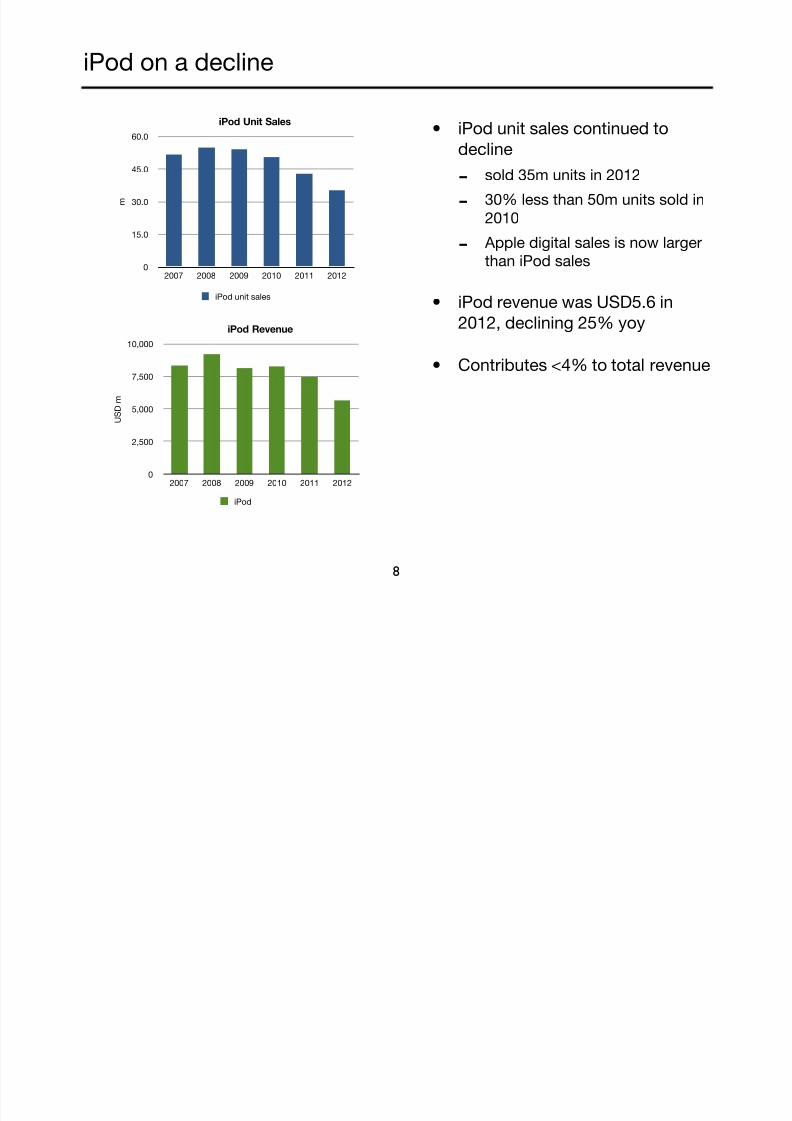
iPod on a decline
• iPod unit sales continued to
decline
-sold 35m units in 2012
-30% less than 50m units sold in
2010
- Apple digital sales is now larger
than iPod sales
• iPod revenue was USD5.6 in
2012, declining 25% yoy
• Contributes <4% to total revenue
8
0
15.0
30.0
45.0
60.0
2007 2008 2009 2010 2011 2012
iPod Unit Sales
m
iPod unit sales
0
2,500
5,000
7,500
10,000
2007 2008 2009 2010 2011 2012
iPod Revenue
U S
D m
iPod
7/29/2019 NN AAPL 130122 A For Apple
http://slidepdf.com/reader/full/nn-aapl-130122-a-for-apple 9/34
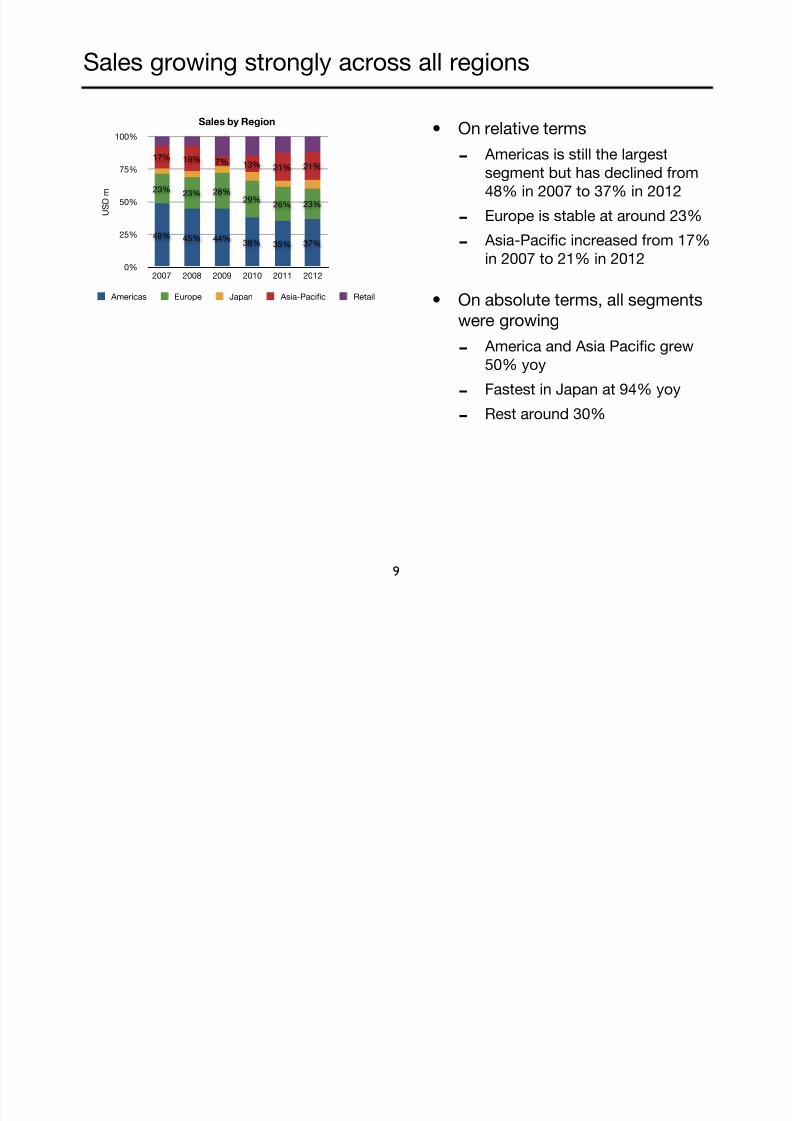
Sales growing strongly across all regions
• On relative terms
- Americas is still the largest
segment but has declined from
48% in 2007 to 37% in 2012
- Europe is stable at around 23%
- Asia-Pacific increased from 17%
in 2007 to 21% in 2012
• On absolute terms, all segments
were growing
- America and Asia Pacific grew
50% yoy
-Fastest in Japan at 94% yoy
-
Rest around 30%
9
0%
25%
50%
75%
100%
2007 2008 2009 2010 2011 2012
21%21%13%7%19%17%
23%26%29%
28%23%23%
37%35%38%44%45%48%
Sales by Region
U S D m
Americas Europe Japan Asia-Pacific Retail
7/29/2019 NN AAPL 130122 A For Apple
http://slidepdf.com/reader/full/nn-aapl-130122-a-for-apple 10/34
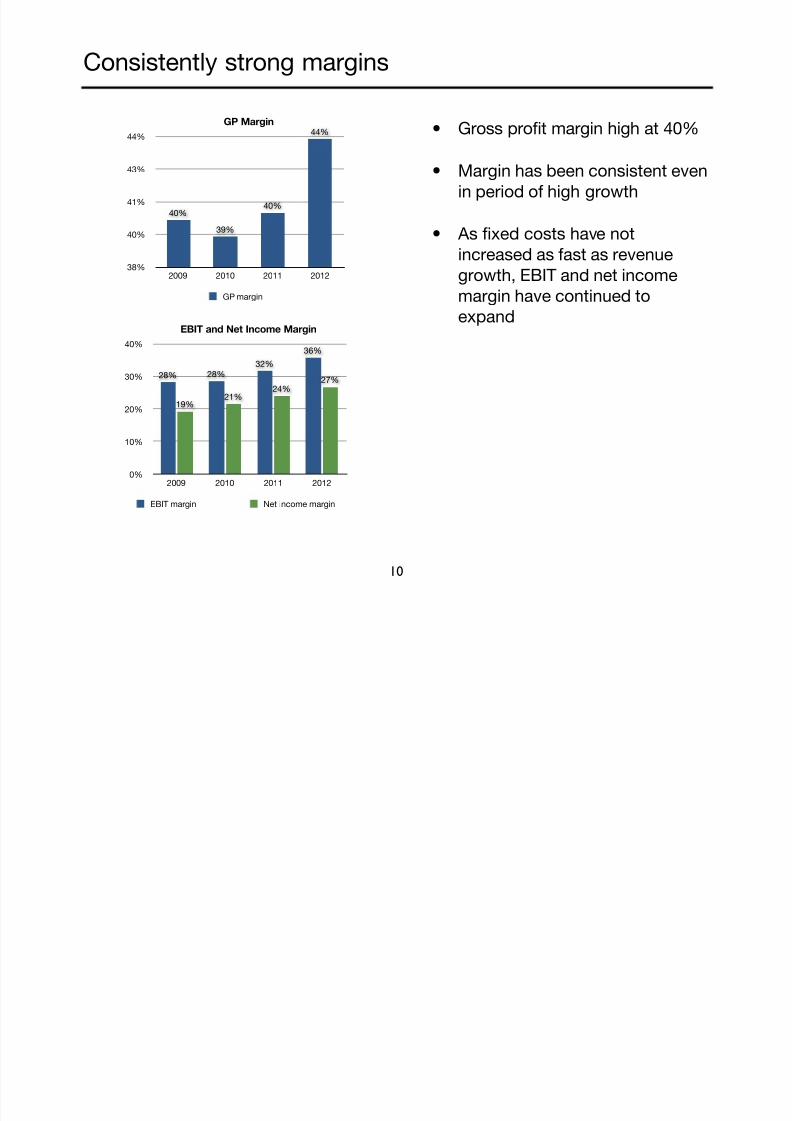
Consistently strong margins
• Gross profit margin high at 40%
• Margin has been consistent even
in period of high growth
• As fixed costs have not
increased as fast as revenue
growth, EBIT and net incomemargin have continued to
expand
10
38%
40%
41%
43%
44%
2009 2010 2011 2012
44%
40%
39%
40%
GP Margin
GP margin
0%
10%
20%
30%
40%
2009 2010 2011 2012
27%24%
21%19%
36%
32%
28%28%
EBIT and Net Income Margin
EBIT margin Net income margin
7/29/2019 NN AAPL 130122 A For Apple
http://slidepdf.com/reader/full/nn-aapl-130122-a-for-apple 11/34
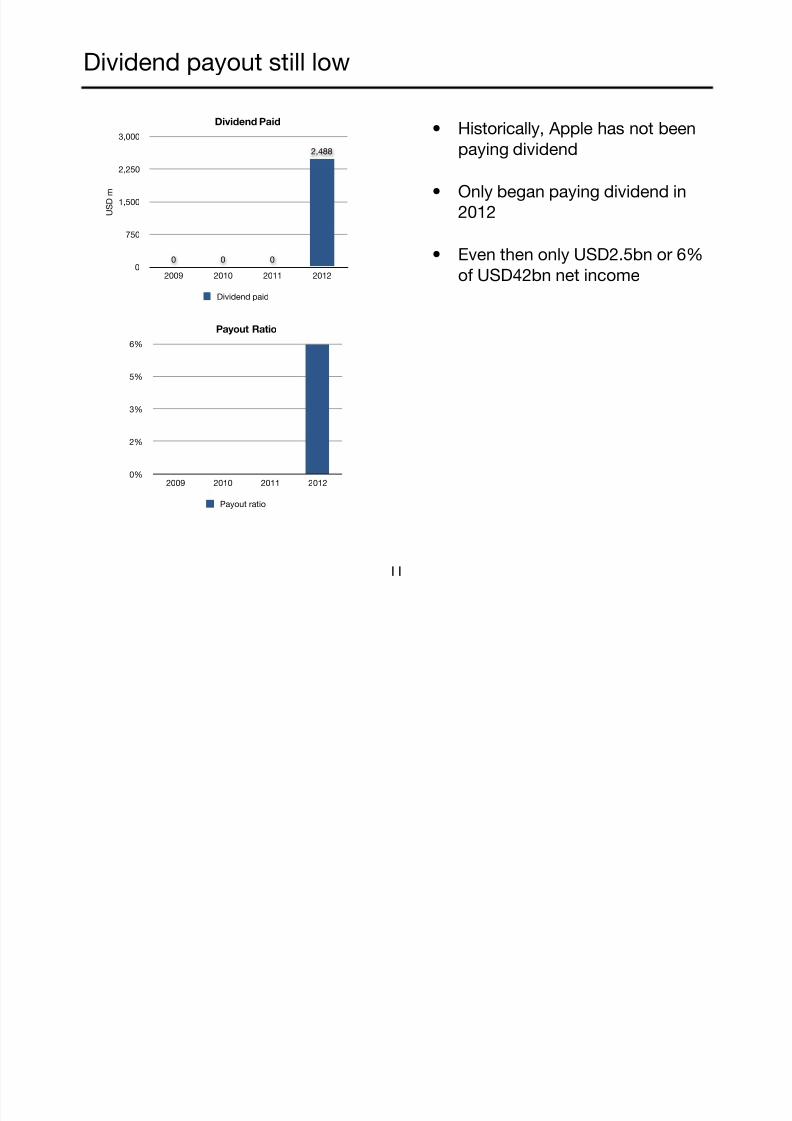
Dividend payout still low
• Historically, Apple has not been
paying dividend
• Only began paying dividend in
2012
• Even then only USD2.5bn or 6%
of USD42bn net income
11
0
750
1,500
2,250
3,000
2009 2010 2011 2012
2,488
000
Dividend Paid
U S D m
Dividend paid
0%
2%
3%
5%
6%
2009 2010 2011 2012
Payout Ratio
Payout ratio
7/29/2019 NN AAPL 130122 A For Apple
http://slidepdf.com/reader/full/nn-aapl-130122-a-for-apple 12/34
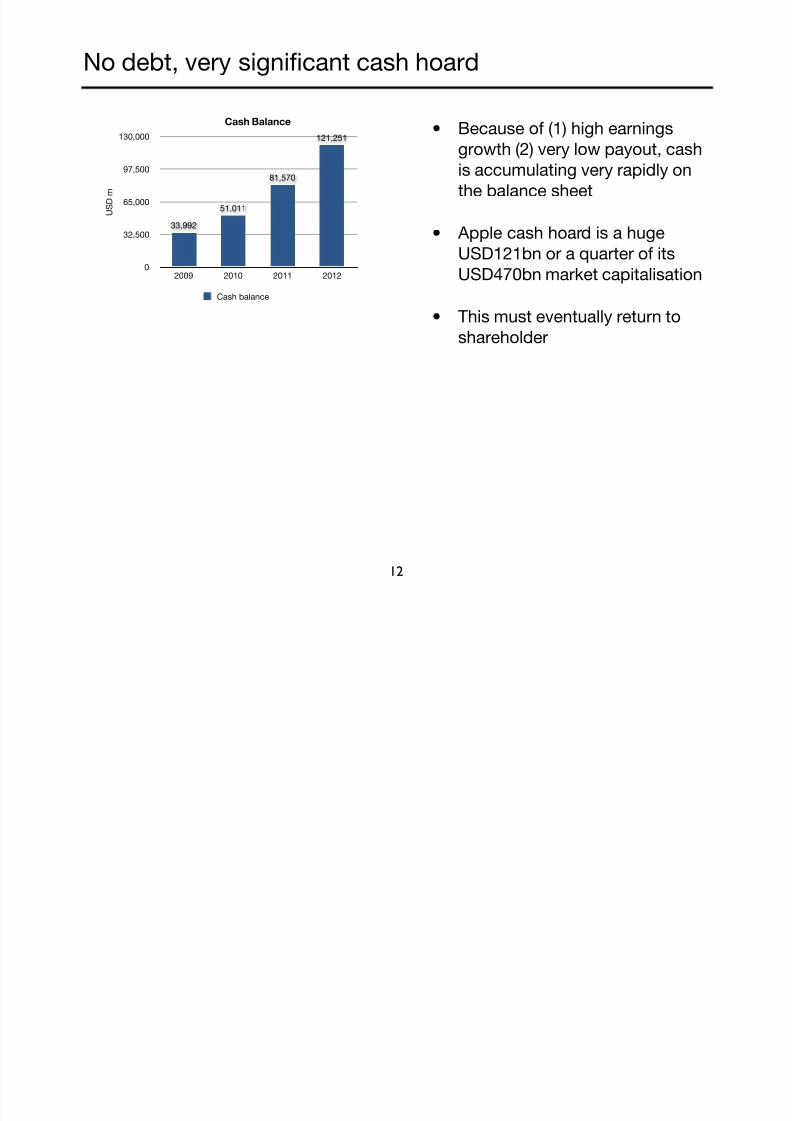
No debt, very significant cash hoard
• Because of (1) high earnings
growth (2) very low payout, cash
is accumulating very rapidly on
the balance sheet
• Apple cash hoard is a huge
USD121bn or a quarter of its
USD470bn market capitalisation
• This must eventually return to
shareholder
12
0
32,500
65,000
97,500
130,000
2009 2010 2011 2012
121,251
81,570
51,011
33,992
Cash Balance
U S D m
Cash balance

7/29/2019 NN AAPL 130122 A For Apple
http://slidepdf.com/reader/full/nn-aapl-130122-a-for-apple 13/34
13
Quantitative Overview
Qualitative OverviewLooking Ahead
Valuation and Conclusion
7/29/2019 NN AAPL 130122 A For Apple
http://slidepdf.com/reader/full/nn-aapl-130122-a-for-apple 14/34
Apple’s competitive advantages
Edge in innovation
Integrated business model
Financial strength
14
7/29/2019 NN AAPL 130122 A For Apple
http://slidepdf.com/reader/full/nn-aapl-130122-a-for-apple 15/34
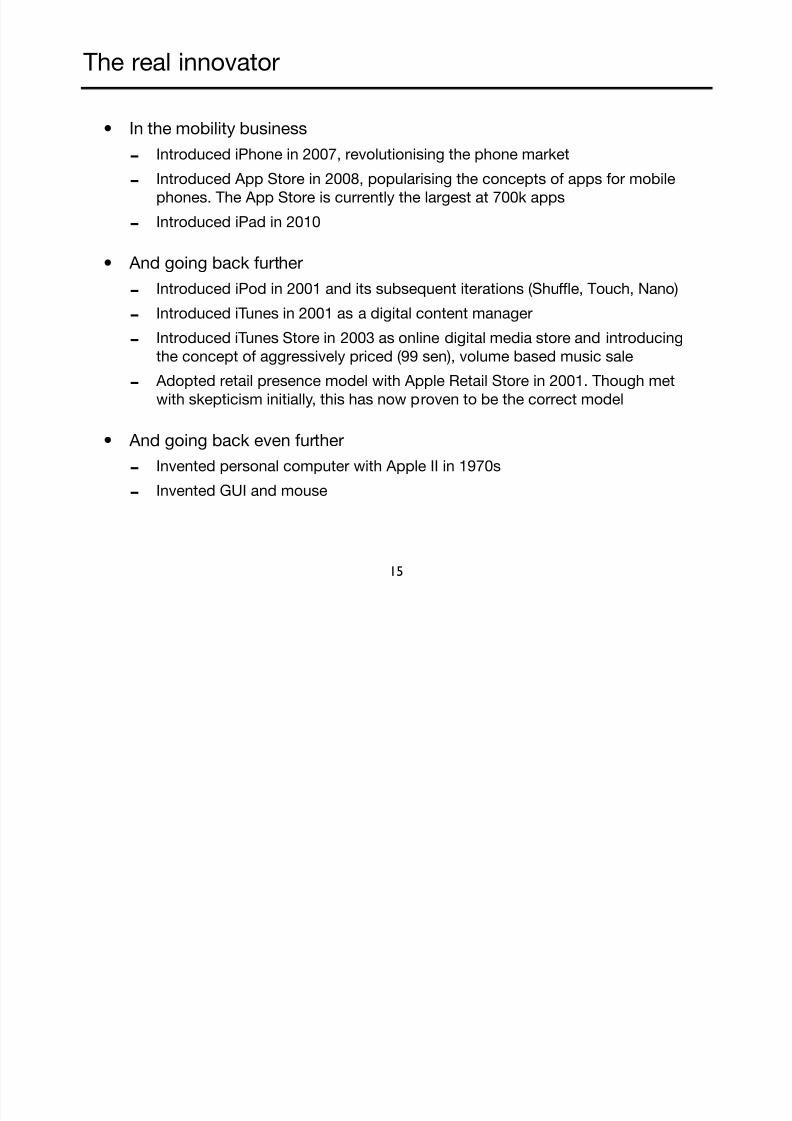
The real innovator
• In the mobility business
-Introduced iPhone in 2007, revolutionising the phone market
-Introduced App Store in 2008, popularising the concepts of apps for mobile
phones. The App Store is currently the largest at 700k apps
-Introduced iPad in 2010
• And going back further
-
Introduced iPod in 2001 and its subsequent iterations (Shuffle, Touch, Nano)
-Introduced iTunes in 2001 as a digital content manager
-Introduced iTunes Store in 2003 as online digital media store and introducing
the concept of aggressively priced (99 sen), volume based music sale
- Adopted retail presence model with Apple Retail Store in 2001. Though met
with skepticism initially, this has now proven to be the correct model
• And going back even further
-Invented personal computer with Apple II in 1970s
-Invented GUI and mouse
15
7/29/2019 NN AAPL 130122 A For Apple
http://slidepdf.com/reader/full/nn-aapl-130122-a-for-apple 16/34
What were the competitors doing all this time?
• What has Apple competitors introduced in comparison?
• Why didn’t RIM or Nokia or Samsung launched a phone like iPhone in 2007?
These are players that are already in the phone business
• Why didn’t any of the competitors see the benefit of an App Store? Now,
only Google App Store is a viable competitor to Apple App Store
• Apple took the lead with iPhone in 2007 but why did the competitors allow
Apple to take the lead with iPad again in 2010?
• Why are the competitors always behind?
• Perhaps something wrong with their business model?
16
7/29/2019 NN AAPL 130122 A For Apple
http://slidepdf.com/reader/full/nn-aapl-130122-a-for-apple 17/34
Apple’s business model
“[Apple] ...is committed to bringing the best user experience to its customers
through its innovative hardware, software, peripherals, and services.
[Apple]... business strategy leverages its unique ability to design and develop its
own operating systems, hardware, application software, and services to provide
its customers new products and solutions with superior ease-of-use, seamlessintegration, and innovative design”
Apple Annual Report
17
7/29/2019 NN AAPL 130122 A For Apple
http://slidepdf.com/reader/full/nn-aapl-130122-a-for-apple 18/34
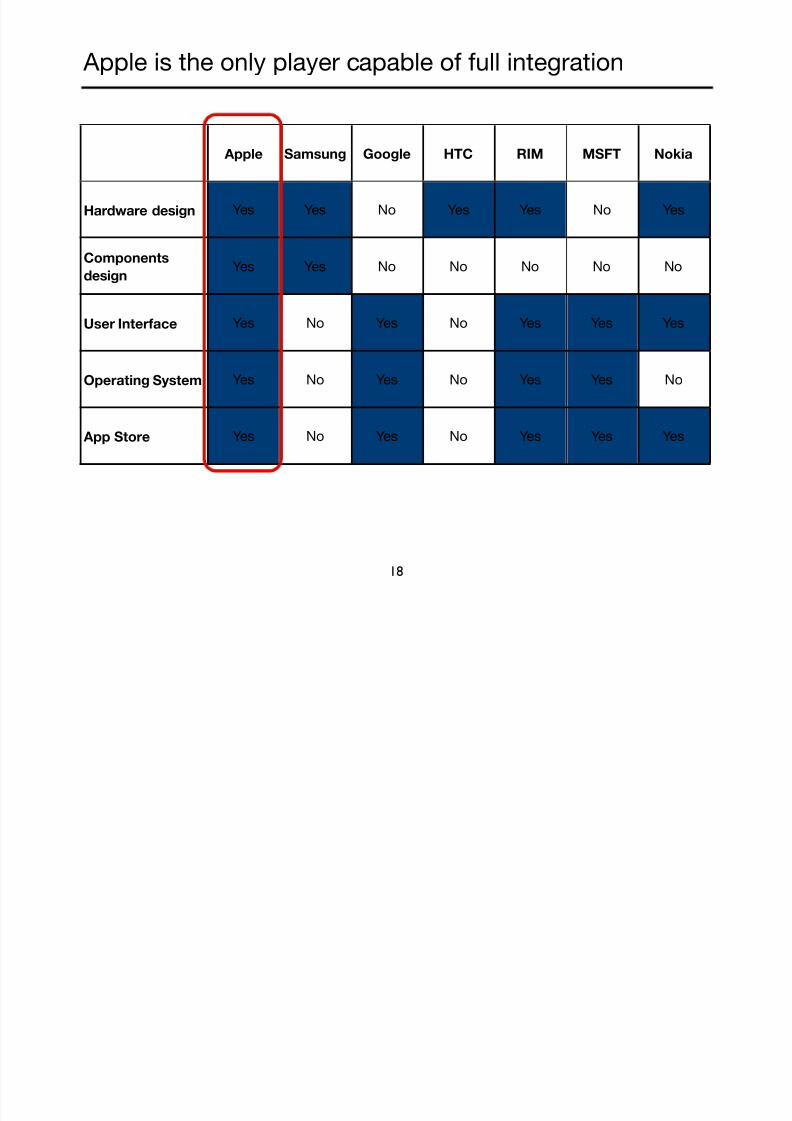
Apple is the only player capable of full integration
18
Apple Samsung Google HTC RIM MSFT Nokia
Hardware design Yes Yes No Yes Yes No Yes
Components
design
Yes Yes No No No No No
User Interface Yes No Yes No Yes Yes Yes
Operating System Yes No Yes No Yes Yes No
App Store Yes No Yes No Yes Yes Yes
7/29/2019 NN AAPL 130122 A For Apple
http://slidepdf.com/reader/full/nn-aapl-130122-a-for-apple 19/34
Benefit of full integration
• Full control of user experience
- Apple controls Mac OS, iOS, App Store, iTunes, iBookstore
-This provides (1) integration (2) consistent user experience across Apple
products desktops, laptops, iPhones, iPads
-This help cross selling and “lock-in” users into Apple ecosystem
• Clear differentiation
-
If you like iOS, Mac OS or App Store, you must buy an Apple product
-In contrast, if you like Android, you can pick a device from Google, Motorola,
HTC, Samsung, Sony
- This creates clear differentiation for Apple that can not be replicated by
competitors
-Not only are Apple’s competitors fighting Apple, they must also fight amongst
themselves since they sell similar products
19
7/29/2019 NN AAPL 130122 A For Apple
http://slidepdf.com/reader/full/nn-aapl-130122-a-for-apple 20/34
Other competitive advantages
• Limited portfolio and sheer volume
- Apple has a streamlined product offerings e.g. Apple introduces only one iPhone
per year
- Allow cost savings through bulk buying of components, easier repairs and after
sales service
- Also, allows a healthy third party accessories market as manufacturers only
need to design for one or two iPhone models
-
Same for application developments on the App Store
-In contrast, competitors products fragmented across different platforms and
models
• Significant retail presence
- Apple decided to establish retail presence in 2001 through Apple Retail Stores
-
Allows Apple to control user experience and after sales service
-Such strategy is being replicated by competitors but Apple already has a
headstart
20
7/29/2019 NN AAPL 130122 A For Apple
http://slidepdf.com/reader/full/nn-aapl-130122-a-for-apple 21/34
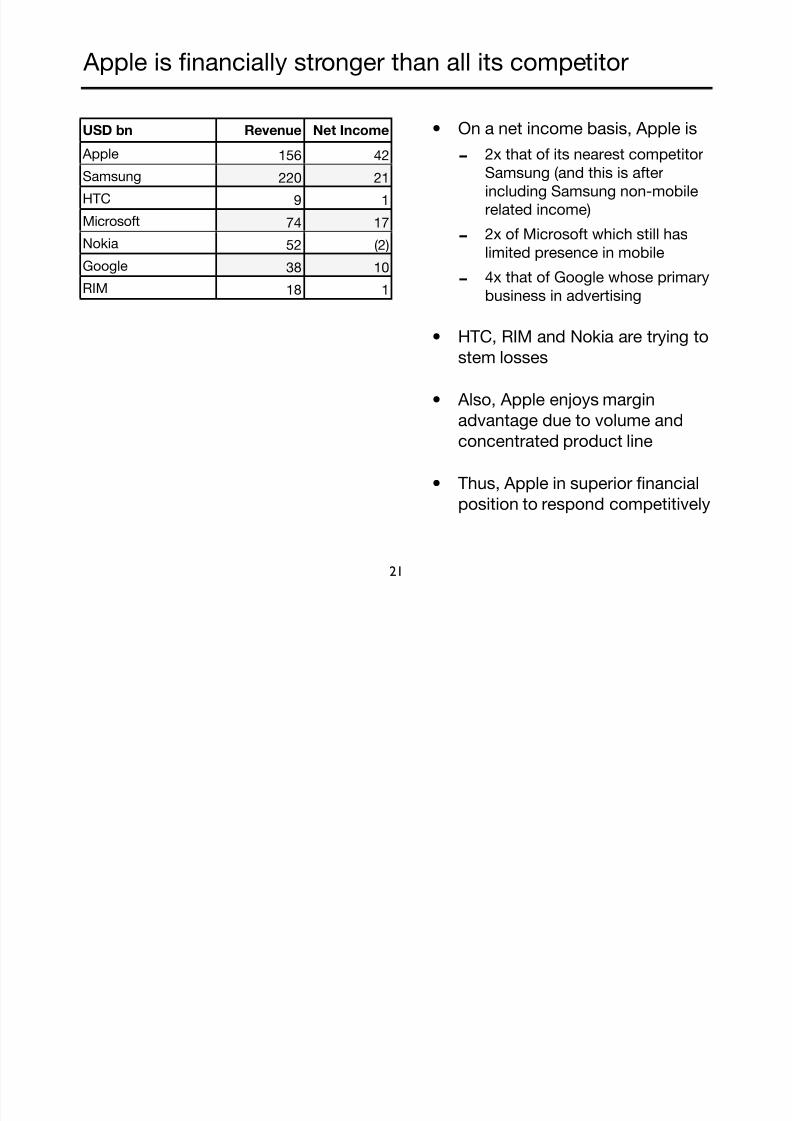
Apple is financially stronger than all its competitor
• On a net income basis, Apple is
-2x that of its nearest competitor
Samsung (and this is after
including Samsung non-mobile
related income)
-2x of Microsoft which still has
limited presence in mobile
-
4x that of Google whose primarybusiness in advertising
• HTC, RIM and Nokia are trying to
stem losses
• Also, Apple enjoys margin
advantage due to volume andconcentrated product line
• Thus, Apple in superior financial
position to respond competitively
21
USD bn Revenue Net Income
Apple
Samsung
HTC
Microsoft
Nokia
RIM
156 42
220 21
9 1
74 17
52 (2)
38 10
18 1
7/29/2019 NN AAPL 130122 A For Apple
http://slidepdf.com/reader/full/nn-aapl-130122-a-for-apple 22/34
Apple’s competitive advantages
Edge in innovation
Integrated business model
Financial strength
22

7/29/2019 NN AAPL 130122 A For Apple
http://slidepdf.com/reader/full/nn-aapl-130122-a-for-apple 23/34
23
Quantitative Overview
Qualitative OverviewLooking Ahead
Valuation and Conclusion
7/29/2019 NN AAPL 130122 A For Apple
http://slidepdf.com/reader/full/nn-aapl-130122-a-for-apple 24/34
24
What would Apple look like in the short term?
• Revenue composition continues to be dominated by iPhone/iPad
-By virtue of size, iPhone and iPad will continue to dominate revenue
-New products rumored to include iPhone 5S, cheaper iPhones, Apple TV
-But unlikely to have any impact in 2013
• Revenue growth may be more subdued
-Two sources contribute to revenue (1) upgrade buyers (2) new buyers
-Upgrade buyers merely replace their existing Apple products hence serve to
maintain revenue
-Only new buyers capable of creating strong revenue growth
- Apple revenue is biased towards hardware hence need to introduce new product
to sustain growth
-But what else can Apple introduce after iPhone and iPad?
-Very little other than cheaper iPhones to drive volume in emerging market
- Also, it is hard to grow a USD156bn revenue meaningfully
-Therefore, we believe Apple revenue will now grow at markedly lower rate
compared to previous years
7/29/2019 NN AAPL 130122 A For Apple
http://slidepdf.com/reader/full/nn-aapl-130122-a-for-apple 25/34
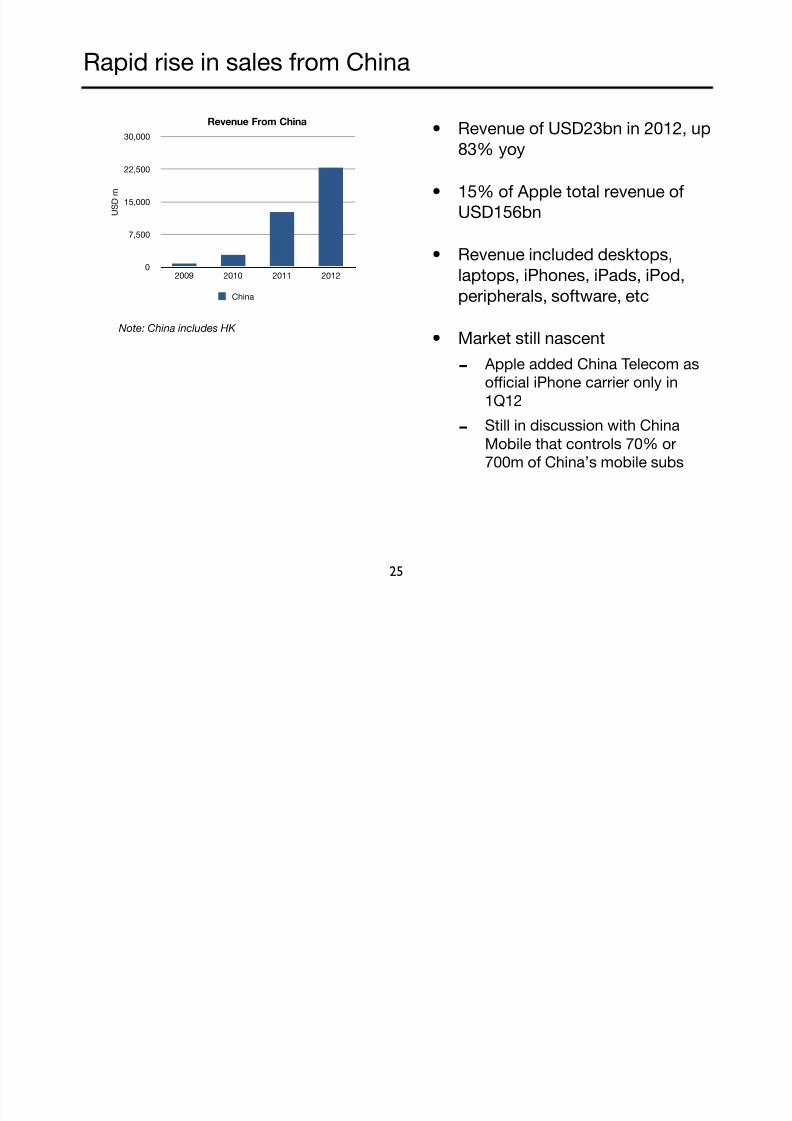
Rapid rise in sales from China
• Revenue of USD23bn in 2012, up
83% yoy
• 15% of Apple total revenue of
USD156bn
• Revenue included desktops,
laptops, iPhones, iPads, iPod,peripherals, software, etc
• Market still nascent
- Apple added China Telecom as
official iPhone carrier only in
1Q12
-
Still in discussion with China
Mobile that controls 70% or
700m of China’s mobile subs
25
0
7,500
15,000
22,500
30,000
2009 2010 2011 2012
Revenue From China
U S D m
China
Note: China includes HK
7/29/2019 NN AAPL 130122 A For Apple
http://slidepdf.com/reader/full/nn-aapl-130122-a-for-apple 26/34
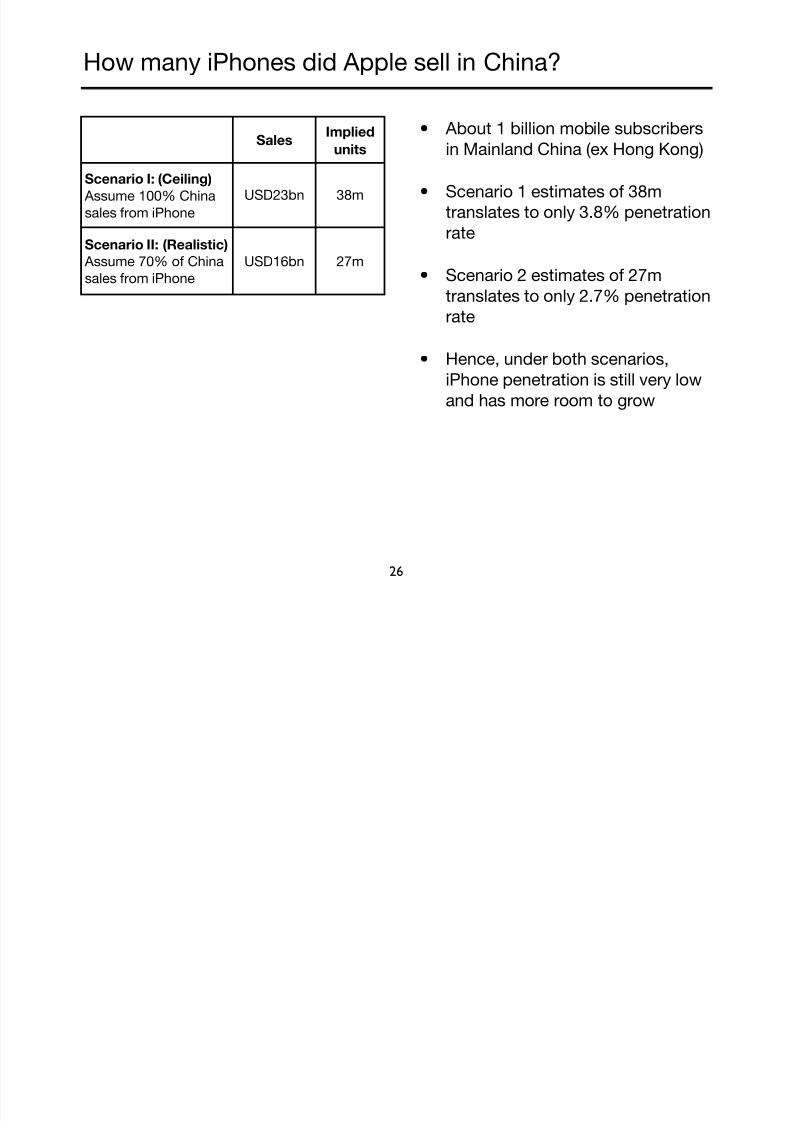
How many iPhones did Apple sell in China?
• About 1 billion mobile subscribers
in Mainland China (ex Hong Kong)
• Scenario 1 estimates of 38m
translates to only 3.8% penetration
rate
• Scenario 2 estimates of 27mtranslates to only 2.7% penetration
rate
• Hence, under both scenarios,
iPhone penetration is still very low
and has more room to grow
26
SalesImplied
units
Scenario I: (Ceiling)
Assume 100% China
sales from iPhone
USD23bn 38m
Scenario II: (Realistic)
Assume 70% of China
sales from iPhone
USD16bn 27m
7/29/2019 NN AAPL 130122 A For Apple
http://slidepdf.com/reader/full/nn-aapl-130122-a-for-apple 27/34
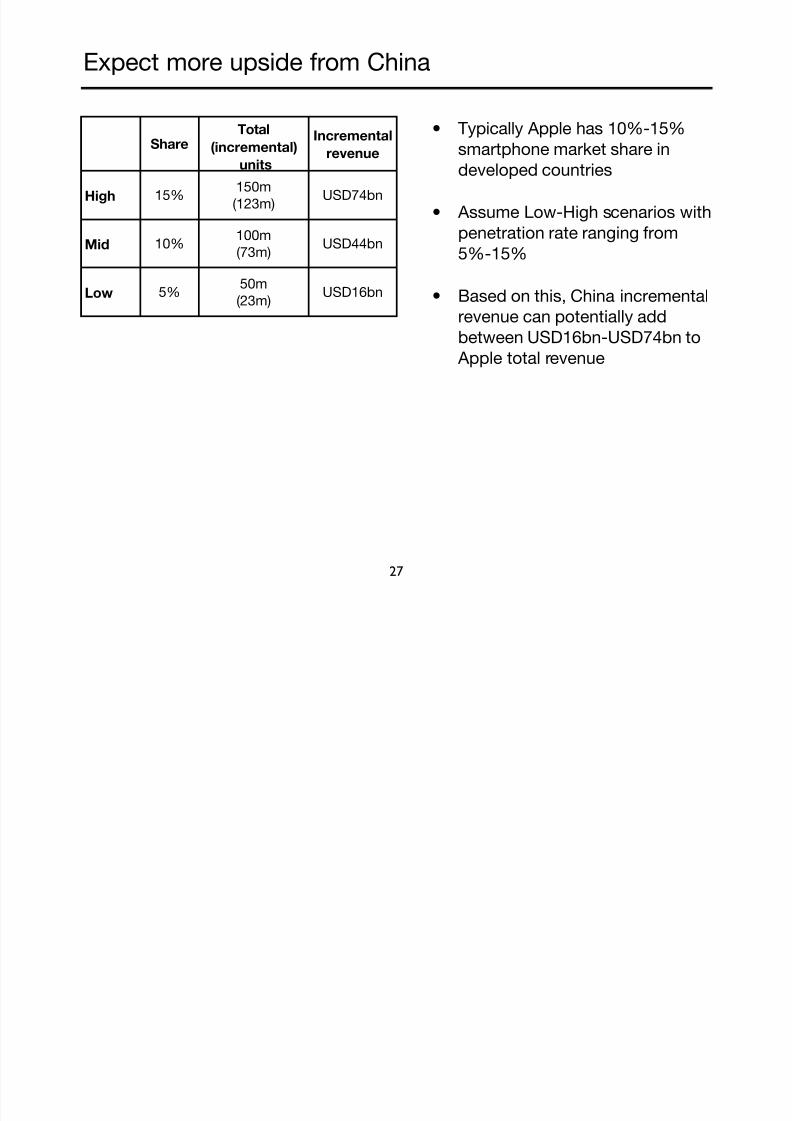
Expect more upside from China
• Typically Apple has 10%-15%
smartphone market share in
developed countries
• Assume Low-High scenarios with
penetration rate ranging from
5%-15%
• Based on this, China incremental
revenue can potentially add
between USD16bn-USD74bn to
Apple total revenue
27
Share
Total
(incremental)
units
Incrementalrevenue
High 15%150m
(123m)USD74bn
Mid 10%100m
(73m)USD44bn
Low 5% 50m(23m)
USD16bn
7/29/2019 NN AAPL 130122 A For Apple
http://slidepdf.com/reader/full/nn-aapl-130122-a-for-apple 28/34
28
Quantitative Overview
Qualitative OverviewLooking Ahead
Valuation and Conclusion
7/29/2019 NN AAPL 130122 A For Apple
http://slidepdf.com/reader/full/nn-aapl-130122-a-for-apple 29/34
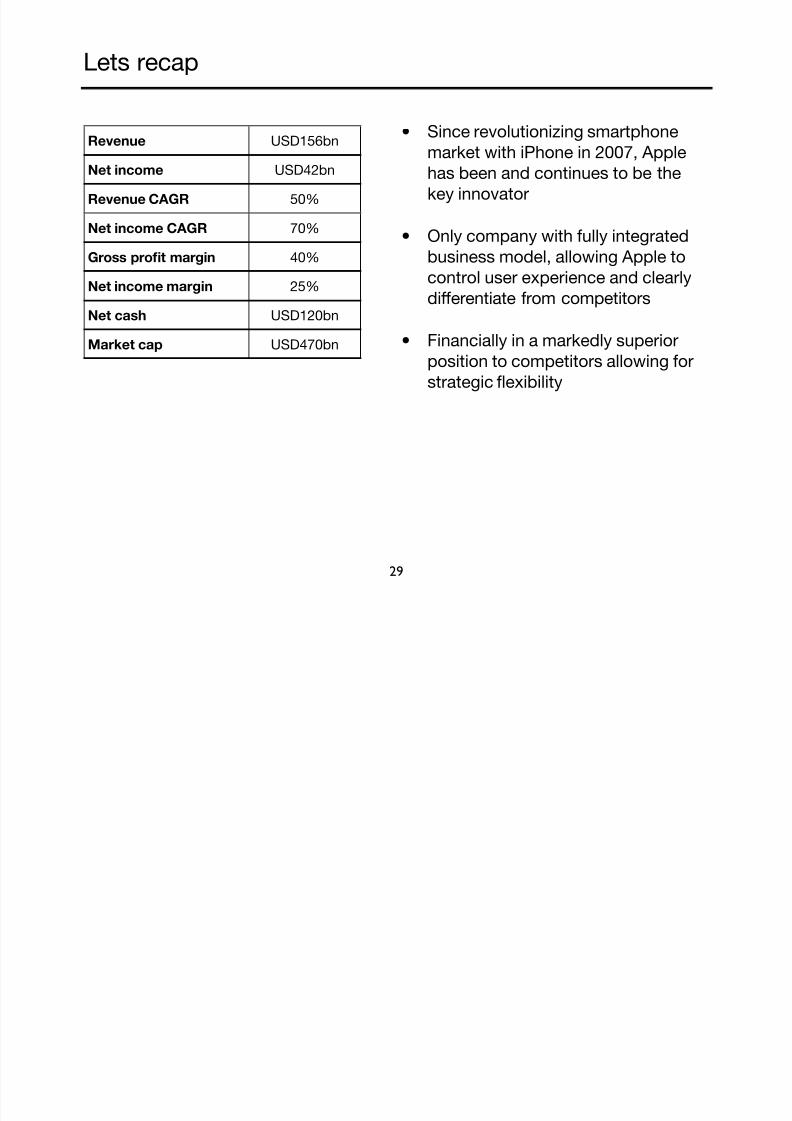
Lets recap
29
• Since revolutionizing smartphone
market with iPhone in 2007, Apple
has been and continues to be the
key innovator
• Only company with fully integrated
business model, allowing Apple to
control user experience and clearlydifferentiate from competitors
• Financially in a markedly superior
position to competitors allowing for
strategic flexibility
Revenue USD156bn
Net income USD42bn
Revenue CAGR 50%
Net income CAGR 70%
Gross profit margin 40%
Net income margin 25%
Net cash USD120bn
Market cap USD470bn
7/29/2019 NN AAPL 130122 A For Apple
http://slidepdf.com/reader/full/nn-aapl-130122-a-for-apple 30/34
On the positive side
• Integrated business model is not replicable by competitors
-Competitors unable to take customers away from Apple through imitation but
only through superior product
-Currently competitors fragmented and at a disadvantage both financially and
strategically
• This means Apple sales growth will decline or reverse only if
-
Consumers stop viewing Apple products as better than competitors product
- Apple run out of consumers to sell to at premium prices
• We believe both risks are mitigated in the short term
-Firstly, Apple ability to innovate will not diminish overnight even though a series
of missteps will be fatal. As such, brand goodwill should be protected short term
-
Secondly, still room for Apple to grow especially in China
30
7/29/2019 NN AAPL 130122 A For Apple
http://slidepdf.com/reader/full/nn-aapl-130122-a-for-apple 31/34
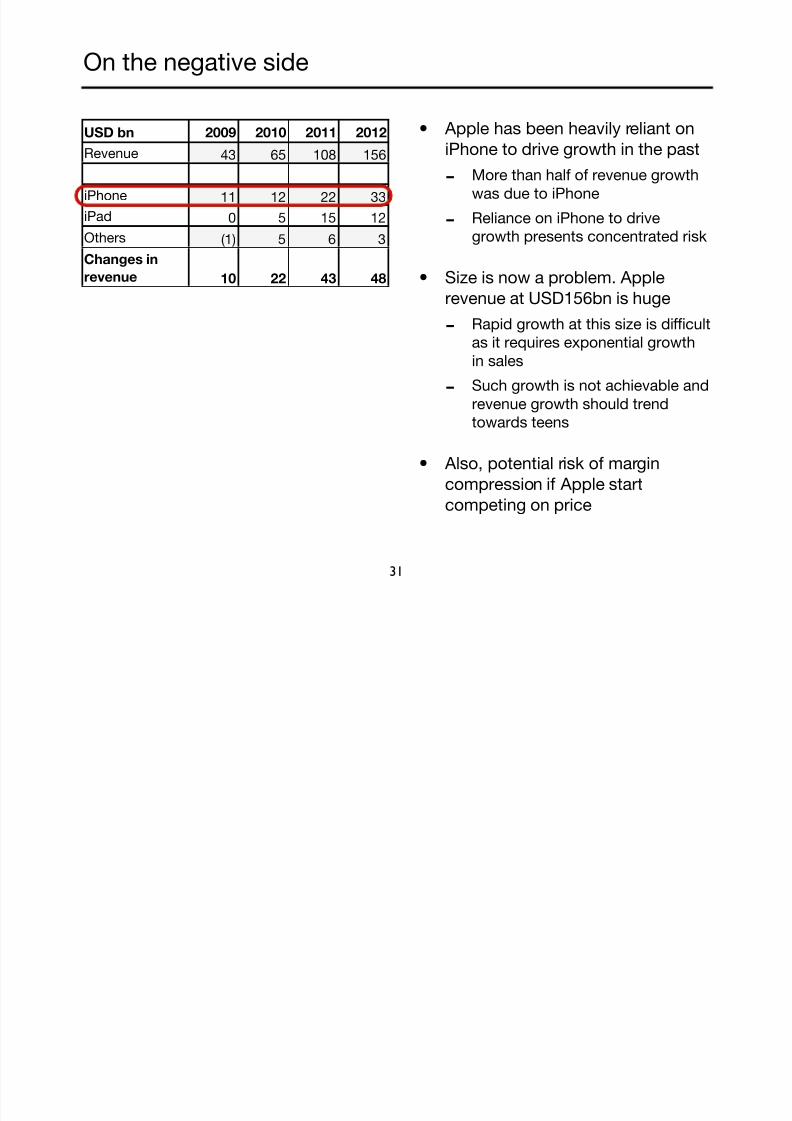
On the negative side
• Apple has been heavily reliant on
iPhone to drive growth in the past
-More than half of revenue growth
was due to iPhone
-Reliance on iPhone to drive
growth presents concentrated risk
• Size is now a problem. Applerevenue at USD156bn is huge
- Rapid growth at this size is difficult
as it requires exponential growth
in sales
-Such growth is not achievable and
revenue growth should trend
towards teens
• Also, potential risk of margin
compression if Apple start
competing on price
31
USD bn
Revenue
iPhone
iPad
Others
Changes in
revenue
2009 2010 2011 2012
43 65 108 156
11 12 22 33
0 5 15 12
(1) 5 6 3
10 22 43 48
7/29/2019 NN AAPL 130122 A For Apple
http://slidepdf.com/reader/full/nn-aapl-130122-a-for-apple 32/34
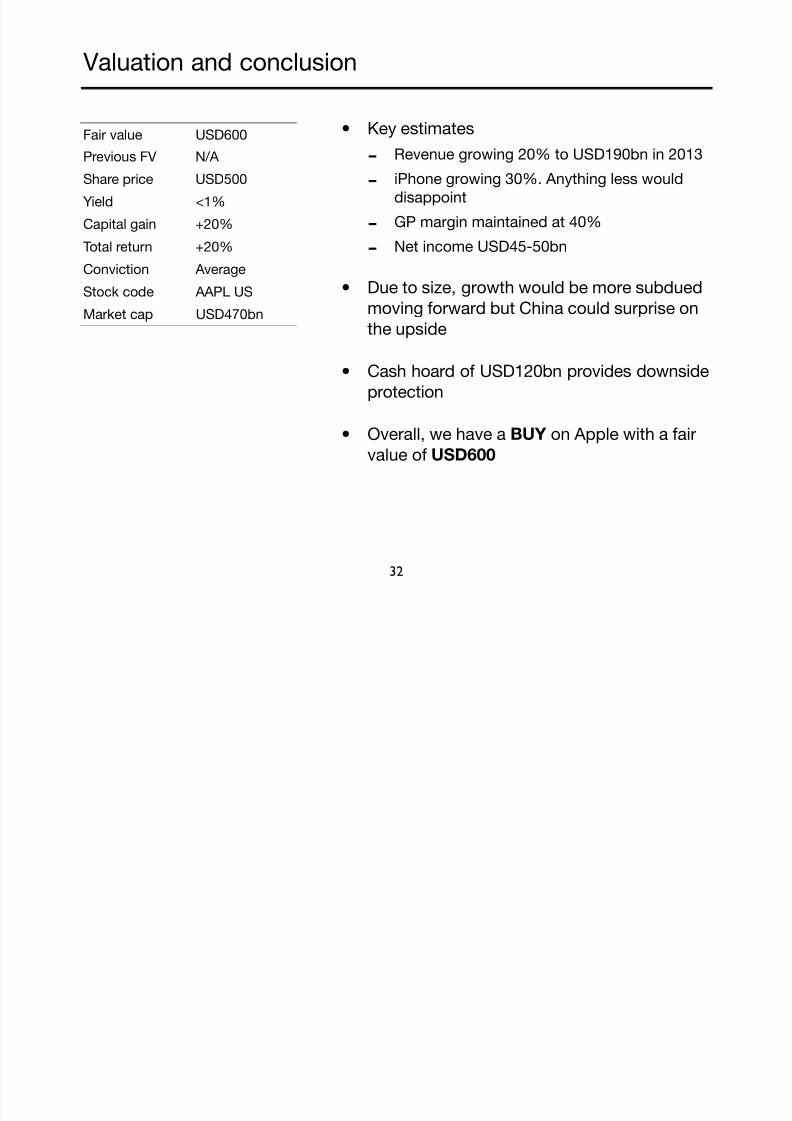
Valuation and conclusion
• Key estimates
-Revenue growing 20% to USD190bn in 2013
-iPhone growing 30%. Anything less would
disappoint
-GP margin maintained at 40%
-Net income USD45-50bn
• Due to size, growth would be more subdued
moving forward but China could surprise on
the upside
• Cash hoard of USD120bn provides downside
protection
• Overall, we have a BUY on Apple with a fair
value of USD600
32
Fair value USD600
Previous FV N/A
Share price USD500
Yield <1%
Capital gain +20%
Total return +20%
Conviction Average
Stock code AAPL US
Market cap USD470bn
7/29/2019 NN AAPL 130122 A For Apple
http://slidepdf.com/reader/full/nn-aapl-130122-a-for-apple 33/34
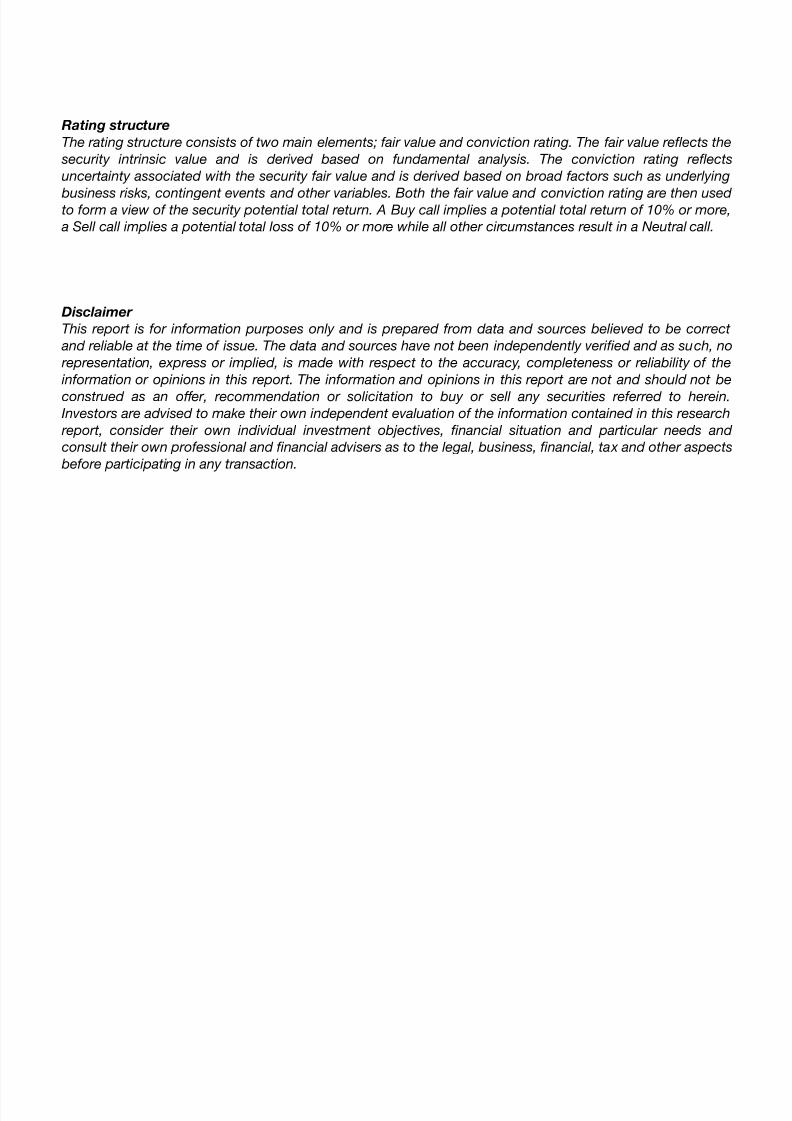
Rating structure
The rating structure consists of two main elements; fair value and conviction rating. The fair value reflects the security intrinsic value and is derived based on fundamental analysis. The conviction rating reflects
uncertainty associated with the security fair value and is derived based on broad factors such as underlying
business risks, contingent events and other variables. Both the fair value and conviction rating are then used
to form a view of the security potential total return. A Buy call implies a potential total return of 10% or more,
a Sell call implies a potential total loss of 10% or more while all other circumstances result in a Neutral call.
Disclaimer
This report is for information purposes only and is prepared from data and sources believed to be correct
and reliable at the time of issue. The data and sources have not been independently verified and as such, no
representation, express or implied, is made with respect to the accuracy, completeness or reliability of the
information or opinions in this report. The information and opinions in this report are not and should not be
construed as an off er, recommendation or solicitation to buy or sell any securities referred to herein.
Investors are advised to make their own independent evaluation of the information contained in this research report, consider their own individual investment objectives, financial situation and particular needs and
consult their own professional and financial advisers as to the legal, business, financial, tax and other aspects
before participating in any transaction.

7/29/2019 NN AAPL 130122 A For Apple
http://slidepdf.com/reader/full/nn-aapl-130122-a-for-apple 34/34
www.nonameresearch.com