ADVERSITY QUOTIENT® AND LEADERSHIP … QUOTIENT® AND LEADERSHIP SKILLS OF SCHOOL ADMINISTRATORS:...
90
ADVERSITY QUOTIENT® AND LEADERSHIP SKILLS OF SCHOOL ADMINISTRATORS: BASIS FOR LEADERSHIP ENHANCEMENT PROGRAM A THESIS Presented to The Faculty of Graduate Studies and Teacher Education Research Philippine Normal University Visayas In Partial Fulfillment Of the Requirements for the Degree of MASTER OF ARTS IN EDUCATION With Specialization in Educational Management ENJENETTE D. BAROA March 2015
Transcript of ADVERSITY QUOTIENT® AND LEADERSHIP … QUOTIENT® AND LEADERSHIP SKILLS OF SCHOOL ADMINISTRATORS:...
ADVERSITY QUOTIENT® AND LEADERSHIP SKILLS
OF SCHOOL ADMINISTRATORS: BASIS FOR LEADERSHIP ENHANCEMENT PROGRAM
A THESIS Presented to
The Faculty of Graduate Studies and Teacher Education Research Philippine Normal University
Visayas
In Partial Fulfillment Of the Requirements for the Degree of MASTER OF ARTS IN EDUCATION
With Specialization in Educational Management
ENJENETTE D. BAROA
March 2015
CERTIFICATE OF APPROVAL
The thesis attached hereto, titled ADVERSITY QUOTIENT® AND LEADERSHIP SKILLS OF SCHOOL ADMINISTRATORS: BASIS FOR LEADERSHIP ENHANCEMENT PROGRAM, prepared and submitted by ENJENETTE D. BAROA in partial fulfillment of the requirements for the degree of MASTER OF ARTS IN EDUCATION with specialization in Educational Management, is hereby recommended for oral examination.
ALBERTO A. RICO Adviser
Approved in partial fulfillment of the requirements for the degree of Master of Arts in Education by the Oral Examination Committee.
RUEL T. BONGANCISO GRACE J. FUENTES Member Member
ELISEO P. MARPA Chair
Accepted in partial fulfillment of the requirements for the degree of Master of Arts in Education. RANDYLL V. VILLONES Associate Dean, Faculty of Graduate Studies and Teacher Education Research
DESIREE B. CACERES Dean for Academics

Abstract
This study aimed to determine the relationship between the Adversity Quotient® and Leadership Skills in relation to the demographic profile of school administrators in the Division of Cadiz City. The descriptive-correlational method of research was employed. The respondents were the public elementary and secondary school administrators in the division. The data were obtained using the two (2) sets of questionnaires from Dr. Paul G. Stoltz and Peter Northouse (2011) which measures the level of one’s Adversity Quotient® and leadership skills, respectively. The frequency-percentage was used in determining the profiles of the respondents in terms of demographic variables such as age, sex, marital status, length of service as school administrator and school level administered, while mean was used to determine the levels of Adversity Quotient® and Leadership Skills. Pearson r was employed to determine the significant relationship between Adversity Quotient® and Leadership Skills. Findings revealed that when demographic profiles were considered the level of Adversity Quotient® of school administrators in its four (4) dimensions was Below Average while their Leadership Skills in its three (3) areas marked high. However, a low degree of correlation was observed between the total leadership skills and total Adversity Quotient®. It was concluded then, that the school administrators’ level of Adversity Quotient® did not totally affect their leadership skills. It is recommended that one must clearly understand AQ® and review AQ® Profile and leadership strengths and weaknesses. Furthermore, the top level management will consider developing leadership enhancement program basing from the results of the study.
ACKNOWLEDGMENT
I am deeply indebted to numerous individuals whose wholehearted support and assistance made this thesis a joyful reality.
My commendation goes to the most modest person I’ve known, my adviser, Dr. Alberto A. Rico, for his immense support, outstanding guidance and encouragement to keep going, pushing me towards the realization of this endeavor. His expertise in research and statistics has greatly inspired me to persevere in this challenging professional growth.
Dr. Desiree B. Caceres, Head for Academics, and Dr. Randyll V. Villiones, Associate Dean, Faculty of Graduate Studies and Teacher Education Research, for their invaluable insights and suggestions during the colloquium and final defense. My panel members, Prof. Eliseo P. Marpa, Dr. Ruel Bonganciso, Dr. Gliceria Arlyn Garancho, and Mrs. Grace J. Fuentes for their constructive suggestions, comments, and recommendations for the improvement of this study. It was indeed a great privilege to have worked with you.
Special gratitude is likewise accorded to Mrs. Elena D. Olvido, CESO VI, Officer-In-Charge, Schools Division Superintendent of the Division of Cadiz City, for permitting me to conduct my study in the division.
I also owe sincere thanks to all four (4) Public Schools District Supervisors, Mr. Joel B. Clavel, Mrs. Nida Arcenia, Mr. Edgardo Marcella, and Mr. Joshua Santillana for allowing me to join their respective meetings in order to discuss the study to the school administrators.
Words may not be enough to thank my co-school administrators, all the school principals in the elementary and secondary schools, who skillfully and sincerely answered the questionnaires. Despite the busy schedules, they’ve willingly answered the challenge. You were all awesome!
Dr. Paul G. Stoltz, and the Peak Learning, Inc. for giving me the opportunity to use the Adversity Response Profile (AQ®P) version 9.1 and for their generous support to this study; Special thanks to Ms. Katie Martin for her valuable assistance in answering my queries and keeping track of the development of the study;
My special sister and best friend in DepED, Mrs. Heidi S. Hofilena for her moral support and cheerful discussions as we shared our “Secret” together lifting my spirit to keep trying. Our friendship is valued much!
I am highly thankful for the overflowing support extended by my parents, Mrs. Edna V. Damasco and Mr. Efren L. Damasco. You had been my constant source of unflinching support and encouragement and this has been a great source of strength and motivation for me to accomplish my objectives. My brothers, Eugene Jan and Edfren, and sister in-laws, Leah and Rose have extended all their affection and moral support without which it would not have been possible to pursue my work. My grandmother, Letecia and in-laws and relatives especially the Baroa and Fernandez Families who are proud that I am part of their family, for building me up;
Manang Vegonia, my aunt, who took my entire domestic role that without her, working on this thesis would be impossible;
For the love, trust, confidence, and motivation of my husband, Mr. Francis Mozart F. Baroa III, whose support and computer skills made my work easier. He may may be far yet his support is more than what I’ve expected in order to carry on the challenge; to my two little God-given inspirations, my daughter, Kaycee, and son, Fordee for keeping me smile even in the midst of adversities. You were truly my strength to reach this point. You opened to me the door of opportunity I once closed. I love you so much for instilling in me that attitude of “persistence” that in everything I do, I should do it for the glory of God.
Above all, to our God Almighty, who showered His divine grace and intervention as I endure the hardship towards the realization of this study. He is worthy to receive all the praises and endless honor. Thank you God for loving me this much!
EDB

To
GOD
For the greatest source of wisdom and strength
Husband FRANCIS
Children, Kaycee and Fordee
For the constant source of love, support and understanding.
I am truly thankful for having you in my life.
This thesis is for you.

TABLE OF CONTENTS
PAGE
TITLE PAGE ……………………………………………………………… i
APPROVAL SHEET …………………………………………………….. ii
ABSTRACT ………………………………………………………………. iii
ACKNOWLEDGMENT ………………………………………………….
DEDICATION …………………………………………………………….
iv
vi
TABLE OF CONTENTS ………………………………………………… vii
LIST OF TABLES ……………………………………………………….. x
Chapter 1 The Problem and its Background
1.1 Introduction ………………………………………………….. 1
1.2 Conceptual Framework ………………………………………. 3
1.3 Statement of the Problem………………………..…... 8
1.4 Significance of the Study ……………………………. 9
1.5 Scope and Delimitation of the Study ………………. 10
1.6 Definition of Terms ………………………………….. 11
Chapter 2 Review of Related Literature
2.1 Conceptual Literature …………………………………………. 13
2.2 Research Literature …………………………………………. 22
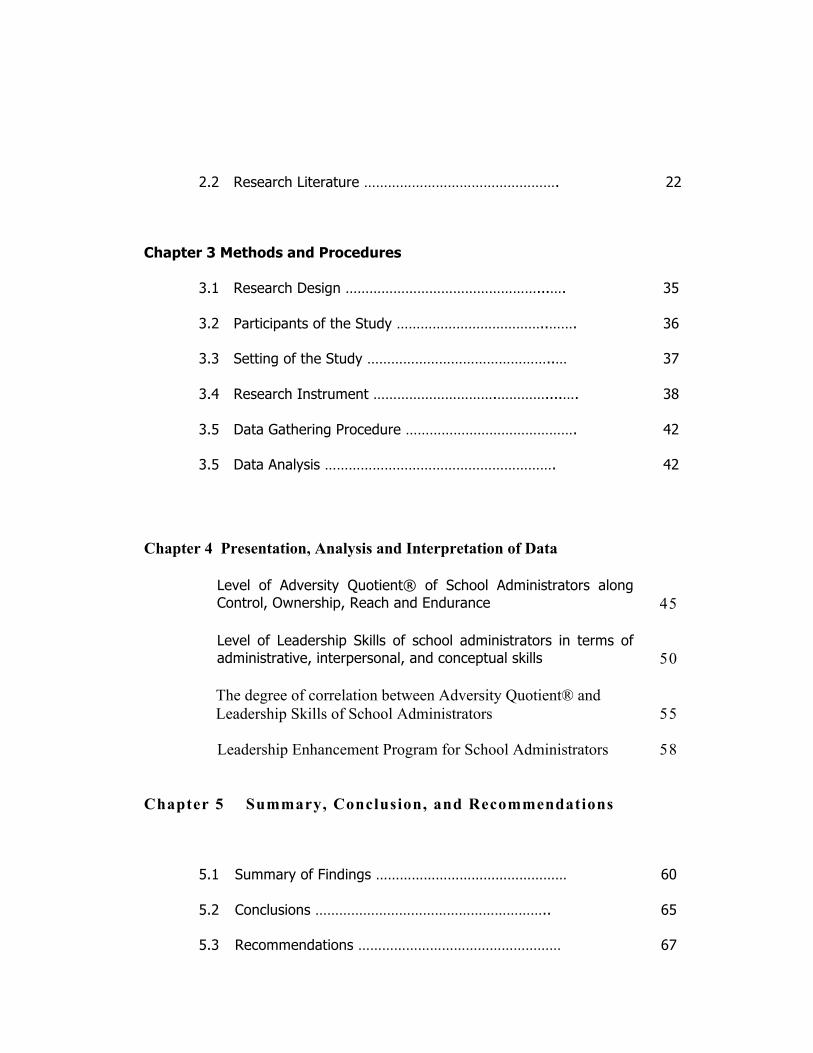
Chapter 3 Methods and Procedures
3.1 Research Design …………………………………………...…. 35
3.2 Participants of the Study ………………………………..……. 36
3.3 Setting of the Study ………………………………………..… 37
3.4 Research Instrument ………………………….…………....…. 38
3.5 Data Gathering Procedure ……………………………………. 42
3.5 Data Analysis …………………………………………………. 42
Chapter 4 Presentation, Analysis and Interpretation of Data
Level of Adversity Quotient® of School Administrators along Control, Ownership, Reach and Endurance
45
Level of Leadership Skills of school administrators in terms of
administrative, interpersonal, and conceptual skills
50 The degree of correlation between Adversity Quotient® and
Leadership Skills of School Administrators
55
Leadership Enhancement Program for School Administrators
58
Chapter 5 Summary, Conclusion, and Recommendations
5.1
Summary of Findings ………………………………………… 60
5.2
Conclusions ………………………………………………….. 65
5.3 Recommendations …………………………………………… 67
REFERENCES …………………………………………………………….. 69
APPENDICES ……………………………………………………………… 73
CURRICULUM VITAE…………………………………………………… 80
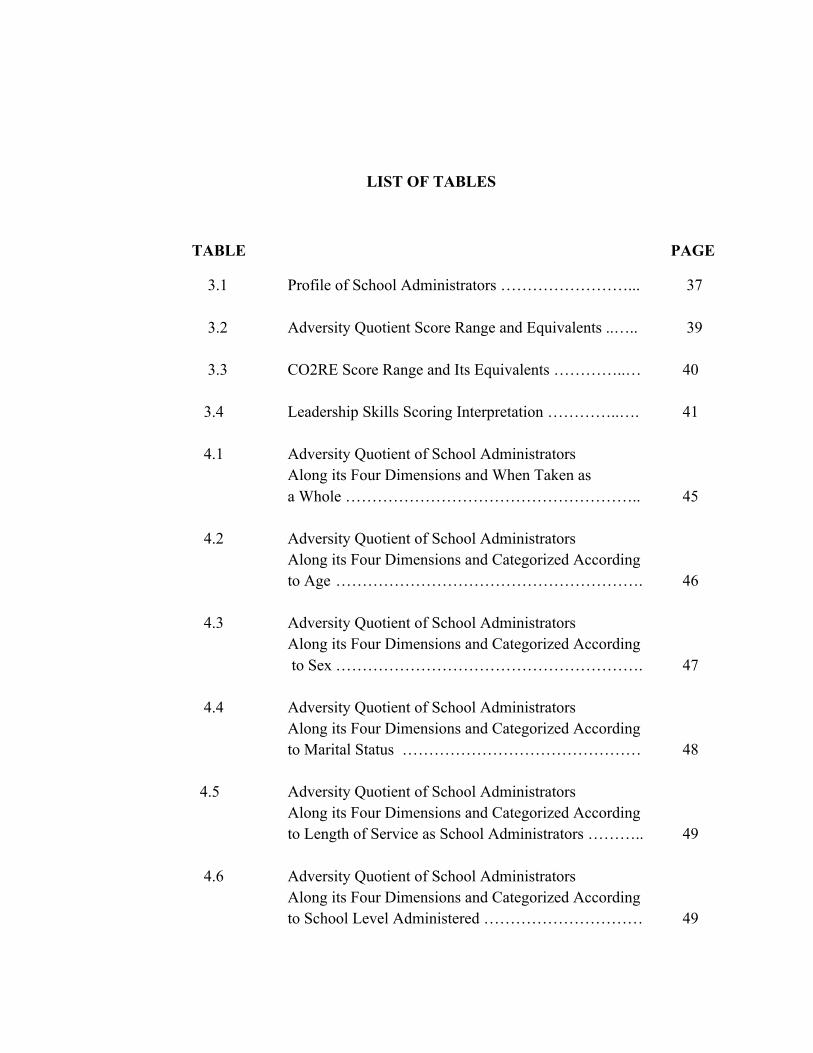
LIST OF TABLES
TABLE PAGE
3.1 Profile of School Administrators ……………………... 37 3.2 Adversity Quotient Score Range and Equivalents ..….. 39 3.3 CO2RE Score Range and Its Equivalents …………..… 40 3.4 Leadership Skills Scoring Interpretation …………..…. 41 4.1 Adversity Quotient of School Administrators Along its Four Dimensions and When Taken as a Whole ……………………………………………….. 45 4.2 Adversity Quotient of School Administrators Along its Four Dimensions and Categorized According
to Age …………………………………………………. 46
4.3 Adversity Quotient of School Administrators Along its Four Dimensions and Categorized According
to Sex …………………………………………………. 47
4.4 Adversity Quotient of School Administrators Along its Four Dimensions and Categorized According
to Marital Status ……………………………………… 48
4.5 Adversity Quotient of School Administrators Along its Four Dimensions and Categorized According
to Length of Service as School Administrators ……….. 49
4.6 Adversity Quotient of School Administrators Along its Four Dimensions and Categorized According
to School Level Administered ………………………… 49

4.7 Leadership Skills of Schools Administrators along its Three Areas and When Taken as a Whole ……………… 50 4.8 Leadership Skills of School Administrators Along its Three Areas and Categorized According to Age ……….. 51 4.9 Leadership Skills of School Administrators Along its Three Areas and Categorized According to Sex ……….. 52 4.10 Leadership Skills of School Administrators Along its Three Areas and Categorized According to Marital Status ………………………………………………………. 52 4.11 Leadership Skills of School Administrators Along its Three Areas and Categorized According to Length of Service as School administrator …………………………. 53 4.12 Leadership Skills of School Administrators Along its Three Areas and Categorized According to School Level Administered ……………………………………………. 53 4.13 Degree of Correlation Among Administrative Skills And Dimensions of AQ …………………………………. 58 4.14 Degree of Correlation Among Interpersonal Skills And Dimensions of AQ …………………………………. 54 4.15 Degree of Correlation among Conceptual Skills And Dimensions of AQ …………………………………. 56 4.16 Degree of Correlation Among Total Leadership Skills And Dimensions of AQ …………………………………. 57

Chapter 1
THE PROBLEM AND ITS BACKGROUND
1.1 Introduction
The educational system is tremendously challenging particularly in the
managerial, technical, and financial competence of its officials. Public school education
is a government service led by officials assigned at various levels of the Department of
Education (DepEd). Centralization and decentralization concepts are often observed in
DepEd. At times, this scenario creates stress to a certain degree, especially for those who
are at the lower level management – the principals.
The birth of Republic Act 9155, an Act Instituting a Framework of Governance
for Basic Education and for other purposes, decentralizes Philippine education at the
grassroots level.The shifting paradigm to school-based management is timely for an
educational system that is continuously seeking the path to excellence and modernization.
School-Based Management (SBM) reforms aimed at empowering school
administrators and teachers or at strengthening their professional motivation, thereby
enhancing their sense of ownership of the school. Many of these reforms have also
strengthened parental involvement in the schools, sometimes by means of school councils
and organizations. Responsibility and decision-making over school operations are
transferred to school administrators, teachers, parents, sometimes students, and other
school stakeholders. However, these administrators have to conform to, or operate within
a set of centrally determined policies by the Department of Education.
The school administrator’s role therefore plays a vital part in the implementation and
supervision of various school programs, projects, and activities. Williams (2010),
Rosenholtz (2009) and Stoltz (1997) mentioned that school administrators are usually the
major source and the driving forces that uphold the welfare of the school. Their position
is significant to the educational development and academic growth and performance of
the pupils.
Mostly, school administrators face and see challenges as their worst constant
companion with a lot of responsibilities and accountabilities underlying their position.
Mismanagement and unsuccessful handling of every challenge will greatly affect
performance of school children, parents, and even the entire school community. With
these countless duties associated with being a school head, the path is often strewn with
conflict, adversity and crisis (Ferrer, 2009). In order to improve levels of performances of
school leaders, they must be well equipped with not only knowledge but with the right
attitude towards the adversities they may experience. Adversities can be an obstacle to
the fulfillment of the school administrators in achieving their goals and aspirations for the
institution. However, adversities can be an opportunity to strengthen the thoughts of a
person and establish one’s achievements. Surpassing any adverse event in life will lead a
person to better way of understanding a problem.
This study aimed to determine the Leadership Skills as well as the Adversity Quotient®
of the elementary and secondary school administrators in the Division of Cadiz City. It is
deemed necessary likewise to determine how the demographic profile affects the
Adversity Quotient and leadership skills of the school administrators.
1.2 Conceptual/Theoretical Framework
The main concern of the study was to explore the level of Adversity Quotient
(AQ®) in the field of school administration and to determine the school administrators’
AQ® and level of leadership skills which will serve as basis for enhancement.
This conceptual framework presents the interrelationships of school
administrators’ demographic profile to the Adversity Quotient® and leadership skills of
the target respondents. The demographic profile believed to be significant in this study
includes: age, sex, marital status, length of service as school administrator, and school
level administered. Variables such as age and sex have been used to predict many
behaviors, including leadership effectiveness (Thompson, 2000). Marital status
categorizes school administrators as married and unmarried leaders both bring positive
and negative effects as to their performances. Olian, Carroll, Giannantonio, and Feren
(1988) stress the term “support system” for married school administrators receiving
support and assistance from family, friends, children, and spouse. On the other hand, this
challenges them on how to manage time effectively by setting priorities between career
and family. The school administrators’ experiences counted through years of

service and school level administered basically could affect the result of leadership skills
and level of Adversity Quotient®.
In this study the AQ® level is the dependent variable. The principals’ adversity
quotient measures how one responds in the face of difficult problems encountered in
school which can be understood, and changed. This AQ begins with individual’s behavior
and it encompasses four dimensions of control, ownership, reach and endurance. Control,
according to Podsakoff and Farh (1989) affects their performance in the midst of adverse
situations. Ownership and origin have something to do with accountability which
influences leadership. Reach dimension assess how far adversity affects areas of life
usually leading to poor decision making and distancing oneself to others that can affect
leadership (Bandura, 1995). The endurance dimension of AQ (Peterson, Seligman et al,
1993) responds to the time adversities which can affect performance and practices.
With the theories presented in each dimension of Adversity, the school
administrators’ leadership skills are found to be challenged. The multi-faceted roles of
being school administrators could exert too much pressure on their psychological and
social well-being, which in turn, could jeopardize the gainful existence of a school.
Currently, schools are facing many issues and emergent adversities with which
educational leaders must contend. Emergent adversities such as academic problems, drug
addictions, early pregnancy, parental problems, bullying, and discipline are the most
common. In addition to this, according to Senge (1999), advances and changes in
technology, science, values, environment, and international relationship hold a varied
assortment of challenges and adversities in education. How a leader responds to these
adversities not only affects the leader’s performance but also challenge his/her leadership
skills in leading a school. Learning to deal with adversity in the organization in one’s
career life is an essential element of effective leadership (Wallington, 2004).
The level of school administrators’ leadership skills in this study can be gauged
through a questionnaire adopted from Peter Northouse (Introduction to Leadership-
Concepts and Practice, 2nd edition, June 2011). The three (3) performance areas believed
to be very critical in leading a school include: Administrative, Interpersonal, and
Conceptual Skills which ranges as Very True, Somewhat True, Occasionally True,
Seldom True, and Not True.
In the course of the study, leadership focused on the administrative skills covers
communicating, computing, organizing, planning, scheduling, or staffing where
prioritizing and time management of tasks are being tested. To properly execute tasks,
interpersonal skills have to be developed. Perceived as optimistic, calm, confident and
charismatic –these are qualities that are often endearing or appealing to others.
Conceptual skill, on the other hand, is the ability to think creatively about, analyze and
understand complicated and abstract ideas. Using a well-developed conceptual skill set,
top level business managers need to be able to look at their company as a holistic entity,
to see the interrelationships between its divisions, and to understand how the firm fits

into and affects its overall environment. This generally is because of their ability to
understand the organization as a whole and develop creative strategies.
The extent of school administrators’ leadership skills and adversity quotient can
be perceived by both elementary and secondary school administrators and can be
analyzed in relation to the following variables: age, sex, marital status, length of service
as school administrator, and school level administer. The interrelationship of these two
(2) areas varies as to the identified variables which will then provide data as basis for
leadership enhancement program in the division.
The schematic diagram showing the conceptual framework employed in this study
is shown in Figure 1.
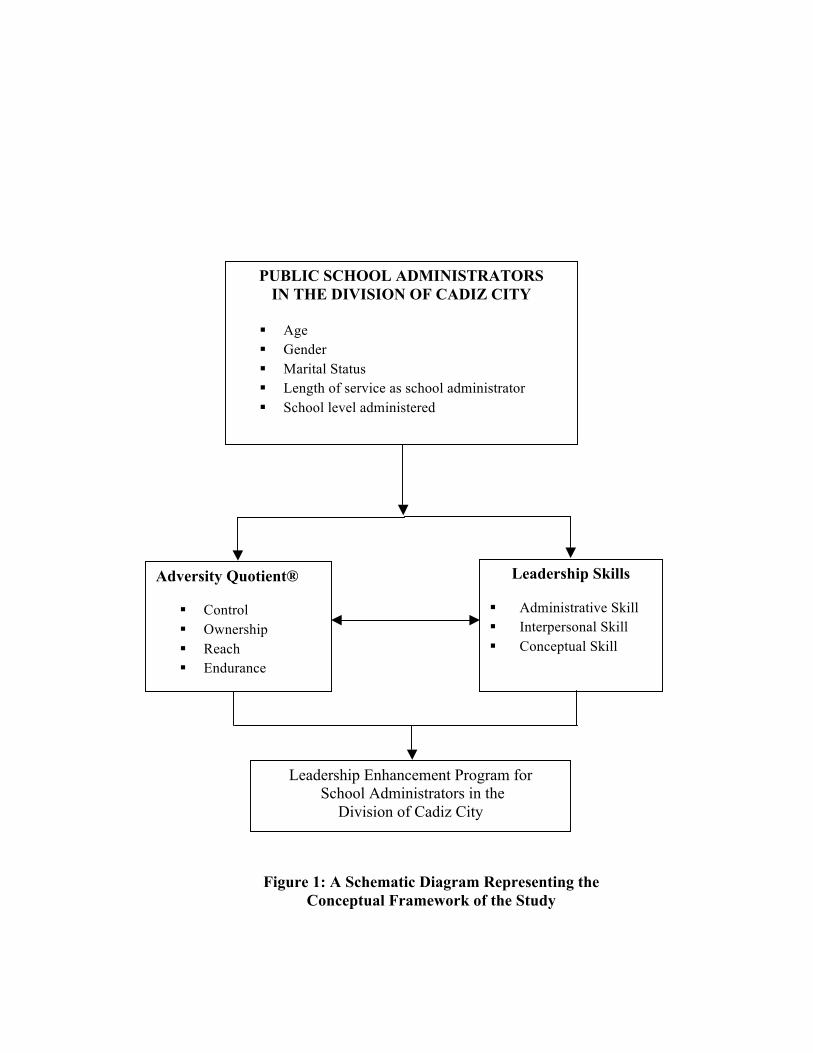
Figure 1: A Schematic Diagram Representing the Conceptual Framework of the Study
PUBLIC SCHOOL ADMINISTRATORS IN THE DIVISION OF CADIZ CITY
! Age ! Gender ! Marital Status ! Length of service as school administrator ! School level administered
Adversity Quotient®
! Control ! Ownership ! Reach ! Endurance
Leadership Skills
! Administrative Skill ! Interpersonal Skill ! Conceptual Skill
Leadership Enhancement Program for School Administrators in the
Division of Cadiz City
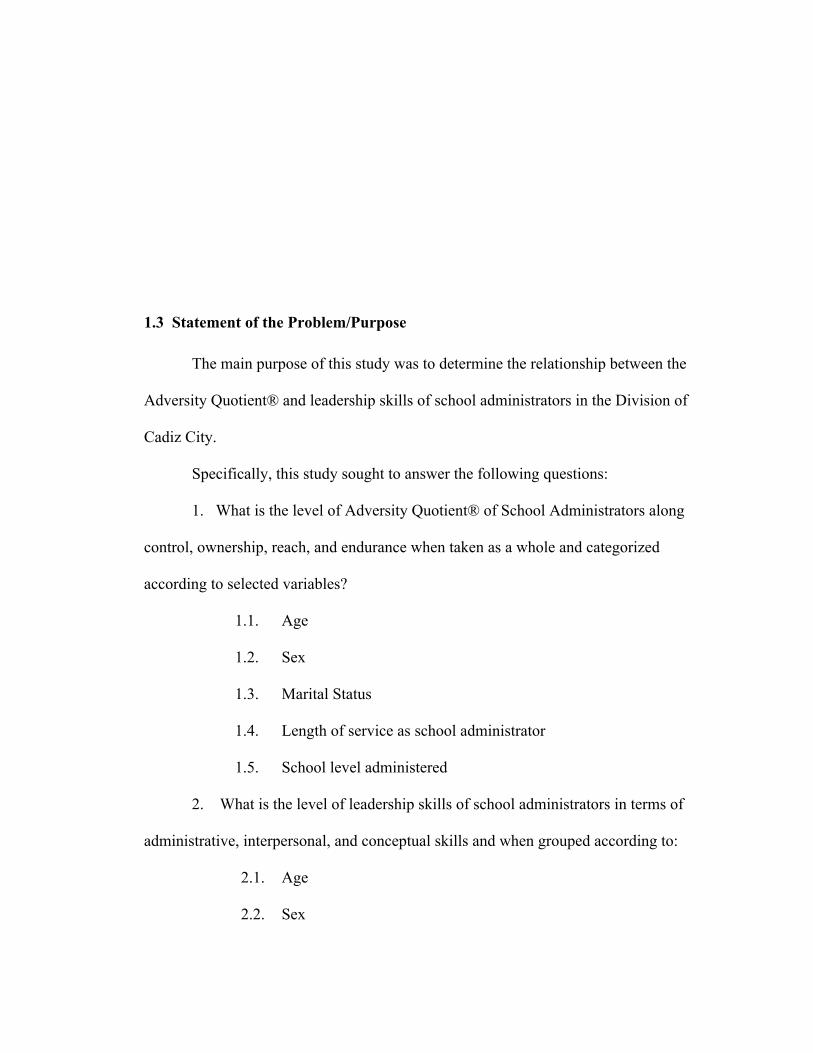
1.3 Statement of the Problem/Purpose
The main purpose of this study was to determine the relationship between the
Adversity Quotient® and leadership skills of school administrators in the Division of
Cadiz City.
Specifically, this study sought to answer the following questions:
1. What is the level of Adversity Quotient® of School Administrators along
control, ownership, reach, and endurance when taken as a whole and categorized
according to selected variables?
1.1. Age
1.2. Sex
1.3. Marital Status
1.4. Length of service as school administrator
1.5. School level administered
2. What is the level of leadership skills of school administrators in terms of
administrative, interpersonal, and conceptual skills and when grouped according to:
2.1. Age
2.2. Sex
2.3. Marital Status
2.4. Length of service as school administrator
2.5. School level administered
3. What is the degree of correlation between Adversity Quotient® and leadership
skills of school administrators?
4. What leadership enhancement program should be developed for School
Administrators in the division?
1.4 Significance of the Study
School administrators are key players in the educational arena. They play crucial
roles in the success and failure of the whole school community. Thus, this study is
believed to benefit the following:
School Administrators. School administrators understand the qualities and skills
of being effective leaders. This study can better provide clear insights in understanding
their capacity to stay strong and be focused in difficulties, challenging tasks, and
responsibilities of being a leader. It will further help them improve job functions and
attain physical and mental well-being that could lead to the over-all quality of
management.
Teachers. Teachers may be aware of the various leadership skills their school
head possess. By this, they will be able to determine their roles and functions in school
and how they can support/help their school head in ensuring the improvement of their
school in general.

Pupils. As the prime recipient of the educational services, they will benefit of
these services offered in the system through competent, effective and efficient school
leaders who manage the development and effectiveness of the teachers and the school in
general.
Education Program Supervisors (EPS) and Public Schools District
Supervisors (PSDS). Upon knowing the level of leadership skills of their subordinates,
these supervisors can provide technical assistance to the school head to improve his/her
performance.
Parents and Community. As strong partners in the educational system, they will
be able to understand the various leadership skills of the school administrators for a
systematic coordination between the school and community.
Human Resource Training and Development (HRTD).The Department of
Education HRTD can utilize the result of this study as a point of reference for hiring or
promoting certain school head.
1.5 Scope and Delimitations of the Study
The main purpose of this study was to determine the Adversity Quotient (AQ)®
and the leadership skills of public school administrators in the Division of Cadiz City for
the School Year 2014-2015 in relation to their demographic profiles: age, gender, marital
status, length of service as school administrator, and school level administered.
The subjects of the study were the fifty (50) public school administrators whom
forty (40) were elementary school administrators and ten (10) secondary school
administrators. The change of the number of subject-participants was due to the
retirement of most of the school administrators of which only teachers-in-charge were
assigned in certain schools.
The analysis of the results is basically dependent on the responses of the
respondents to the various items in the questionnaires. The Adversity Quotient® was
measured through the AQ®P version 9.1 instrument provided by Dr. Paul G. Stoltz of
Peak Learning, Inc. The principal respondents answered through online using the URL
provided by the Peak Learning, Inc. to the researcher.
The Leadership Skills Questionnaire developed by Northouse (2011) measuring
the three (3) broad types of leadership skills: administrative, interpersonal, and
conceptual skills will determine the strength and weaknesses of the school heads.
1.6 Definition of Terms
The following terms are defined operationally to ensure clearer understanding of
the research:
Adversity. In this study, it refers to challenges, problems and concerns
encountered by the school administrators pertaining to their work place.
Adversity Quotient (AQ)®. In this study, this term refers to the total score
obtained from the Adversity Quotient Profile® of the respondents.
Leadership Skills. In this study, this term refers to the performance-based traits,
characteristics and competencies a school administrator must continuously demonstrate
for the whole school improvement process which further refers to three (3) leadership
attributes such as: administrative, interpersonal, and conceptual Skills.
School Administrators. In this study, this term refers to all public elementary
and secondary school administrators who are supervising certain school/institution in the
division which includes Head Teacher I, Head Teacher II, Head Teacher III, Principal I,
Principal II, Principal III during the School Year 2014-2015.
Chapter 2
REVIEW OF RELATED LITERATURE
This chapter reviews conceptual and research literature conducted in the
Philippines and other countries which are related to the present study. These reviews aim
to provide basic foundation and relevant information which can help facilitate clearer
understanding on how each of these reviewed information relate to the present
investigation. This research indicates the connections between the leadership skills and
the ability of the person to deal with different adverse situation which has been dealt with
by other researcher in diverse ways.
2.1 Conceptual Literature
Adversity Quotient®
Adversity Quotient® is an established science, theory, and approach for becoming
measurably more resilient. The more resilient you are, the more effectively and
constructively you respond to life’s difficulties, and the more fulfilling life becomes. It is
the ability of the person to adapt to distress, challenges, setbacks, suffering, troubles,
difficulties and misfortune. Adversity Quotient® predicts how well one withstands
adversity, overcomes it, and foresees the possible outcome of a particular situation. An
individual continually encounters adversities, it is immeasurable, imagined or real, self-
created or brought by others. Adversities bring stress to people; everyone has his own
pace of facing it. He/She may or may not consider that each decision he/she makes has an
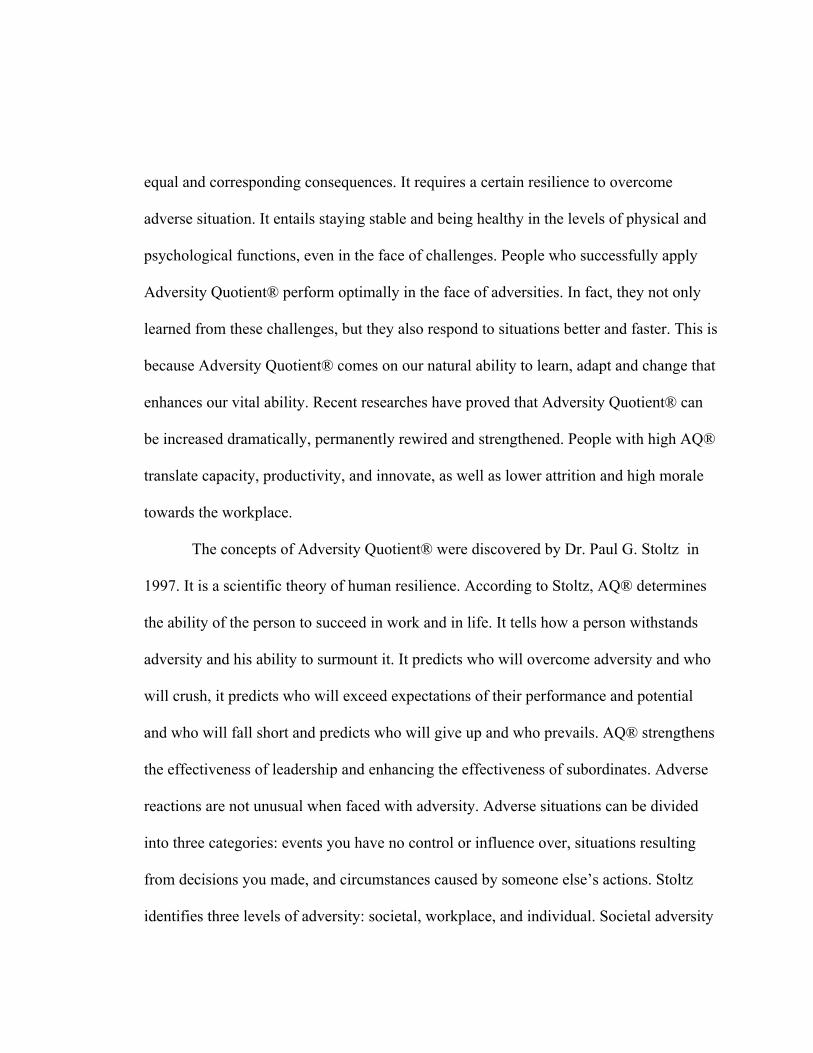
equal and corresponding consequences. It requires a certain resilience to overcome
adverse situation. It entails staying stable and being healthy in the levels of physical and
psychological functions, even in the face of challenges. People who successfully apply
Adversity Quotient® perform optimally in the face of adversities. In fact, they not only
learned from these challenges, but they also respond to situations better and faster. This is
because Adversity Quotient® comes on our natural ability to learn, adapt and change that
enhances our vital ability. Recent researches have proved that Adversity Quotient® can
be increased dramatically, permanently rewired and strengthened. People with high AQ®
translate capacity, productivity, and innovate, as well as lower attrition and high morale
towards the workplace.
The concepts of Adversity Quotient® were discovered by Dr. Paul G. Stoltz in
1997. It is a scientific theory of human resilience. According to Stoltz, AQ® determines
the ability of the person to succeed in work and in life. It tells how a person withstands
adversity and his ability to surmount it. It predicts who will overcome adversity and who
will crush, it predicts who will exceed expectations of their performance and potential
and who will fall short and predicts who will give up and who prevails. AQ® strengthens
the effectiveness of leadership and enhancing the effectiveness of subordinates. Adverse
reactions are not unusual when faced with adversity. Adverse situations can be divided
into three categories: events you have no control or influence over, situations resulting
from decisions you made, and circumstances caused by someone else’s actions. Stoltz
identifies three levels of adversity: societal, workplace, and individual. Societal adversity
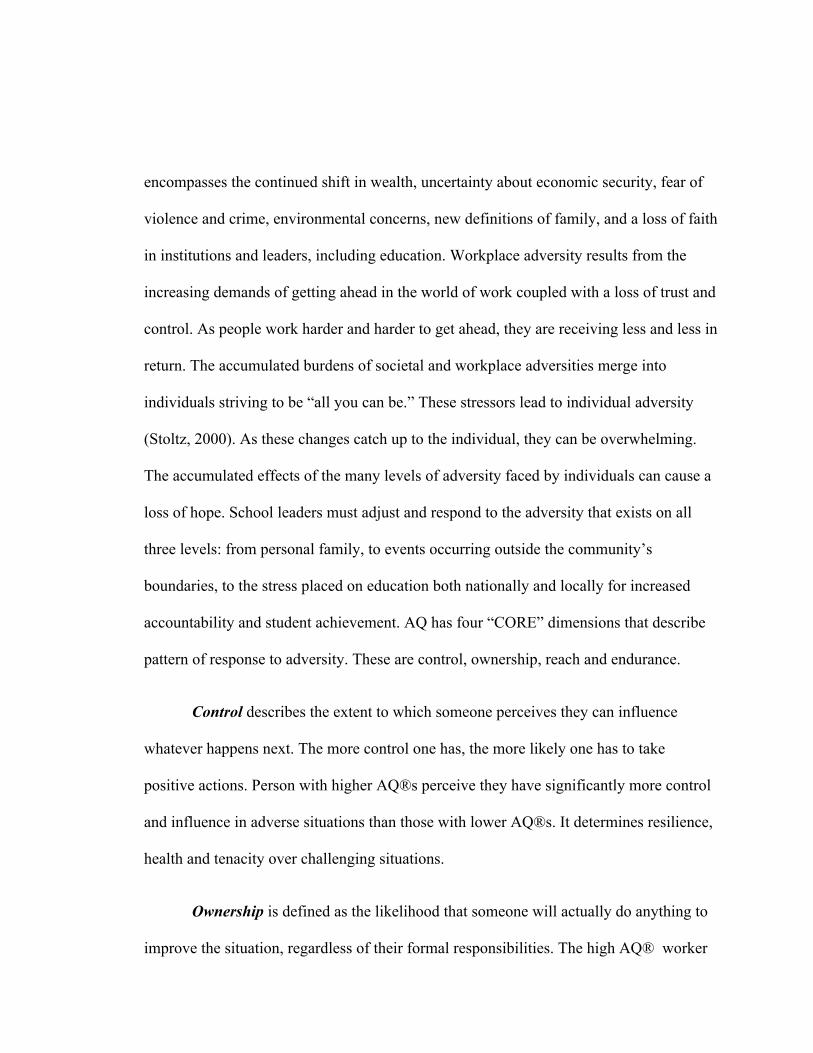
encompasses the continued shift in wealth, uncertainty about economic security, fear of
violence and crime, environmental concerns, new definitions of family, and a loss of faith
in institutions and leaders, including education. Workplace adversity results from the
increasing demands of getting ahead in the world of work coupled with a loss of trust and
control. As people work harder and harder to get ahead, they are receiving less and less in
return. The accumulated burdens of societal and workplace adversities merge into
individuals striving to be “all you can be.” These stressors lead to individual adversity
(Stoltz, 2000). As these changes catch up to the individual, they can be overwhelming.
The accumulated effects of the many levels of adversity faced by individuals can cause a
loss of hope. School leaders must adjust and respond to the adversity that exists on all
three levels: from personal family, to events occurring outside the community’s
boundaries, to the stress placed on education both nationally and locally for increased
accountability and student achievement. AQ has four “CORE” dimensions that describe
pattern of response to adversity. These are control, ownership, reach and endurance.
Control describes the extent to which someone perceives they can influence
whatever happens next. The more control one has, the more likely one has to take
positive actions. Person with higher AQ®s perceive they have significantly more control
and influence in adverse situations than those with lower AQ®s. It determines resilience,
health and tenacity over challenging situations.
Ownership is defined as the likelihood that someone will actually do anything to
improve the situation, regardless of their formal responsibilities. The high AQ® worker
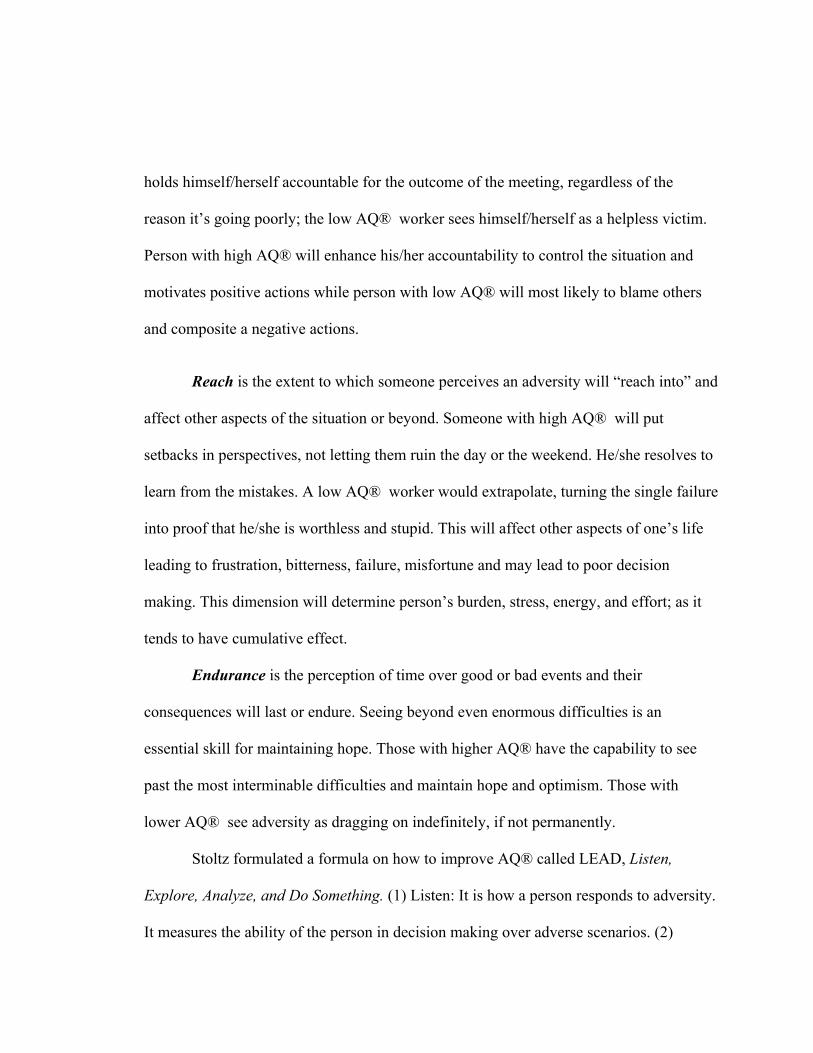
holds himself/herself accountable for the outcome of the meeting, regardless of the
reason it’s going poorly; the low AQ® worker sees himself/herself as a helpless victim.
Person with high AQ® will enhance his/her accountability to control the situation and
motivates positive actions while person with low AQ® will most likely to blame others
and composite a negative actions.
Reach is the extent to which someone perceives an adversity will “reach into” and
affect other aspects of the situation or beyond. Someone with high AQ® will put
setbacks in perspectives, not letting them ruin the day or the weekend. He/she resolves to
learn from the mistakes. A low AQ® worker would extrapolate, turning the single failure
into proof that he/she is worthless and stupid. This will affect other aspects of one’s life
leading to frustration, bitterness, failure, misfortune and may lead to poor decision
making. This dimension will determine person’s burden, stress, energy, and effort; as it
tends to have cumulative effect.
Endurance is the perception of time over good or bad events and their
consequences will last or endure. Seeing beyond even enormous difficulties is an
essential skill for maintaining hope. Those with higher AQ® have the capability to see
past the most interminable difficulties and maintain hope and optimism. Those with
lower AQ® see adversity as dragging on indefinitely, if not permanently.
Stoltz formulated a formula on how to improve AQ® called LEAD, Listen,
Explore, Analyze, and Do Something. (1) Listen: It is how a person responds to adversity.
It measures the ability of the person in decision making over adverse scenarios. (2)
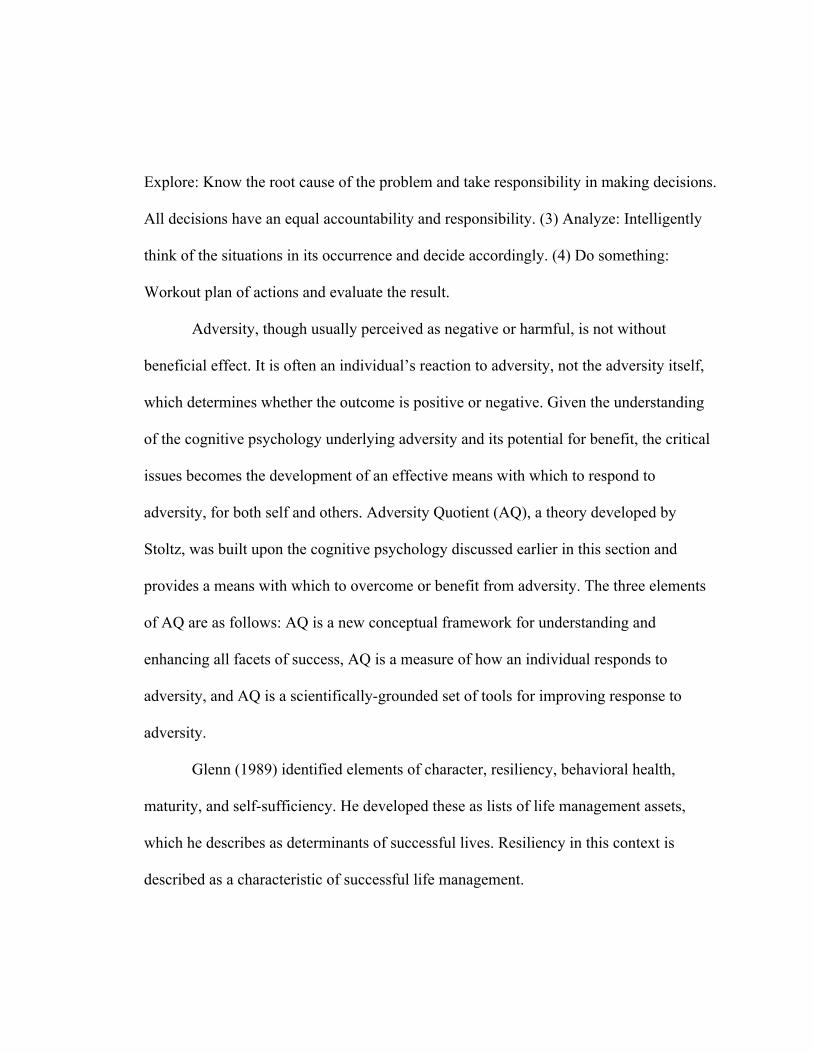
Explore: Know the root cause of the problem and take responsibility in making decisions.
All decisions have an equal accountability and responsibility. (3) Analyze: Intelligently
think of the situations in its occurrence and decide accordingly. (4) Do something:
Workout plan of actions and evaluate the result.
Adversity, though usually perceived as negative or harmful, is not without
beneficial effect. It is often an individual’s reaction to adversity, not the adversity itself,
which determines whether the outcome is positive or negative. Given the understanding
of the cognitive psychology underlying adversity and its potential for benefit, the critical
issues becomes the development of an effective means with which to respond to
adversity, for both self and others. Adversity Quotient (AQ), a theory developed by
Stoltz, was built upon the cognitive psychology discussed earlier in this section and
provides a means with which to overcome or benefit from adversity. The three elements
of AQ are as follows: AQ is a new conceptual framework for understanding and
enhancing all facets of success, AQ is a measure of how an individual responds to
adversity, and AQ is a scientifically-grounded set of tools for improving response to
adversity.
Glenn (1989) identified elements of character, resiliency, behavioral health,
maturity, and self-sufficiency. He developed these as lists of life management assets,
which he describes as determinants of successful lives. Resiliency in this context is
described as a characteristic of successful life management.

Leadership Skills
Effective leadership is crucial to an organization’s success. Leaders need to be
self-aware of how their actions are perceived by those they manage (Moment, 2007).
Employees will sometimes mirror the behavior of managers. In similar manner, Aghdaei
(2008) talks about the philosophy of “shadow of a leader,” where the leader demonstrates
the wanted behavior. He further states that repeated demonstration of positive behavior
motivates people to follow. Weiss (2000) emphasized that leaders should model hard
work for employees.
Moreover, Newcomb (2005), Hesselbein, Goldsmith, and Somerville (2002)
stress the role of leaders to inspire, motivate and promote an atmosphere where the team
can create new ideas and solutions to improve the organization.
Managers have to move ideas and initiatives to executable steps that their team
can implement (Maddock and Viton, 2008). A leader has to clearly communicate what is
needed (Weiss, 2000). If the employee does not understand what to do, then the initiative
is set up for failure. Effective leaders must establish a culture of accountability. “Leaders
need to be held accountable to the organization for results, [a] plan must be accountable
to the outcomes, and the employees must be accountable for their actions” (Newcomb,
2005, p. 36). There needs to be measurable goals for which everyone can be held
responsible. “Without clear responsibility and accountability, execution programs go
nowhere” (Hrebiniak, 2005).
Leaders also need to know how to handle and address failure. Hesselbein,
Goldsmith, and Somerville (2002) state that “failure can become the next step of
learning, the beginning of another new creative idea”. Failure can be a learning
experience and should not necessarily be punished. Also by punishing failure, employees
may be more reluctant to suggest innovative ideas for fear of failure.
Leaders must organize and manage employees. While innovation requires the
organized efforts of others to work (Hesselbein, Goldsmith, and Somerville, 2002), the
result of not involving everyone is that increased resistance to change can appear (Dooley
& O’Sullivan, 2001). Gratton and Erickson (2007) report that a team’s success or failure
at collaborating reflects the philosophy of top executives in the organization. Teams do
well when executives invest in supporting social relationships, [and] demonstrate
collaborative behavior themselves.
Leaders need to be able to adapt to “shifting circumstances” and cope with those
changes (Moment, 2007). Leaders are important for promoting ethical standards and for
modeling ethical behavior and promoting it to employees (Stansbury, 2009). Leaders
need to be honest and accountable for their actions (Hesselbein, Goldsmith, &
Somerville, 2002). For employees to practice ethical behavior, “they must work in an
environment where that behavior is encouraged and supported” (Duncan, 2002, p. 685).
Professionals are expected be truthful and “stand accountable for their mistakes and in
turn expect the same from their subordinates (Hesselbein, Goldsmith, & Somerville,
2002, p. 63).
The skills approach is a leader-centered perspective that emphasizes
the competencies of leaders . In the three-skill approach, effective
leadership depends on three basic personal skills: technical, human, and
conceptual. Although all three skills are important for leaders, the
importance of each skill varies between management levels. At lower
management levels, technical and human skills are most important. For
middle managers, the three different skills are equally important. At upper
management levels, conceptual and human skills are most important, and
technical skills become less important. Leaders are more effective when
their skills match their management level (Mumford, Zaccaro, Harding, et
al. , 2000).
A comprehensive skill-based model of leadership was characterized as a
capability model because it examines the relationship between a leader’s knowledge and
skills (i.e., capabilities) and the leader’s performance (Mumford, Zaccaro, Harding, et al.,
2000, p. 12). Leadership capabilities can be developed over time through education and
experience. The skills approach frames leadership as the capabilities (knowledge and
skills) that make effective leadership possible. The skill-based model of Mumford’s
group has five components: competencies, individual attributes, leadership outcomes,
career experiences, and environmental influences. At the heart of the model are three
competencies: problem-solving skills, social judgment skills, and knowledge. These three
competencies are the central determinants of effective problem solving and performance,
although individual attributes, career experiences, and environmental influences all have
impacts on leader competencies. Through job experience and training, leaders can
become better problem solvers and more effective leaders. “Leaders are shaped by their
experiences,” then it means leaders are not born to be leaders (Mumford, Zaccaro,
Harding, et al., 2000). Leaders can develop their abilities through experience, according
to the skills model.
There are several strengths in conceptualizing leadership from a skills
perspective. First, it is a leader-centered model that stresses the importance of the leader’s
abilities, and it places learned skills at the center of effective leadership performance.
Second, the skills approach describes leadership in such a way that it makes it available
to everyone. Skills are competencies that we all can learn to develop and improve. Third,
the skills approach provides a sophisticated map that explains how effective leadership
performance can be achieved. Based on the model, researchers can develop complex
plans for studying the leadership process. Last, this approach provides a structure for
leadership education and development programs that include creative problem solving,
conflict resolution, listening, and teamwork.
Although there are many different leadership skills, they are often considered as
group of skills classified into three categories: administrative, interpersonal, and
conceptual skills. Administrative skills refer to those competencies a leader needs to run
an organization in order to carry out the organization’s purposes and goals. It is divided
into three (3) sets of skills: managing people, managing resources, and showing technical
competence. Interpersonal skills refer to those abilities that help a leader work effectively
with subordinates, peers, superiors to accomplish the organization’s goals. It is divided
into three (3) parts: being socially perceptive, showing emotional intelligence, and
managing interpersonal conflicts. Conceptual skills involve the thinking or cognitive
aspects of leadership and are critical to such things as creating a vision or strategic plan
for an organization. It is divided into three (3) parts: problem solving, strategic planning,
and creating a vision.
2.2 Research Literature
Adversity Quotient®
A study conducted by Lazaro (2004) focused on the relationship between
adversity quotient and performance level measured by the 360-degree feedback system
among selected middle managers in the different departments of the City of Manila.
Specifically, the researcher tested if there was a significant relationship between the
respondents’ profile variables such as age, gender, civil status, and length of service on
the adversity quotient and performance level revealed by the 330-degree feedback
system. Likewise, differences among the ratings given by the different raters of the 360-
degree feedback system were also explored. The study employed descriptive,
correlational-survey method in assessing the relationship between adversity quotient and
performance level of the middle managers. Findings revealed that the respondents have
an average level of control over events that affect their life circumstances and see
adversities as temporary- rather than enduring- set back. Respondents also sensed greater
ownership regarding the outcome of adversity and they do not allow such adversity to
influence other areas of their lives. Moreover, their performance level reached high
ratings with no single supervisor receiving low rating from any of the raters of the 360-
degree feedback system. The study found that the demographic profile variables included
in this study were not significantly related to the adversity quotient similarly to the
performance level of the respondents. However, there was a high correlation between
adversity quotient and performance as revealed by the 360-degree feedback system.
Gozum’s study (2011) focused on the relationship between the Adversity
Quotient® and the mathematics achievement of the sophomore students in Pamantasan
ng Lungsod ng Maynila – College of Engineering and Technology in the School Year
2010-2011. Findings revealed that most of the respondents were male and from public
high schools. Result also showed that the Adversity Quotient® of the respondents was
not influenced by their sex, course, academic status, scholastic status, scholarship grant
and the type of high school they graduated from.
Based on the study of Canivel (2010), on the Principals’ Adversity Quotient®:
Styles, Performance and Practices, result showed that the generated principals’ adversity
quotient® profile (AQ®P) of the private schools in Rizal had an average descriptive
interpretation. Among the four dimensions of adversity quotient® ownership scored
below average and the remaining dimensions; control, reach and endurance had the same
average scores. With low AQ®, the tendency is to blame oneself (Stoltz, 2000) but with
high AQ® the individual learns one’s behavior to become smarter, a character of a person
with high self- worth. Results showed the responses of the principals were grouped into
the leadership styles in which the participating leadership style ranked 1, followed by
selling leadership style, delegating leadership style, and telling leadership style.
The principal respondents maximized the quantity and quality of performance and
found out that participating style is an ideal approach to lead people according to Likert
as cited in the study of Canivel (2010) and is currently used by most principals
interviewed. From the interviews conducted among the principal respondents, four
themes emerged with regards to performance. These were concerned for personality of
the principals, association with colleagues, workplace and effectiveness. The principals’
performance resulted having a positive relationship with adversity quotient. Adversity
quotient has a positive relation with the school practices of the principals. It affects their
entire endeavors, plans and practices in their school. The researcher likewise organized
the responses of the principal’s on the various sharing regarding the practices applied in
their respective schools. The prevailing practices define clear directions through constant
reviewing of the vision-mission statement was the primary concern of the principals.
Major responses focused on the student-teacher centered.
Results of the study of Ferrer (2009) showed that majority of the academic head
respondents belong to middle range on Adversity Quotient® dimensions: control,
ownership, reach and endurance. In terms of over-all Adversity Quotient® level,
respondents belong to average range. In terms of leadership styles, majority of the
respondents possess a participative style. In terms of job satisfaction, respondents are
satisfied with their present job conditions. On the assessment of significant relationship
between personal characteristics such as age, gender, civil status, educational attainment,
and number of years of service and over-all Adversity Quotient® level and control,
ownership, endurance dimensions, the study showed that there was no significant
relationship, except for educational attainment and AQ® Reach dimension and of the
respondents which are significantly related. The study also revealed that there was no
significant relationship between leadership style and over-all Adversity Quotient® level
andAQ® ownership, reach, and endurance dimensions, with the exception of leadership
style and AQ® Control dimensions which were significantly related. Moreover, the study
also found out that job satisfaction and over-all Adversity Quotient® and control,
ownership, reach, and endurance dimensions was not significantly related.
Lazaro’s, Gozum’s and Canivel’s and Ferrer’s studies have some similarities with
the present investigation since the aforementioned studies have similar findings that
Adversity Quotient® don’t have significant relationship with the selected variables.
Williams (2003) studied the relationship between principals’ responses to
adversity and students’ achievement. The result of the study revealed that students
attained higher achievement scores in school with higher AQ® principals than those
students under the supervision of the Low AQ® principals. He also found out that
teacher’s perceived control over their work environment may influence principal/teacher
relationships and students achievement. The researcher suggested that principal response
to adversity may influence school climate, teacher self efficacy, and student achievement.
The interview data supported the quantitative findings, and added a rich description of the
manner in which principals viewed educational adversity and their response to it. By
increasing educators’ knowledge and understanding of educational adversity and AQ®,
school culture, teacher self efficacy, and student achievement can be positively
influenced, ultimately resulting in a more successful school.
A study of Napire (2013) on Adversity Quotient® and Leadership Style in
Relation to the Demographic Profile of the Elementary School Principals reveals the
following results: The Adversity Quotient®, control, ownership, reach, and endurance
dimensions scores of the elementary school principals was within the “below average”
range with mean score lower than the standard mean scores for each dimension; Sex, age,
civil status, length of service as principal, highest educational attainment, and position
were not significantly related to the Adversity Quotient®, control, ownership, reach, and
endurance scores of elementary school principals. The purpose of the study conducted
by (Low, 2010) was to determine the resilience levels of university administrators,
specifically academic deans and department chairs, within a state university system. This
quantitative study utilized the survey method to determine the resilience levels of
academic deans and department chairs within a state university system. The researcher
was thus able to identify that academic deans, on the average, exhibited higher levels of
resilience than department chairs, and subsequently that female administrators, on the
average, were more resilient than males. It was also discovered that when compared
against individuals from other industries and professions that academic administrators
exhibited above-average levels of resilience on almost every resilience characteristic.
Furthermore, it was shown that gender, institutional type, experience, size of the
college/department supervised, parental influence, formal training and incentive were
influential in determining resilience levels.
Further studies of Stoltz (2000) explained how one can adopt with adversity in
their professional and private lives. Stoltz presented three components of human capacity:
required capacity, existing capacity, and accessed capacity. Required capacity is the
amount of capacity that is demanded from a person as they encounter greater adversity in
their jobs and lives. It entails about the nature of the job or as the job requires. Existing
capacity is what people have when they begin a job, when they are hired. It consists of
their experience, aptitudes, knowledge, talents–everything. Accessed capacity is what a
person taps – what they actually use. Adversity has three levels of involvements: societal
adversity, workplace adversity and individual adversity. Societal adversities in life
involve the environmental effects or influences to the person. In educational system
adversity has many faces it can be brought about by the pupil’s peers, classmates and
even teacher factor could be considered. In nowadays situation the school is no longer a
safer place for the children considering the fact that the pupil’s peers, classmates and
even teachers may contribute to the anxieties or non performance of pupils due to their
acts that interfere with their daily lives. Teachers as part of the institution play major role
in the learning of the pupils. Low AQ® of teacher affects the performance of the pupils
as results of the researches conducted around the globe revealed. Every individual has his
own pace of dealing with adversities in life, one may succeed and others may fail
depending upon how he considered adversity in his life.
Leadership Skills
In related research Hallinger and Heck (2010) found that the school observers are
well aware of the effect principals have on the learning climate, educational programs
and workplace norms of schools. The educational policy community believes that
principals’ leadership is critical to the success or failure of educational programs and
student learning. This study found no direct of principal leadership on student learning.
Results, however, did support the belief that principals can have an indirect effect on
school effectiveness.
In his research on leadership behaviors in collaborative environments, leadership
skills will be enhanced by good knowledge and experience of his field. His leadership
potential will also depend on aspects of his emotional awareness and level of fluid
intelligence. (Thomas, 2012) refers to the need for the principal to organize
communication channels to facilitate information flow. A fully informed public is a
happy public. The effective principal reflects openness to ideas and a willingness o listen
to others. This reflective listening skills promotes a higher level of trust when it comes to
shared decision making.
The studies of Hallinger and Heck and Thomas are related to the present study
since they looked into leadership skills having an effect on school effectiveness.
According to a study by the Hay Group, a global management consultancy, there
are 75 key components of employee satisfaction (Lamb, McKee, 2004). They found that:
trust and confidence in top leadership was the single most reliable predictor of employee
satisfaction in an organization; effective communication by leadership in three critical
areas was the key to winning organizational trust and confidence; helping employees
understand the company's overall business strategy; helping employees understand how
they contribute to achieving key business objectives; sharing information with employees
on both how the company is doing and how an employee's own division is doing -
relative to strategic business objectives.
Mei-Liang Chen, Lecturer, Dep. of Business Management, Chihlee Institute of
Technology, Taiwan (2001) in her study, “The Influence of Management Skills, Roles
and Functions on Organizational Effectiveness Competence of school heads. Results
revealed that on school heads’ competence in three areas of management, such as
management skills, roles and functions, as assessed by the supervisors, school heads and
teachers reflects the technical skills of the school heads as assessed by the group of
respondents. As indicated by the school heads, the respondents carried out the curricular
program. The three respondent groups also noted that school heads always rated the
teachers’ performance and took charge of the training and education facilities and related
teaching aides. The school heads claim that they always made use of their technical skills
they also manifested competence in human skills. The teachers have expressed belief in
the competency skills of the teacher which is consistent with the perception of the school
teachers themselves. The confluence of management skills, roles and functions is a safe
predictor of organizational effectiveness in terms of goal attainment, adaptation,
integration and latency. The study revealed that in terms of the management skills, roles
and functions greatly affected the innovation, growth and development of the school.
Furthermore, the orientation of new teachers on academic and administrative matters has
maintained harmonious relations among teachers, parents and community. The teachers
being given the proper knowledge on the job and expectations would facilitate a smooth
communication among them.
San Antonio (2005) in his study, “Participatory School Administration,
Leadership and Management (PSALM): It’s Impact on the Creation of Better Philippine
Public Secondary Schools, revealed that interpersonal skills and the technical know-how
on school leadership and governance is a necessary skill for ASC members to be able to
perform their tasks effectively. Various responses from the interviewees point to the need
to learn skills in dealing with people such as interpersonal skills, role modeling,
motivating people, understanding other, creating a friendly atmosphere, presiding
meetings, making parents involved and skills in carrying out tasks. Finally, results of
correlation analysis involving the inclination of the stakeholders to participate in
improving the school and the seven indicators of PSALM effectiveness yielded
information making it appropriate to believe that satisfaction with the composition of the
ASC, usefulness of committee structure, results of qualitative data analysis yielded an
adequate basis for claiming that there were behaviors of the school heads and the other
stakeholders that hastened the successful implementation of PSALM as indicated by
increased interest amongst the ASC members to assist in improving their schools. School
heads who implemented an authentic PSALM approach tended to persuade the
stakeholders to participate more actively. This authentic PSALM approach has been
found to be characterized by supportive and proactive behaviors while soliciting deeper
involvement from the other stakeholders, opening communication channels, and
modeling desirable participatory conduct.
Resiliency/Adversity research linked to leadership
Stoltz (1997) studied adults who had faced extremely adverse conditions in their
lives and recovered in surprising manners. Adversity is viewed as external to them and
within their control. He argues that an individual’s response to adversity can be
interrupted and changed. He specifically discusses the need for resiliency in leadership.
He defines successful leaders as persons who are able to turn unexpected losses into
opportunities for greater success. Stoltz emphasized the notions that current
organizational environments yield chaos through constant change and that leadership
skills of the present and future need to incorporate this responsibility to survive and make
use of conflict.
Cooper and Sawaf (1997) examined leadership in corporate settings and
determined a high need for resiliency and renewal for executives to survive in leadership
positions. Siebert (2005) describes a survivor personality characterized by personality
traits to cope with workplace challenges. When faced with adversity these personalities
do not have a victim mentality, they do not explode or implode. Rather they are described
by Siebert as having characteristics that assist them to find opportunity after a setback or
external challenge viewing adversity as having possibilities. He describes resilient people
as people who help their communities, have advantages over other workers, and are
retained and rewarded more frequently, rising to leadership positions.
The studies of Stoltz and Cooper and Sawaf have some similarities with the
present study for they focused also on the leadership skills/characteristics of resiliency
having an influence on the adversity quotient® of school heads.
The related literature and studies collected help the researcher manage the proper
conduct of this study. It guided the researcher in making a sound and valuable study that
will greatly contribute to the pond of knowledge.
Adversities in life measure the ability of the person to different unusual situations
that challenge everyone to make life difference and overcoming adversities will open the
most effective and efficient ways of life opportunities from turmoil to triumph. School
leaders must adjust and respond to the adversity that exists on all three levels: from
personal family, to events occurring outside the community’s boundaries, to the stress
placed on education both nationally and locally for increased accountability and student
achievement. With schools facing increased pressure to improve teaching and learning,
the duties and responsibilities of principals expanded further to include the responsibility
for leading school reform that would raise student achievement. Success in leading
reforms to increase student achievement often hinged upon a school administrator’s
ability to create a shared vision within the school community and success in
implementing new organizational structures that engage teachers in shared decision-
making.
To sum up, it is important for leaders to develop all three (3) broad leadership
skills: Administrative/Technical, Interpersonal/Human, and Conceptual, which is
dependent then on where they are in the management structure. However, some skills are
more important than the other.
Effective principals should, likewise, realize that adversity and change are both a
personal and a social phenomenon. As the school administrators develop an awareness
and knowledge base about the change process, they will become more effective in
managing staff conflict and resistance (Chamley, Caprio, & Young, 1994).
Based on various studies conducted, those principals who were faced with
adversities in their daily activities in their workplace were greatly affected and challenged
as to their school management and skills. According to Stoltz (2009), a person who
withstands adversity and has ability to surmount it, will predict who will overcome
adversity and who will crush. A person should be aware of their Adversity Quotient® to
further improve their resiliency and to increase their capacity to accept challenges and
surmount adversities in life (Gozum, 2011) and by improving the AQ® of a person will
lead to increase the capacity to accept challenges and thrive in adversities (Ferrer, 2009).
The related studies in this paper serve as means of appraising the relevance of
Adversity Quotient® and Leadership Skills of public elementary and secondary school
administrators in order to affect improvement in the quality of education in the country.
Chapter 3
RESEARCH METHODS
This chapter describes the research design, participants of the study, setting,
research instrument, data gathering procedure and statistical treatment of the data.
3.1 Research Design
In this study, the researcher made use of the descriptive-correlational method of
research. This method is the most appropriate because the study involved determining the
level/extent of the school administrators’ Adversity Quotient® and leadership skills.
The descriptive method was used in determining the level of leadership skills
covering the three (3) areas: administrative, interpersonal, and conceptual skills of the
elementary and secondary school administrators, their Adversity Quotient® along the
four dimensions, namely: a) control; b) ownership; c) reach; and, d) endurance. The
correlational method was also used in determining the degree of correlation between
leadership skills and adversity quotient®.
Gay (2000) contends that descriptive research involves collecting data in order to
answer questions about the current status of the subject. He also added that this method of
research is carried out to obtain information about the preferences, attitudes, practices,
concerns, or interests of some group of people.
3.2 Participants of the Study
The participants of the study were the forty (40) public elementary school
administrators and ten (10) public secondary school administrators in the Division of
Cadiz City. Public elementary and secondary school administrators include the school
principals, head teachers, and teacher-in-charge. Table 3.1 presents the distribution of the
subject-respondents according to their demographic profile such as age, sex, marital
status, length of service as school administrator, and school level administer. When
classified according to age, twenty-three (23) or forty six (46%) were younger while
twenty seven (27) or fifty four percent (54%) of them were older. When grouped
according to sex, eighteen (18) or thirty six percent (36%) of them were male while
thirty-two (32) or sixty-four percent (64%) of them were female. When categorized
according to marital status, six (6) or twelve percent (12%) were single while forty-four
(44) or eighty-eight percent (88%) of them were already married. As to the length of
service as school administrator, twenty (20) or forty percent (40%) have shorter years
while thirty (30) or sixty percent (60%) of them have longer years as school
administrator. When classified according to school level administered, forty (40) or
eighty percent (80%) are handling elementary schools while ten (10) or twenty percent
(20%) of them handles secondary schools.
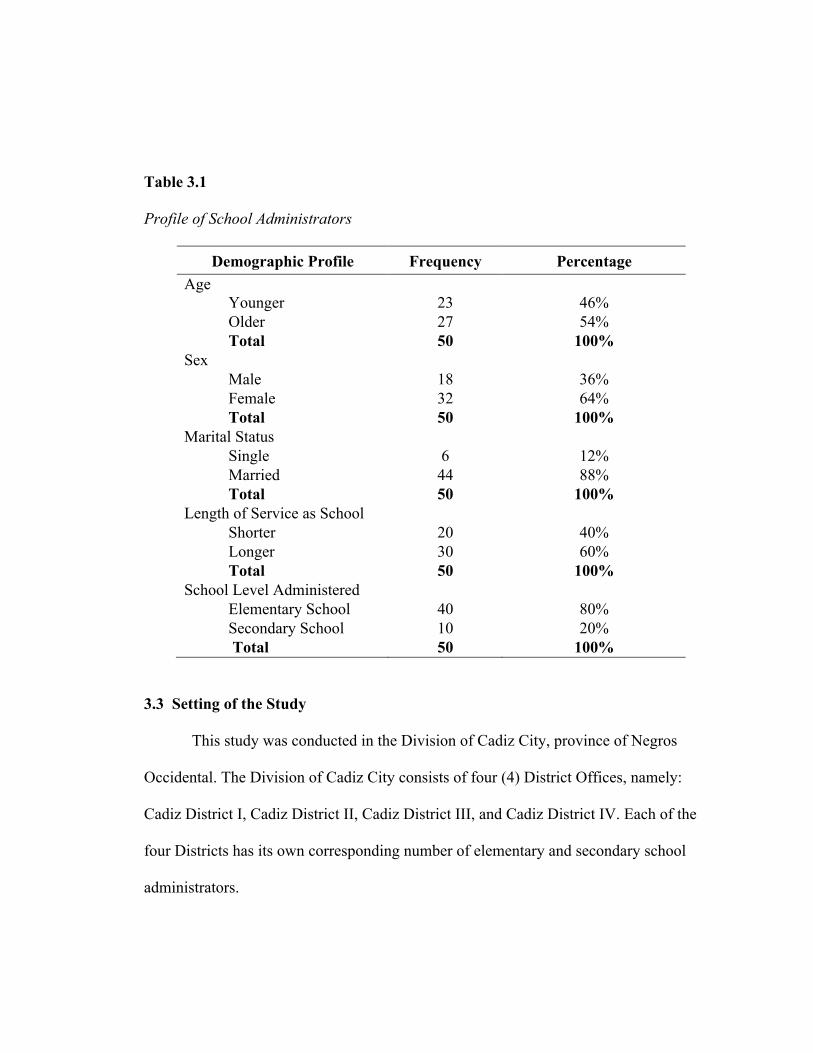
Table 3.1
Profile of School Administrators
Demographic Profile Frequency Percentage Age
Younger 23 46% Older 27 54% Total 50 100%
Sex Male 18 36% Female 32 64% Total 50 100%
Marital Status Single 6 12% Married 44 88% Total 50 100%
Length of Service as School
Administrator
Shorter 20 40% Longer 30 60% Total 50 100%
School Level Administered Elementary School 40 80% Secondary School 10 20% Total 50 100%
3.3 Setting of the Study
This study was conducted in the Division of Cadiz City, province of Negros
Occidental. The Division of Cadiz City consists of four (4) District Offices, namely:
Cadiz District I, Cadiz District II, Cadiz District III, and Cadiz District IV. Each of the
four Districts has its own corresponding number of elementary and secondary school
administrators.
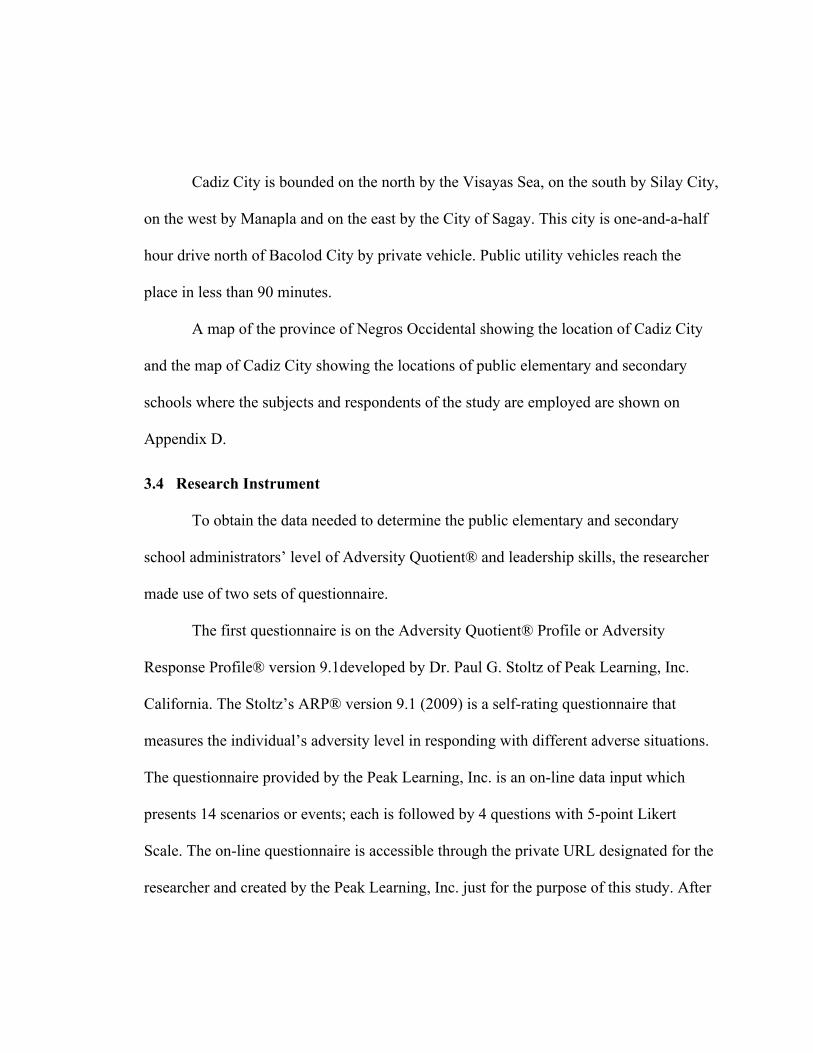
Cadiz City is bounded on the north by the Visayas Sea, on the south by Silay City,
on the west by Manapla and on the east by the City of Sagay. This city is one-and-a-half
hour drive north of Bacolod City by private vehicle. Public utility vehicles reach the
place in less than 90 minutes.
A map of the province of Negros Occidental showing the location of Cadiz City
and the map of Cadiz City showing the locations of public elementary and secondary
schools where the subjects and respondents of the study are employed are shown on
Appendix D.
3.4 Research Instrument
To obtain the data needed to determine the public elementary and secondary
school administrators’ level of Adversity Quotient® and leadership skills, the researcher
made use of two sets of questionnaire.
The first questionnaire is on the Adversity Quotient® Profile or Adversity
Response Profile® version 9.1developed by Dr. Paul G. Stoltz of Peak Learning, Inc.
California. The Stoltz’s ARP® version 9.1 (2009) is a self-rating questionnaire that
measures the individual’s adversity level in responding with different adverse situations.
The questionnaire provided by the Peak Learning, Inc. is an on-line data input which
presents 14 scenarios or events; each is followed by 4 questions with 5-point Likert
Scale. The on-line questionnaire is accessible through the private URL designated for the
researcher and created by the Peak Learning, Inc. just for the purpose of this study. After
the online submission of the responses the descriptive interpretations of AQP® were sent
by Stoltz with the use of the electronic spreadsheet.
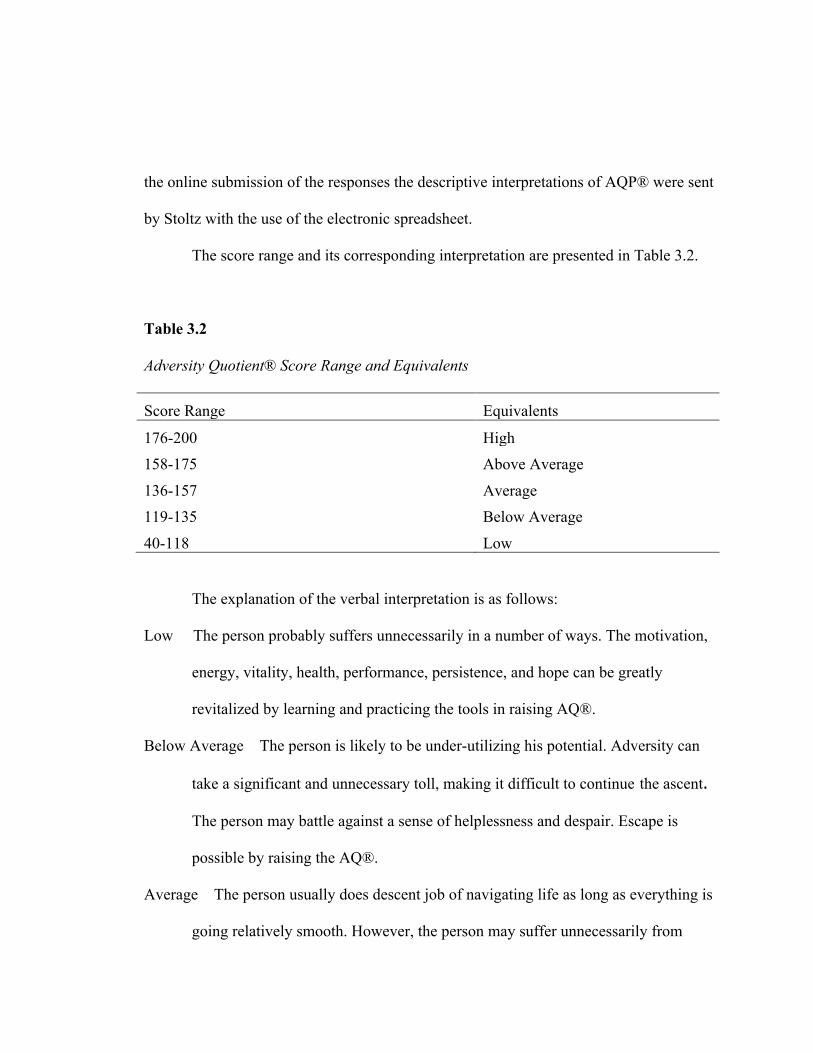
The score range and its corresponding interpretation are presented in Table 3.2.
Table 3.2
Adversity Quotient® Score Range and Equivalents
Score Range Equivalents
176-200 High 158-175 Above Average
136-157 Average 119-135 Below Average
40-118 Low
The explanation of the verbal interpretation is as follows:
Low The person probably suffers unnecessarily in a number of ways. The motivation,
energy, vitality, health, performance, persistence, and hope can be greatly
revitalized by learning and practicing the tools in raising AQ®.
Below Average The person is likely to be under-utilizing his potential. Adversity can
take a significant and unnecessary toll, making it difficult to continue the ascent.
The person may battle against a sense of helplessness and despair. Escape is
possible by raising the AQ®.
Average The person usually does descent job of navigating life as long as everything is
going relatively smooth. However, the person may suffer unnecessarily from

larger setbacks, or may be disheartened by the accumulated burden of life’s
challenges
Above Average The person has probably done a fairly good job in persisting through
challenges and in tapping a good portion of growing potential on a daily basis
High The person probably has the ability to withstand significant adversity and to
continue to move forward and upward in life
The AQP® is composed of the following four CO2RE dimensions namely;
control, ownership, reach and endurance. The CO2RE equivalents were provided by
Stoltz, (2009). TheCO2RE score range and its verbal interpretation are presented in Table
3.3.
Table 3.3 CO2RE Score Range and its Equivalents
CO2RE Dimensions
Equivalents/Score Range
High Above Average
Average Below Average
Low Mean
Control 48-50 43-47 36-42 30-35 10-29 38
Ownership 50 47-49 41-46 31-40 10-30 41
Reach 43-50 38-42 30-37 25-29 10-24 33
Endurance 44-50 39-43 32-38 26-31 10-25 34
The second set of questionnaire is an eighteen (18) item questions on leadership
skills developed by Peter Northouse (Introduction to Leadership-Concepts and Practice,
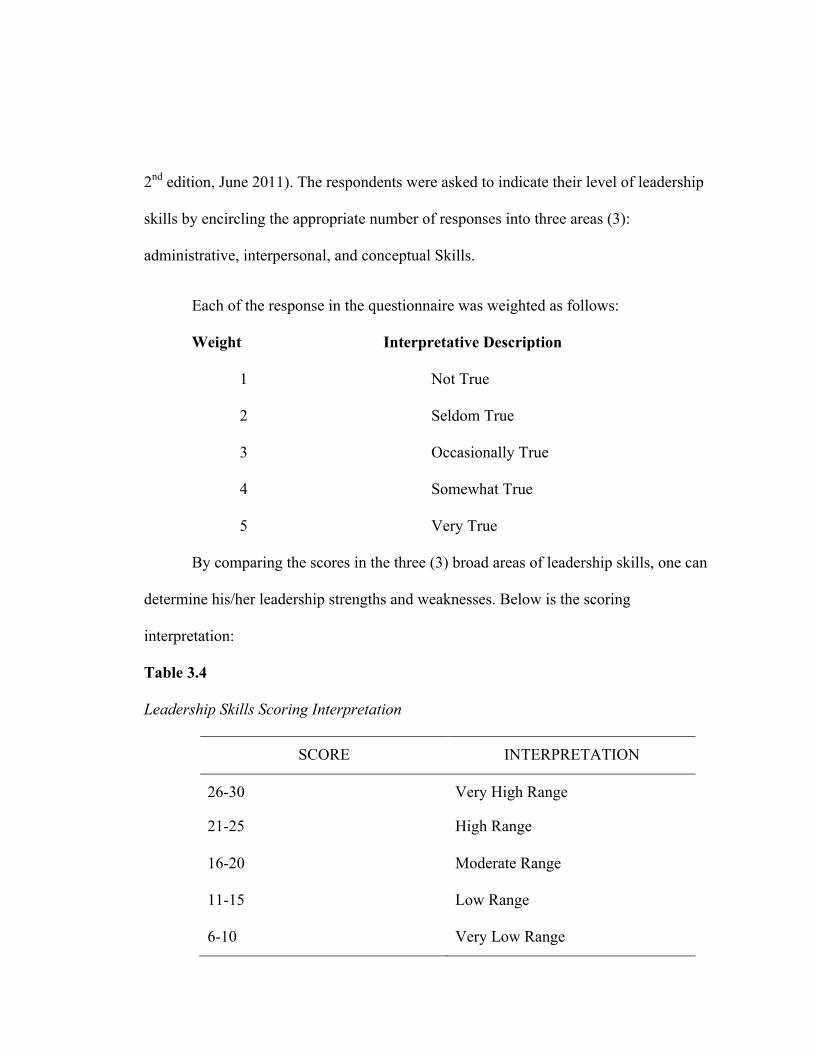
2nd edition, June 2011). The respondents were asked to indicate their level of leadership
skills by encircling the appropriate number of responses into three areas (3):
administrative, interpersonal, and conceptual Skills.
Each of the response in the questionnaire was weighted as follows:
Weight Interpretative Description
1 Not True
2 Seldom True
3 Occasionally True
4 Somewhat True
5 Very True
By comparing the scores in the three (3) broad areas of leadership skills, one can
determine his/her leadership strengths and weaknesses. Below is the scoring
interpretation:
Table 3.4
Leadership Skills Scoring Interpretation
SCORE INTERPRETATION
26-30 Very High Range
21-25 High Range
16-20 Moderate Range
11-15 Low Range
6-10 Very Low Range
3.5 Data Gathering Procedure
The researcher followed certain procedures in gathering the data of this study.
Primarily, the researcher secured permit to use the Adversity Response Profile® version
9.1from Dr. Paul G. Stoltz of Peak Learning, Inc. California through e-mail. Upon
submission and signing of the agreement contract to Peak Learning, Inc., the researcher
handed in a letter of permit to conduct study to the Office of the Schools Division
Superintendent of Cadiz City and Office of the Public School District Supervisor of the
different districts. Then, the researcher conducted a short orientation per district on the
manner of answering on-line the AQ Profile and the Leadership Skills questionnaire at
the same time.
The administration of the survey questionnaires was depending on the availability
of the researcher. Some opted to answer it personally while others brought the materials
with them. After 2 weeks, the researcher followed-up the online answering of AQ
Questionnaire and right after informed the Peak Learning, Inc. through Ms. Katie Martin,
AQ Research Project Liaison for its corresponding analysis and interpretation. Lastly,
collection, tabulation, and analysis of the data gathered were processed right away by the
researcher with the assistance of the statistician for a more accurate statistical result and
analysis.
3.6 Data Analysis
In the process of the data obtained through the questionnaires, the researcher
utilized the following statistical tools:
Frequency-Percentage
Frequency-Percentage was used in determining the profile of the respondents in
terms of demographic variables (age, sex, marital status, length of service as school
administrator and school level administered) and Adversity Quotient®. The Adversity
Quotient Profile of the principal was tabulated including their four dimensions: control,
ownership, reach and endurance.
Mean
For problems on levels of Adversity Quotient® and leadership skills, the mean
was used for data analysis. The mean is used when the distribution is approximately
normal. When the number of cases is large (>+30), the distribution approaches normality.
Pearson Correlation Coefficient (r)
Pearson r was used to determine degree of correlation between Adversity
Quotient® and leadership skills when taken as whole and when categorized according to
identified variables.
Chapter 4
PRESENTATION, ANALYSIS, AND INTERPRETATION OF DATA
This chapter presents the data gathered and collated to realize the objectives of the
study. These data are likewise analyzed and interpreted in the light of the conceptual
framework presented.
The presentation, analysis and interpretation of the data are presented in the
following manner.
1. The level of Adversity Quotient® of School Administrators along Control,
Ownership, Reach and Endurance when taken as a whole and categorized according to
Age, Sex, Marital Status, Length of service as school administrator, and School level
administered.
2. The level of Leadership Skills of school administrators in terms of
administrative, interpersonal, and conceptual skills and when grouped according to Age,
Sex, Marital Status, Length of service as school administrator, and School level
administered.
3. The degree of correlation between Adversity Quotient® and Leadership Skills
of School Administrators
4. Leadership Enhancement Program for School Administrators in the division.
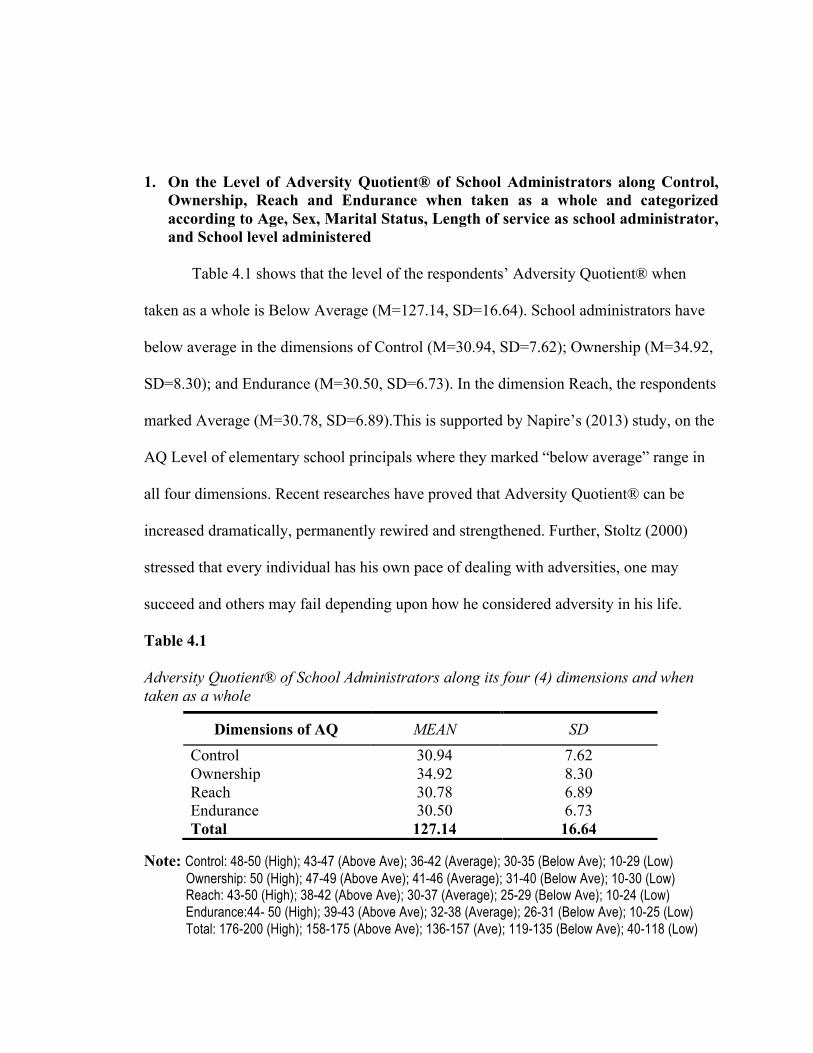
1. On the Level of Adversity Quotient® of School Administrators along Control, Ownership, Reach and Endurance when taken as a whole and categorized according to Age, Sex, Marital Status, Length of service as school administrator, and School level administered
Table 4.1 shows that the level of the respondents’ Adversity Quotient® when
taken as a whole is Below Average (M=127.14, SD=16.64). School administrators have
below average in the dimensions of Control (M=30.94, SD=7.62); Ownership (M=34.92,
SD=8.30); and Endurance (M=30.50, SD=6.73). In the dimension Reach, the respondents
marked Average (M=30.78, SD=6.89).This is supported by Napire’s (2013) study, on the
AQ Level of elementary school principals where they marked “below average” range in
all four dimensions. Recent researches have proved that Adversity Quotient® can be
increased dramatically, permanently rewired and strengthened. Further, Stoltz (2000)
stressed that every individual has his own pace of dealing with adversities, one may
succeed and others may fail depending upon how he considered adversity in his life.
Table 4.1 Adversity Quotient® of School Administrators along its four (4) dimensions and when taken as a whole
Note: Control: 48-50 (High); 43-47 (Above Ave); 36-42 (Average); 30-35 (Below Ave); 10-29 (Low)
Ownership: 50 (High); 47-49 (Above Ave); 41-46 (Average); 31-40 (Below Ave); 10-30 (Low) Reach: 43-50 (High); 38-42 (Above Ave); 30-37 (Average); 25-29 (Below Ave); 10-24 (Low) Endurance:44- 50 (High); 39-43 (Above Ave); 32-38 (Average); 26-31 (Below Ave); 10-25 (Low) Total: 176-200 (High); 158-175 (Above Ave); 136-157 (Ave); 119-135 (Below Ave); 40-118 (Low)
Dimensions of AQ MEAN SD Control 30.94 7.62 Ownership 34.92 8.30 Reach 30.78 6.89 Endurance 30.50 6.73 Total 127.14 16.64
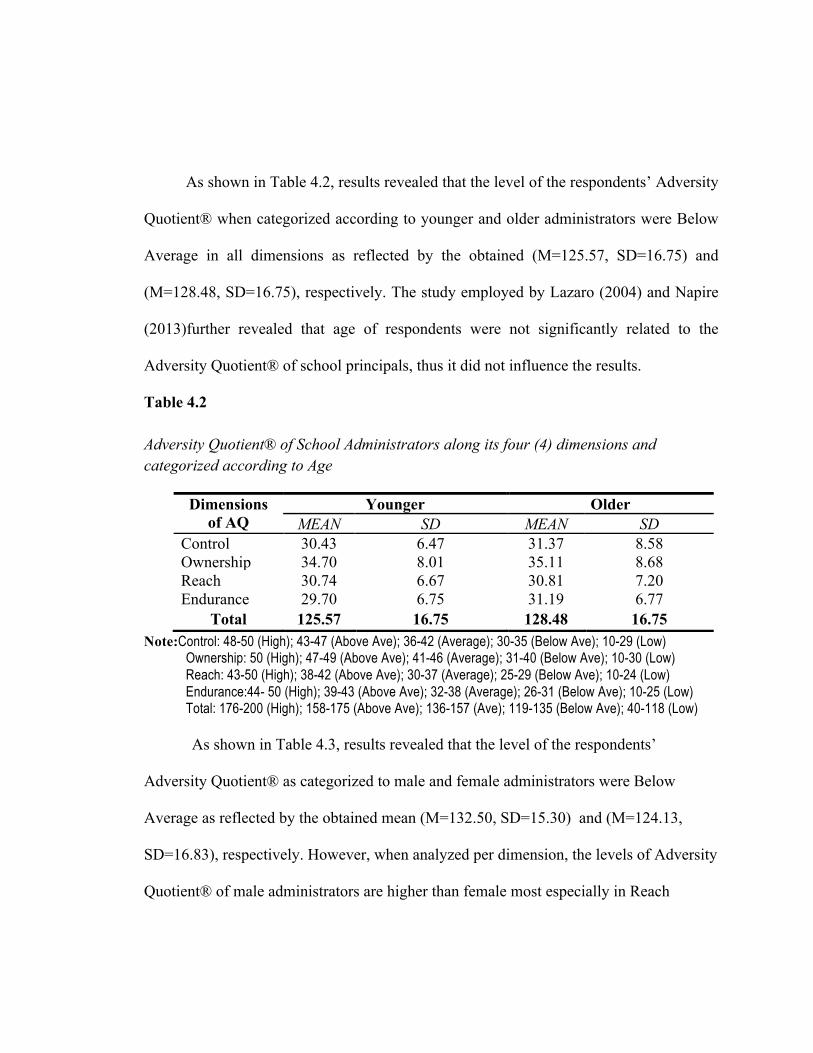
As shown in Table 4.2, results revealed that the level of the respondents’ Adversity
Quotient® when categorized according to younger and older administrators were Below
Average in all dimensions as reflected by the obtained (M=125.57, SD=16.75) and
(M=128.48, SD=16.75), respectively. The study employed by Lazaro (2004) and Napire
(2013)further revealed that age of respondents were not significantly related to the
Adversity Quotient® of school principals, thus it did not influence the results.
Table 4.2 Adversity Quotient® of School Administrators along its four (4) dimensions and categorized according to Age
Note:Control: 48-50 (High); 43-47 (Above Ave); 36-42 (Average); 30-35 (Below Ave); 10-29 (Low) Ownership: 50 (High); 47-49 (Above Ave); 41-46 (Average); 31-40 (Below Ave); 10-30 (Low) Reach: 43-50 (High); 38-42 (Above Ave); 30-37 (Average); 25-29 (Below Ave); 10-24 (Low) Endurance:44- 50 (High); 39-43 (Above Ave); 32-38 (Average); 26-31 (Below Ave); 10-25 (Low) Total: 176-200 (High); 158-175 (Above Ave); 136-157 (Ave); 119-135 (Below Ave); 40-118 (Low)
As shown in Table 4.3, results revealed that the level of the respondents’
Adversity Quotient® as categorized to male and female administrators were Below
Average as reflected by the obtained mean (M=132.50, SD=15.30) and (M=124.13,
SD=16.83), respectively. However, when analyzed per dimension, the levels of Adversity
Quotient® of male administrators are higher than female most especially in Reach
Dimensions of AQ
Younger Older MEAN SD MEAN SD
Control 30.43 6.47 31.37 8.58 Ownership 34.70 8.01 35.11 8.68 Reach 30.74 6.67 30.81 7.20 Endurance 29.70 6.75 31.19 6.77
Total 125.57 16.75 128.48 16.75
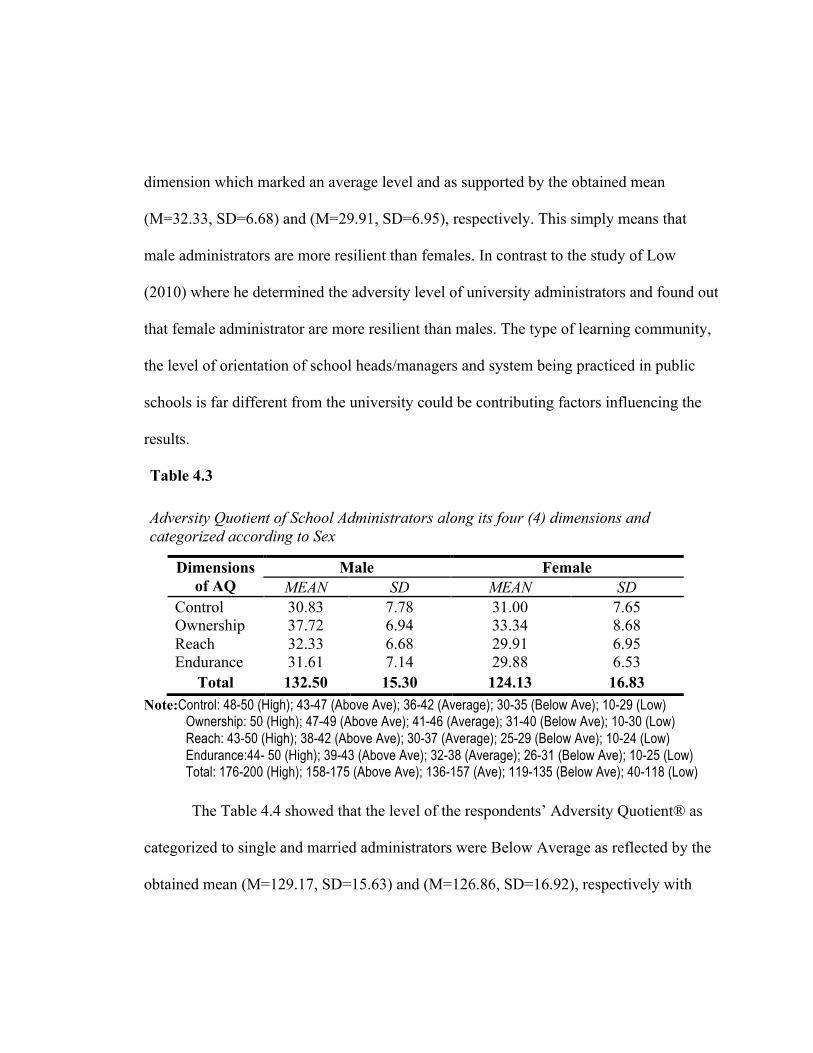
dimension which marked an average level and as supported by the obtained mean
(M=32.33, SD=6.68) and (M=29.91, SD=6.95), respectively. This simply means that
male administrators are more resilient than females. In contrast to the study of Low
(2010) where he determined the adversity level of university administrators and found out
that female administrator are more resilient than males. The type of learning community,
the level of orientation of school heads/managers and system being practiced in public
schools is far different from the university could be contributing factors influencing the
results.
Table 4.3 Adversity Quotient of School Administrators along its four (4) dimensions and categorized according to Sex
Note:Control: 48-50 (High); 43-47 (Above Ave); 36-42 (Average); 30-35 (Below Ave); 10-29 (Low) Ownership: 50 (High); 47-49 (Above Ave); 41-46 (Average); 31-40 (Below Ave); 10-30 (Low) Reach: 43-50 (High); 38-42 (Above Ave); 30-37 (Average); 25-29 (Below Ave); 10-24 (Low) Endurance:44- 50 (High); 39-43 (Above Ave); 32-38 (Average); 26-31 (Below Ave); 10-25 (Low) Total: 176-200 (High); 158-175 (Above Ave); 136-157 (Ave); 119-135 (Below Ave); 40-118 (Low)
The Table 4.4 showed that the level of the respondents’ Adversity Quotient® as
categorized to single and married administrators were Below Average as reflected by the
obtained mean (M=129.17, SD=15.63) and (M=126.86, SD=16.92), respectively with
Dimensions of AQ
Male Female MEAN SD MEAN SD
Control 30.83 7.78 31.00 7.65 Ownership 37.72 6.94 33.34 8.68 Reach 32.33 6.68 29.91 6.95 Endurance 31.61 7.14 29.88 6.53
Total 132.50 15.30 124.13 16.83

little difference per dimension. This is further supported by the studies of Ferrer (2009)
and Lazaro (2004) where demographic profile variables specifically the gender exhibited
no significant relationship to the over-all Adversity Quotient® level of school
administrators.
Table 4.4 Adversity Quotient of School Administrators along its four (4) dimensions and categorized according to Marital Status
Note:Control: 48-50 (High); 43-47 (Above Ave); 36-42 (Average); 30-35 (Below Ave); 10-29 (Low) Ownership: 50 (High); 47-49 (Above Ave); 41-46 (Average); 31-40 (Below Ave); 10-30 (Low) Reach: 43-50 (High); 38-42 (Above Ave); 30-37 (Average); 25-29 (Below Ave); 10-24 (Low) Endurance:44- 50 (High); 39-43 (Above Ave); 32-38 (Average); 26-31 (Below Ave); 10-25 (Low) Total: 176-200 (High); 158-175 (Above Ave); 136-157 (Ave); 119-135 (Below Ave); 40-118 (Low)
As shown in Table 4.5, results showed that the level of the respondents’ Adversity
Quotient as categorized to shorter and longer years as school administrators were both
Below Average as reflected by the obtained mean (M=128.35, SD=16.92) and
(M=126.33, SD=16.69), respectively. The same studies of Ferrer (2009) and Lazaro
(2004) supported the results where demographic profile variables specifically the
number of years in service exhibited no significant relationship to the over-all Adversity
Quotient® level of school administrators.
Dimensions of AQ
Single Married MEAN SD MEAN SD
Control 29.00 9.51 31.20 7.42 Ownership 34.50 8.24 34.98 8.40 Reach 34.00 7.38 30.34 6.79 Endurance 31.67 8.02 30.34 6.63
Total 129.17 15.63 126.86 16.92
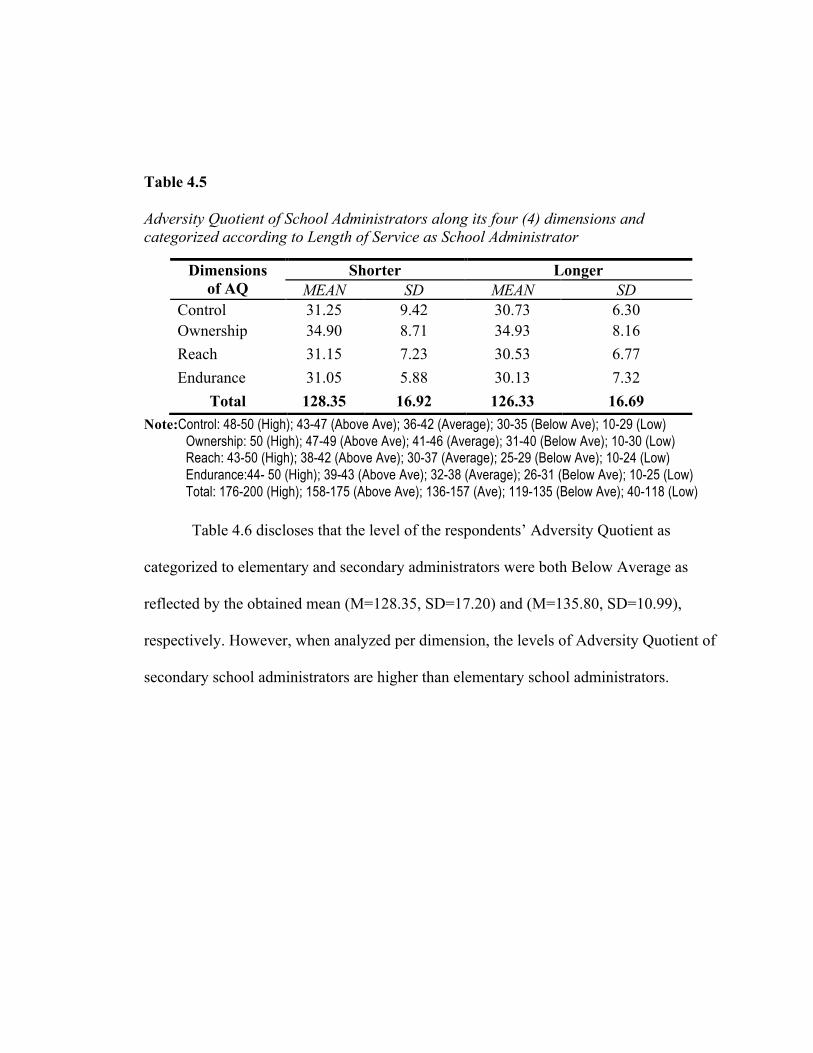
Table 4.5
Adversity Quotient of School Administrators along its four (4) dimensions and categorized according to Length of Service as School Administrator
Note:Control: 48-50 (High); 43-47 (Above Ave); 36-42 (Average); 30-35 (Below Ave); 10-29 (Low) Ownership: 50 (High); 47-49 (Above Ave); 41-46 (Average); 31-40 (Below Ave); 10-30 (Low) Reach: 43-50 (High); 38-42 (Above Ave); 30-37 (Average); 25-29 (Below Ave); 10-24 (Low) Endurance:44- 50 (High); 39-43 (Above Ave); 32-38 (Average); 26-31 (Below Ave); 10-25 (Low) Total: 176-200 (High); 158-175 (Above Ave); 136-157 (Ave); 119-135 (Below Ave); 40-118 (Low)
Table 4.6 discloses that the level of the respondents’ Adversity Quotient as
categorized to elementary and secondary administrators were both Below Average as
reflected by the obtained mean (M=128.35, SD=17.20) and (M=135.80, SD=10.99),
respectively. However, when analyzed per dimension, the levels of Adversity Quotient of
secondary school administrators are higher than elementary school administrators.
Dimensions of AQ
Shorter Longer MEAN SD MEAN SD
Control 31.25 9.42 30.73 6.30 Ownership 34.90 8.71 34.93 8.16 Reach 31.15 7.23 30.53 6.77 Endurance 31.05 5.88 30.13 7.32
Total 128.35 16.92 126.33 16.69
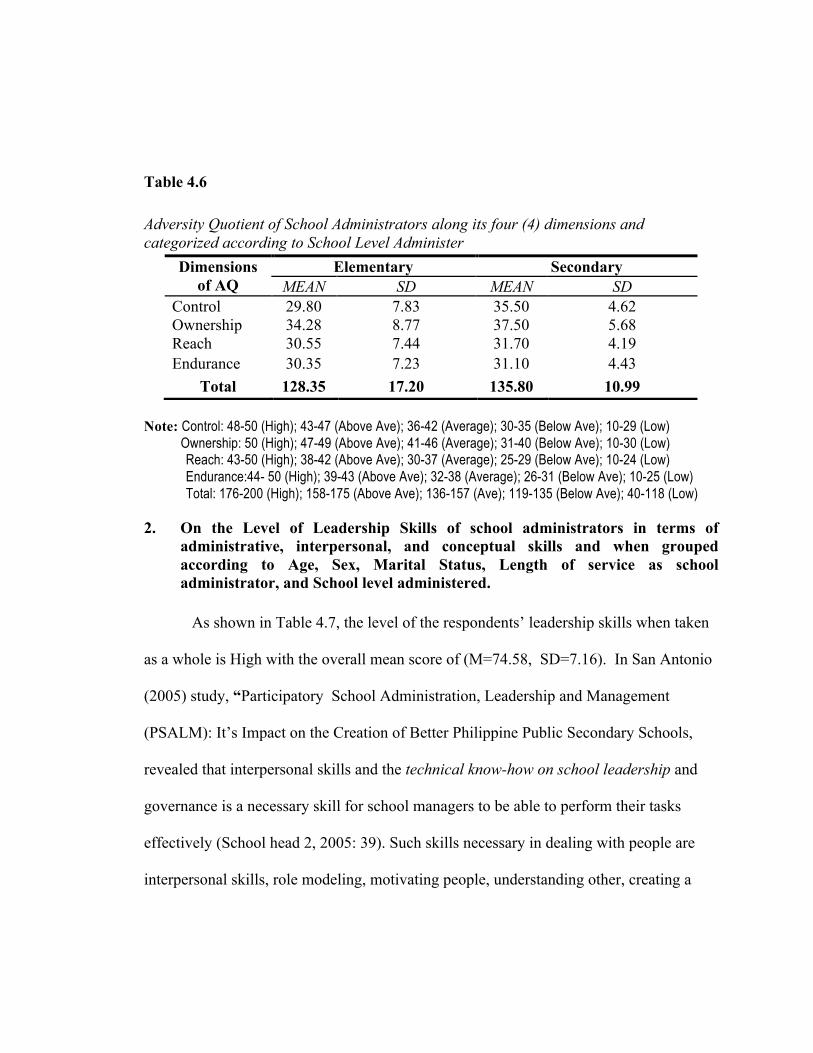
Table 4.6 Adversity Quotient of School Administrators along its four (4) dimensions and categorized according to School Level Administer
Note: Control: 48-50 (High); 43-47 (Above Ave); 36-42 (Average); 30-35 (Below Ave); 10-29 (Low) Ownership: 50 (High); 47-49 (Above Ave); 41-46 (Average); 31-40 (Below Ave); 10-30 (Low)
Reach: 43-50 (High); 38-42 (Above Ave); 30-37 (Average); 25-29 (Below Ave); 10-24 (Low) Endurance:44- 50 (High); 39-43 (Above Ave); 32-38 (Average); 26-31 (Below Ave); 10-25 (Low) Total: 176-200 (High); 158-175 (Above Ave); 136-157 (Ave); 119-135 (Below Ave); 40-118 (Low)
2. On the Level of Leadership Skills of school administrators in terms of
administrative, interpersonal, and conceptual skills and when grouped according to Age, Sex, Marital Status, Length of service as school administrator, and School level administered.
As shown in Table 4.7, the level of the respondents’ leadership skills when taken
as a whole is High with the overall mean score of (M=74.58, SD=7.16). In San Antonio
(2005) study, “Participatory School Administration, Leadership and Management
(PSALM): It’s Impact on the Creation of Better Philippine Public Secondary Schools,
revealed that interpersonal skills and the technical know-how on school leadership and
governance is a necessary skill for school managers to be able to perform their tasks
effectively (School head 2, 2005: 39). Such skills necessary in dealing with people are
interpersonal skills, role modeling, motivating people, understanding other, creating a
Dimensions of AQ
Elementary Secondary MEAN SD MEAN SD
Control 29.80 7.83 35.50 4.62 Ownership 34.28 8.77 37.50 5.68 Reach 30.55 7.44 31.70 4.19 Endurance 30.35 7.23 31.10 4.43
Total 128.35 17.20 135.80 10.99
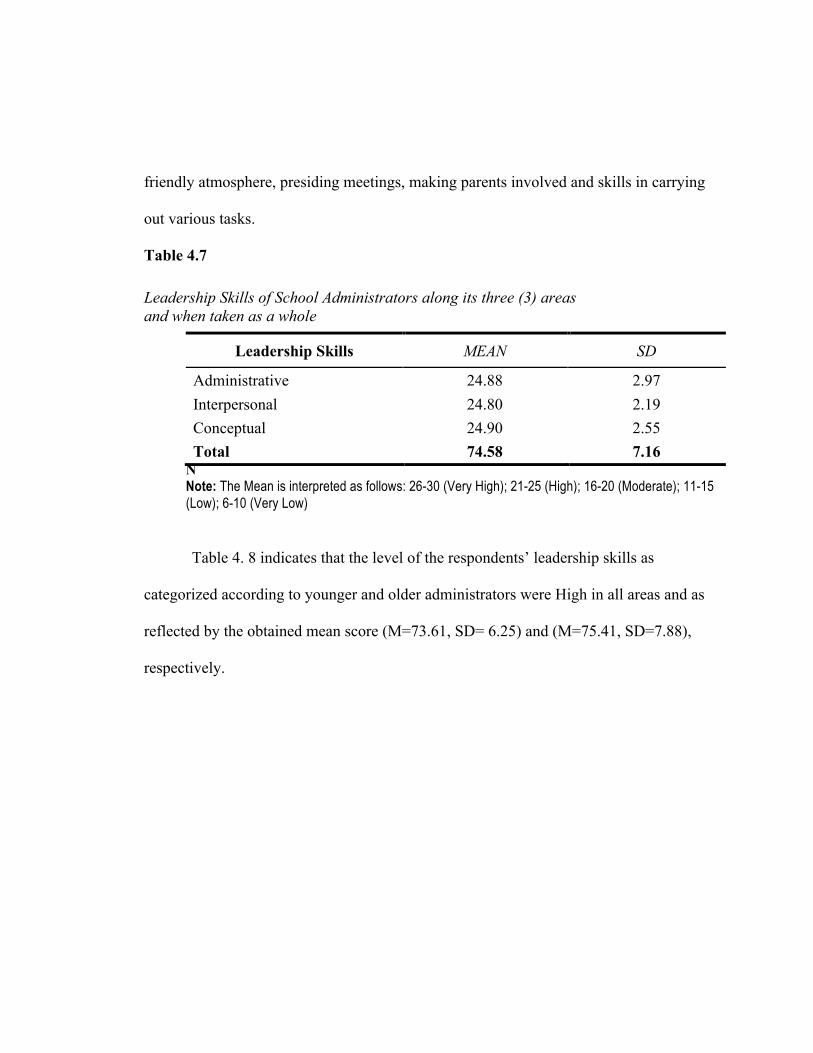
friendly atmosphere, presiding meetings, making parents involved and skills in carrying
out various tasks.
Table 4.7 Leadership Skills of School Administrators along its three (3) areas and when taken as a whole
N Note: The Mean is interpreted as follows: 26-30 (Very High); 21-25 (High); 16-20 (Moderate); 11-15 (Low); 6-10 (Very Low)
Table 4. 8 indicates that the level of the respondents’ leadership skills as
categorized according to younger and older administrators were High in all areas and as
reflected by the obtained mean score (M=73.61, SD= 6.25) and (M=75.41, SD=7.88),
respectively.
Leadership Skills MEAN SD
Administrative 24.88 2.97 Interpersonal 24.80 2.19 Conceptual 24.90 2.55 Total 74.58 7.16

Table 4.8 Leadership Skills of School Administrators along its three (3) areas and categorized according to Age
Note: The Mean is interpreted as follows: 26-30 (Very High); 21-25 (High); 16-20 (Moderate); 11-15 (Low); 6-10 (Very Low) Table 4.9 reveals that the level of the respondents’ Leadership Skills as
categorized according to male and female administrators were High in all areas and as
indicated by the obtained mean score (M= 75.06, SD=7.62) and (M=74.31, SD=7.00),
respectively.
Table 4.9 Leadership Skills of School Administrators along its three (3) areas and categorized according to Sex
Note: The Mean is interpreted as follows: 26-30 (Very High); 21-25 (High); 16-20 (Moderate); 11-15 (Low); 6-10 (Very Low)
Leadership Skills
Younger Older MEAN SD MEAN SD
Administrative 24.61 2.79 25.11 3.15 Interpersonal 24.43 1.80 25.11 2.45 Conceptual 24.57 2.29 25.19 2.76
Total 73.61 6.25 75.41 7.88
Leadership Skills Male Female MEAN SD MEAN SD
Administrative 24.94 3.11 24.84 2.94 Interpersonal 24.72 2.22 24.84 2.20 Conceptual 25.39 2.66 24.63 2.49
Total 75.06 7.62 74.31 7.00
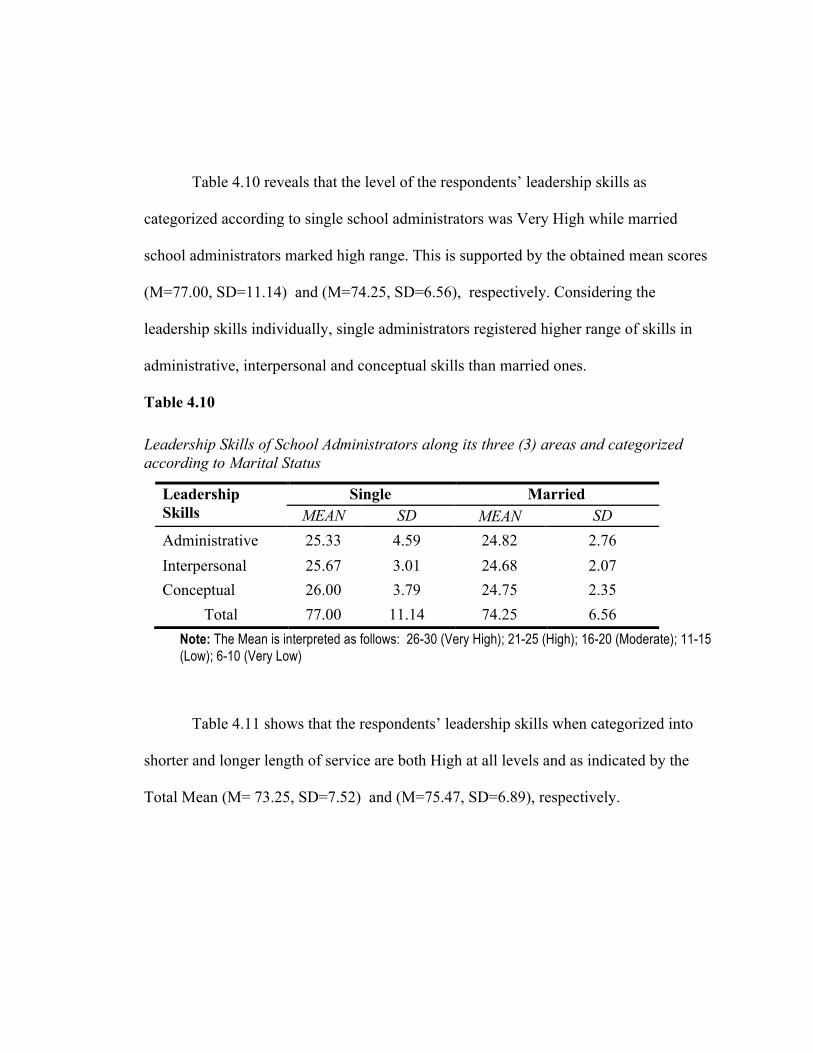
Table 4.10 reveals that the level of the respondents’ leadership skills as
categorized according to single school administrators was Very High while married
school administrators marked high range. This is supported by the obtained mean scores
(M=77.00, SD=11.14) and (M=74.25, SD=6.56), respectively. Considering the
leadership skills individually, single administrators registered higher range of skills in
administrative, interpersonal and conceptual skills than married ones.
Table 4.10 Leadership Skills of School Administrators along its three (3) areas and categorized according to Marital Status
Note: The Mean is interpreted as follows: 26-30 (Very High); 21-25 (High); 16-20 (Moderate); 11-15 (Low); 6-10 (Very Low)
Table 4.11 shows that the respondents’ leadership skills when categorized into
shorter and longer length of service are both High at all levels and as indicated by the
Total Mean (M= 73.25, SD=7.52) and (M=75.47, SD=6.89), respectively.
Leadership Skills
Single Married MEAN SD MEAN SD
Administrative 25.33 4.59 24.82 2.76 Interpersonal 25.67 3.01 24.68 2.07 Conceptual 26.00 3.79 24.75 2.35
Total 77.00 11.14 74.25 6.56
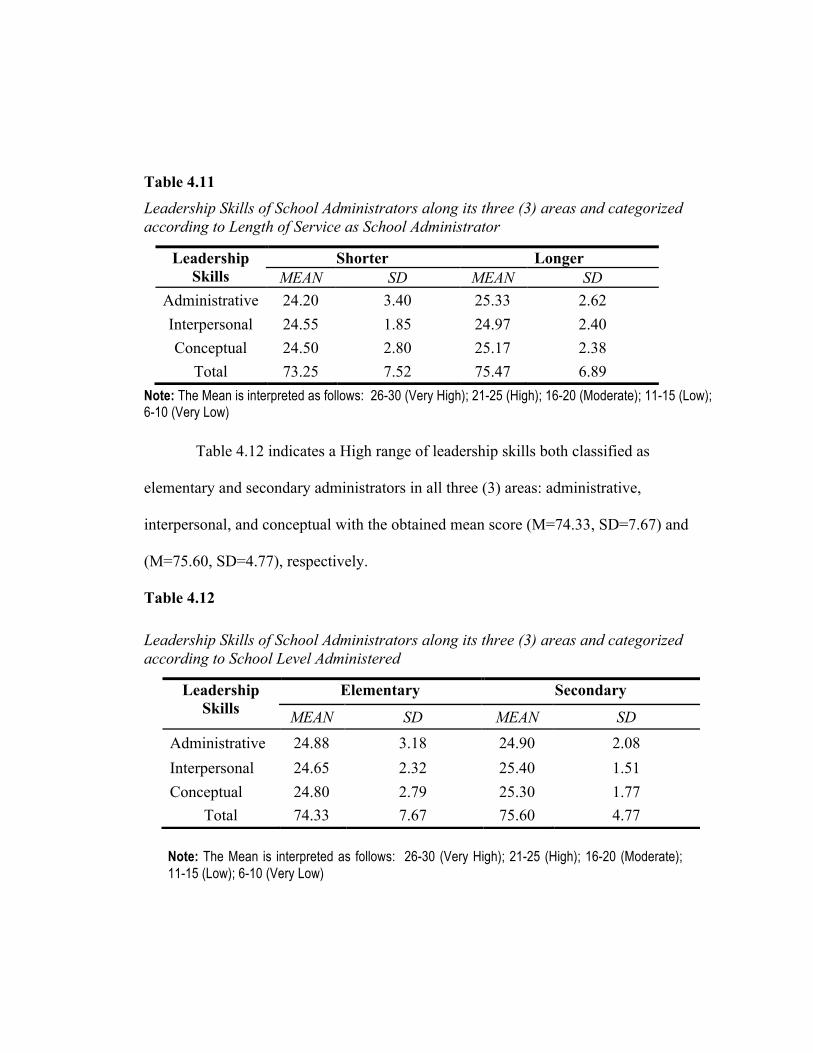
Table 4.11 Leadership Skills of School Administrators along its three (3) areas and categorized according to Length of Service as School Administrator
Note: The Mean is interpreted as follows: 26-30 (Very High); 21-25 (High); 16-20 (Moderate); 11-15 (Low); 6-10 (Very Low)
Table 4.12 indicates a High range of leadership skills both classified as
elementary and secondary administrators in all three (3) areas: administrative,
interpersonal, and conceptual with the obtained mean score (M=74.33, SD=7.67) and
(M=75.60, SD=4.77), respectively.
Table 4.12 Leadership Skills of School Administrators along its three (3) areas and categorized according to School Level Administered
Note: The Mean is interpreted as follows: 26-30 (Very High); 21-25 (High); 16-20 (Moderate); 11-15 (Low); 6-10 (Very Low)
Leadership Skills
Shorter Longer MEAN SD MEAN SD
Administrative 24.20 3.40 25.33 2.62 Interpersonal 24.55 1.85 24.97 2.40 Conceptual 24.50 2.80 25.17 2.38
Total 73.25 7.52 75.47 6.89
Leadership Skills
Elementary Secondary
MEAN SD MEAN SD Administrative 24.88 3.18 24.90 2.08 Interpersonal 24.65 2.32 25.40 1.51 Conceptual 24.80 2.79 25.30 1.77
Total 74.33 7.67 75.60 4.77

3. The degree of correlation between Adversity Quotient® and Leadership Skills of School Administrators
Table 4.13 reflects that the degree of correlation of the respondents’
administrative skills as to the four dimensions of the AQ is Very Low as revealed by the
obtained coefficient of correlation of 0.122. According to Mumford, Zaccaro, Harding, et
al., (2000) administrative skills refer to those competencies a leader needs to run an
organization in order to carry out the organization’s purposes and goals. It is divided into
three (3) sets of skills: managing people, managing resources, and showing technical
competence.
Table 4.13 Degree of Correlation among Administrative Skills and Dimensions of AQ
Note: ±0.81-1.00 (Very High); ±0.61-0.80 (High); ±0.41-0.60 (Moderate); ±0.21-0.40 (Low); ±0-0.20 (Very Low)
The table 4.14 discloses that the respondents’ interpersonal skills when correlated
to Dimensions of AQ was Low as shown in the total result of 0.405. Considering the
dimensions of AQ individually, the degree of correlation between interpersonal skills in
terms of Control and Ownership were Low. Interpersonal skills include being socially
perceptive, shows emotional stability, and manage interpersonal conflicts (Mumford,
Dimensions of AQ Coefficient of Correlation
Administrative Skills vs. Control -0.001 Administrative Skills vs. Ownership 0.205 Administrative Skills vs. Reach 0.042 Administrative Skills vs. Endurance 0.009 Administrative Skills vs.AQ 0.122
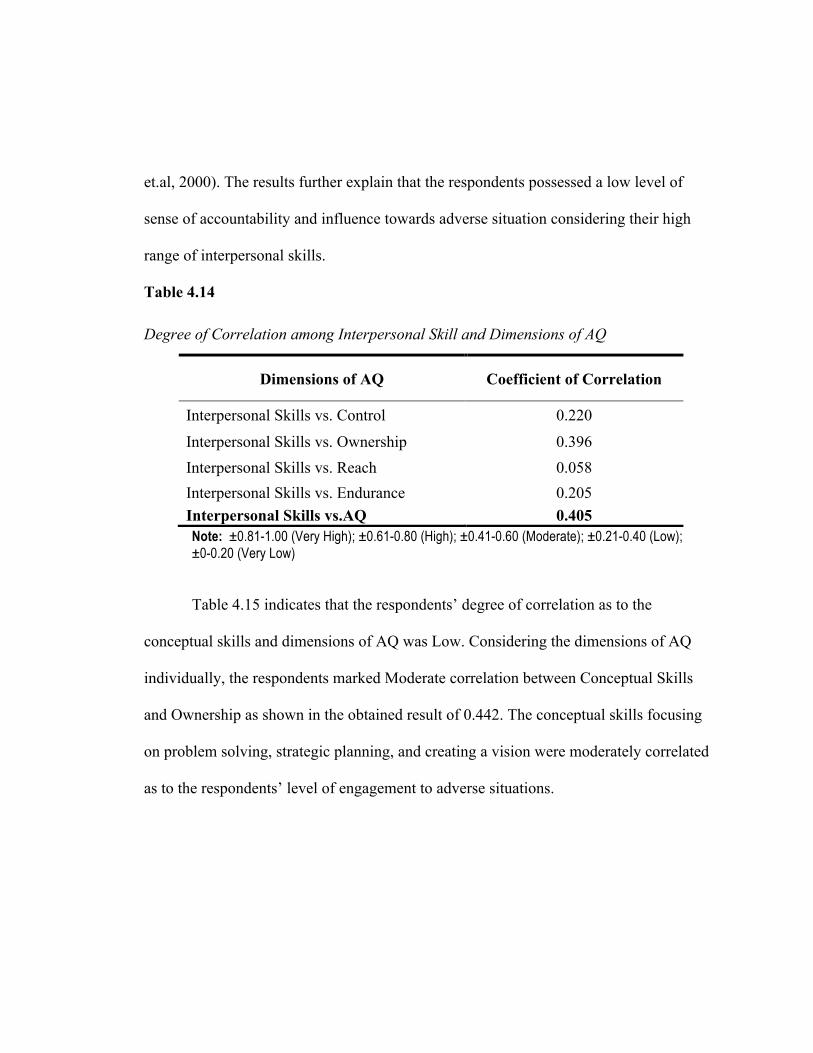
et.al, 2000). The results further explain that the respondents possessed a low level of
sense of accountability and influence towards adverse situation considering their high
range of interpersonal skills.
Table 4.14 Degree of Correlation among Interpersonal Skill and Dimensions of AQ
Note: ±0.81-1.00 (Very High); ±0.61-0.80 (High); ±0.41-0.60 (Moderate); ±0.21-0.40 (Low); ±0-0.20 (Very Low)
Table 4.15 indicates that the respondents’ degree of correlation as to the
conceptual skills and dimensions of AQ was Low. Considering the dimensions of AQ
individually, the respondents marked Moderate correlation between Conceptual Skills
and Ownership as shown in the obtained result of 0.442. The conceptual skills focusing
on problem solving, strategic planning, and creating a vision were moderately correlated
as to the respondents’ level of engagement to adverse situations.
Dimensions of AQ Coefficient of Correlation
Interpersonal Skills vs. Control 0.220
Interpersonal Skills vs. Ownership 0.396 Interpersonal Skills vs. Reach 0.058 Interpersonal Skills vs. Endurance 0.205 Interpersonal Skills vs.AQ 0.405

Table 4.15 Degree of Correlation among Conceptual Skill and Dimensions of AQ
Note: ±0.81-1.00 (Very High); ±0.61-0.80 (High); ±0.41-0.60 (Moderate); ±0.21-0.40 (Low); ±0-0.20 (Very Low)
Table 4.16 reveals that the respondents’ degree of correlation between Total
Leadership Skills and Total Adversity Quotient® was Low as shown in the obtained
result of 0.304. Considering the dimensions of AQ individually, the respondents marked
Moderate correlation in Reach while Low correlation in Ownership as proven by the
obtained results of 0.42 and 0.364, respectively. This finding was confirmed by the result
in a study of Canivel (2010) of which the Adversity Quotient® has a positive relation
with the school practices of the principals. It affects their entire endeavors, plans and
practices in their school.
Dimensions of AQ Coefficient of Correlation
Conceptual Skills vs. Control 0.178 Conceptual Skills vs. Ownership 0.442 Conceptual Skills vs. Reach 0.021 Conceptual Skills vs. Endurance 0.130 Conceptual Skills vs.AQ 0.364
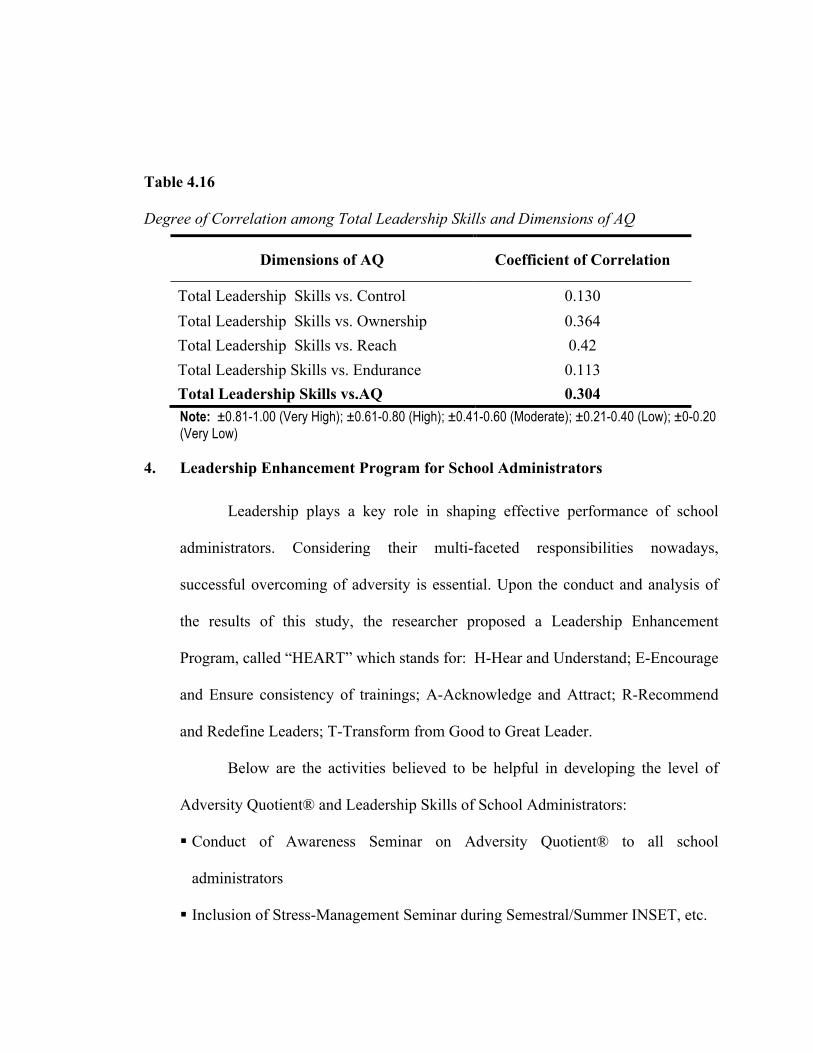
Table 4.16 Degree of Correlation among Total Leadership Skills and Dimensions of AQ
Note: ±0.81-1.00 (Very High); ±0.61-0.80 (High); ±0.41-0.60 (Moderate); ±0.21-0.40 (Low); ±0-0.20 (Very Low)
4. Leadership Enhancement Program for School Administrators
Leadership plays a key role in shaping effective performance of school
administrators. Considering their multi-faceted responsibilities nowadays,
successful overcoming of adversity is essential. Upon the conduct and analysis of
the results of this study, the researcher proposed a Leadership Enhancement
Program, called “HEART” which stands for: H-Hear and Understand; E-Encourage
and Ensure consistency of trainings; A-Acknowledge and Attract; R-Recommend
and Redefine Leaders; T-Transform from Good to Great Leader.
Below are the activities believed to be helpful in developing the level of
Adversity Quotient® and Leadership Skills of School Administrators:
! Conduct of Awareness Seminar on Adversity Quotient® to all school
administrators
! Inclusion of Stress-Management Seminar during Semestral/Summer INSET, etc.
Dimensions of AQ Coefficient of Correlation
Total Leadership Skills vs. Control 0.130 Total Leadership Skills vs. Ownership 0.364 Total Leadership Skills vs. Reach 0.42 Total Leadership Skills vs. Endurance 0.113 Total Leadership Skills vs.AQ 0.304

! Sustain the conduct of School Heads’ Induction Program/Training to newly
assigned school administrators
! Conduct of In-Service Trainings for School Administrators involving trends and
issues concerning their basic roles, functions and skills.
! Conduct of Mentoring/Coaching and Team Building activities for School
Administrators
! Practice Rewards, Recognition and Incentives System for school administrators’
development through just and healthy working relationship
Chapter 5
SUMMARY, CONCLUSIONS, AND RECOMMENDATIONS
This chapter presents the summary of findings, conclusions, and recommendations
formulated on the basis of the research findings.
Summary of Findings
The following are the findings of the study after which appropriate descriptive-
correlational statistical tools were used:
5. School Administrators’ Level of Adversity Quotient® along Control, Ownership, Reach and Endurance when taken as a whole and categorized according to Age, Sex, Marital Status, Length of service as school administrator, and School level administered.
The level of Adversity Quotient® of School Administrators along its four (4)
dimensions and when taken as a whole was Below Average. When dimensions were
taken individually, the school administrators marked an Average level in Reach while all
the rest of the dimensions were Below Average.
When categorized according to younger and older age, the levels of the
respondents’ Adversity Quotients® were Below Average in all four (4) dimensions.
When grouped according to sex, both male and female school administrators had a total
mean of Below Average. However, when analyzed per dimension, the levels of Adversity
Quotient® of male administrators are higher than female most especially in Reach
dimension.
The level of the respondents’ Adversity Quotient® as categorized to single and
married administrators were Below Average with a little difference per dimension. As to
Control dimension, male administrators marked Low while female administrators reached
Below Average level. Moreover, in Reach dimension, both administrators marked
Average level.
The level of the respondents’ Adversity Quotient® as categorized to shorter and
longer years as school administrators were both Below Average. When all dimensions
were taken individually, the results showed the same level.
When categorized to elementary and secondary school administrators, the levels
of the respondents’ Adversity Quotient® were both Below Average. However, when
analyzed per dimension, the levels of Adversity Quotient of secondary school
administrators was higher than elementary school administrators especially in Control
dimension where they marked Below Average level as compared to Low level of
elementary administrators.
6. School administrators’ Level of Leadership Skills in terms of administrative, interpersonal, and conceptual skills and when grouped according to Age, Sex, Marital Status, Length of service as school administrator, and School level administered.
The level of the school administrators’ Leadership Skills when taken as a whole is
High. When per area is taken into consideration, the school administrators have registered
High range in all three (3) areas: administrative, interpersonal, and conceptual skills.

When categorized according to younger and older administrators, their levels of
the leadership skills were High in all three (3) areas. When areas were taken individually,
older administrators have higher leadership skills than younger ones especially when the
mean is considered.
When categorized according to sex, male and female administrators’ marked High
in all three (3) areas: administrative, interpersonal, and conceptual skills. When the total
mean is considered, male administrators had higher mean than female ones.
When categorized according to marital status, single school administrators had
Very High range of leadership skills while married school administrators marked High
range. Considering the Leadership Skills individually, single administrators registered
higher range of skills in administrative and interpersonal while very high in conceptual
skills. Married administrators on the other hand, registered High in all three (3)
leadership skills.
The levels of respondents’ leadership skills when categorized into shorter and
longer length of service are both High at all three (3) areas: administrative, interpersonal,
and conceptual skills. When the total mean is considered per leadership area,
administrators with longer length of service had higher mean than ones with shorter
length of serv
The levels of respondents’ leadership skills when categorized according to school
level administered: elementary and secondary administrators are both High at all three (3)
areas: administrative, interpersonal, and conceptual skills. When the total mean is
considered per leadership area, secondary school administrators had higher mean than
elementary school administrators.
7. The degree of Correlation between Adversity Quotient® and Leadership Skills
of School Administrators
The degree of correlation between the school administrators’ administrative skills
and the dimensions of Adversity Quotient® was Very Low. When taken individually, the
lowest correlation registered was between administrative skills and Control dimension.
The degree of correlation between the school administrators’ interpersonal skills
and the dimensions of Adversity Quotient® was Low. Considering the dimensions of AQ
individually, the degree of correlation between interpersonal skills in terms of Control
and Ownership were Low while interpersonal skills to Reach and Endurance dimensions
were Very Low.
The degree of correlation between the school administrators’ conceptual skills and
the dimensions of Adversity Quotient® was Low. Considering the dimensions of AQ
individually, there was a Moderate correlation between Conceptual Skills and Ownership
while all the rest registered Very Low correlation.
The degree of correlation between the school administrators’ total leadership
skills and total Adversity Quotient® was Low. Considering the dimensions of AQ
individually, the respondents marked Very Low between Leadership - Control and
Endurance, Low correlation between Leadership-Ownership, and Moderate correlation
between Leadership-Reach.
8. Leadership Enhancement Program for School Administrators
Basing from the analysis of the results of this study, the researcher proposed
a Leadership Enhancement Program, called “HEART” which stands for: H-Hear
and Understand; E-Encourage and Ensure consistency of trainings; A-Acknowledge
and Attract; R-Recommend and Redefine Leaders; T-Transform from Good to
Great Leader
Below are the suggested activities believed to be helpful in developing the
level of Adversity Quotient® and Leadership Skills of School Administrators:
! Conduct of Awareness Seminar on Adversity Quotient® to all school
administrators
! Inclusion of Stress-Management Seminar during Semestral/Summer INSET, etc.
! Sustain the conduct of School Heads’ Induction Program/Training to newly
assigned school administrators
! Conduct of In-Service Trainings for School Administrators involving trends and
issues concerning their basic roles, functions and skills.
! Conduct of Mentoring/Coaching and Team Building activities for School
Administrators
! Practice Rewards, Recognition and Incentives System for school administrators’
development through just and healthy working relationship
Conclusions
Based from findings, the following are the conclusions in this study:
1. School Administrators’ Level of Adversity Quotient® of along Control, Ownership, Reach and Endurance when taken as a whole and categorized according to Age, Sex, Marital Status, Length of service as school administrator, and School level administered.
Public elementary and secondary school administrators in the Division of Cadiz
City are within the Below Average level of Adversity Quotient® which is far below the
Average. This indicates that the respondents may be at the moment suffering in a number
of ways and also unnecessarily feel his/her fortitude wavered and or despondency. This
also implies that respondents were under utilizing their potentials battling against a sense
of helplessness and despair. But through learning and practicing the tools in raising AQ,
their motivation, persistence and performance can be revitalized. The demographic
profile such as age, sex, marital status, years of experience as school administrator and
school level administered do not affect the respondents’ responses as to how they
perceived adversities. Findings further reveal that when each Adversity Quotient®
Dimensions were taken individually, the respondents are in Average Level under Reach
dimension. This shows that the respondents react to adverse events somewhat specific.
2. School administrators’ Level of Leadership Skills in terms of administrative, interpersonal, and conceptual skills and when grouped according to Age, Sex, Marital Status, Length of service as school administrator, and School level administer.
Public elementary and secondary school administrators in the Division of
Cadiz City performed High level of leadership skills. When all three (3) broad areas

of leadership skills: administrative, interpersonal, and conceptual were considered
and categorized according to demographic profile, the respondents showed
consistency of results as they marked High range per area. This simply means that
school administrators can run and lead an organization using critical and systems
thinking and effective work relationship towards his/her peers, subordinates,
superiors, and community in order to carry out the organization’s purpose and goals.
3. The degree of correlation between Adversity Quotient® and Leadership Skills of School Administrators
The degree of correlation between Adversity Quotient® and Leadership Skills of
School Administrators is Low. This further explains that as the result of Adversity
Quotient® is Below Average, the data of leadership skills is High. Findings further
disclose that one’s Leadership Skills is not affected by his/her level of adversity, since
handling adversities are just part of Leadership Skills.
However, there found to be a Moderate Correlation between Leadership Skills
and Adversity Quotient® Reach dimension. The respondents’ High Leadership Skills
help them put setbacks in perspective, resolving them for learning.
It is encouraging to know that despite the challenges, troubles, and difficulties the
school administrators were facing, still they managed to lead their respective schools
skillfully.
4. Leadership Enhancement Program for School Administrators
The researcher proposed a Leadership Enhancement Program, called
“HEART” which stands for: H-Hear and Understand; E-Encourage and Ensure

consistency of trainings; A-Acknowledge and Attract; R-Recommend and Redefine
Leaders; T-Transform from Good to Great Leader.
Recommendations
In view of the findings of the study, the researcher offers the following
recommendations:
1. School Administrators must clearly understand individual’s
AQ® and must constantly review their own AQ®P as guide for better
leadership performance.
2. School Administrators should always be guided by their leadership skills to be
applied in their workplace taking into consideration their leadership strengths
and weaknesses.
3. Human Relation Department will take into consideration AQ® in the
performance or in the management of human organization especially in
hiring/promotion process thereby making them conscious to deal with
adversity inherent in their jobs. They may include AQ in their design of
performance appraisal.
4. Middle/top level management will develop enhancement activities through
trainings, seminars, programs, or simply extend technical assistance to school
administrators through the data captured in this research.
5. Researcher/s may replicate studies using experimental method or any
appropriate method which will focus on how to enhance one’s adversity level.

6. Expose school administrators to more trainings and development programs in
order to nourish their leadership skills and manage setbacks squarely.

References
Atkinson, P. (2005, Spring). Managing Resistance to Change. Management Services , 14-19.
Bantang, Fatima Olga A., Bianes, N. J. S., Caguingin, M. P., Estrella, P. M. C. ,Macanlalay, C. K. M. (2013, March). The Relationship of Personal Characteristics and Job Satisfaction to Adversity Quotient of Police Officers in Manila Police District. Polytechnic University of the Philippines
Brian Golden (2002-2013). Dare To Live Without Limits.
Brian Tracy (2014, March 7). How to Achieve Great Success While Dealing With Adversity
Canivel, L. (2010). “AQ and leadership style, performance and best practices” Retrieved in August, 2012, from http://www.peaklearning.com/documents/PEAK_GRI_canivel.pdf
Choen, W. (2008, August). Effective Leadership. Leadership Excellence , 25 (8).
Cura, J., & Gozum, J. (2011). Correlational Study on Adversity Quotient® and the Mathematics Achievement of Sophomore Students of College of Engineering and Technology in Pamantasan ng Lungsod ng Maynilaw Retrieved in August, 2012, from http://www.peaklearning.com/documents/PEAK_GRI_gozum.pdf
Dooley, L., & O’Sullivan, D. (2001). Structuring Innovation: A Conceptual Model and Implementation
Duncan, T. (2002). IMC: Using Advertising & Promotion to Build Brands. New York: McGraw-Hill.
Ferrer, M. (2009). Relationship Of Personal Characteristics, Leadership Styles, And Job Satisfaction To Adversity Quotient® Of Academic Heads Of Selected State Colleges And Universities In The National Capital Region Unpublished PhD Dissertation, Polytechnic University of Philippines http://peaklearning.com/documents/PEAK_GRI_ferrer.pdf Retrieved October 2009
Frederick G. Fernando (6/18/2012). An Overview: School Based Management Assessing the Effectiveness of School Leaders: New Directions and Process
(2009). The Wallace Foundations Harry Anthony Patrinos, Felipe Barrera-Osorio and Tazeen Fasih (2009, June).
Decentralized Decision-Making in Schools: The Theory and Evidence on School-Based Management
Hesselbein, F., Goldsmith, M., & Somerville, I. (2002). Leading For Innovation and Organizing for Results. San Francisco: Jossey-Bass.
Hrebiniak, L. G. (2005). Making Strategy Work. New Jersey: Wharton School Publishing.
http://education-portal.com/academy/lesson/systems-thinking-in-management-definition-theory-model.html#lesson
http://education.stateuniversity.com/pages/2333/Principal-School.html#ixzz380Zhr9yp
http://dx.doi.org/10.1596/978-0-8213-7969-1
http://mdk12.org/process/leading/p_indicators.html
http://www.adversityadvantage.com/index.html
http://www.forbes.com/sites/kevinkruse/2013/04/09/what-is-leadership/2/
http://www.ramergroup.com/pdfs/Concepts-of-Leadership.pdf
http://www.sagepub.com/upm-data/59372_Chapter_6.pdf
http://www.skillsyouneed.com/leadership-skills.html#ixzz3QCHv2Npt
Improving School Leadership The Toolkit, 2009, ORGANISATION FOR ECONOMIC CO-OPERATION AND DEVELOPMENT (OECD) Publications
Jodel N. Napire (2013, March). Adversity Quotient® and Leadership Style in Relation to the Demographic Profile of the Elementary School Principals in the Second Congressional District of Camarines Sur. University of Northeastern Philippines http://www.peaklearning.com/documents/PEAK_GRI_napire.pdf
Kevin Kruse (2013, March 9). Forbes
Lazaro-Capone A. R. (2004), ‘Adversity Quotient & the Performance Level of Selected Middle Managers of the Different Departments of the City of Manila as Revealed by the 360 Degree Feedback System�; Paper presented at the 5th Regional Asian Conference of the International Industrial Relations Association at Seoul, Korea. June 23-26 http://peaklearning.com/documents/PEAK_GRI_capones.pdf Retrieved June 2008
Lovallo, D., & Kahneman, D. (2003). Delusions of Success. Harvard Business Review , 56-63.
Maddock, M., & Viton, R. L. (2008). Why Companies Lack Successful Innovation. Retrieved
Matta, N. F., & Ashkenas, R. N. (2003, September). Why Good Projects Fail Anyway. Harvard Business Review , 109-114.
Mirza, B. (2009). Organizational Change Starts With Individual Employees. HRMagazine , 34, 31-32.
Moment, R. (2007, August 6). Top 7 Leadership Skills for Business Success. Retrieved July 18, 2009
Mumford, M.D. et al (2000), Development of leadership skills, experience & timing The Leadership Quarterly; 11 (1): 87-1
Newcomb, K. (2005, November/December). Transfomational Leadership: Four Keys to Help You and Your Organization. Debt , 34-36.
Paul G. Stoltz and Erik Weihenmayer. 2008 (The Adversity Advantage).Fireside, a division of Simon & Schuster
Peter G. Northouse (2011, June). Introduction to Leadership (Concepts and Practices): 2nd edition
Priyanka Jain (2013), “DEVELOPMENT OF A PROGRAMMME FOR ENHANCING ADVERSITY QUOTIENT® OF STD VIIITH STUDENTS,” http://www.peaklearning.com/documents/PEAK_GRI_priyankaJain.pdf
Stansbury, J. (2009, January). Reasoned Moral Agreement: Applying Discourse Ethics with Oranizations.Business Ethics Quarterly , 33-56.
Stoltz, P. G. (1997). Adversity Quotient: Turning Obstacles into Opportunities. United States: John Wiley and Sons, Inc.
Stoltz, P. G. (2000). Adversity Quotient: Turning Obstacles into Opportunities.
United States: John Wiley and Sons, Inc.
Strebel, P. (1996, May). Why Do Employees Resist Change? Harvard Business Review , 86-92.
Top 7 Business: http://top7business.com/?Top-7-Leadership-Skills-for-Business-Success&id=3632
Webster’s New World College Dictionary
Weiss, W. (2000, August). Effective Leadership: What are the Requisites? Supervision , 61(8).
Williams, M. (2003). The Relationship between Principal Response to Adversity and Student Achievement Unpublished Ed D dissertation, Cardinal Stritch University, http://peaklearning.com/documents/PEAK_GRI_williamsAbstract.pdf Retrieved June 2008

APPENDIX A
AQ PROFILE OFFICIAL RESEARCH AGREEMENT
August 28, 2014 AQ Profile® Official Research Agreement By signing this document, I agree to
1. Use the AQ Profile® for only the research project I have proposed to, and which has been approved by Dr. Paul Stoltz, CEO of PEAK Learning, Inc.
2. Not use the AQ Profile® for any monetary gain 3. Not to duplicate the AQ Profile® for any purpose except for the approved research 4. Not to allow anyone else to duplicate the AQ Profile® 5. Return or destroy the original AQ Profile® to PEAK Learning, Inc. once my research is complete 6. Share all AQ® data and a copy of my study with PEAK Learning, Inc. 7. Have my name and paper posted on the Global Resilience Institute/PEAK Learning web page 8. Not to include the AQ Profile® in research paper or appendix 9. Use the symbol ® whenever I mention AQ®, Adversity Quotient®, and AQ Profile® in any written form 10. Protect PEAK Learning’s intellectual property to the best of my ability
__________________ ________________ Enjenette Baroa Date
Please sign and fax back to the attention of Katie Martin, 805-595-7771Or, scan and email to [email protected]
Performance ! Excellence ! Achievement ! Knowledge
PEAK Learning, Inc. • (800) 255-5572 • www.peaklearning.com • [email protected]
APPENDIX B
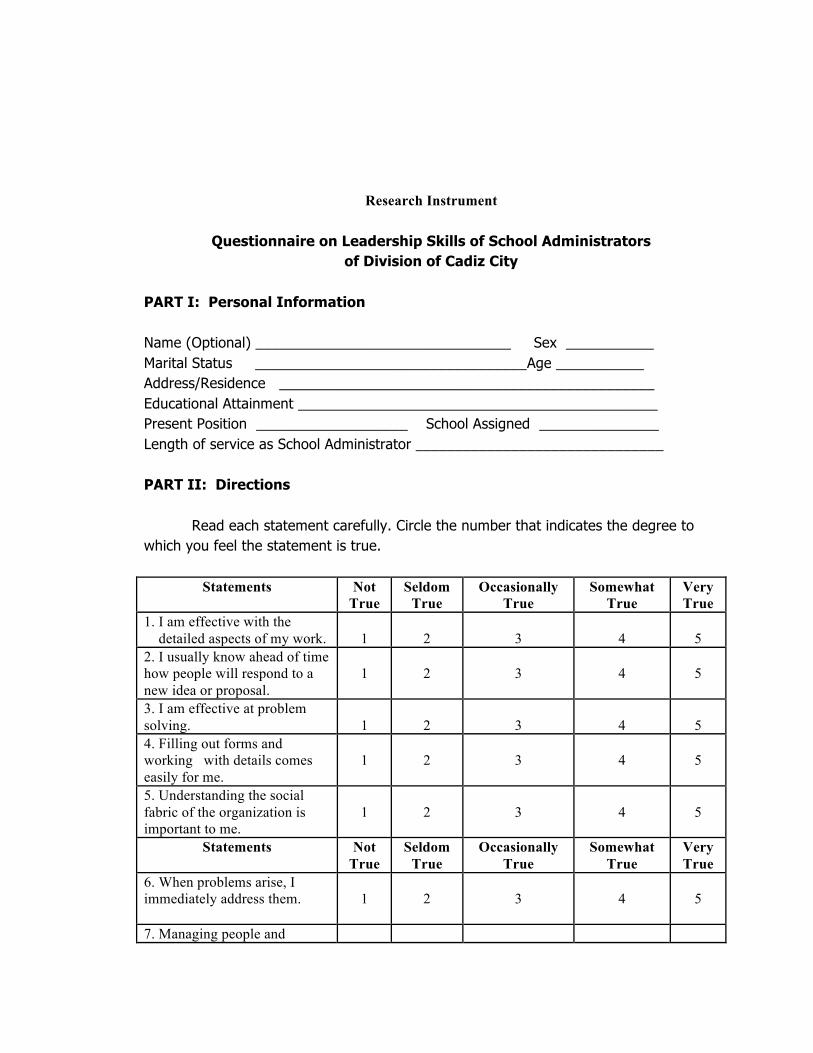
Research Instrument
Questionnaire on Leadership Skills of School Administrators
of Division of Cadiz City
PART I: Personal Information Name (Optional) ________________________________ Sex ___________ Marital Status __________________________________ Age ___________ Address/Residence _______________________________________________ Educational Attainment _____________________________________________ Present Position ___________________ School Assigned _______________ Length of service as School Administrator _______________________________ PART II: Directions Read each statement carefully. Circle the number that indicates the degree to which you feel the statement is true.
Statements Not True
Seldom True
Occasionally True
Somewhat True
Very True
1. I am effective with the detailed aspects of my work.
1
2
3
4
5
2. I usually know ahead of time how people will respond to a new idea or proposal.
1
2
3
4
5
3. I am effective at problem solving.
1
2
3
4
5
4. Filling out forms and working with details comes easily for me.
1
2
3
4
5
5. Understanding the social fabric of the organization is important to me.
1
2
3
4
5
Statements Not True
Seldom True
Occasionally True
Somewhat True
Very True
6. When problems arise, I immediately address them.
1
2
3
4
5
7. Managing people and

resources is one of my strengths.
1 2 3 4 5
8. I am able to sense the emotional undercurrents in my group.
1
2
3
4
5
9. Seeing the big picture comes easily for me.
1
2
3
4
5
10. In my work, I enjoy responding to people’s requests and concerns.
1
2
3
4
5
11. I use my emotional energy to motivate others.
1
2
3
4
5
12. Making strategic plans for my company appeals to me.
1
2
3
4
5
13. Obtaining and allocating resources is a challenging aspect of my job.
1
2
3
4
5
14. The key to successful conflict resolution is respecting my opponent.
1
2
3
4
5
15. I enjoy discussing organizational values and philosophy.
1
2
3
4
5
16. I am effective at obtaining resources to support our programs.
1
2
3
4
5
17. I work hard to find consensus in conflict situations.
1
2
` 3
4
5
18. I am flexible about making changes in our organization.
1
2
3
4
5
APPENDIX C
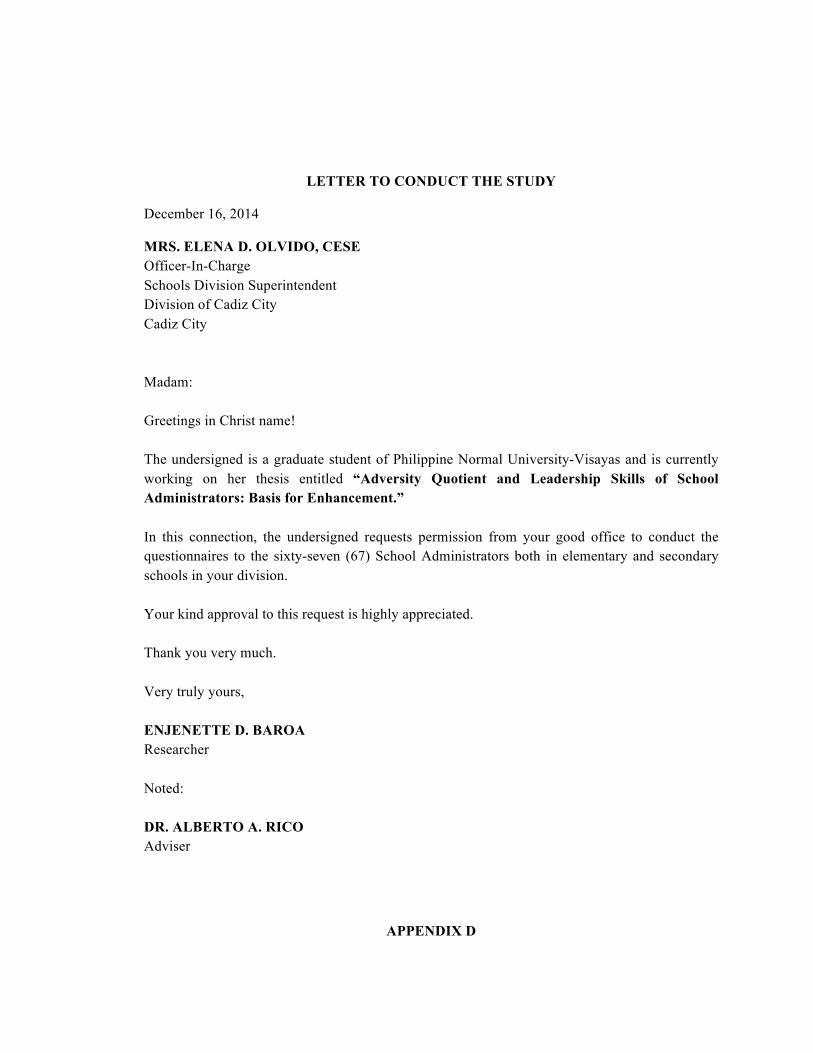
LETTER TO CONDUCT THE STUDY
December 16, 2014
MRS. ELENA D. OLVIDO, CESE Officer-In-Charge Schools Division Superintendent Division of Cadiz City Cadiz City Madam: Greetings in Christ name! The undersigned is a graduate student of Philippine Normal University-Visayas and is currently working on her thesis entitled “Adversity Quotient and Leadership Skills of School Administrators: Basis for Enhancement.” In this connection, the undersigned requests permission from your good office to conduct the questionnaires to the sixty-seven (67) School Administrators both in elementary and secondary schools in your division. Your kind approval to this request is highly appreciated. Thank you very much. Very truly yours, ENJENETTE D. BAROA Researcher Noted: DR. ALBERTO A. RICO Adviser
APPENDIX D
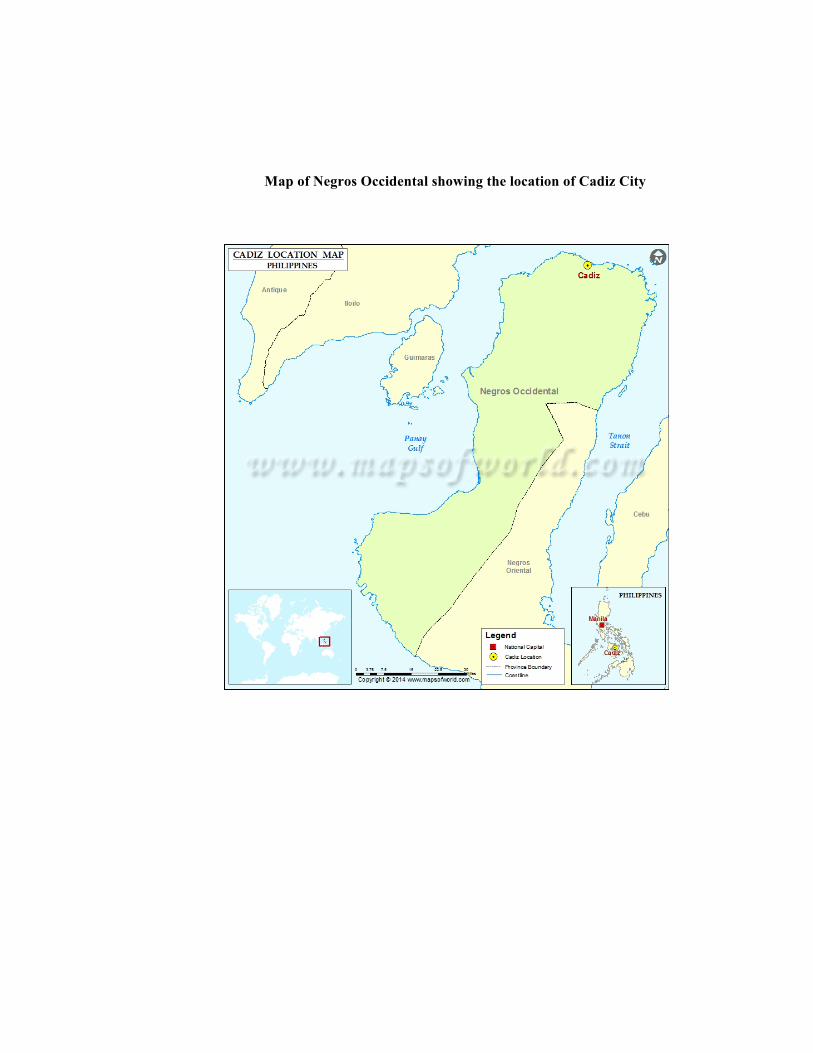
Map of Negros Occidental showing the location of Cadiz City