Advanced Nanotube and Nanofiber Materials
185
-
Upload
ilovenature -
Category
Documents
-
view
33 -
download
7
description
For material student
Transcript of Advanced Nanotube and Nanofiber Materials

NANOTECHNOLOGY SCIENCE AND TECHNOLOGY
ADVANCED NANOTUBE
AND NANOFIBER MATERIALS
No part of this digital document may be reproduced, stored in a retrieval system or transmitted in any form orby any means. The publisher has taken reasonable care in the preparation of this digital document, but makes noexpressed or implied warranty of any kind and assumes no responsibility for any errors or omissions. Noliability is assumed for incidental or consequential damages in connection with or arising out of informationcontained herein. This digital document is sold with the clear understanding that the publisher is not engaged inrendering legal, medical or any other professional services.
NANOTECHNOLOGY SCIENCE
AND TECHNOLOGY
Additional books in this series can be found on Nova’s website
under the Series tab.
Additional e-books in this series can be found on Nova’s website
under the e-books tab.
MATERIALS SCIENCE
AND TECHNOLOGIES
Additional books in this series can be found on Nova’s website
under the Series tab.
Additional e-books in this series can be found on Nova’s website
under the e-books tab.
NANOTECHNOLOGY SCIENCE AND TECHNOLOGY
ADVANCED NANOTUBE
AND NANOFIBER MATERIALS
A. K. HAGHI
AND
G. E. ZAIKOV
EDITORS
Nova Science Publishers, Inc.
New York
Copyright © 2012 by Nova Science Publishers, Inc.
All rights reserved. No part of this book may be reproduced, stored in a retrieval system or
transmitted in any form or by any means: electronic, electrostatic, magnetic, tape, mechanical
photocopying, recording or otherwise without the written permission of the Publisher.
For permission to use material from this book please contact us:
Telephone 631-231-7269; Fax 631-231-8175
Web Site: http://www.novapublishers.com
NOTICE TO THE READER
The Publisher has taken reasonable care in the preparation of this book, but makes no expressed
or implied warranty of any kind and assumes no responsibility for any errors or omissions. No
liability is assumed for incidental or consequential damages in connection with or arising out of
information contained in this book. The Publisher shall not be liable for any special,
consequential, or exemplary damages resulting, in whole or in part, from the readers’ use of, or
reliance upon, this material. Any parts of this book based on government reports are so indicated
and copyright is claimed for those parts to the extent applicable to compilations of such works.
Independent verification should be sought for any data, advice or recommendations contained in
this book. In addition, no responsibility is assumed by the publisher for any injury and/or damage
to persons or property arising from any methods, products, instructions, ideas or otherwise
contained in this publication.
This publication is designed to provide accurate and authoritative information with regard to the
subject matter covered herein. It is sold with the clear understanding that the Publisher is not
engaged in rendering legal or any other professional services. If legal or any other expert
assistance is required, the services of a competent person should be sought. FROM A
DECLARATION OF PARTICIPANTS JOINTLY ADOPTED BY A COMMITTEE OF THE
AMERICAN BAR ASSOCIATION AND A COMMITTEE OF PUBLISHERS.
Additional color graphics may be available in the e-book version of this book.
Library of Congress Cataloging-in-Publication Data
Advanced nanotube and nanofiber materials / editors, A.K. Haghi, G.E. Zaikov.
p. cm.
Includes index.
1. Nanotubes. 2. Nanostructured materials. I. Haghi, A. K. II. Zaikov, G. E. (Gennadii
Efremovich), 1935-
TA418.9.N35A32875 2012
620.1'15--dc23
2012005444
Published by Nova Science Publishers, Inc. † New York
ISBN: 978-1-62081-201-3 (eBook)
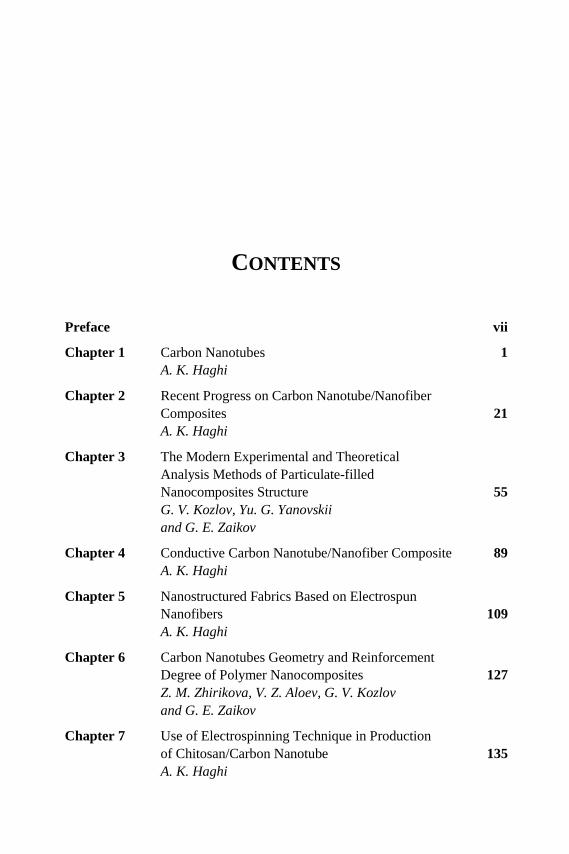
CONTENTS
Preface vii
Chapter 1 Carbon Nanotubes 1
A. K. Haghi
Chapter 2 Recent Progress on Carbon Nanotube/Nanofiber
Composites 21
A. K. Haghi
Chapter 3 The Modern Experimental and Theoretical
Analysis Methods of Particulate-filled
Nanocomposites Structure 55
G. V. Kozlov, Yu. G. Yanovskii
and G. E. Zaikov
Chapter 4 Conductive Carbon Nanotube/Nanofiber Composite 89
A. K. Haghi
Chapter 5 Nanostructured Fabrics Based on Electrospun
Nanofibers 109
A. K. Haghi
Chapter 6 Carbon Nanotubes Geometry and Reinforcement
Degree of Polymer Nanocomposites 127
Z. M. Zhirikova, V. Z. Aloev, G. V. Kozlov
and G. E. Zaikov
Chapter 7 Use of Electrospinning Technique in Production
of Chitosan/Carbon Nanotube 135
A. K. Haghi

Contents vi
Chapter 8 Combustion and Thermal Degradation
of Polypropylene in the Presence
of Multi-walled Carbon Nanotube
Composites 143
G. E. Zaikov, S. M. Lomakin, N. G. Shilkina
and R. Kozlowski
Index 163
PREFACE
Nowadays, the promising field of nanotechnology has a revolutionary
impact on science and technology. Although the development of
nanotechnology occurred in the late eighties, the idea of nanotechnology was
introduced in 1959, when Feynman, in his talk on the possibility to precisely
manipulate atoms and molecules commented, "But I am not afraid to consider
the final question as to whether, ultimately in the great future we can arrange
the atoms the way we want; the very atoms, all the way down!"
Thereafter, the field of nanotechnology was created by Eric Drexler by
expanding Feynman's vision of molecular manufacturing with contemporary
developments in understanding protein function. Drexler discussed the
possibility of molecular manufacturing as a process of fabricating objects with
specific atomic specifications using designed protein molecules. Although the
term “nanotechnology” is used by Taniguchi in 1974, in a different context,
Drexler is credited as being the first person to use the word nanotechnology in
his famous book Engines of Creation -The Coming Era of Nanotechnology.
Although the terms nanomaterial and nanocomposite represent new and
exciting fields in materials science, such materials have actually been used for
centuries and have always existed in nature. However, it is only recently that
the means to characterize and control structure at the nanoscale have
stimulated rational investigation and exploitation. A nanocomposite is defined
as a composite material where at least one of the dimensions of one of its
constituents is on the nano-metre size scale. The term usually also implies the
combination of two (or more) distinct materials, such as a ceramic and a
polymer, rather than spontaneously phase-segregated structures. The challenge
and interest in developing nanocomposites is to find ways to create
macroscopic components that benefit from the unique physical and mechanical
A. K. Haghi and G. E. Zaikov viii
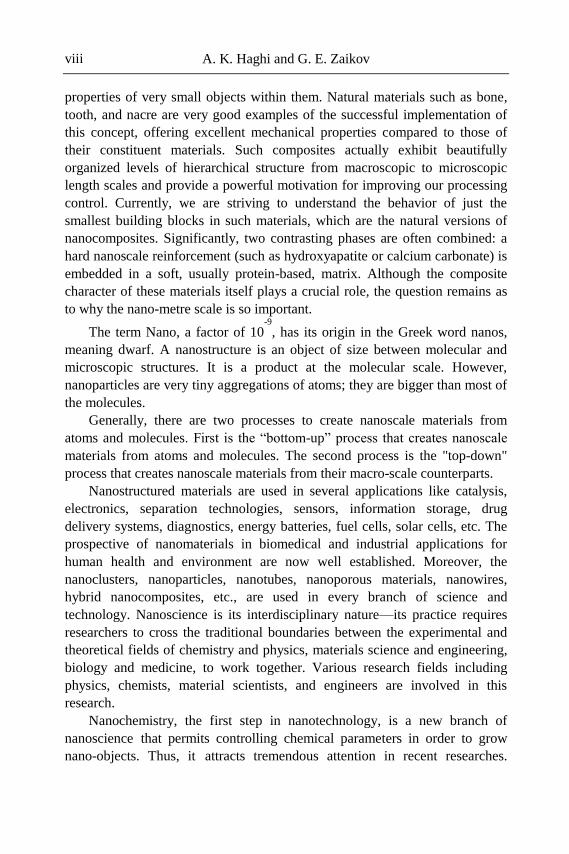
properties of very small objects within them. Natural materials such as bone,
tooth, and nacre are very good examples of the successful implementation of
this concept, offering excellent mechanical properties compared to those of
their constituent materials. Such composites actually exhibit beautifully
organized levels of hierarchical structure from macroscopic to microscopic
length scales and provide a powerful motivation for improving our processing
control. Currently, we are striving to understand the behavior of just the
smallest building blocks in such materials, which are the natural versions of
nanocomposites. Significantly, two contrasting phases are often combined: a
hard nanoscale reinforcement (such as hydroxyapatite or calcium carbonate) is
embedded in a soft, usually protein-based, matrix. Although the composite
character of these materials itself plays a crucial role, the question remains as
to why the nano-metre scale is so important.
The term Nano, a factor of 10-9
, has its origin in the Greek word nanos,
meaning dwarf. A nanostructure is an object of size between molecular and
microscopic structures. It is a product at the molecular scale. However,
nanoparticles are very tiny aggregations of atoms; they are bigger than most of
the molecules.
Generally, there are two processes to create nanoscale materials from
atoms and molecules. First is the “bottom-up” process that creates nanoscale
materials from atoms and molecules. The second process is the "top-down"
process that creates nanoscale materials from their macro-scale counterparts.
Nanostructured materials are used in several applications like catalysis,
electronics, separation technologies, sensors, information storage, drug
delivery systems, diagnostics, energy batteries, fuel cells, solar cells, etc. The
prospective of nanomaterials in biomedical and industrial applications for
human health and environment are now well established. Moreover, the
nanoclusters, nanoparticles, nanotubes, nanoporous materials, nanowires,
hybrid nanocomposites, etc., are used in every branch of science and
technology. Nanoscience is its interdisciplinary nature—its practice requires
researchers to cross the traditional boundaries between the experimental and
theoretical fields of chemistry and physics, materials science and engineering,
biology and medicine, to work together. Various research fields including
physics, chemists, material scientists, and engineers are involved in this
research.
Nanochemistry, the first step in nanotechnology, is a new branch of nanoscience that permits controlling chemical parameters in order to grow
nano-objects. Thus, it attracts tremendous attention in recent researches.
Preface ix
Scientists for the first time applied the principles of chemistry to the bottom-up
synthesis of nanomaterials.
The aim of a synthetic nanochemist is to design nanoscale building blocks
of desired shape, size, composition and surface structure. At the nanolevel, the
so-called quantum effects can be significant, fascinating and potentially
scientifically very rewarding innovative ways of carrying out chemical
reactions are possible.
The recent advances in the field of nanochemistry are discussed in several
literatures. The dependence of chemico-physical properties on the size of the
nanoparticles are also studied based on thermodynamics, electrochemistry,
optical spectra and magnetic properties. In this review, we will focus on the
applications of nanocompounds in various fields of science and technology.
The concept of creating both structural and functional multi-phase
nanocomposites with improved performance is currently under development in
a wide variety of metallic, ceramic, and polymeric matrices, although the
emphasis to date has been on polymeric systems.
Similarly, the filler particles can be organic or inorganic with a wide range
of material compositions and structures. The resulting composites generally
exhibit a number of enhanced properties, so that the material cannot easily be
classified as a structural or functional composite. The term reinforcement, as
opposed to plain filler, is equally frequently used for the nanoscale component,
without a clear distinction.
CARBON NANOTUBES (CNTS)
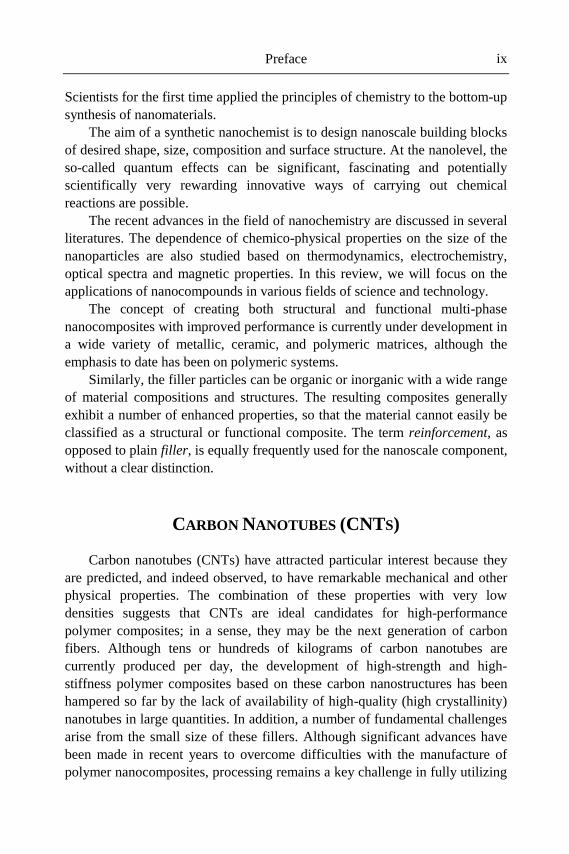
Carbon nanotubes (CNTs) have attracted particular interest because they
are predicted, and indeed observed, to have remarkable mechanical and other
physical properties. The combination of these properties with very low
densities suggests that CNTs are ideal candidates for high-performance
polymer composites; in a sense, they may be the next generation of carbon
fibers. Although tens or hundreds of kilograms of carbon nanotubes are
currently produced per day, the development of high-strength and high-
stiffness polymer composites based on these carbon nanostructures has been
hampered so far by the lack of availability of high-quality (high crystallinity)
nanotubes in large quantities. In addition, a number of fundamental challenges
arise from the small size of these fillers. Although significant advances have
been made in recent years to overcome difficulties with the manufacture of
polymer nanocomposites, processing remains a key challenge in fully utilizing
A. K. Haghi and G. E. Zaikov x
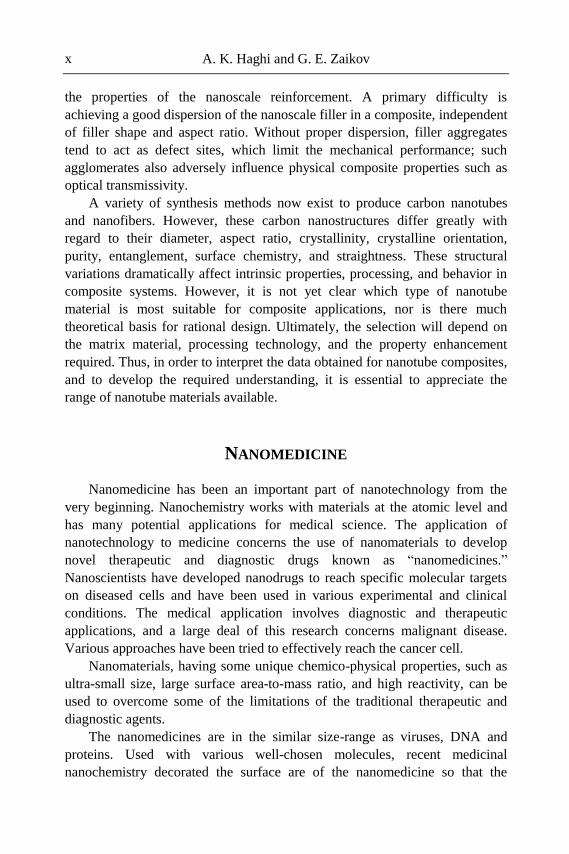
the properties of the nanoscale reinforcement. A primary difficulty is
achieving a good dispersion of the nanoscale filler in a composite, independent
of filler shape and aspect ratio. Without proper dispersion, filler aggregates
tend to act as defect sites, which limit the mechanical performance; such
agglomerates also adversely influence physical composite properties such as
optical transmissivity.
A variety of synthesis methods now exist to produce carbon nanotubes
and nanofibers. However, these carbon nanostructures differ greatly with
regard to their diameter, aspect ratio, crystallinity, crystalline orientation,
purity, entanglement, surface chemistry, and straightness. These structural
variations dramatically affect intrinsic properties, processing, and behavior in
composite systems. However, it is not yet clear which type of nanotube
material is most suitable for composite applications, nor is there much
theoretical basis for rational design. Ultimately, the selection will depend on
the matrix material, processing technology, and the property enhancement
required. Thus, in order to interpret the data obtained for nanotube composites,
and to develop the required understanding, it is essential to appreciate the
range of nanotube materials available.
NANOMEDICINE
Nanomedicine has been an important part of nanotechnology from the
very beginning. Nanochemistry works with materials at the atomic level and
has many potential applications for medical science. The application of
nanotechnology to medicine concerns the use of nanomaterials to develop
novel therapeutic and diagnostic drugs known as “nanomedicines.”
Nanoscientists have developed nanodrugs to reach specific molecular targets
on diseased cells and have been used in various experimental and clinical
conditions. The medical application involves diagnostic and therapeutic
applications, and a large deal of this research concerns malignant disease.
Various approaches have been tried to effectively reach the cancer cell.
Nanomaterials, having some unique chemico-physical properties, such as
ultra-small size, large surface area-to-mass ratio, and high reactivity, can be
used to overcome some of the limitations of the traditional therapeutic and
diagnostic agents.
The nanomedicines are in the similar size-range as viruses, DNA and
proteins. Used with various well-chosen molecules, recent medicinal
nanochemistry decorated the surface are of the nanomedicine so that the
Preface xi
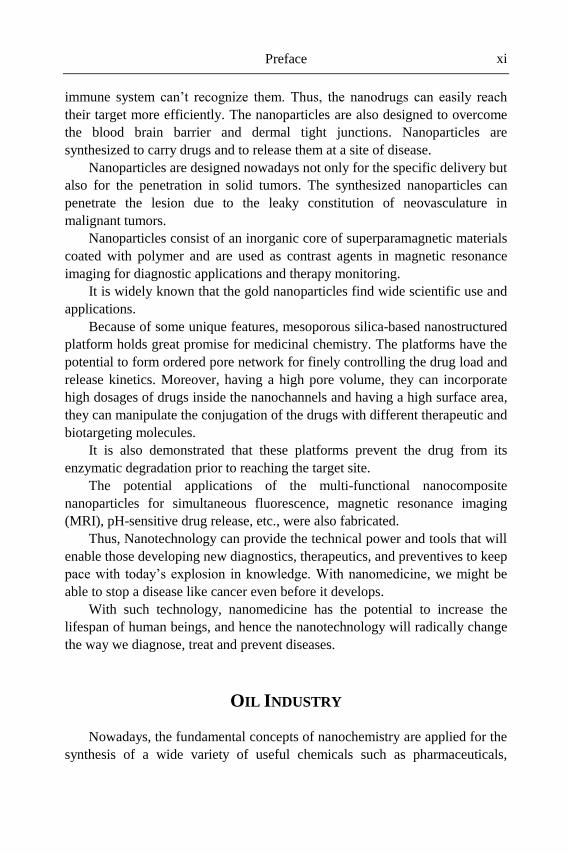
immune system can’t recognize them. Thus, the nanodrugs can easily reach
their target more efficiently. The nanoparticles are also designed to overcome
the blood brain barrier and dermal tight junctions. Nanoparticles are
synthesized to carry drugs and to release them at a site of disease.
Nanoparticles are designed nowadays not only for the specific delivery but
also for the penetration in solid tumors. The synthesized nanoparticles can
penetrate the lesion due to the leaky constitution of neovasculature in
malignant tumors.
Nanoparticles consist of an inorganic core of superparamagnetic materials
coated with polymer and are used as contrast agents in magnetic resonance
imaging for diagnostic applications and therapy monitoring.
It is widely known that the gold nanoparticles find wide scientific use and
applications.
Because of some unique features, mesoporous silica-based nanostructured
platform holds great promise for medicinal chemistry. The platforms have the
potential to form ordered pore network for finely controlling the drug load and
release kinetics. Moreover, having a high pore volume, they can incorporate
high dosages of drugs inside the nanochannels and having a high surface area,
they can manipulate the conjugation of the drugs with different therapeutic and
biotargeting molecules.
It is also demonstrated that these platforms prevent the drug from its
enzymatic degradation prior to reaching the target site.
The potential applications of the multi-functional nanocomposite
nanoparticles for simultaneous fluorescence, magnetic resonance imaging
(MRI), pH-sensitive drug release, etc., were also fabricated.
Thus, Nanotechnology can provide the technical power and tools that will
enable those developing new diagnostics, therapeutics, and preventives to keep
pace with today’s explosion in knowledge. With nanomedicine, we might be
able to stop a disease like cancer even before it develops.
With such technology, nanomedicine has the potential to increase the
lifespan of human beings, and hence the nanotechnology will radically change
the way we diagnose, treat and prevent diseases.
OIL INDUSTRY
Nowadays, the fundamental concepts of nanochemistry are applied for the
synthesis of a wide variety of useful chemicals such as pharmaceuticals,
A. K. Haghi and G. E. Zaikov xii
commercial polymers or catalysts having potential impact in the oil industry
[26].
NANOELECTRONICS
Nanotechnology is one of the most active research areas that encompass a
number of disciplines such as electronics, biomechanics and coatings
including civil engineering and construction materials.
The small size of nanoparticles gives these particles “unusual” structural
and optical properties with applications in catalysis, electro-optical devices
etc. Having remarkable electronic properties and many other unique
characteristics, carbon nanotubes attract both experimentalists and theorists to
study the properties of these materials. The usefulness of the single-walled
carbon nanotubes (SWNETs) in nanoscale electronics and lightweight
materials are now well established.
Because of their chemico-physical importance, the nanoparticles of
coinage metals are now integral part of the nanotechnology.
Currently, researchers have developed a nanoparticle ink composed of a
water-based solution mixed with a high concentration of silver nanoparticles
that could make flexible printed electronics. This printing method greatly
increases the complexity possible and limiting breakage and other
manufacturing problems.
To avoid the difficulty of depositing the printing materials in the molten
form, scientists introduced a system in which an ink-jet print head deposits a
nanoparticle colloid ink to print three-dimensional (3-D) metallic structures.
As the process of the ink-jet printing is noncontact, the nanomaterials are
added to the bulk layer-by-layer to form 3-D structures.
Current high-technology production processes based on nanotechnology
have developed a carbon nanotube-based crossbar memory called Nano-RAM.
The quantum dots can be used for the construction of lasers, which are
cheaper than the traditional semiconductor laser. The other benefit of quantum
dot laser is that it offers a higher beam quality than conventional laser diodes.
The effect magnetoresistance can be significantly amplified for nanosized
objects. The Giant Magneto-Resistance effect has led to a strong increase in
the data storage density of hard disks and made the gigabyte range possible.
Although quantum computing is still in its infancy, scientists are now
engaged in preparing novel quantum computers, which enable the use of fast
Preface xiii
quantum algorithms. The Quantum computer with quantum bit memory space
(Qubit) is capable of doing several computations at the same time.
ENVIRONMENTAL MONITORING
Nanotechnology also has the potential to rectify the effects causing the
environmental pollution by creating materials and products that will not only
directly advance our ability to detect, monitor, and clean-up environmental
contaminants but also help us avoid the environmental pollution.
It is demonstrated that nanomaterials such as silica-titania nanocomposites
are useful to remove elemental mercury from vapors. It is also demonstrated
by several scientists that nanostructured silica can sorb other metals, such as
lead and cadmium generated in combustion environments.
The maturation of nanotechnology has revealed it to be a unique and
distinct discipline rather than a specialization within a larger field. Its textbook
cannot afford to be a chemistry, physics, or engineering text focused on nano.
It must be an integrated, multi-disciplinary, and specifically nanotextbook.
This book surveys the field’s broad landscape, exploring the physical basics
such as nanorheology, nanofluidics, and nanomechanics as well as industrial
concerns such as manufacturing, reliability, and safety. The authors then
explore the vast range of nanomaterials and systematically outline devices and
applications in various industrial sectors.
The book then presents the tools of nanotechnology that can build, image,
and manipulate nanostructures to build materials and devices.
This book bridges the gap between detailed technical publications that are
beyond the grasp of non-specialists and popular science books, which may be
more science fiction than fact. It provides a fascinating, scientifically sound
treatment, accessible to engineers and scientists outside the field and even to
students at the undergraduate level. The book concludes with a look at some
cutting-edge applications and prophecies for the future.
This book builds a solid background in characterization and fabrication
methods, while integrating the physics, chemistry, and biology facets. The
book focuses on applications and examining engineering aspects.
A. K. Haghi
University of Guilan, Iran
G. E. Zaikov
Russian Academy of Sciences

In: Advanced Nanotube and Nanofiber Materials ISBN: 978-1-62081-170-2
Editors: A. K. Haghi and G. E. Zaikov © 2012 Nova Science Publishers, Inc.
Chapter 1
CARBON NANOTUBES
A. K. Haghi* University of Guilan, Iran
1.1. INTRODUCTION
In 1991, Japanese researchers studied sediment formed at the cathode
during the spray of graphite in an electric arc. Their attention was attracted by
the unusual structure of the sediment consisting of microscopic fibers and
filaments. Measurements made with an electron microscope showed that the
diameter of these filaments do not exceed a few nanometers and a length of
from one to several microns.
Having managed to cut a thin tube along the longitudinal axis, the
researchers found that it consists of one or more layers, each of which
represents a hexagonal grid of graphite, which is based on hexagon with
vertices located at the corners of the carbon atoms. In all cases, the distance
between the layers is equal to 0.34 nm, which is the same as that between the
layers in crystalline graphite.
Typically, the upper ends of tubes are closed by multi-layer hemispherical
caps; each layer is composed of hexagons and pentagons, reminiscent of the
structure of half a fullerene molecule.
The extended structure consisting of rolled hexagonal grids with carbon
atoms at the nodes are called nanotubes.
A. K. Haghi 2
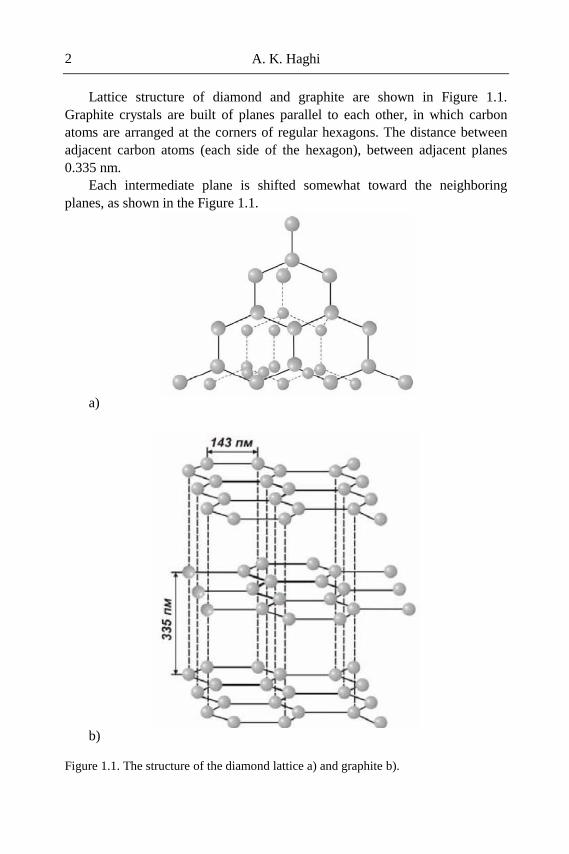
Lattice structure of diamond and graphite are shown in Figure 1.1.
Graphite crystals are built of planes parallel to each other, in which carbon
atoms are arranged at the corners of regular hexagons. The distance between
adjacent carbon atoms (each side of the hexagon), between adjacent planes
0.335 nm.
Each intermediate plane is shifted somewhat toward the neighboring
planes, as shown in the Figure 1.1.
a)
b)
Figure 1.1. The structure of the diamond lattice a) and graphite b).
Carbon Nanotubes 3
The elementary cell of the diamond crystal is a tetrahedron in the center
and four vertices of which are carbon atoms. Atoms located at the vertices of a
tetrahedron form a new center of a tetrahedron, and thus, are also surrounded
by four atoms each, etc. All the carbon atoms in the crystal lattice are located
at equal distance (0.154 nm) from each other.
Nanotubes rolled into a cylinder (hollow tube) graphite plane, which is
lined with regular hexagons with carbon atoms at the vertices of a diameter of
several nanometers (Figure 1.2). Nanotubes can consist of one layer of atoms
(single-wall nanotubes- SWNT) and represent a number of "nested" into one
another layer pipes (multi-walled nanotubes – MWNT).
Nanostructures can be collected not only from individual atoms or single
molecules but the molecular blocks. Such blocks or elements to create
nanostructures are graphene, carbon nanotubes and fullerenes.
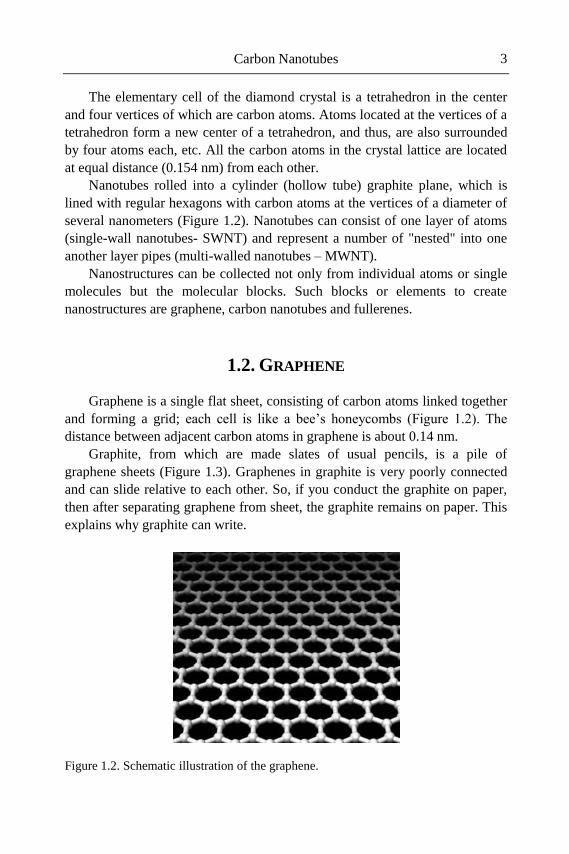
1.2. GRAPHENE
Graphene is a single flat sheet, consisting of carbon atoms linked together
and forming a grid; each cell is like a bee’s honeycombs (Figure 1.2). The
distance between adjacent carbon atoms in graphene is about 0.14 nm.
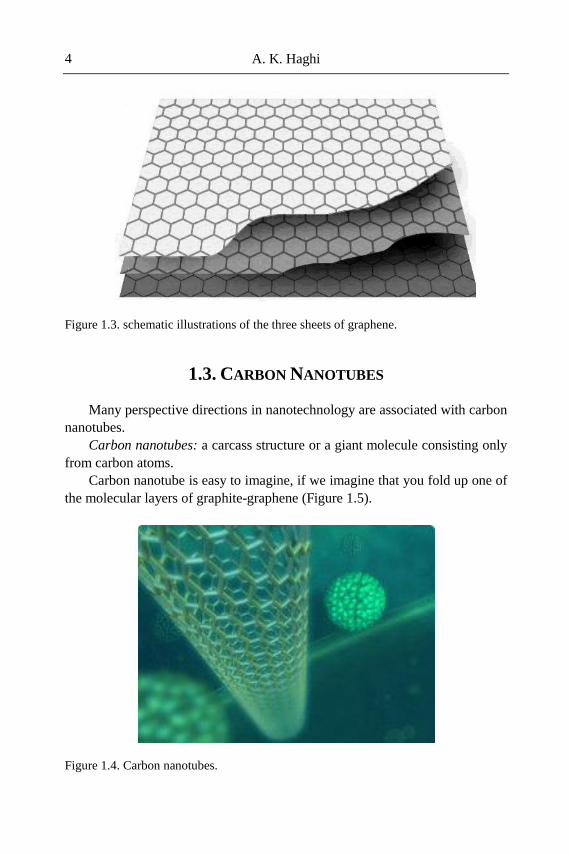
Graphite, from which are made slates of usual pencils, is a pile of
graphene sheets (Figure 1.3). Graphenes in graphite is very poorly connected
and can slide relative to each other. So, if you conduct the graphite on paper,
then after separating graphene from sheet, the graphite remains on paper. This
explains why graphite can write.
Figure 1.2. Schematic illustration of the graphene.
A. K. Haghi 4
Figure 1.3. schematic illustrations of the three sheets of graphene.
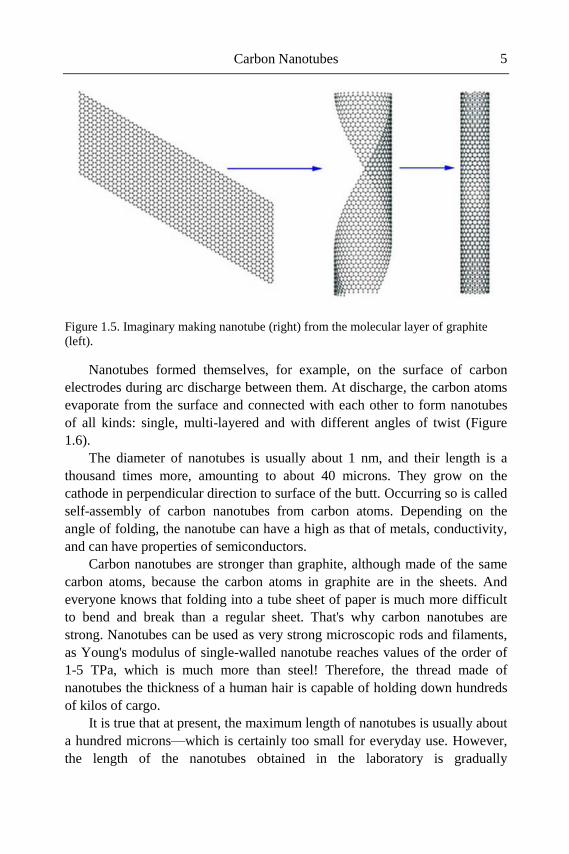
1.3. CARBON NANOTUBES
Many perspective directions in nanotechnology are associated with carbon
nanotubes.
Carbon nanotubes: a carcass structure or a giant molecule consisting only
from carbon atoms.
Carbon nanotube is easy to imagine, if we imagine that you fold up one of
the molecular layers of graphite-graphene (Figure 1.5).
Figure 1.4. Carbon nanotubes.
Carbon Nanotubes 5
Figure 1.5. Imaginary making nanotube (right) from the molecular layer of graphite
(left).
Nanotubes formed themselves, for example, on the surface of carbon
electrodes during arc discharge between them. At discharge, the carbon atoms
evaporate from the surface and connected with each other to form nanotubes
of all kinds: single, multi-layered and with different angles of twist (Figure
1.6).
The diameter of nanotubes is usually about 1 nm, and their length is a
thousand times more, amounting to about 40 microns. They grow on the
cathode in perpendicular direction to surface of the butt. Occurring so is called
self-assembly of carbon nanotubes from carbon atoms. Depending on the
angle of folding, the nanotube can have a high as that of metals, conductivity,
and can have properties of semiconductors.
Carbon nanotubes are stronger than graphite, although made of the same
carbon atoms, because the carbon atoms in graphite are in the sheets. And
everyone knows that folding into a tube sheet of paper is much more difficult
to bend and break than a regular sheet. That's why carbon nanotubes are
strong. Nanotubes can be used as very strong microscopic rods and filaments,
as Young's modulus of single-walled nanotube reaches values of the order of
1-5 TPa, which is much more than steel! Therefore, the thread made of
nanotubes the thickness of a human hair is capable of holding down hundreds
of kilos of cargo.
It is true that at present, the maximum length of nanotubes is usually about
a hundred microns—which is certainly too small for everyday use. However,
the length of the nanotubes obtained in the laboratory is gradually
A. K. Haghi 6
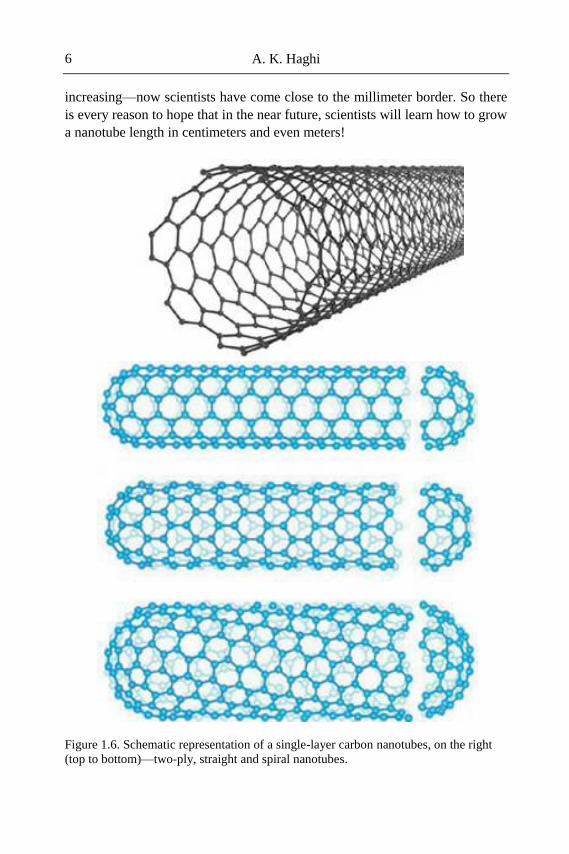
increasing—now scientists have come close to the millimeter border. So there
is every reason to hope that in the near future, scientists will learn how to grow
a nanotube length in centimeters and even meters!
Figure 1.6. Schematic representation of a single-layer carbon nanotubes, on the right
(top to bottom)—two-ply, straight and spiral nanotubes.
Carbon Nanotubes 7
1.4. FULLERENES
The carbon atoms, evaporated from a heated graphite surface, connecting
with each other, can form not only of the nanotube, but also other molecules,
which are closed convex polyhedra, for example, in the form of a sphere or
ellipsoid. In these molecules, the carbon atoms located at the vertices of
regular hexagons and pentagons that make up the surface of a sphere or
ellipsoid.
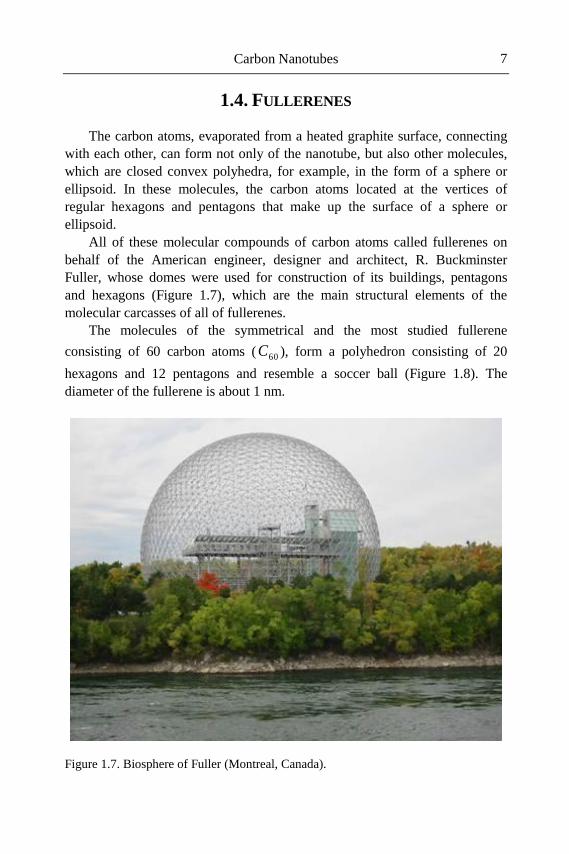
All of these molecular compounds of carbon atoms called fullerenes on
behalf of the American engineer, designer and architect, R. Buckminster
Fuller, whose domes were used for construction of its buildings, pentagons
and hexagons (Figure 1.7), which are the main structural elements of the
molecular carcasses of all of fullerenes.
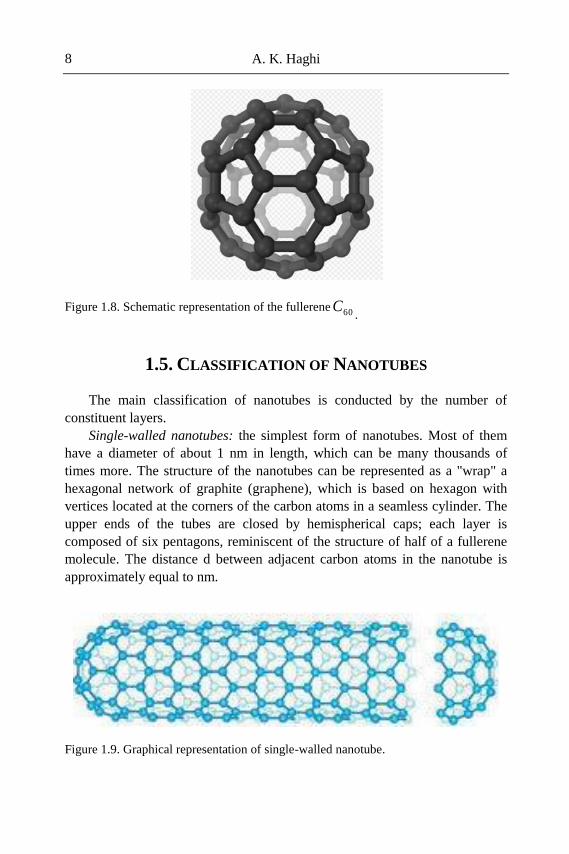
The molecules of the symmetrical and the most studied fullerene
consisting of 60 carbon atoms ( ), form a polyhedron consisting of 20
hexagons and 12 pentagons and resemble a soccer ball (Figure 1.8). The
diameter of the fullerene is about 1 nm.
Figure 1.7. Biosphere of Fuller (Montreal, Canada).
60C
A. K. Haghi 8
Figure 1.8. Schematic representation of the fullerene.
1.5. CLASSIFICATION OF NANOTUBES
The main classification of nanotubes is conducted by the number of
constituent layers.
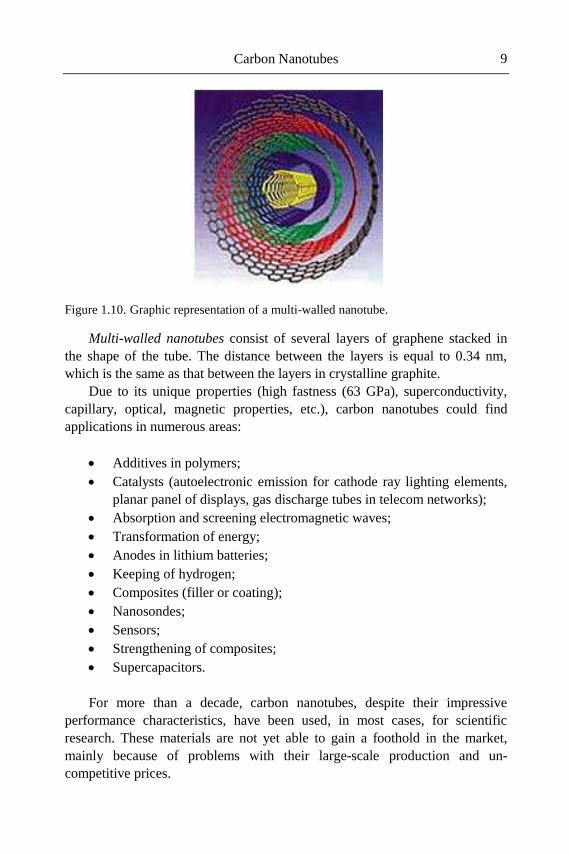
Single-walled nanotubes: the simplest form of nanotubes. Most of them
have a diameter of about 1 nm in length, which can be many thousands of
times more. The structure of the nanotubes can be represented as a "wrap" a
hexagonal network of graphite (graphene), which is based on hexagon with
vertices located at the corners of the carbon atoms in a seamless cylinder. The
upper ends of the tubes are closed by hemispherical caps; each layer is
composed of six pentagons, reminiscent of the structure of half of a fullerene
molecule. The distance d between adjacent carbon atoms in the nanotube is
approximately equal to nm.
Figure 1.9. Graphical representation of single-walled nanotube.
60C
Carbon Nanotubes 9
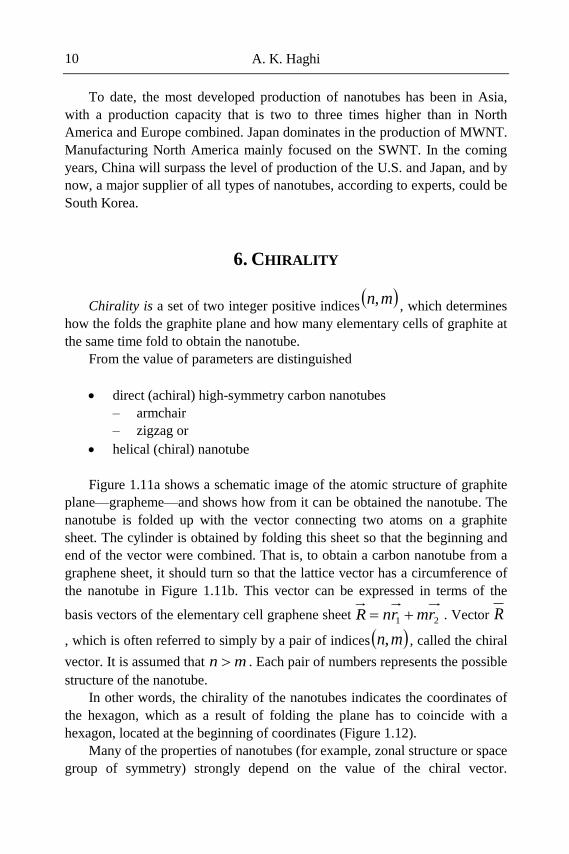
Figure 1.10. Graphic representation of a multi-walled nanotube.
Multi-walled nanotubes consist of several layers of graphene stacked in
the shape of the tube. The distance between the layers is equal to 0.34 nm,
which is the same as that between the layers in crystalline graphite.
Due to its unique properties (high fastness (63 GPa), superconductivity,
capillary, optical, magnetic properties, etc.), carbon nanotubes could find
applications in numerous areas:
Additives in polymers;
Catalysts (autoelectronic emission for cathode ray lighting elements,
planar panel of displays, gas discharge tubes in telecom networks);
Absorption and screening electromagnetic waves;
Transformation of energy;
Anodes in lithium batteries;
Keeping of hydrogen;
Composites (filler or coating);
Nanosondes;
Sensors;
Strengthening of composites;
Supercapacitors.
For more than a decade, carbon nanotubes, despite their impressive
performance characteristics, have been used, in most cases, for scientific
research. These materials are not yet able to gain a foothold in the market,
mainly because of problems with their large-scale production and un-
competitive prices.
A. K. Haghi 10
To date, the most developed production of nanotubes has been in Asia,
with a production capacity that is two to three times higher than in North
America and Europe combined. Japan dominates in the production of MWNT.
Manufacturing North America mainly focused on the SWNT. In the coming
years, China will surpass the level of production of the U.S. and Japan, and by
now, a major supplier of all types of nanotubes, according to experts, could be
South Korea.
6. CHIRALITY
Chirality is a set of two integer positive indices , which determines
how the folds the graphite plane and how many elementary cells of graphite at
the same time fold to obtain the nanotube.
From the value of parameters are distinguished
direct (achiral) high-symmetry carbon nanotubes
– armchair
– zigzag or
helical (chiral) nanotube
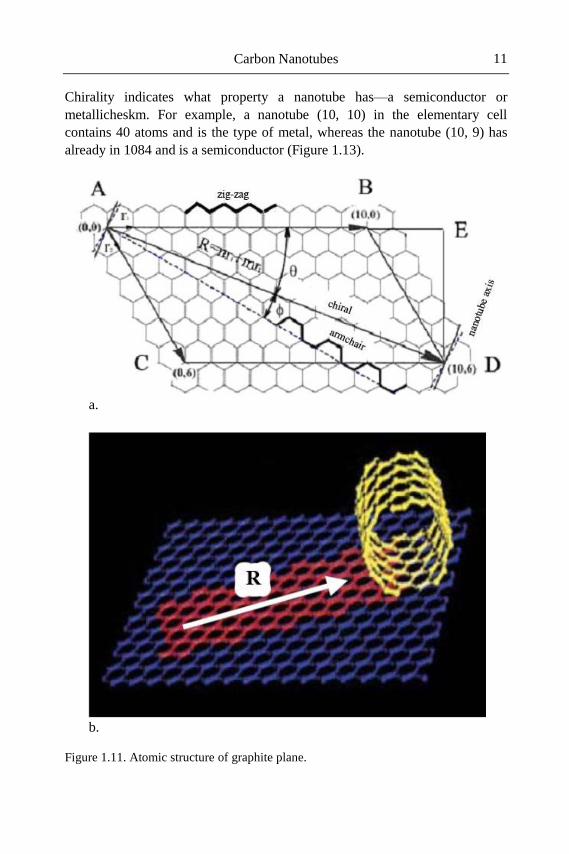
Figure 1.11a shows a schematic image of the atomic structure of graphite
plane—grapheme—and shows how from it can be obtained the nanotube. The
nanotube is folded up with the vector connecting two atoms on a graphite
sheet. The cylinder is obtained by folding this sheet so that the beginning and
end of the vector were combined. That is, to obtain a carbon nanotube from a
graphene sheet, it should turn so that the lattice vector has a circumference of
the nanotube in Figure 1.11b. This vector can be expressed in terms of the
basis vectors of the elementary cell graphene sheet . Vector
, which is often referred to simply by a pair of indices , called the chiral
vector. It is assumed that . Each pair of numbers represents the possible
structure of the nanotube.
In other words, the chirality of the nanotubes indicates the coordinates of
the hexagon, which as a result of folding the plane has to coincide with a
hexagon, located at the beginning of coordinates (Figure 1.12).
Many of the properties of nanotubes (for example, zonal structure or space
group of symmetry) strongly depend on the value of the chiral vector.
mn,
21 rmrnR R
mn,
mn
Carbon Nanotubes 11
Chirality indicates what property a nanotube has—a semiconductor or
metallicheskm. For example, a nanotube (10, 10) in the elementary cell
contains 40 atoms and is the type of metal, whereas the nanotube (10, 9) has
already in 1084 and is a semiconductor (Figure 1.13).
a.
b.
Figure 1.11. Atomic structure of graphite plane.
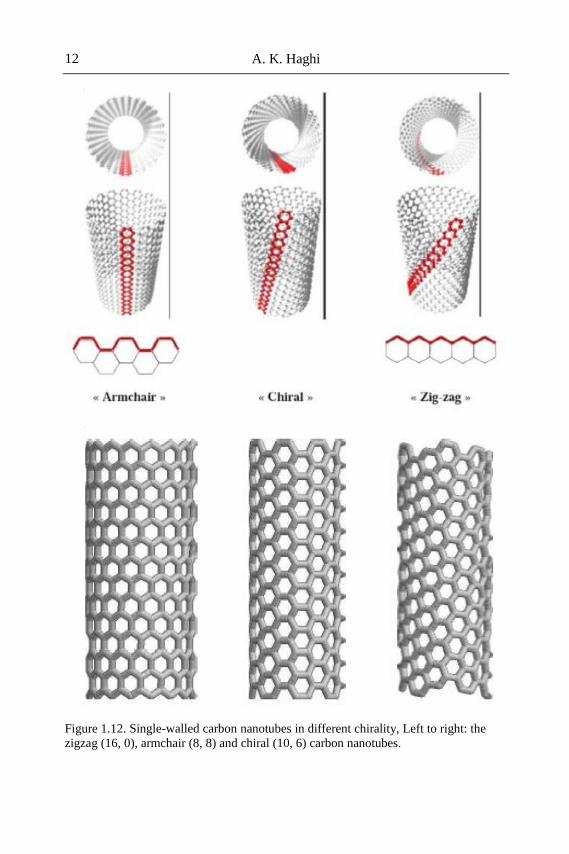
A. K. Haghi 12
Figure 1.12. Single-walled carbon nanotubes in different chirality, Left to right: the
zigzag (16, 0), armchair (8, 8) and chiral (10, 6) carbon nanotubes.
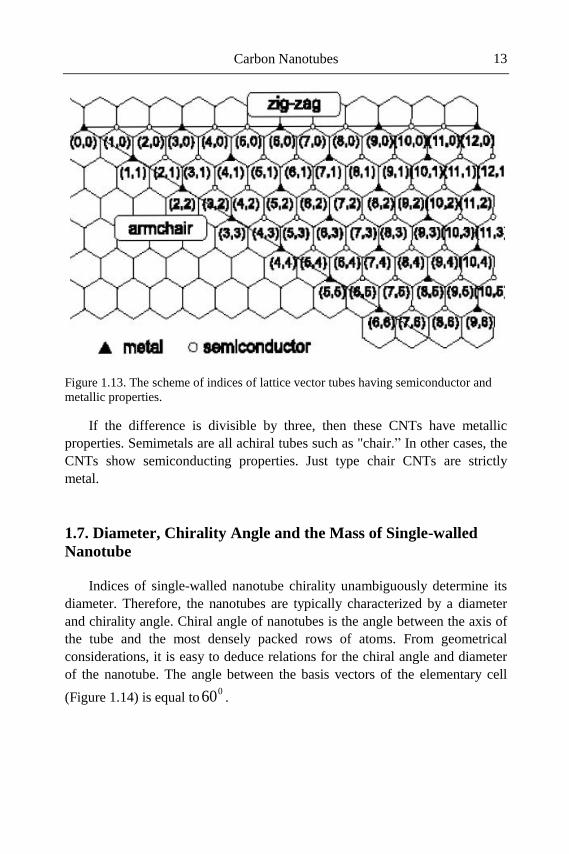
Carbon Nanotubes 13
Figure 1.13. The scheme of indices of lattice vector tubes having semiconductor and
metallic properties.
If the difference is divisible by three, then these CNTs have metallic
properties. Semimetals are all achiral tubes such as "chair.” In other cases, the
CNTs show semiconducting properties. Just type chair CNTs are strictly
metal.
1.7. Diameter, Chirality Angle and the Mass of Single-walled
Nanotube
Indices of single-walled nanotube chirality unambiguously determine its
diameter. Therefore, the nanotubes are typically characterized by a diameter
and chirality angle. Chiral angle of nanotubes is the angle between the axis of
the tube and the most densely packed rows of atoms. From geometrical
considerations, it is easy to deduce relations for the chiral angle and diameter
of the nanotube. The angle between the basis vectors of the elementary cell
(Figure 1.14) is equal to .
060
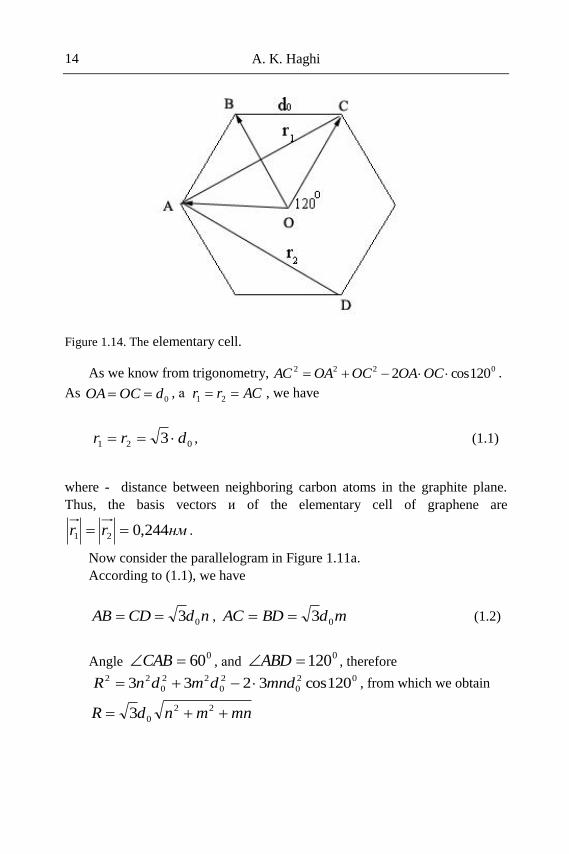
A. K. Haghi 14
Figure 1.14. The elementary cell.
As we know from trigonometry, .
As , а , we have
, (1.1)
where - distance between neighboring carbon atoms in the graphite plane.
Thus, the basis vectors и of the elementary cell of graphene are
.
Now consider the parallelogram in Figure 1.11a.
According to (1.1), we have
, (1.2)
Angle , аnd , therefore
, from which we obtain
0222 120cos2 OCOAOCOAAC
0dOCOA ACrr 21
021 3 drr
нмrr 244,021
ndCDAB 03 mdBDAC 03
060CAB 0120ABD02
0
2
0
22
0
22 120cos3233 mnddmdnR
mnmndR 22
03
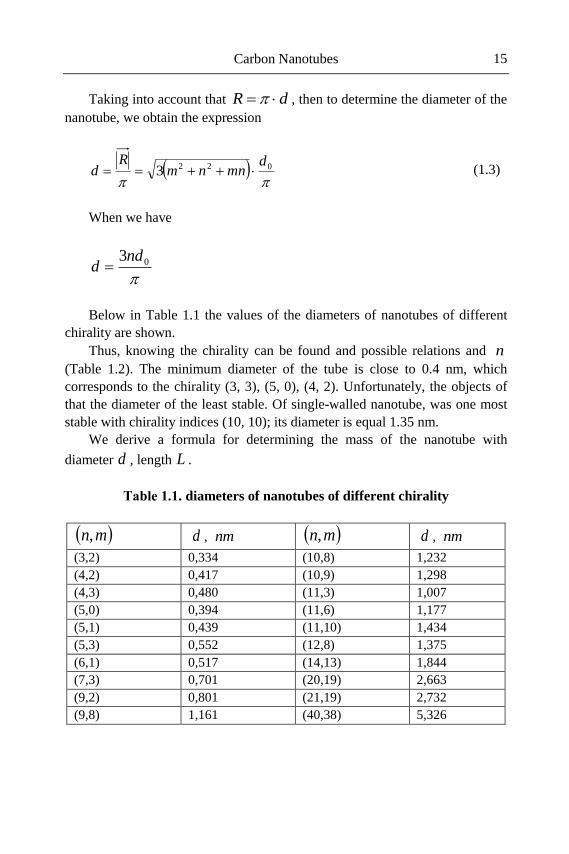
Carbon Nanotubes 15
Taking into account that , then to determine the diameter of the
nanotube, we obtain the expression
(1.3)
When we have
Below in Table 1.1 the values of the diameters of nanotubes of different
chirality are shown.
Thus, knowing the chirality can be found and possible relations and
(Table 1.2). The minimum diameter of the tube is close to 0.4 nm, which
corresponds to the chirality (3, 3), (5, 0), (4, 2). Unfortunately, the objects of
that the diameter of the least stable. Of single-walled nanotube, was one most
stable with chirality indices (10, 10); its diameter is equal 1.35 nm.
We derive a formula for determining the mass of the nanotube with
diameter , length .
Table 1.1. diameters of nanotubes of different chirality
,
,
(3,2) 0,334 (10,8) 1,232
(4,2) 0,417 (10,9) 1,298
(4,3) 0,480 (11,3) 1,007
(5,0) 0,394 (11,6) 1,177
(5,1) 0,439 (11,10) 1,434
(5,3) 0,552 (12,8) 1,375
(6,1) 0,517 (14,13) 1,844
(7,3) 0,701 (20,19) 2,663
(9,2) 0,801 (21,19) 2,732
(9,8) 1,161 (40,38) 5,326
dR
0223d
mnnmR
d
03nd
d
n
d L
mn, d nm mn, d nm
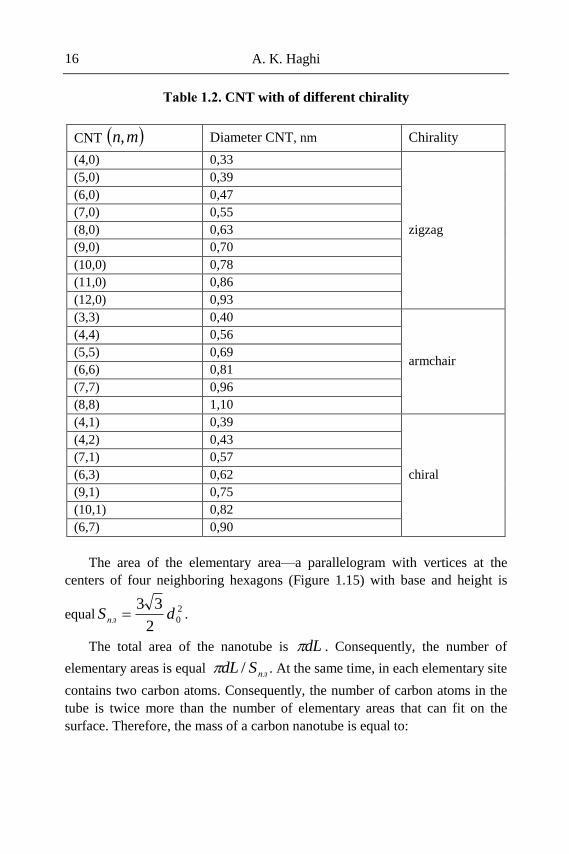
A. K. Haghi 16
Table 1.2. CNT with of different chirality
CNT Diameter CNT, nm Chirality
(4,0) 0,33
zigzag
(5,0) 0,39
(6,0) 0,47
(7,0) 0,55
(8,0) 0,63
(9,0) 0,70
(10,0) 0,78
(11,0) 0,86
(12,0) 0,93
(3,3) 0,40
armchair
(4,4) 0,56
(5,5) 0,69
(6,6) 0,81
(7,7) 0,96
(8,8) 1,10
(4,1) 0,39
chiral
(4,2) 0,43
(7,1) 0,57
(6,3) 0,62
(9,1) 0,75
(10,1) 0,82
(6,7) 0,90
The area of the elementary area—a parallelogram with vertices at the
centers of four neighboring hexagons (Figure 1.15) with base and height is
equal .
The total area of the nanotube is . Consequently, the number of
elementary areas is equal . At the same time, in each elementary site
contains two carbon atoms. Consequently, the number of carbon atoms in the
tube is twice more than the number of elementary areas that can fit on the
surface. Therefore, the mass of a carbon nanotube is equal to:
mn,
2
02
33dSпл
dL
плSdL /
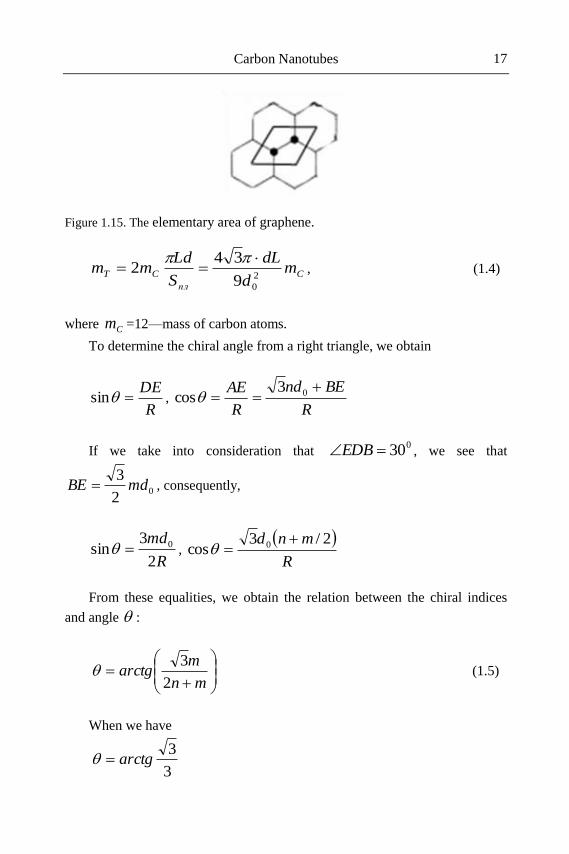
Carbon Nanotubes 17
Figure 1.15. The elementary area of graphene.
, (1.4)
where =12—mass of carbon atoms.
To determine the chiral angle from a right triangle, we obtain
,
If we take into consideration that , we see that
, consequently,
,
From these equalities, we obtain the relation between the chiral indices
and angle :
(1.5)
When we have
C
пл
CT md
dL
S
Ldmm
2
09
342
Cm
R
DEsin
R
BEnd
R
AE 03
cos
030EDB
02
3mdBE
R
md
2
3sin 0
R
mnd 2/3cos 0
mn
marctg
2
3
3
3arctg
A. K. Haghi 18
1.8. OUTLOOKS
Although the terms nanomaterial and nanocomposite represent new and
exciting fields in materials science, such materials have actually been used for
centuries and have always existed in nature. However, it is only recently that
the means to characterize and control structure at the nanoscale have
stimulated rational investigation and exploitation. A nanocomposite is defined
as a composite material where at least one of the dimensions of one of its
constituents is on the nanometre-size scale. The term usually also implies the
combination of two (or more) distinct materials, such as a ceramic and a
polymer, rather than spontaneously phase-segregated structures. The challenge
and interest in developing nanocomposites is to find ways to create
macroscopic components that benefit from the unique physical and mechanical
properties of very small objects within them. Natural materials such as bone,
tooth, and nacre are very good examples of the successful implementation of
this concept, offering excellent mechanical properties compared to those of
their constituent materials. Such composites actually exhibit beautifully
organized levels of hierarchical structure from macroscopic to microscopic
length scales and provide a powerful motivation for improving our processing
control.
Currently, we are striving to understand the behaviour of just the smallest
building blocks in such materials, which are the natural versions of
nanocomposites. Significantly, two contrasting phases are often combined: a
hard nanoscale reinforcement (such as hydroxyapatite or calcium carbonate) is
embedded in a soft, usually protein-based, matrix.
Although the composite character of these materials itself plays a crucial
role, the question remains as to why the nanometre scale is so important. From
a simple mechanical point of view, the situation in such biocomposites is quite
familiar: the matrix transfers the load via shear to the nanoscale reinforcement.
A large length-to-diameter (aspect) ratio of the mineral reinforcement
compensates for the low modulus of the soft protein matrix, leading to an
optimised stiffness of the composite. The fracture toughness of such
biocomposites, on the other hand, hinges on the ultimate tensile strength of the
reinforcement. Crucially, the use of a nanomaterial allows access to the
maximum theoretical strength of the material, since mechanical properties
become increasingly insensitive to flaws at the nanoscale. This observation is
an extension of the classic approach to strong materials, namely to reduce the
dimensions until critical flaws are excluded. At the nanoscale, highly
crystalline reinforcements are used in which all but the smallest atomistic
Carbon Nanotubes 19
defects can be eliminated. It is clear that a high aspect ratio must be
maintained in order to ensure suitable stress transfer. This general concept of
exploiting the inherent properties of nanoscaled materials is not limited to the
mechanical properties of a material, since a wide range of physical properties
also depend on defect concentrations. In addition, the small size scale can
generate inherently novel effects through, for example, quantum confinement
or through the dramatic increase in interfacial area. The concept of creating
both structural and functional multi-phase nanocomposites with improved
performance is currently under development in a wide variety of metallic,
ceramic, and polymeric matrices, although the emphasis to date has been on
polymeric systems. Similarly, the filler particles can be organic or inorganic
with a wide range of material compositions and structures.
The resulting composites generally exhibit a number of enhanced
properties, so that the material cannot easily be classified as a structural or
functional composite. The term reinforcement, as opposed to plain filler, is
equally frequently used for the nanoscale component, without a clear
distinction. Carbon nanotubes (CNTs) have attracted particular interest
because they are predicted, and indeed observed, to have remarkable
mechanical and other physical properties. The combination of these properties
with very low densities suggests that CNTs are ideal candidates for high-
performance polymer composites; in a sense, they may be the next generation
of carbon fibres. Although tens or hundreds of kilograms of carbon nanotubes
are currently produced per day, the development of high-strength and high-
stiffness polymer composites based on these carbon nanostructures has been
hampered so far by the lack of availability of high-quality (high-crystallinity)
nanotubes in large quantities. In addition, a number of fundamental challenges
arise from the small size of these fillers. Although significant advances have
been made in recent years to overcome difficulties with the manufacture of
polymer nanocomposites, processing remains a key challenge in fully utilizing
the properties of the nanoscale reinforcement. A primary difficulty is
achieving a good dispersion of the nanoscale filler in a composite, independent
of filler shape and aspect ratio. Without proper dispersion, filler aggregates
tend to act as defect sites, which limit the mechanical performance; such
agglomerates also adversely influence physical composite properties such as
optical transmissivity. When dispersing small particles in a low viscosity
medium, diffusion processes and particle-particle and particle-matrix inter-
actions play an increasingly important role as the diameter drops below 1 μm.
It is not only the absolute size but rather the specific surface area of the filler,
and the resulting interfacial volumes, which significantly influence the
A. K. Haghi 20
dispersion process. These regions can have distinctly different properties from
the bulk polymer and can represent a substantial volume fraction of the matrix
for nanoparticles with surface areas of the order of hundreds of m2/g. The
actual interphase volume depends on the dispersion and distribution of the
filler particles, as well as their surface area. In traditional fibre composites, the
interfacial region is defined as the volume in which the properties deviate from
those of the bulk matrix or filler.
REFERENCES
[1] M. Ziabari, V. Mottaghitalab, S. T. McGovern and A. K. Haghi, Chim.
Phys. Lett., 25, 3071 (2008).
[2] M. Ziabari, V. Mottaghitalab, S. T. McGovern and A. K. Haghi,
Nanoscale Research Letter, 2, 297(2007).
[3] M. Ziabari, V. Mottaghitalab and A. K. Haghi, Korean J. Chem. Eng.,
25, 919 (2008).
[4] M. Ziabari, V. Mottaghitalab and A. K. Haghi, Korean J. Chem. Eng.,
25, 923 (2008).
[5] M. Ziabari, V. Mottaghitalab and A. K. Haghi, Korean J. Chem. Eng.,
25, 905 (2008).
[6] A. K. Haghi and M. Akbari, Physica Status Solidi, 204, 1830 (2007).
[7] M. Kanafchian, M. Valizadeh and A.K. Haghi, Korean J. Chem. Eng.,
28, 428 (2011).
[8] M. Kanafchian, M. Valizadeh and A.K. Haghi, Korean J. Chem. Eng.,
28, 763 (2011).
[9] M. Kanafchian, M. Valizadeh and A.K. Haghi, Korean J. Chem. Eng.,
28, 751 (2011).
[10] M. Kanafchian, M. Valizadeh and A.K. Haghi, Korean J. Chem. Eng.,
28, 445(2011).
[11] A. Afzali, V. Mottaghitalab, M. Motlagh, A.K. Haghi, Korean J. Chem.
Eng., 27, 1145(2010).
[12] Z. Moridi, V. Mottaghitalab, A.K. Haghi, Korean J. Chem. Eng., 28,
445(2011).
[13] A.K. Haghi, Cellulose Chem. Technol., 44, 343 (2010)
[14] Z. Moridi, V. Mottaghitalab, A.K. Haghi, Cellulose Chem. Technol., 45,
549 (2011)
In: Advanced Nanotube and Nanofiber Materials ISBN: 978-1-62081-170-2
Editors: A. K. Haghi and G. E. Zaikov © 2012 Nova Science Publishers, Inc.
Chapter 2
RECENT PROGRESS ON CARBON
NANOTUBE/NANOFIBER COMPOSITES
A. K. Haghi*
University of Guilan, Iran
1. INTRODUCTION
Recently, the words “nanobiocomposites” or “biopolymer
nanocomposites” is most frequently observed in environmentally friendly
research studies. The synthetic polymers have been widely used in various
applications of nanocomposites. However, they become a major source of
waste after use due to their poor biodegradability. On the other hand, most of
the synthetic polymers are without biocompatibility in vivo and vitro
environments. Hence, scientists were interested in biopolymers as
biodegradable materials [1]. Later, several groups of natural biopolymers such
as polysaccharide, proteins, and nucleic acids were used in various
applications [2]. Nevertheless, the use of these materials has been limited due
to relatively poor mechanical properties. Therefore, researcher efforts have
been made to improve the properties of biopolymers as a matrix by using of
reinforcement [3].
Chitosan (CS) is a polysaccharide biopolymer that has been widely used
as a matrix in nanobiocomposites. Chitosan represents high biocompatibility
A. K. Haghi 22
and biodegradibility properties, although these biopolymers have an essential
requirement to additional material with high mechanical properties [4].
Following discovery of carbon nanotube, results of characterization
represented unique electrical and mechanical properties. Thereby, many
research studies have focused on improving the physical properties of
biopolymer nanocomposites by using the fundamental behavior of carbon
nanotubes [5].
It is the aim of this review to summarize recent advances in the production
of carbon nanotubes/chitosan nanocomposites by several methods.
Specifically, we will discuss our recent work in preparing CNTs/CS nanofiber
composites by using of electrospinning method.
2. BIOPOLYMERS
Biomaterial has been defined as biocompatibility materials with the living
systems. The biocompatibility implies the chemical, physical (surface
morphology), and biological suitability of an implant surface to the host
tissues. S. Ramakrishna et al. reviewed various biomaterials and their
applications over the last 30 years. They represented applications of
biopolymers and their biocomposites in medical applications [6]. These
materials can classify to natural and synthetic biopolymers. Synthetic
biopolymers have been provided cheaper with high mechanical properties. The
low biocompatibility of synthetic biopolymers compared with natural
biopolymers such as polysaccharides, lipids, and proteins have led to great
attention being paid to the natural biopolymers. On the other hand, the natural
biopolymers usually have weak mechanical properties. Therefore, many
efforts have been done for improving their properties by blending some filler
[7].
Among the natural biopolymers, polysaccharides seem to be the most
promising materials in various biomedical fields. These biopolymers have
various resources, including animal origin, plant origin, algal origin, and
microbial origin. Among various polysaccharides, chitosan is the most usual
due to its chemical structure [8].
Recent Progress on Carbon Nanotube/Nanofiber Composites 23
2.1. Chitosan
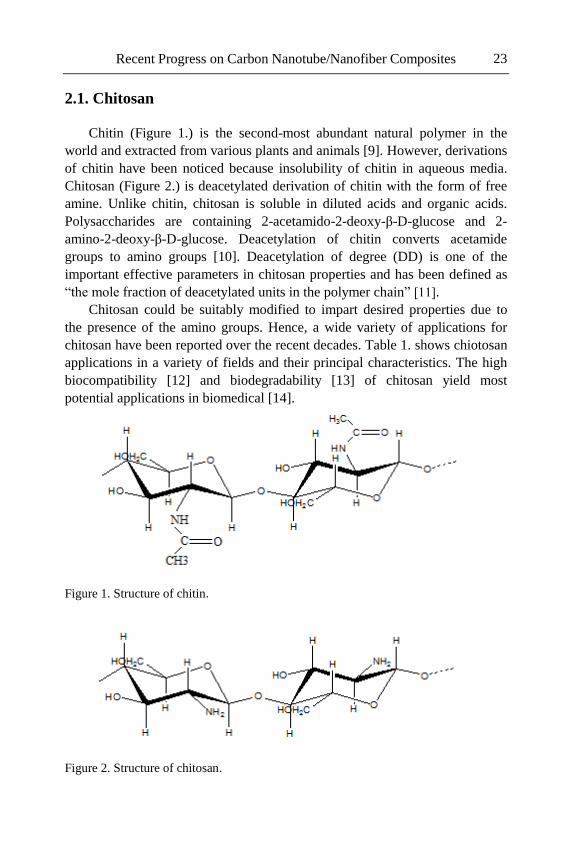
Chitin (Figure 1.) is the second-most abundant natural polymer in the
world and extracted from various plants and animals [9]. However, derivations
of chitin have been noticed because insolubility of chitin in aqueous media.
Chitosan (Figure 2.) is deacetylated derivation of chitin with the form of free
amine. Unlike chitin, chitosan is soluble in diluted acids and organic acids.
Polysaccharides are containing 2-acetamido-2-deoxy-β-D-glucose and 2-
amino-2-deoxy-β-D-glucose. Deacetylation of chitin converts acetamide
groups to amino groups [10]. Deacetylation of degree (DD) is one of the
important effective parameters in chitosan properties and has been defined as
“the mole fraction of deacetylated units in the polymer chain” [11] .
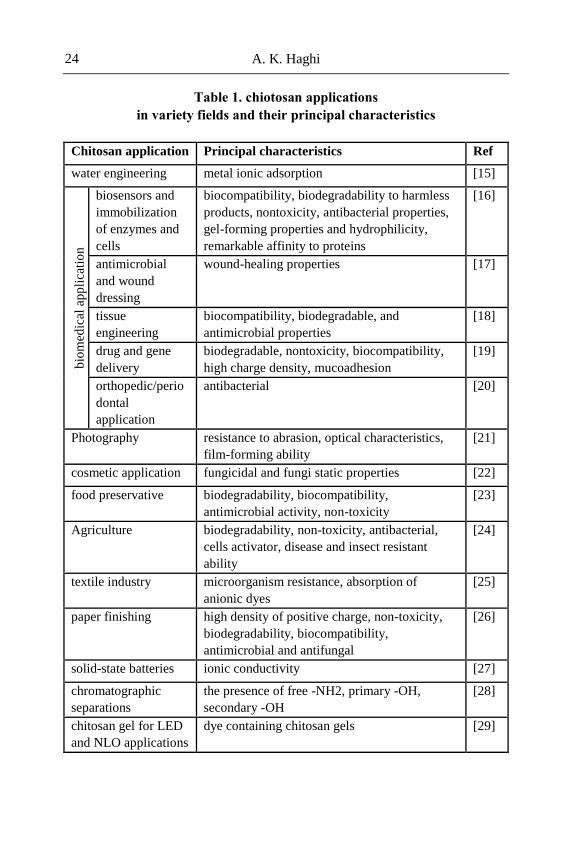
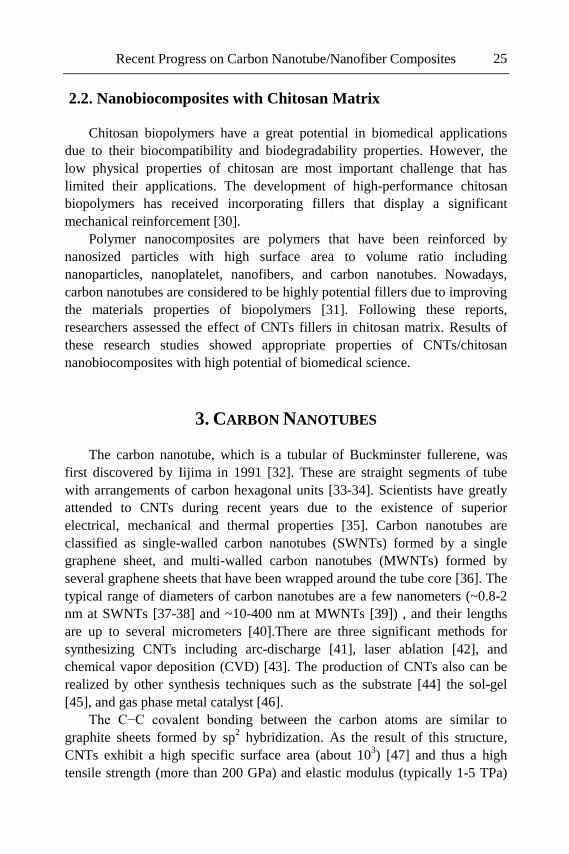
Chitosan could be suitably modified to impart desired properties due to
the presence of the amino groups. Hence, a wide variety of applications for
chitosan have been reported over the recent decades. Table 1. shows chiotosan
applications in a variety of fields and their principal characteristics. The high
biocompatibility [12] and biodegradability [13] of chitosan yield most
potential applications in biomedical [14].
Figure 1. Structure of chitin.
Figure 2. Structure of chitosan.
A. K. Haghi 24
Table 1. chiotosan applications
in variety fields and their principal characteristics
Chitosan application Principal characteristics Ref
water engineering metal ionic adsorption [15]
bio
med
ical
app
lica
tio
n
biosensors and
immobilization
of enzymes and
cells
biocompatibility, biodegradability to harmless
products, nontoxicity, antibacterial properties,
gel-forming properties and hydrophilicity,
remarkable affinity to proteins
[16]
antimicrobial
and wound
dressing
wound-healing properties [17]
tissue
engineering
biocompatibility, biodegradable, and
antimicrobial properties
[18]
drug and gene
delivery
biodegradable, nontoxicity, biocompatibility,
high charge density, mucoadhesion
[19]
orthopedic/perio
dontal
application
antibacterial [20]
Photography resistance to abrasion, optical characteristics,
film-forming ability
[21]
cosmetic application fungicidal and fungi static properties [22]
food preservative biodegradability, biocompatibility,
antimicrobial activity, non-toxicity
[23]
Agriculture biodegradability, non-toxicity, antibacterial,
cells activator, disease and insect resistant
ability
[24]
textile industry microorganism resistance, absorption of
anionic dyes
[25]
paper finishing high density of positive charge, non-toxicity,
biodegradability, biocompatibility,
antimicrobial and antifungal
[26]
solid-state batteries ionic conductivity [27]
chromatographic
separations
the presence of free -NH2, primary -OH,
secondary -OH
[28]
chitosan gel for LED
and NLO applications
dye containing chitosan gels [29]
Recent Progress on Carbon Nanotube/Nanofiber Composites 25
2.2. Nanobiocomposites with Chitosan Matrix
Chitosan biopolymers have a great potential in biomedical applications
due to their biocompatibility and biodegradability properties. However, the
low physical properties of chitosan are most important challenge that has
limited their applications. The development of high-performance chitosan
biopolymers has received incorporating fillers that display a significant
mechanical reinforcement [30].
Polymer nanocomposites are polymers that have been reinforced by
nanosized particles with high surface area to volume ratio including
nanoparticles, nanoplatelet, nanofibers, and carbon nanotubes. Nowadays,
carbon nanotubes are considered to be highly potential fillers due to improving
the materials properties of biopolymers [31]. Following these reports,
researchers assessed the effect of CNTs fillers in chitosan matrix. Results of
these research studies showed appropriate properties of CNTs/chitosan
nanobiocomposites with high potential of biomedical science.
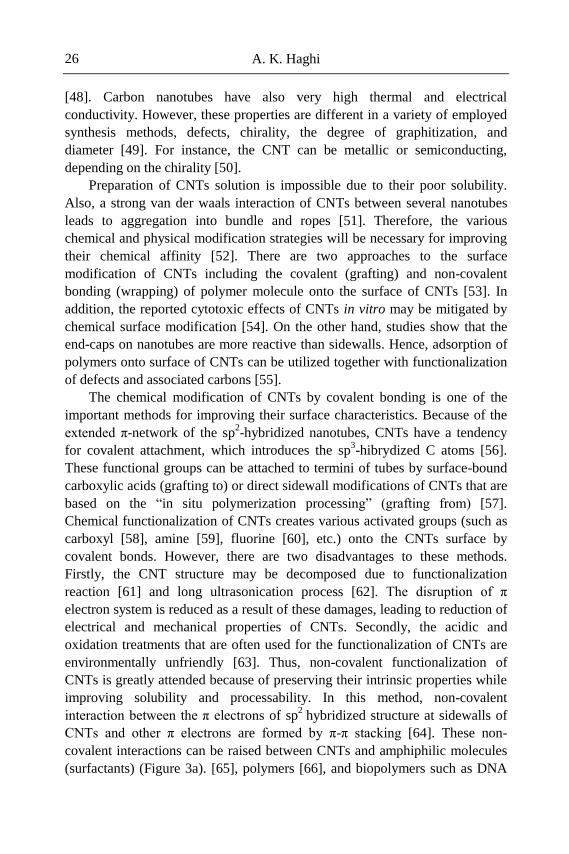
3. CARBON NANOTUBES
The carbon nanotube, which is a tubular of Buckminster fullerene, was
first discovered by Iijima in 1991 [32]. These are straight segments of tube
with arrangements of carbon hexagonal units [33-34]. Scientists have greatly
attended to CNTs during recent years due to the existence of superior
electrical, mechanical and thermal properties [35]. Carbon nanotubes are
classified as single-walled carbon nanotubes (SWNTs) formed by a single
graphene sheet, and multi-walled carbon nanotubes (MWNTs) formed by
several graphene sheets that have been wrapped around the tube core [36]. The
typical range of diameters of carbon nanotubes are a few nanometers (~0.8-2
nm at SWNTs [37-38] and ~10-400 nm at MWNTs [39]) , and their lengths
are up to several micrometers [40].There are three significant methods for
synthesizing CNTs including arc-discharge [41], laser ablation [42], and
chemical vapor deposition (CVD) [43]. The production of CNTs also can be
realized by other synthesis techniques such as the substrate [44] the sol-gel
[45], and gas phase metal catalyst [46].
The C−C covalent bonding between the carbon atoms are similar to
graphite sheets formed by sp2 hybridization. As the result of this structure,
CNTs exhibit a high specific surface area (about 103) [47] and thus a high
tensile strength (more than 200 GPa) and elastic modulus (typically 1-5 TPa)
A. K. Haghi 26
[48]. Carbon nanotubes have also very high thermal and electrical
conductivity. However, these properties are different in a variety of employed
synthesis methods, defects, chirality, the degree of graphitization, and
diameter [49]. For instance, the CNT can be metallic or semiconducting,
depending on the chirality [50].
Preparation of CNTs solution is impossible due to their poor solubility.
Also, a strong van der waals interaction of CNTs between several nanotubes
leads to aggregation into bundle and ropes [51]. Therefore, the various
chemical and physical modification strategies will be necessary for improving
their chemical affinity [52]. There are two approaches to the surface
modification of CNTs including the covalent (grafting) and non-covalent
bonding (wrapping) of polymer molecule onto the surface of CNTs [53]. In
addition, the reported cytotoxic effects of CNTs in vitro may be mitigated by
chemical surface modification [54]. On the other hand, studies show that the
end-caps on nanotubes are more reactive than sidewalls. Hence, adsorption of
polymers onto surface of CNTs can be utilized together with functionalization
of defects and associated carbons [55].
The chemical modification of CNTs by covalent bonding is one of the
important methods for improving their surface characteristics. Because of the
extended π-network of the sp2-hybridized nanotubes, CNTs have a tendency
for covalent attachment, which introduces the sp3-hibrydized C atoms [56].
These functional groups can be attached to termini of tubes by surface-bound
carboxylic acids (grafting to) or direct sidewall modifications of CNTs that are
based on the “in situ polymerization processing” (grafting from) [57].
Chemical functionalization of CNTs creates various activated groups (such as
carboxyl [58], amine [59], fluorine [60], etc.) onto the CNTs surface by
covalent bonds. However, there are two disadvantages to these methods.
Firstly, the CNT structure may be decomposed due to functionalization
reaction [61] and long ultrasonication process [62]. The disruption of π
electron system is reduced as a result of these damages, leading to reduction of
electrical and mechanical properties of CNTs. Secondly, the acidic and
oxidation treatments that are often used for the functionalization of CNTs are
environmentally unfriendly [63]. Thus, non-covalent functionalization of
CNTs is greatly attended because of preserving their intrinsic properties while
improving solubility and processability. In this method, non-covalent
interaction between the π electrons of sp2
hybridized structure at sidewalls of
CNTs and other π electrons are formed by π-π stacking [64]. These non-
covalent interactions can be raised between CNTs and amphiphilic molecules
(surfactants) (Figure 3a). [65], polymers [66], and biopolymers such as DNA
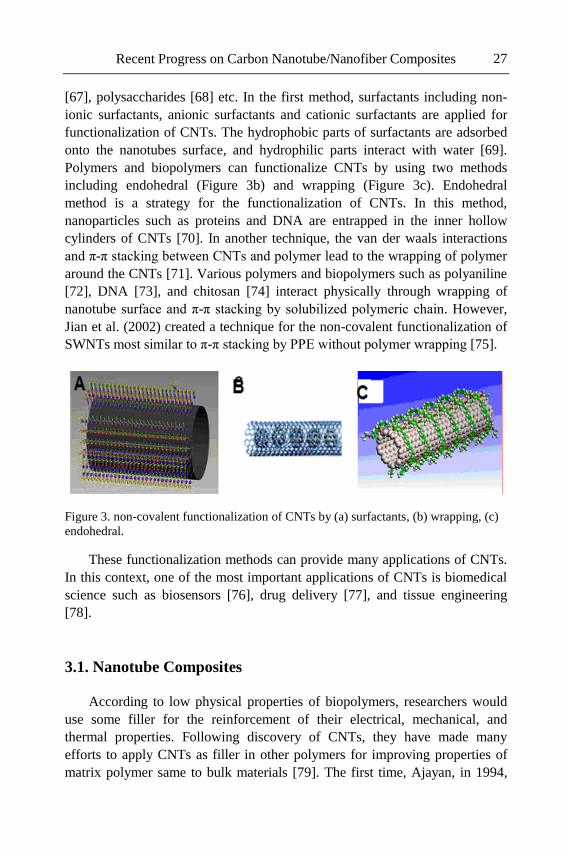
Recent Progress on Carbon Nanotube/Nanofiber Composites 27
[67], polysaccharides [68] etc. In the first method, surfactants including non-
ionic surfactants, anionic surfactants and cationic surfactants are applied for
functionalization of CNTs. The hydrophobic parts of surfactants are adsorbed
onto the nanotubes surface, and hydrophilic parts interact with water [69].
Polymers and biopolymers can functionalize CNTs by using two methods
including endohedral (Figure 3b) and wrapping (Figure 3c). Endohedral
method is a strategy for the functionalization of CNTs. In this method,
nanoparticles such as proteins and DNA are entrapped in the inner hollow
cylinders of CNTs [70]. In another technique, the van der waals interactions
and π-π stacking between CNTs and polymer lead to the wrapping of polymer
around the CNTs [71]. Various polymers and biopolymers such as polyaniline
[72], DNA [73], and chitosan [74] interact physically through wrapping of
nanotube surface and π-π stacking by solubilized polymeric chain. However,
Jian et al. (2002) created a technique for the non-covalent functionalization of
SWNTs most similar to π-π stacking by PPE without polymer wrapping [75].
Figure 3. non-covalent functionalization of CNTs by (a) surfactants, (b) wrapping, (c)
endohedral.
These functionalization methods can provide many applications of CNTs.
In this context, one of the most important applications of CNTs is biomedical
science such as biosensors [76], drug delivery [77], and tissue engineering
[78].
3.1. Nanotube Composites
According to low physical properties of biopolymers, researchers would
use some filler for the reinforcement of their electrical, mechanical, and
thermal properties. Following discovery of CNTs, they have made many
efforts to apply CNTs as filler in other polymers for improving properties of
matrix polymer same to bulk materials [79]. The first time, Ajayan, in 1994,
A. K. Haghi 28
applied CNTs as filler in epoxy resin by the alignment method [80]. Later,
many studies have focused on CNTs as excellent substitute for conventional
nanofillers in the nanocomposites. Recently, many polymers and biopolymers
have been reinforced by CNTs. As mentioned earlier, these nanocomposites
have remarkable characteristics compared with bulk materials due to their
unique properties [81].
There are several parameters affecting the mechanical properties of
composites including proper dispersion, large aspect ratio of filler, interfacial
stress transfer, well alignment of reinforcement, and solvent choice [82].
Uniformly and stability of nanotube dispersion in polymer matrixes are
most important parameters for performance of composite. Good dispersion
leads to efficient load transfer concentration centers in composites and uniform
stress distribution [83]. Pemg-Cheng Ma et al. reviewed dispersion and
functionalization techniques of carbon nanotubes for polymer-based
nanocomposites and their effects on the properties of CNT/polymer
nanocomposites. They demonstrated that the control of these two factors lead
to uniform dispersion. Overall, the result showed that the proper dispersion
enhanced a variety of mechanical properties of nanocomposites [71].
Fiber aspect ratio, defined as "the ratio of average fiber length to fiber
diameter.” This parameter is one of the main effective parameters on the
longitudinal modulus [84]. Carbon nanotubes generally have high aspect ratio
but their ultimate performance in a polymer composite is different. The high
aspect ratio of dispersed CNTs could lead to a significant load transfer [85].
However, aggregation of the nanotubes could lead to decrease of effective
aspect ratio of the CNTs. Hence, properties of nanotube composites are lower
enhanced than predictions. This is one of the processing challenges and poor
CNTs dispersion [86].
The interfacial stress transfer has been performed by employing external
stresses to the composites. The assessments showed that fillers take a
significantly larger share of the load due to CNTs-polymer matrix interaction.
Also, the literature on mechanical properties of polymer nanotube composites
represented enhancement of Young’s modulus due to adding CNTs [87].
Wagner et al. investigated the effect of stress-induced fragmentation of multi-
walled carbon nanotubes in a polymer matrix. The results showed that polymer
deformation generates tensile stress and then transmits to CNTs [88].
The alignment CNT/polymer matrix in composite homogeneously is
another effective parameter in properties of carbon nanotube composites. Quin
Wang et al. [89], for instance, assessed the effects of CNT alignment on
electrical conductivity and mechanical properties of SWNT/epoxy
Recent Progress on Carbon Nanotube/Nanofiber Composites 29
nanocomposites. The electrical conductivity, Young’s modulus and tensile
strength of the SWNT/ epoxy composite rise with increasing SWNT alignment
due to increase of interface bonding of CNTs in the polymer matrix.
Umar Khan et al. in 2007, examined the effect of solvent choice on the
mechanical properties of CNTs–polymer composites. They were fabricated
double-walled nanotubes and polyvinyl alcohol composites into the different
solvents including water, DMSO and NMP. This work shows that solvent
choice can have a dramatic effect on the mechanical properties of CNTs-
polymer composites [90]. Also, critical CNTs concentration has defined as
optimum improvement of mechanical properties of nanotube composites
where a fine network of filler formed [91].
There are other effective parameters in mechanical properties of nanotube
composite such as size, crystallinity, crystalline orientation, purity,
entanglement, and straightness. Generally, the ideal CNT properties depend on
matrix and application [92].
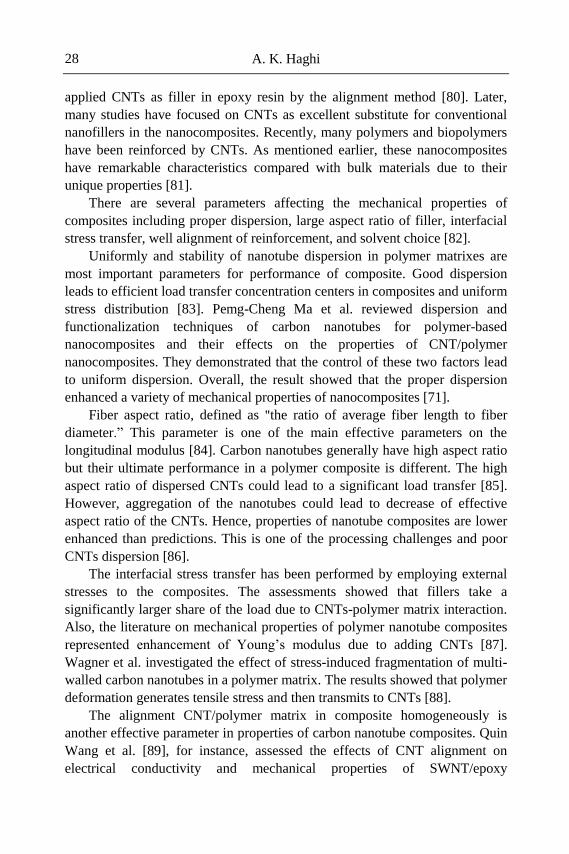
Figure 4. Electrical conductivity of the nanocomposites as function of filler content in
weight percent [97].
A. K. Haghi 30
The various functional groups on CNTs surface enable coupling with
polymer matrix. A strong interface between coupled CNT/polymer creates
efficient stress transfer. As a previous point, stress transfer is a critical
parameter for control of mechanical properties of composite. However,
covalent treatment of CNT reduces electrical [93] and thermal [94-95]
properties of CNTs. These reductions affect final properties of nanotubes.
Matrix polymer can wrap around CNT surface by non-covalent
functionalization. This process causes improvement in composite properties
through various specific interactions. These interactions can improve
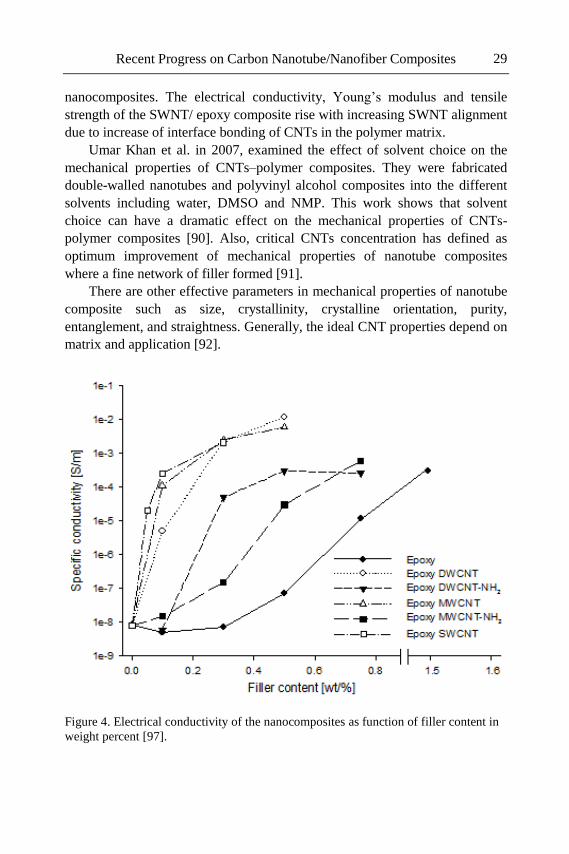
properties of nanotube composites [96]. In this context, Gojny et al. [97]
evaluated electrical and thermal conductivity in CNTs/epoxy composites.
Figure 4 and 5 Show, respectively, electrical and thermal conductivity in
various filler content including carbon black (CB), double-walled carbon
nanotube (DWNT), and multi-functionalization. The experimental results
represented that the electrical and thermal conductivity in nanocomposites
improve by non-covalent functionalization of CNTs.
Figure 5. Thermal conductivity as function of the relative provided interfacial area per
gram composite (m2/g) [97].
Recent Progress on Carbon Nanotube/Nanofiber Composites 31
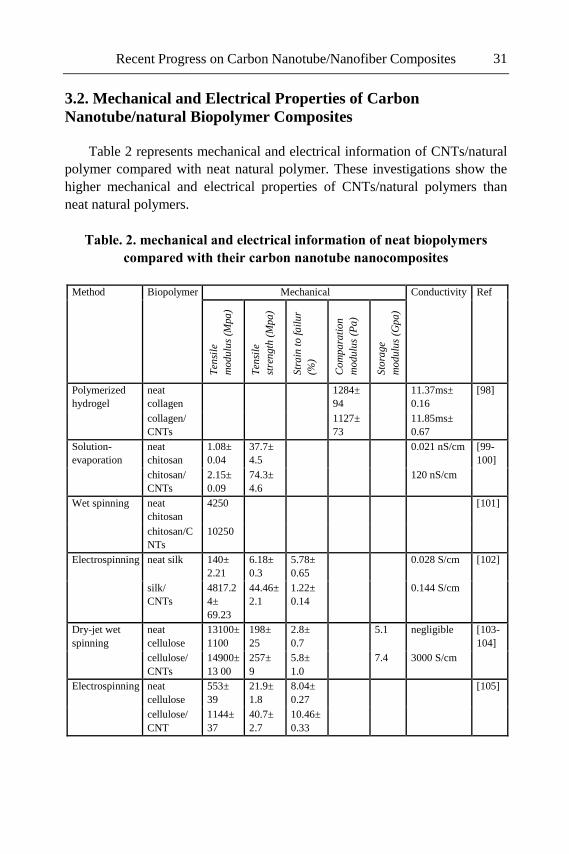
3.2. Mechanical and Electrical Properties of Carbon
Nanotube/natural Biopolymer Composites
Table 2 represents mechanical and electrical information of CNTs/natural
polymer compared with neat natural polymer. These investigations show the
higher mechanical and electrical properties of CNTs/natural polymers than
neat natural polymers.
Table. 2. mechanical and electrical information of neat biopolymers
compared with their carbon nanotube nanocomposites
Method Biopolymer Mechanical Conductivity Ref
Ten
sile
mo
du
lus
(Mpa
)
Ten
sile
stre
ngth
(M
pa
)
Str
ain
to f
ail
ur
(%)
Co
mp
ara
tio
n
mo
du
lus
(Pa
)
Sto
rage
mo
du
lus
(Gp
a)
Polymerized
hydrogel
neat
collagen
1284±
94
11.37ms±
0.16
[98]
collagen/
CNTs
1127±
73
11.85ms±
0.67
Solution-
evaporation
neat
chitosan
1.08±
0.04
37.7±
4.5
0.021 nS/cm [99-
100]
chitosan/
CNTs
2.15±
0.09
74.3±
4.6
120 nS/cm
Wet spinning neat
chitosan
4250 [101]
chitosan/C
NTs
10250
Electrospinning neat silk 140±
2.21
6.18±
0.3
5.78±
0.65
0.028 S/cm [102]
silk/
CNTs
4817.2
4±
69.23
44.46±
2.1
1.22±
0.14
0.144 S/cm
Dry-jet wet
spinning
neat
cellulose
13100±
1100
198±
25
2.8±
0.7
5.1 negligible [103-
104]
cellulose/
CNTs
14900±
13 00
257±
9
5.8±
1.0
7.4 3000 S/cm
Electrospinning neat
cellulose
553±
39
21.9±
1.8
8.04±
0.27
[105]
cellulose/
CNT
1144±
37
40.7±
2.7
10.46±
0.33
A. K. Haghi 32
3.3. Carbon Nanotube Composite Application
Great attention has been paid in recent years to applying nanotube
composites in various fields. Wang and T.W. Yeow [106] reviewed nanotubes
composites based on gas sensors. These sensors play important role for
industry, environmental monitoring, biomedicine and so forth. The unique
geometry, morphology, and material properties of CNTs led to applying them
in gas sensors.
There are many topical studies for biological and biomedical applications
of carbon nanotube composites due to its biocompatibility [107]. These
components promoted biosensors [108], tissue engineering [95], and drug
delivery [109] fields in biomedical technology.
On the other hand, light weight, mechanical strength, electrical
conductivity, and flexibility are significant properties of carbon nanotubes for
aerospace applications [110].
Kang et al. [111] presented an overview of carbon nanotube composite
applications including electrochemical actuation, strain sensors, power
harvesting, and bioelectronic sensors. They presented appropriate elastic and
electrical properties for using nanoscale smart materials to synthesize
intelligent electronic structures. In this context, Motaghitalab et al. developed
polyaniline/SWNTs composite fiber [112] and showed high strength,
robustness, good conductivity and pronounced electroactivity of the
composite. They presented new battery materials [113] and enhancement of
performance artificial muscles [114] by using these carbon nanotube
composites.
Thai Ong et al. [115] addressed sustainable environment and green
technologies perspective for carbon nanotube applications. These contexts
include many engineering fields such as waste water treatment, air pollution
monitoring, biotechnologies, renewable energy technologies, and green
nanocomposites.
Sariciftici et al. [116] for the first time discovered photo-induced electron
transfer from CNTs. Later, optical and photovoltaic properties of carbon
nanotube composites have been studied by many groups. Results suggested the
possible creation of photovoltaic devices due to hole-collecting electrode of
CNTs [117].
Food packaging is another remarkable application of carbon nanotube
composites. Usually, poor mechanical and barrier properties have limited
applying biopolymers. Hence, appropriate filler is necessary for promotion of
matrix properties. Unique properties of CNTs have been improved thermal
Recent Progress on Carbon Nanotube/Nanofiber Composites 33
stability, strength and modulus, and better water vapor transmission rate of
applied composites in this industry [118].
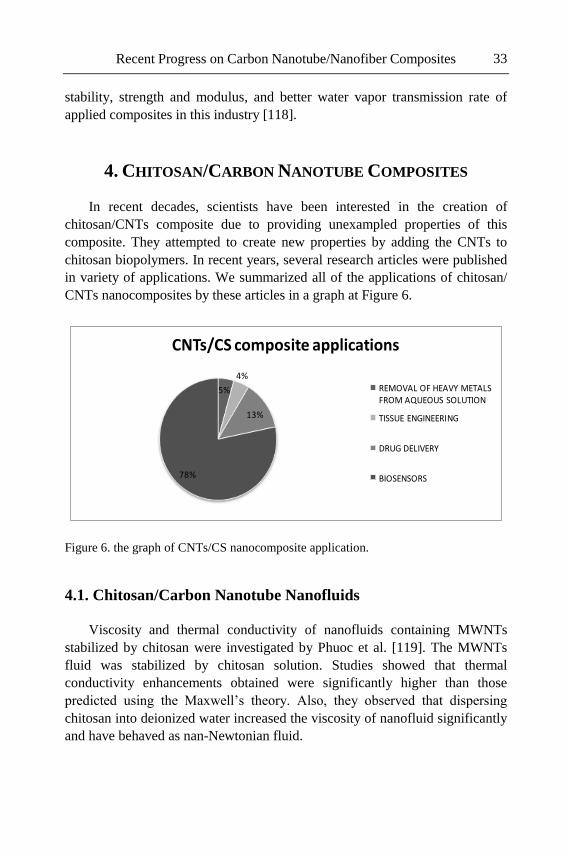
4. CHITOSAN/CARBON NANOTUBE COMPOSITES
In recent decades, scientists have been interested in the creation of
chitosan/CNTs composite due to providing unexampled properties of this
composite. They attempted to create new properties by adding the CNTs to
chitosan biopolymers. In recent years, several research articles were published
in variety of applications. We summarized all of the applications of chitosan/
CNTs nanocomposites by these articles in a graph at Figure 6.
5%
4%
13%
78%
CNTs/CS composite applications
REMOVAL OF HEAVY METALS FROM AQUEOUS SOLUTION
TISSUE ENGINEERING
DRUG DELIVERY
BIOSENSORS
Figure 6. the graph of CNTs/CS nanocomposite application.
4.1. Chitosan/Carbon Nanotube Nanofluids
Viscosity and thermal conductivity of nanofluids containing MWNTs
stabilized by chitosan were investigated by Phuoc et al. [119]. The MWNTs
fluid was stabilized by chitosan solution. Studies showed that thermal
conductivity enhancements obtained were significantly higher than those
predicted using the Maxwell’s theory. Also, they observed that dispersing
chitosan into deionized water increased the viscosity of nanofluid significantly
and have behaved as nan-Newtonian fluid.
A. K. Haghi 34
4.2. Preparation Methods of CNTs/CS Nanocomposites
There are several methods for creation of nanobiocomposites. Among
them, researchers have studied some of these methods for preparation the
CNTs/CS nanocomposites. We represented these methods in the continuance
of our review.
4.2.1. Solution-Casting-evaporation
Zhang et al. [120] assessed electrochemical sensing of carbon
nanotube/chitosan system on dehydrogenase enzymes for preparing glucose
biosensor first in 2004. They prepared the nanotube composite by use of
solution-casting-evaporation method. In this method, the CNT/CS films were
prepared by casting of CNT/CS solution on the surface of glassy carbon
electrode and then drying. This CNT/CS system showed a new biocomposite
platform for development of dehydrogenase-based electrochemical biosensors
due to providing a signal transduction of CNT. The great results of this
composite in biomedical application led to many studies in this context.
The effect of CNT/CS matrix on direct electron transfer of glucose
oxidase and glucose biosensor was examined by Liu and Dong et al. [121].
They exhibited high sensitivity and better stability of CNT/CS composites
compared with pure chitosan films. Furthermore, Tkac et al. [122] used the
SWNT/CS films for preparation a new galactose biosensor with highly reliable
detection of galactose. Tsai et al. [123] immobilized lactate dehydrogenase
within MWNT/CS nanocomposite for producing lactate biosensors. This
proposed biosensor provided a fast response time and high sensitivity. Also,
Zhou and Chen et al. [124] showed that the immobilization of GOD molecules
into chitosan-wrapped SWNT film is an efficient method for the development
of a new class of very sensitive, stable, and reproducible electrochemical
biosensors.
Several experiments were performed on DNA biosensor based on chitosan
film doped with carbon nanotubes by Yao et al. [125]. They found that
CNT/CS film can be used as a stable and sensitive platform for DNA
detection. The results demonstrated improving sensor performance by adding
CNT to chitosan film. Moreover, the analytical performance of glassy carbon
electrodes modified with a dispersion of MWNT/CS for quantification of
DNA was reported by Bollo et al. [126]. This new platform immobilized the
DNA and opened the door to new strategies for development of biosensors.
Recent Progress on Carbon Nanotube/Nanofiber Composites 35
In other experiments, Zeng et al. [127] reported high sensitivity of glassy
carbon electrode modified by MWNT-CS for cathodic stripping voltammetric
measurement of bromide (Br-).
Qian et al. [128] prepared amperometric hydrogen peroxide biosensor
based on composite film of MWNT/CS. The results showed excellent electro-
catalytical activity of the biosensor for H2O2 with good repeatability and
stability.
Liu and Dong et al. [129] reported effect of CNT/CS matrix on
amperometric laccase biosensor. Results showed some major advantages of
this biosensor involving detecting different substrates, possessing high affinity
and sensitivity, durable long-term stability, and facile preparation procedure.
Gordon Wallace et al. [130] paid particular attention to preparing of
SWNT/CS film by solution-cast method and then characterizing their drug
delivery properties. They found that the SWNT/CS film has enhanced slowing
down release of dexamethasone.
Growth of apatite on chitosan-multi-walled carbon nanotube composite
membranes at low MWNT concentrations was reported by Yang et al. [131].
Apatite was formed on the composites with low concentrations.
Immunosensors can detect various substances from bacteria to
environmental pollutants. CNT/CS nanobiocomposite for immunosensor
fabricated by Kaushik et al. [132]. Electron transport in this nanobiocomposite
enhanced and improved the detection of ochratoxin-A, due to high
electrochemical properties of SWNT. Also, CNT/CS nanocomposite used for
detection of human chorionic gonadotrophin antibody was performed by Yang
et al. [133] and displayed high sensitivity and good reproducibility.
4.2.1.1. Properties and Characterization
Wang et al. [134] represented that morphology and mechanical properties
of chitosan has been promoted by adding CNTs. Beside, Zheng et al. [135]
proved that conducting direct electron is very useful for adsorption of
hemoglobin in CNT/CS composite film. These studies have demonstrated that
this nanobiocomposite can used in many fields such as biosensing and biofuel
cell approaches.
Tang et al. [136] evaluated water transport behavior of chitosan porous
membranes containing MWNTs. They characterized two nanotube composites
with low molecular weight CSP6K and high molecular weight CSP10K.
Because of hollow nanochannel of MWNTs located among the pore network
of chitosan membrane, the water transport results for CSP6K enhanced, when
the MWNTs content is over a critical content. But, for CSP10K series
A. K. Haghi 36
membranes, the water transport rate decreased with increase of MWNTs
content due to the strong compatibilizing effect of MWNTs.
CNT/CS nanocomposites were utilized by using poly(styrene sulfonic
acid)-modified CNTs by Liu et al. [137] Thermal, mechanical, and electrical
properties of CNT/CS composite film prepared by solution-casting have
application potentials for separation membranes and sensor electrodes.
4.2.2. Crosslinking-Casting-Evaporation
In a new approach, MWNTs functionalized with –COOH groups at the
end or at the sidewall defects of nanotubes by carbon nanotubes in nitric acid
solvent. The functionalized carbon nanotubes immobilized into chitosan films
by Emilian Ghica et al. [138]. This film applied in amperometric enzyme
biosensors and resulted glucose detection and high sensitivity.
In a novel method, Kandimalla and Ju [139] cross-linked chitosan with
free –CHO groups by glutaraldehyde and then MWNTs were added to the
mixture. The cross-linked MWNT-CS composite immobilized
acetylcholinesterase (AChE) for detecting of both acetylthiocholine and
organophosphorous insecticides. On the other hand, Du et al. [140] created a
new method for crosslinking CS with carboxylated CNT. This new method
was performed by adding glutaraldehyde to MWNT/CS solution. They
immobilized AChE on the composite for preparing an amperometric
acetylthiocholine sensor. The suitable fabrication reproducibility, rapid
response, high sensitivity, and stability could provide an amperometric
detection of carbaryl and treazophos [141] pesticide. Results reported by
Abdel Salam et al. [142] showed the removal of heavy metals including
copper, zinc, cadmium, and nickel ions from aqueous solution in MWNT/CS
nanocomposite film.
4.2.3. Surface Deposition Crosslinkig
Liu et al. [143] decorated carbon nanotube with chitosan by surface
deposition and crosslinking process. In this new method, chitosan
macromolecules as polymer cationic surfactants were adsorbed on the surface
of the CNTs. In this step, CS is capable of stable dispersion of the CNT in
acidic aqueous solution. The pH value of the system was increased by
ammonia solution to become non-dissolvable of chitosan in aqueous media.
Consequently, the soluble chitosan deposited on the surface of carbon
nanotubes is similar to chitosan coating. Finally, the surface-deposited
chitosan was cross-linked to the CNTs by glutaraldehyde. They found
Recent Progress on Carbon Nanotube/Nanofiber Composites 37
potential applications in biosensing, gene and drug delivering for this
composite.
4.2.4. Electrodeposition Method
Luo and Chen et al. [144] used nanocomposite film of CNT/CS as glucose
biosensor by a simple and controllable method. In this one-step electro-
deposition method, a pair of gold electrodes was connected to a direct current
power supply and then dipped into the CNT/CS solution. Herein, the pH near
the cathode surface increased, thereby solubility of chitosan decreased. In pH
of about 6.3, chitosan become insoluble and the chitosan entrapped CNT will
deposited onto the cathode surface.
Yao et al. [145] also characterized electrocatalytic oxidation and sensitive
electroanalysis of NADH on a novel film of CS-DA-MWNTs and improved
detection sensitivity. In this new method, glutaraldehyde crosslinked CS-DA
with the covalent attachment of DA molecules to CS chains formed by Schiff
bases. Following, solution of MWNT dispersed in CS-DA solution dropped on
an Au electrode for preparing CS-DA-MWNTs film and finally dried.
4.2.5. Covalently Grafting
Carboxylic acid (-COOH) groups were formed on the walls of CNTs by
refluxing of CNTs in acidic solution. The carboxylated CNTs were added to
aqueous solution of chitosan. Grafting reactions were accomplished by
purging with N2 and heated to 98 oC of CNTs/CS solution. Shieh et al. [146]
compared mechanical properties and water stability of CNTs-grafted-CS with
the ungrafted CNTs. A significantly improved dispersion in chitosan matrix
has resulted an important improvement storage modulus and water stability of
the chitosan nanocomposites.
Wu et al. [147] created another process for make a CS-grafted MWNT
composite. In this different method, after preparing oxidized MWNT
(MWNT-COOH), they generated the acyl chloride functionalized MWNT
(MWNT-COCl) in a solution of thionyl chloride. In the end, the MWNT-
grafted-CS was synthesized by adding CS to MWNT-COCl suspension in
anhydrous dimethyl formamide. The covalent modification has improved
interfacial bonding and resulted high stability of CNT dispersion. Biosensors
and other biological applications are evaluated as potential usage of this
component. Also, Carson et al. [148] prepared a similar composite by reacting
CNT-COCl and chitosan with potassium persulfate, lactic acid, and acetic acid
solution at 75 oC. They estimated that the CNT-grafted-CS composite can be
A. K. Haghi 38
used in bone tissue engineering because of the improvement of thermal
properties.
4.2.5.1. Nucleophilic Substitution Reaction
Covalent modification of MWNT was accomplished with a low molecular
weight chitosan (LMCS) by Ke et al. [149]. In this method, the acyl chloride
functionalized grafted to LMCS in DMF/Pyridine solution. This novel
derivation of MWNTs can be solved in DMF, DMAc and DMSO, but also in
aqueous acetic acid solution.
4.2.6. Electrostatic Interaction
Furthermore, Baek et al. [150] synthesized CS nanoparticles-coated
fMWNTs composite by electrostatic interactions between CS particles and
functionalized CNT. They prepared CS nanoparticles and CS microspheres by
precipitation method and crosslinking method, respectively. The electrostatic
interactions between CS particles solution in distilled deionized water and the
carboxylated CNTs were confirmed by changing the pH solution. Results
showed same surface charges in pH 2 (both were positively charged) and pH 8
(both were negatively charged). The electrostatic interactions can be caused at
pH 5.5 due to different charges between CS particles and fCNT with positive
and negative surface charges, respectively. These CS particles/CNT composite
materials could be utilized for potential biomedical.
Also, Zhao et al. [151] constructed SWNTs/phosphotungstic acid
modified SWNTs/CS composites using phosphotungstic acid as an anchor
reagent to modify SWNTs. They succeeded in using PW12-modified SWNT
with a negative surface charge, and on the contrary, positively charged
chitosan by electrostatic interaction. These strong interfacial interactions
between SWNTs and chitosan matrix presented favorable cytocompatibility
for the potential use as scaffolds for bone tissue engineering.
4.2.7. Microwave Irradiation
Yu et al. [152] created a new technique for synthesis of chitosan-modified
carbon nanotube by using microwave irradiation. In this technique, MWNTs
solution in nitric acid were placed under microwave irradiation and dried for
purification of MWNTs. A mixture of purified MWNTs and chitosan solution
was reacted in the microwave oven and then centrifuged. The yield black-
colored solution was adjusted at pH 8 and centrifuged for precipitation of
CNT/CS composite. This facilitated technique is much more efficient than
conventional methods.
Recent Progress on Carbon Nanotube/Nanofiber Composites 39
4.2.8. Layer-by-layer
Wang et al. [153] characterized MWNT/CS composite rods with layer-by-
layer structure were prepared via in situ precipitation method. Samples were
prepared by coating CS solution on internal surface of a cylindrical tube and
then filling with MWNT/CS solution in acetic acid. They examined
morphology, mechanical, and thermal properties of this composite rod. The
excellent mechanical property of these new composite rods has made potential
of bone fracture internal fixation application.
4.2.8.1. Layer-by-layer Self Assembly
Xiao-bo et al. [154] produced a homogeneous multi-layer film of
MWNT/CS by using layer-by-layer self assembly method. In this method,
negatively charged substrates were dipped into poly (ethyleneimine) aqueous
solution, MWNTs suspension, and CS solution respectively and dried at the
end. In this process, both CS and PEI solution were contained NaCl for the
LBL assembly. The films showed stable optical properties and were
appropriate for biosensors applications.
4.2.9. Freeze-drying
Lau et al. [155] synthesized and characterized a highly conductive, porous,
and biocompatible MWNT/CS biocomposite film by freeze-drying technique.
This process was performed by freezing MWNT/CS dispersion into an
aluminum mold and then drying. Such a composite permitted delivery of
needed antibiotics with effect of increased antibiotic efficacy in a patent by
Jennings et al. [156].
4.2.10. Wet-spinning
Gordon Wallace et al. [157] recently reported that chitosan is a good
dispersing agent for SWNT. They also demonstrated several methods in
preparing SWNT/CS macroscopic structure in the form of films, hydrogels
and fibers [158]. The CNT/CS dispersion in acetic acid was spun into an
ethanol:NaOH coagulation solution bath. They demonstrated increasing
mechanical properties of wet spun fibers by improving dispersion [159].
4.2.11. Electrospinning
In our recent work, the chitosan(CHT)/multi-walled carbon nanotubes
(MWNTs) composite nanofiber were fabricated by using electrospinning. In
our experimental researches, different solvents including acetic acid 1-90%,
formic acid, and TFA/DCM were tested for the electrospinning of

A. K. Haghi 40
chitosan/carbon nanotube. No jet was seen upon applying the high voltage
even above 25 kV by using of acetic acid 1-30% and formic acid as the solvent
for chitosan/carbon nanotube. When the acetic acid 30-90% was used as the
solvent, beads were deposited on the collector. Therefore, under these
conditions, nanofibers were not formed.
The TFA/DCM (70:30) solvent was the only solvent that resulted in
electrospinnability of chitosan/carbon nanotube. The scanning electron
microscopic (Figure images showed the homogenous fibers with an average
diameter of 455 nm (306-672)) were prepared with chitosan/carbon nanotube
dispersion in TFA/DCM 70:30. These nanofibers have a potential for
biomedical applications.
Figure 8. electron micrographs of electrospun fibers at chitosan concentration 10 wt%,
24 kV, 5 cm, TFA/DCM: 70/30.
CONCLUSION
With less than ten years history, several research studies have been created
in chitosan biocomposites reinforcement using carbon nanotubes. In
Recent Progress on Carbon Nanotube/Nanofiber Composites 41
conclusion, much progress has been made in preparation and characterization
of the CNTs/CS nanocomposites. We reported several methods for preparing
these nanobiocomposites. In addition, the CNTs/CS applications have been
classified including biomedicine (tissue engineering, biosensors, and drug
delivery) and wastewater in this review.
Most importantly, the overriding results of electrospinning of CNTs/CS
nanocomposites in our recent paper have been discussed. It is expected that
there is a high potential application in tissue engineering and drug delivery by
these nanobiocomposites. It is believed that with more attention to the
preparation methods of CNTs/CS nanocomposites and their characterization
have a promising future in biomedicine science.
REFERENCES
[1] Christian Stevens, R.V., Renewable Bioresources: Scope and
Modification for Non-food Applications. 2004: Wiley 328.
[2] Parry, D.A.D. and E.N. Baker, Biopolymers. Rep. Prog. Phys., 1984.
47: p. 1133-1232
[3] Sanjib Bhattacharyya, S.G., Hinda Dabboue, Jean-François Tranchant,
Jean-Paul Salvetat*, Carbon Nanotubes as Structural Nanofibers for
Hyaluronic Acid Hydrogel Scaffolds. Biomacromolecules 2008. 9: p.
505-509.
[4] Marino Lavorgna, F.P., Pasqualina Mangiacapra, Giovanna G.
Buonocore, Study of the combined effect of both clay and glycerol
plasticizer on the properties of chitosan films. Carbohydrate Polymers,
2010. 82(2): p. 291-298.
[5] Xiaodong Cao, Y.C., 1,2 Peter R. Chang,1 Michel A. Huneault3,
Preparation and Properties of Plasticized Starch/Multi-walled Carbon
Nanotubes Composites. Journal of Applied Polymer Science, 2007. 106:
p. 1431-1437.
[6] Ramakrishna, S. et al., Biomedical applications of polymer-composite
materials: a review. Composites Science and Technology, 2001. 61(9):
p. 1189-1224.
[7] Liang, D., B.S. Hsiao, and B. Chu, Functional electrospun nanofibrous
scaffolds for biomedical applications. Advanced Drug Delivery Reviews,
2007. 59(14): p. 1392-1412.
A. K. Haghi 42
[8] Zonghua Liu a, Y.J.a., Yifei Wang b, Changren Zhou a, Ziyong Zhang
a,, Polysaccharides-based nanoparticles as drug delivery systems.
Advanced Drug Delivery Reviews 2008. 60: p. 1650–1662.
[9] C. Agboh, O. and Y. Qin, Chitin and Chitosan Fibers. Polymers for
Advanced Technologies, 1997. 8: p. 355–365.
[10] Inmaculada Aranaz, M.M., Ruth Harris, Inés Paños, Beatriz Miralles,
Niuris Acosta, and G.G.a.Á. Heras, Functional Characterization of
Chitin and Chitosan. Current Chemical Biology, 2009. 3: p. 203-230.
[11] Zhang, Y. et al., Determination of the degree of deacetylation of chitin
and chitosan by X-ray powder diffraction. Carbohydrate Research,
2005. 340(11): p. 1914-1917.
[12] Pamela J. VandeVord, 2 Howard W. T. Matthew,1,3 Stephen P.
DeSilva,2 Lois Mayton,2 Bin Wu,2 and Paul H. Wooley1, Evaluation of
the biocompatibility of a chitosan scaffold in mice. J Biomed Mater Res,
2002. 59(3): p. 585-590.
[13] Grażyna Strobin et al., Studies on the Biodegradation of Chitosan in an
Aqueous Medium. 7FIBRES & TEXTILES in Eastern Europe, 2003.
11(3 (42)): p. 75-79.
[14] Jayakumar, R. et al., Novel chitin and chitosan nanofibers in biomedical
applications. Biotechnology Advances, 2010. 28(1): p. 142-150.
[15] Bamgbose, J.T. et al., Adsorption kinetics of cadmium and lead by
chitosan. African Journal of Biotechnology, 2010. 9(17): p. 2560-2565.
[16] Krajewska, B., Application of chitin- and chitosan-based materials for
enzyme immobilizations: a review. Enzyme and Microbial Technology,
2004. 35: p. 126-139.
[17] Ueno, H., T. Mori, and T. Fujinaga, Topical formulations and wound
healing applications of chitosan Advanced Drug Delivery Reviews,
2001. 52: p. 105-115.
[18] Kim, I.-Y. et al., Chitosan and its derivatives for tissue engineering
applications. Biotechnology Advances, 2008. 26: p. 1-21.
[19] Sinha, V.R. et al., Chitosan microspheres as a potential carrier for drugs.
International Journal Of Pharmaceutics, 2004. 274: p. 1-33.
[20] Di Martino, A., M. Sittinger, and M.V. Risbud, Chitosan: A versatile
biopolymer for orthopaedic tissue-engineering. Biomaterials, 2005.
26(30): p. 5983-5990.
[21] Muzzarelli, R.A.A., Human enzymatic activities related to the
therapeutic administration of chitin derivatives. Cell. mol. life sci., 1997.
53: p. 131-140.
Recent Progress on Carbon Nanotube/Nanofiber Composites 43
[22] Muzzarelli, R.A.A. et al., Fungistatic Activity of Modified Chitosans
against Saprolegnia parasitica. Biomacromolecules, 2001. 2: p. 165-169.
[23] Dutta , P.K. et al., Perspectives for chitosan based antimicrobial films in
food applications Food Chemistry, 2009. 114: p. 1173-1182.
[24] Boonlertnirun, S.B., C. Boonraung, and R. Suvanasara, Application of
Chitosan in Rice Production. Journal of Metals, Materials and Minerals
2008. 18(2): p. 47-52.
[25] Huang , K.-S. et al., Application of low-molecular-weight chitosan in
durable press finishing. Carbohydrate Polymers, 2008. 73: p. 254-260.
[26] Lertsutthiwong, P., S. Chandrkrachang, and W.F. Stevens, the effect of
the utilization of chitosan on properties of paper. Journal of Metals,
Materials and Minerals, 2000. 10(1): p. 43-52.
[27] Subban, R.H.Y. and A.K. Arof, Sodium iodide added chitosan
electrolyte film for polymer batteries. Physica Scripta., 1996. 53: p.
382-384.
[28] Ottøy, M.H. et al., Preparative and analytical size-exclusion
chromatography of chitosans. Carbohydrate Polymers, 1996. 31(4): p.
253-261.
[29] Dutta, P.K., J. Dutta, and V.S. Tripathi, Chitin and chitosan: chemistry,
properties and applications. Journal of scientific and industrial
research, 2004. 63(20-31 ).
[30] Qian Li, J.Z., Lina Zhang, Structure and Properties of the
Nanocomposite Films of Chitosan Reinforced with Cellulose Whiskers.
Journal of Polymer Science: Part B: Polymer Physics, 2009? accept
data. 47(11): p. 1069-1077.
[31] Thostenson, E.T., C. Li, and T.-W. Chou, Nanocomposites in context.
Composites Science and Technology, 2005. 65(3-4): p. 491-516.
[32] Iijima, S., Helical microtubules of graphitic carbon. Nature, 1991.
354(6348): p. 56–58.
[33] D.S. Benthune, C.H.K., M.S. de Vries, G. Gorman, R. Savoy, J.
Vazquez, R. Beyers, cobalt-catalysed growth of carbon nanotubes with
single-atomic-layer-walls. Nature, 1993. 363: p. 605-608.
[34] Iijima, S. and T. Ichihashi, Single-shell carbon nanotubes of 1-nm
diameter. Nature, 1993. 363: p. 603-605.
[35] Trojanowicz, M., Analytical applications of carbon nanotubes: a review.
TrAC Trends in Analytical Chemistry, 2006. 25(5): p. 480-489.
[36] Duclaux, L., Review of the doping of carbon nanotubes (multi-walled
and single-walled). Carbon, 2002. 40(10): p. 1751-1764.
A. K. Haghi 44
[37] Wang, Y.Y. et al., Growth and field emission properties of small
diameter carbon nanotube films. Diamond and Related Materials. 14(3-
7): p. 714-718.
[38] Guo, J., S. Datta, and M. Lundstrom, A Numerical Study of Scaling
Issues for Schottky-Barrier Carbon Nanotube Transistors. IEEE
transactions on electron devices, 2004. 51(2): p. 172-177.
[39] Kuo, C.-S. et al., Diameter control of multi-walled carbon nanotubes
using experimental strategies. Carbon, 2005. 43(13): p. 2760-2768.
[40] R.L. Jacobsen, T.M.T., J. R. Guth, A.C. Ehrlich, D.J. Gillespie,
Mechanical properties of vapor-grown carbon fiber. Carbon, 1995.
33(9): p. 1217-1221.
[41] Journet C, M.W., Bernier P, Loiseau A, delaChapelle ML, Lefrant S,
P.Deniard, R.Lee, J.E.Fischer, Large-scale production of single-walled
carbon nanotubes by the electric-arc technique. Nature, 1997.
388(6644): p. 756-8.
[42] Thess A, L.R., Nikolaev P, Dai HJ, Petit P, Robert J, Chunhui Xu,
Young Hee Lee, Seong Gon Kim, Andrew G. Rinzler, Daniel T,
Colbert, Gustavo E, Scuseria, David Tomanek, John E. Fischer, Richard
E. Smalley*, Crystalline ropes of metallic carbon nanotubes. Science,
1996. 273(5274): p. 483-7.
[43] Cassell AM, R.J., Kong J, Dai HJ, Large Scale CVD Synthesis of
Single-Walled Carbon Nanotubes. J Phys Chem B 1999. 103(31): p.
6482-92.
[44] Fan S., et al., Carbon nanotube arrays on silicon substrates and their
possible application. Physica E: Low-dimensional Systems and
Nanostructures, 2000. 8(2): p. 179-183.
[45] Xie, S. et al., Carbon nanotube arrays. Materials Science and
Engineering A, 2000. 286(1): p. 11-15.
[46] Z. K. Tang, L.Z., N. Wang, X. X. Zhang, G. H. Wen, G. D. Li, J. N.
Wang, C. T. Chan, Ping Sheng*, Superconductivity in 4 Angstrom
Single-Walled Carbon Nanotubes. Science, 2001. 292(2462-65).
[47] A. Peigney, C.L., E. Flahaut, R.R. Bacsa, A. Rousset, Specific surface
area of carbon nanotubes and bundles of carbon nanotubes. Carbon,
2001. 39: p. 507-514.
[48] Z. W. Pan, S.S.X., a) L. Lu, B. H. Chang, L. F. Sun, W. Y. Zhou, G.
Wang, and D. L. Zhang, Tensile tests of ropes of very long aligned
multi-wall carbon nanotubes. Applied Physics Letters, 1999. 74(21): p.
3152-54.
Recent Progress on Carbon Nanotube/Nanofiber Composites 45
[49] Forro, L. et al., Electronic and mechanical properties of carbon
nanotubes. Science and Application of Nanotubes, 2000: p. 297-320.
[50] Stefan Frank, P.P., Z. L. Wang, Walt A. de Heer*, Carbon Nanotube
Quantum Resistors. Science, 1998. 280: p. 1744-46.
[51] Khlobystov*c, D.A.B.a.A.N., Noncovalent interactions of molecules
with single walled carbon nanotubes. Chem. Soc. Rev., 2006. 35: p. 637-
659.
[52] Andrews R, W.M., Carbon nanotube polymer composites. Curr Opin
Solid State Mater Sci 2004. 8: p. 31-7.
[53] Hirsch*, A., Functionalization of Single-Walled Carbon Nanotubes.
Angew. Chem. Int. Ed., 2002. 41(11): p. 1853-59.
[54] Firme Iii, C.P. and P.R. Bandaru, Toxicity issues in the application of
carbon nanotubes to biological systems. Nanomedicine:
Nanotechnology, Biology and Medicine, 2010. 6(2): p. 245-256.
[55] S. Niyogi, M.A.H., H. Hu, B. Zhao, P. Bhowmik, R. Sen, M. E. Itkis,
and R. C. Haddon*, Chemistry of Single-Walled Carbon Nanotubes.
Acc. Chem. Res., 2002. 35: p. 1105-1113.
[56] H. Kuzmany a, A. Kukovecz b, F. Simona, M. Holzweber a, Ch.
Kramberger a, T. Pichler c, Functionalization of carbon nanotubes.
Synthetic Metals, 2004. 141: p. 113-122.
[57] Spitalsky, Z. et al., Carbon nanotube-polymer composites: Chemistry,
processing, mechanical and electrical properties. Progress in Polymer
Science, 2010. 35(3): p. 357-401.
[58] Ravin Narain, A.H., Lynsay Lane, Modification of Carboxyl-
Functionalized Single-Walled Carbon Nanotubes with Biocompatible,
Water-Soluble Phosphorylcholine and Sugar-Based Polymers:
Bioinspired Nanorods. J Polym Sci A Polym Chem, 2006. 44: p. 6558–
68.
[59] Wang, M., K.P. Pramoda, and S.H. Goh, Enhancement of interfacial
adhesion and dynamic mechanical properties of poly(methyl
methacrylate)/multi-walled carbon nanotube composites with amine-
terminated poly(ethylene oxide). Carbon, 2006. 44(4): p. 613-617.
[60] Touhara H, I.J., Mizuno T. et al., Fluorination of cup-stacked carbon
nanotubes, structure and properties. Fluorine Chem 2002. 114: p. 181-8.
[61] Wei Zhang, J.K.S., Minglin Ma, Emily Y. Tsui, Stefanie A. Sydlik,
Gregory C. Rutledge, Timothy M. Swager, Modular Functionalization
of Carbon Nanotubes and Fullerenes. J. Am. Chem. Soc., 2009. 131: p.
8446–8454.
A. K. Haghi 46
[62] Peng He, Y.G., Jie Lian, Lumin Wang, Dong Qian, Jian Zhao, Wei
Wang, Mark J. Schulz, Xing Ping Zhou, Donglu Shi, Surface
modification and ultrasonication effect on the mechanical properties of
carbon nanofiber/polycarbonate composites. Composites Part A:
Applied Science and Manufacturing, 2006. 37(9): p. 1270-1275.
[63] Abu Bakar Sulong, C.H.A., Rozli Zulkifli, Mohd Roslee Othman,
Joohyuk Park, A Comparison of Defects Produced on Oxidation of
Carbon Nanotubes by Acid and UV Ozone Treatment. European
Journal of Scientific Research, 2009. 33(2): p. 295-304.
[64] Wang, C. et al., Polymers containing fullerene or carbon nanotube
structures. Progress in Polymer Science, 2004. 29(11): p. 1079-1141.
[65] Rausch, J., R.-C. Zhuang, and E. Mäder, Surfactant assisted dispersion
of functionalized multi-walled carbon nanotubes in aqueous media.
Composites Part A: Applied Science and Manufacturing, 2010. 41(9): p.
1038-1046.
[66] Sahoo, N.G. et al., Polymer nanocomposites based on functionalized
carbon nanotubes. Progress in Polymer Science, 2010. 35(7): p. 837-
867.
[67] Zheng, D., X. Li, and J. Ye, Adsorption and release behavior of bare and
DNA-wrapped-carbon nanotubes on self-assembled monolayer surface.
Bioelectrochemistry, 2009. 74(2): p. 240-245.
[68] Xiaoke Zhang, L.M., Qinghua Lu, Cell Behaviors on Polysaccharide-
Wrapped Single-Wall Carbon Nanotubes: A Quantitative Study of the
Surface Properties of Biomimetic Nanofibrous Scaffolds. ACS Nano,
2009. 10: p. 3200-6
[69] Wang, H., Dispersing carbon nanotubes using surfactants. Current
Opinion in Colloid & Interface Science, 2009. 14(5): p. 364-371.
[70] Schlüter, A.D., A. Hirsch, and O. Vostrowsky, Functionalization of
Carbon Nanotubes, in Functional Molecular Nanostructures. 2005,
Springer Berlin / Heidelberg. p. 193-237.
[71] Peng-Cheng Ma, N.A.S., Gad Marom, Jang-Kyo Kim, Dispersion and
functionalization of carbon nanotubes for polymer-based
nanocomposites: A review. Composites Part A: Applied Science and
Manufacturing, 2010. 41(10): p. 1345-1367.
[72] Mottaghitalab, V., G.M. Spinks, and G.G. Wallace, The influence of
carbon nanotubes on mechanical and electrical properties of polyaniline
fibers. Synthetic Metals, 2005. 152(1-3): p. 77-80.
[73] Cheung, W. et al., DNA and carbon nanotubes as medicine. Advanced
Drug Delivery Reviews 2010. 62: p. 633–649.
Recent Progress on Carbon Nanotube/Nanofiber Composites 47
[74] Sara Piovesan, P.A.C., James R. Smith, Dimitrios G. Fatouros and
Marta Roldo, Novel biocompatible chitosan decorated single-walled
carbon nanotubes (SWNTs) for biomedical applications: theoretical and
experimental investigations. Physical Chemistry Chemical Physics,
2010. 12(48): p. 15636-15643.
[75] Jian Chen, † Haiying Liu,‡ Wayne A. Weimer,† Mathew D. Halls,†
David H. Waldeck,‡ and and G.C. Walker‡, Noncovalent Engineering
of Carbon Nanotube Surfaces by Rigid, Functional Conjugated
Polymers. J. AM. CHEM. SOC., 2002. 124: p. 9034-35.
[76] Vamvakaki, V., M. Fouskaki, and N. Chaniotakis, Electrochemical
Biosensing Systems Based on Carbon Nanotubes and Carbon
Nanofibers. Analytical Letters, 2007. 40: p. 2271-87.
[77] Kang, Y. et al., On the spontaneous encapsulation of proteins in carbon
nanotubes. Biomaterials, 2009. 30(14): p. 2807-2815.
[78] Harrison, B.S. and A. Atala, Carbon nanotube applications for tissue
engineering. Biomaterials, 2007. 28(2): p. 344-353.
[79] Winey*, M.M.a.K.I., Polymer Nanocomposites Containing Carbon
Nanotubes. Macromolecules, 2006. 39: p. 5194-5205.
[80] P. M. Ajayan, O.S., C. Colliex, D. Trauth, Aligned carbon nanotube
arrays formed by cutting a polymer resin-nanotube composite. Science,
1994. 265: p. 1212-1214.
[81] Liu, P., Modifications of carbon nanotubes with polymers. European
Polymer Journal, 2005. 41(11): p. 2693-2703.
[82] Manchado, M.A.L. et al., Thermal and mechanical properties of single-
walled carbon nanotubes-polypropylene composites prepared by melt
processing. Carbon, 2005. 43(7): p. 1499-1505.
[83] Varadan2, Q.a.V.K., Stability analysis of carbon nanotubes via
continuum models. Smart Mater. Struct. , 2005. 14: p. 281-286.
[84] Materials Information, E., Fiber Reinforced Composites. 2004: CSA
Journal Division.
[85] Advani, S.G., Processing and properties of nanocomposites. 2006:
World Scientific Publishing Company
[86] C.-W. Nan, Z.S., Y. Lin, A simple model for thermal conductivity of
carbon nanotube-based composites. Chemical Physics Letters, 2003.
375(5-6): p. 666-669.
[87] Coleman, J.N. et al., Small but strong: A review of the mechanical
properties of carbon nanotube-polymer composites. Carbon, 2006.
44(9): p. 1624-1652.
A. K. Haghi 48
[88] Wagner HD, L.O., Feldman Y, Tenne R., Stress-induced fragmentation
of multi-wall carbon nanotubes in a polymer matrix. Applied Physics
Letters 1998. 72(2): p. 188–90.
[89] Wang, Q. et al., The effects of CNT alignment on electrical conductivity
and mechanical properties of SWNT/epoxy nanocomposites.
Composites Science and Technology, 2008. 68(7-8): p. 1644-1648.
[90] Khan, U. et al., The effect of solvent choice on the mechanical
properties of carbon nanotube-polymer composites. Composites Science
and Technology, 2007. 67(15-16): p. 3158-3167.
[91] Allaoui, A. et al., Mechanical and electrical properties of a
MWNT/epoxy composite. Composites Science and Technology, 2002.
62(15): p. 1993-1998.
[92] Esawi, A.M.K. and M.M. Farag, Carbon nanotube reinforced
composites: Potential and current challenges. Materials & Design, 2007.
28(9): p. 2394-2401.
[93] K. Kamaras, M.E.I., H. Hu, B. Zhao, R. C. Haddon†, Covalent Bond
Formation to a Carbon Nanotube Metal. Science, 2003. 301(5639): p.
1501.
[94] Shenogin, S. et al., Effect of chemical functionalization on thermal
transport of carbon nanotube composites. Applied Physics Letters, 2004.
85(12): p. 2229-2231.
[95] Rebecca A. MacDonald, B.F.L., Gunaranjan Viswanathan, Pulickel M.
Ajayan, Jan P. Stegemann, Collagen–carbon nanotube composite
materials as scaffolds in tissue engineering. Journal of Biomedical
Materials Research Part A, 2005. 74A(3): p. 489-496.
[96] Suryasarathi Bose, R.A.K., Paula Moldenaers, Assessing the strengths
and weaknesses of various types of pre-treatments of carbon nanotubes
on the properties of polymer/carbon nanotubes composites: A critical
review. Polymer, 2010 51(5): p. 975-993.
[97] Gojny, F.H. et al., Evaluation and identification of electrical and thermal
conduction mechanisms in carbon nanotube/epoxy composites.
Polymer, 2006. 47(6): p. 2036-2045.
[98] Tosun, Z. and P.S. McFetridge, A composite SWNT–collagen matrix:
characterization and preliminary assessment as a conductive peripheral
nerve regeneration matrix. J. Neural Eng, 2010. 7: p. (10pp).
[99] Wang, S.-F. et al., Preparation and Mechanical Properties of
Chitosan/Carbon Nanotubes Composites. Biomacromolecules 2005. 6:
p. 3067-3072.
Recent Progress on Carbon Nanotube/Nanofiber Composites 49
[100] Liu, Y.-L., W.-H. Chen, and Y.-H. Chang, Preparation and properties of
chitosan/carbon nanotube nanocomposites using poly(styrene sulfonic
acid)-modified CNTs. Carbohydrate Polymers, 2009. 76(2): p. 232-238.
[101] Spinks, G.M. et al., Mechanical properties of chitosan/CNT microfibers
obtained with improved dispersion. Sensors and Actuators B: Chemical,
2006. 115(2): p. 678-684.
[102] Gandhi, M. et al., Post-spinning modification of electrospun nanofiber
nanocomposite from Bombyx mori silk and carbon nanotubes. Polymer,
2009. 50: p. 1918–1924.
[103] Rahatekar, S.S. et al., Solution spinning of cellulose carbon nanotube
composites using room temperature ionic liquids. Polymer, 2009.
50(19): p. 4577-4583.
[104] Zhang, H. et al., Regenerated-Cellulose/Multi-walled-Carbon-Nanotube
Composite Fibers with Enhanced Mechanical Properties Prepared with
the Ionic Liquid 1-Allyl-3-methylimidazolium Chloride. Adv. Mater.,
2007. 19: p. 698–704.
[105] Lu, P. and Y.-L. Hsieh, Multi-walled Carbon Nanotube (MWCNT)
Reinforced Cellulose Fibers by Electrospinning. Applied Matterials &
Interfaces, 2010. 2(8): p. 2413–2420.
[106] Wang, Y. and J.T.W. Yeow, A Review of Carbon Nanotubes-Based Gas
Sensors. Journal of Sensors 2009. 2009: p. 1-24.
[107] Wenrong Yang1, Pall Thordarson2, J Justin Gooding3, and S.P.R.a.F.
Braet1, Carbon nanotubes for biological and biomedical applications.
Nanotechnology 2007. 18(412001): p. (12pp).
[108] Wang*, J., Carbon-Nanotube Based Electrochemical Biosensors: A
Review. Electroanalysis 2005. 17(1): p. 7-14.
[109] Foldvari, M. and M. Bagonluri, Carbon nanotubes as functional
excipients for nanomedicines: II. Drug delivery and biocompatibility
issues. Nanomedicine: Nanotechnology, Biology and Medicine, 2008.
4(3): p. 183-200.
[110] Belluccia, S. et al., CNT composites for aerospace applications. Journal
of Experimental Nanoscience,, 2007. 2(3): p. 193–206.
[111] Inpil Kang a, Y.Y.H.a., Jay H. Kim b, Jong Won Lee d, Ramanand
Gollapudi a, et al., Introduction to carbon nanotube and nanofiber smart
materials Composites: Part B 2006. 37: p. 382–394.
[112] Mottaghitalab, V., G.M. Spinks, and G.G. Wallace, The development
and characterisation of polyaniline--single walled carbon nanotube
composite fibres using 2-acrylamido-2 methyl-1-propane sulfonic acid
A. K. Haghi 50
(AMPSA) through one step wet spinning process. Polymer, 2006.
47(14): p. 4996-5002.
[113] Wang, C.Y. et al., Polyaniline and polyaniline-carbon nanotube
composite fibres as battery materials in ionic liquid electrolyte. Journal
of Power Sources, 2007. 163(2): p. 1105-1109.
[114] Mottaghitalab, V. et al., Polyaniline fibres containing single walled
carbon nanotubes: Enhanced performance artificial muscles. Synthetic
Metals, 2006. 156(11-13): p. 796-803.
[115] Yit Thai Ong, A.L.A., Sharif Hussein Sharif Zein and Soon Huat Tan*,
A review on carbon nanotubes in an environmental protection and green
engineering perspective. Brazilian Journal of Chemical Engineering,
2010. 27(02): p. 227 - 242.
[116] N. S. Sariciftci, L.S., A. J. Heeger, F. Wudi, Photoinduced Electron
Transfer from a Conducting Polymer to Buckminsterfullerene. Science,
1992. 258: p. 1474-78.
[117] Harris*, P.J.F., Carbon nanotube composites. International Materials
Reviews, 2004. 49(1): p. 31-43.
[118] Azeredo, H.M.C.d., Nanocomposites for food packaging applications.
Food Research International, 2009. 42(9): p. 1240-1253.
[119] Tran X. Phuoc, M.M., Ruey-Hung Chen, Viscosity and thermal
conductivity of nanofluids containing multi-walled carbon nanotubes
stabilized by chitosan. International Journal of Thermal Sciences, 2011.
50(1): p. 12-18.
[120] Zhang M, S.A., Gorski W., Carbon nanotube-chitosan system for
electrochemical sensing based on dehydrogenase enzymes. Anal Chem,
2004. 76(17): p. 5045-50.
[121] Liu, Y. et al., The direct electron transfer of glucose oxidase and glucose
biosensor based on carbon nanotubes/chitosan matrix. Biosensors and
Bioelectronics, 2005. 21(6): p. 984-988.
[122] Tkac, J., J.W. Whittaker, and T. Ruzgas, The use of single-walled
carbon nanotubes dispersed in a chitosan matrix for preparation of a
galactose biosensor. Biosensors and Bioelectronics, 2007. 22(8): p.
1820-1824.
[123] Tsai, Y.-C., S.-Y. Chen, and H.-W. Liaw, Immobilization of lactate
dehydrogenase within multi-walled carbon nanotube-chitosan
nanocomposite for application to lactate biosensors. Sensors and
Actuators B: Chemical, 2007. 125(2): p. 474-481.
[124] Zhou, Y., H. Yang, and H.-Y. Chen, Direct electrochemistry and
reagentless biosensing of glucose oxidase immobilized on chitosan
Recent Progress on Carbon Nanotube/Nanofiber Composites 51
wrapped single-walled carbon nanotubes. Talanta, 2008. 76(2): p. 419-
423.
[125] Li, J. et al., DNA biosensor based on chitosan film doped with carbon
nanotubes. Analytical Biochemistry, 2005. 346(1): p. 107-114.
[126] Soledad Bollo, a.N.F.F., b Gustavo A. Rivasb, Electrooxidation of DNA
at Glassy Carbon Electrodes Modified with Multi-wall Carbon
Nanotubes Dispersed in Chitosan. Electroanalysis, 2007. 19(7-8): p.
833 – 840.
[127] Zeng, Y. et al., Electrochemical determination of bromide at a multi-
wall carbon nanotubes-chitosan modified electrode. Electrochimica
Acta, 2005. 51(4): p. 649-654.
[128] Qian, L. and X. Yang, Composite film of carbon nanotubes and chitosan
for preparation of amperometric hydrogen peroxide biosensor. Talanta,
2006. 68(3): p. 721-727.
[129] Liu, Y. et al., Facile preparation of amperometric laccase biosensor with
multi-function based on the matrix of carbon nanotubes-chitosan
composite. Biosensors and Bioelectronics, 2006. 21(12): p. 2195-2201.
[130] Naficy, S. et al., Modulated release of dexamethasone from chitosan-
carbon nanotube films. Sensors and Actuators A: Physical, 2009.
155(1): p. 120-124.
[131] Yang, J. et al., Growth of apatite on chitosan-multi-wall carbon
nanotube composite membranes. Applied Surface Science, 2009.
255(20): p. 8551-8555.
[132] Kaushik, A. et al., Carbon nanotubes -- chitosan nanobiocomposite for
immunosensor. Thin Solid Films, 2010. 519(3): p. 1160-1166.
[133] Yang, H. et al., Electrochemically deposited nanocomposite of chitosan
and carbon nanotubes for detection of human chorionic gonadotrophin.
Colloids and Surfaces B: Biointerfaces, 2011. 82(2): p. 463-469.
[134] Shao-Feng Wang, L.S., Wei-De Zhang,Yue-Jin Tong, Preparation and
Mechanical Properties of Chitosan/Carbon Nanotubes Composites.
Biomacromolecules 2005. 6: p. 3067-3072.
[135] W. Zheng, Y.Q.C., Y.F. Zheng Adsorption and electrochemistry of
hemoglobin on Chi-carbon nanotubes composite film. Applied Surface
Science, 2008. 255(2): p. 571-573.
[136] Changyu Tang, Q.Z., KeWang, Qiang Fua, Chaoliang Zhang, Water
transport behavior of chitosan porous membranes containing multi-
walled carbon nanotubes (MWNTs). Journal of Membrane Science,
2009. 337(1-2): p. 240-247.
A. K. Haghi 52
[137] Ying-Ling Liu, W.-H.C., Yu-Hsun Chang, Preparation and properties of
chitosan/carbon nanotube nanocomposites using poly(styrene sulfonic
acid)-modified CNTs. Carbohydrate Polymers, 2009. 76(2): p. 232-238.
[138] Mariana Emilia Ghica, R.P., Orlando Fatibello-Filho, Christopher M.A.
Brett, Application of functionalised carbon nanotubes immobilised into
chitosan films in amperometric enzyme biosensors. Sensors and
Actuators B: Chemical, 2009. 142(1): p. 308-315.
[139] Ju*[a], V.B.K.a.H., Binding of Acetylcholinesterase to Multi-wall
Carbon Nanotube-Cross- Linked Chitosan Composite for Flow-
Injection Amperometric Detection of an Organophosphorous
Insecticide. Chem. Eur. J. , 2006. 12: p. 1074 – 1080.
[140] Du, D. et al., An amperometric acetylthiocholine sensor based on
immobilization of acetylcholinesterase on a multi-wall carbon
nanotube–cross-linked chitosan composite. Anal Bioanal Chem 2007.
387: p. 1059–1065.
[141] Du, D. et al., Amperometric detection of triazophos pesticide using
acetylcholinesterase biosensor based on multi-wall carbon nanotube-
chitosan matrix. Sensors and Actuators B: Chemical, 2007. 127(2): p.
531-535.
[142] Mohamed Abdel Salam, M.I.M., Magdy Y.A. Abdelaal, Preparation and
characterization of multi-walled carbon nanotubes/chitosan
nanocomposite and its application for the removal of heavy metals from
aqueous solution. Journal of Alloys and Compounds, 2010. 509(5): p.
2582-2587.
[143] Yuyang Liu , J.T., Xianqiong Chen, J.H. Xin Decoration of carbon
nanotubes with chitosan. Carbon, 2005. 43(15): p. 3178-3180.
[144] Luo, X.-L. et al., Electrochemically deposited nanocomposite of
chitosan and carbon nanotubes for biosensor application. Chem.
Commun., 2005. DOI: 10.1039/b419197h: p. 2169–2171.
[145] Bin Ge, Y.T., Qingji Xie, Ming Ma, Shouzhuo Yao, Preparation of
chitosan-dopamine-multi-walled carbon nanotubes nanocomposite for
electrocatalytic oxidation and sensitive electroanalysis of NADH.
Sensors and Actuators B: Chemical, 2009. 137(2): p. 547-554.
[146] Yeong-Tarng Shieh, Y.-F.Y., Significant improvements in mechanical
property and water stability of chitosan by carbon nanotubes. European
Polymer Journal, 2006. 42(12): p. 3162-3170.
[147] Zigang Wu, W.F., Yiyu Feng, Qiang Liu, Xinhua Xu, Tohru Sekino,
Akihiko Fujii, Masanori Ozaki, Preparation and characterization of
Recent Progress on Carbon Nanotube/Nanofiber Composites 53
chitosan-grafted multi-walled carbon nanotubes and their
electrochemical properties. Carbon, 2007. 45(6): p. 1212-1218.
[148] Laura Carson, C.K.-B., Melisa Stewart, Aderemi Oki, Gloria Regisford,
Zhiping Luo, Vladimir I. Bakhmutov, Synthesis and characterization of
chitosan-carbon nanotube composites. Materials Letters, 2009. 63(6-7):
p. 617-620.
[149] Gang Ke, W.C.G., Chang Yu Tang, Zhen Hu, Wen Jie Guan, Dan Lin
Zeng, Feng Deng, Covalent modification of multi-walled carbon
nanotubes with a low molecular weight chitosan. Chinese Chemical
Letters, 2007. 18(3): p. 361-364.
[150] Baek, S.-H., B. Kim, and K.-D. Suh, Chitosan particle/multi-wall
carbon nanotube composites by electrostatic interactions. Colloids and
Surfaces A: Physicochemical and Engineering Aspects, 2008. 316(1-3):
p. 292-296.
[151] Qichao Zhao1, J.Y., Xunda Feng1, Zujin Shi3, Zigang Ge2 ∗, and
Zhaoxia Jin1 ∗, A Biocompatible Chitosan Composite Containing
Phosphotungstic Acid Modified Single-Walled Carbon Nanotubes.
Journal of Nanoscience and Nanotechnology, 2010. 10: p. 1-4.
[152] Jin-Gang Yu, K.-L.H., Jin-Chun Tang, Qiaoqin Yang, Du-Shu Huang,
Rapid microwave synthesis of chitosan modified carbon nanotube
composites. International Journal of Biological Macromolecules, 2009.
44(4): p. 316-319.
[153] Zheng-ke Wanga, b., Qiao-ling Hua, b ** and Lei Caia, b, CHITOSAN
AND MULTI-WALLED CARBON NANOTUBE COMPOSITE
RODS*. Chinese Journal of Polymer Science 2010. 28(5): p. 801-806.
[154] LI Xiao-bo, J.X.-y., Electrostatic layer-by-layer assembled multi-layer
films of chitosan and carbon nanotubes. New Carbon Materials, 2010.
25(3): p. 237-240.
[155] Cooney*, C.L.a.M.J., Conductive Macroporous Composite Chitosan-
Carbon Nanotube Scaffolds. Langmuir, 2008. 24: p. 7004-7010.
[156] Jennings, J.A., W.O. Haggard, and J.D. Bumgardner, Chitosan/carbon
nanotube composite scaffolds for drug delivery, in patent application
publication. 2010: United States. p. 1-8.
[157] Razal, J.M., K.J. Gilmore, and G.G. Wallace, Carbon Nanotube Biofiber
Formation in a Polymer-Free Coagulation Bath. Adv. Funct. Mater.,
2008. 18: p. 61–66.
[158] Carol Lynam, S.E.M., and Gordon G. Wallace, Carbon-nanotube
biofibers. Adv. Mater. , 2007. 19: p. 1244–1248.

A. K. Haghi 54
[159] Geoffrey M. Spinks, S.R.S., Gordon G. Wallace, Philip G. Whitten,
Mechanical properties of chitosan/CNT microfibers obtained with
improved dispersion. Sensors and Actuators B: Chemical, 2006. 115(2):
p. 678-684.
In: Advanced Nanotube and Nanofiber Materials ISBN: 978-1-62081-170-2
Editors: A. K. Haghi and G. E. Zaikov © 2012 Nova Science Publishers, Inc.
Chapter 3
THE MODERN EXPERIMENTAL
AND THEORETICAL ANALYSIS METHODS
OF PARTICULATE-FILLED
NANOCOMPOSITES STRUCTURE
G. V. Kozlov1, Yu. G. Yanovskii
1 and G. E. Zaikov
2
1Institute of Applied Mechanics of Russian Academy of Sciences,
Moscow, Russian Federation 2N.M. Emanuel Institute of Biochemical Physics
of Russian Academy of Sciences,
Moscow, Russian Federation
INTRODUCTION
The modern methods of experimental and theoretical analysis of polymer
materials structure and properties allow not only confirming earlier
propounded hypotheses but obtaining principally new results. Let us consider
some important problems of particulate-filled polymer nanocomposites, the
solution of which allows advancing substantially in these materials properties
understanding and prediction. Polymer nanocomposites multi-componentness
(multi-phaseness) requires their structural components quantitative
characteristics determination. In this aspect, interfacial regions play a
particular role, since it has been shown earlier that they are the same
reinforcing element in elastomeric nanocomposites as nanofiller actually [1].
G. V. Kozlov, Yu. G. Yanovskii and G. E. Zaikov 56
Therefore the knowledge of interfacial layer dimensional characteristics is
necessary for quantitative determination of one of the most important
parameters of polymer composites in general – their reinforcement degree [2,
3].
The aggregation of the initial nanofiller powder particles in more or less
large particles aggregates always occurs in the course of technological process
of making particulate-filled polymer composites in general [4] and elastomeric
nanocomposites in particular [5]. The aggregation process tells on composites
(nanocomposites) macroscopic properties [2-4]. For nanocomposites
nanofiller, aggregation process gains special significance, since its intensity
can be the one that nanofiller particles aggregates size exceeds 100 nm – the
value, which is assumed (though conditionally enough [6]) as an upper
dimensional limit for nanoparticle. In other words, the aggregation process can
result in the situation when primordially supposed nanocomposite ceases to be
one. Therefore at present, several methods exist, which allow to suppress
nanoparticles aggregation process [5, 7]. This also assumes the necessity of the
nanoparticles aggregation process quantitative analysis.
It is well known [1, 2] that in particulate-filled elastomeric
nanocomposites (rubbers), nanofiller particles form linear spatial structures
(“chains”). At the same time in polymer composites, filled with disperse
microparticles (microcomposites), particles (aggregates of particles) of filler
form a fractal network, which defines polymer matrix structure (analog of
fractal lattice in computer simulation) [4]. This results in different mechanisms
of polymer matrix structure formation in micro- and nanocomposites. If in the
first filler particles (aggregates of particles) fractal network availability results
to “disturbance” of polymer matrix structure, that is expressed in the increase
of its fractal dimension df [4], then in case of polymer nanocomposites at
nanofiller contents change the value df is not changed and equal to matrix
polymer structure fractal dimension [3]. As it has been expected, the change of
the composites of the indicated classes structure formation mechanism change
defines their properties, in particular, reinforcement degree [11, 12].
Therefore, nanofiller structure fractality strict proof and its dimension
determination are necessary.
As it is known [13, 14], the scale effects in general are often found at
different materials mechanical properties study. The dependence of failure
stress on grain size for metals (Holl-Petsch formula) [15] or of effective filling
degree on filler particles size in case of polymer composites [16] are examples
of such effect. The strong dependence of elasticity modulus on nanofiller
particles diameter is observed for particulate-filled elastomeric
The Modern Experimental and Theoretical Analysis Methods … 57
nanocomposites [5]. Therefore, it is necessary to elucidate the physical
grounds of nano- and micromechanical behaviour scale effect for polymer
nanocomposites.
At present, a disperse material wide list is known, which is able to
strengthen elastomeric polymer materials [5]. These materials are very diverse
on their surface chemical constitution, but particles small size is a common
feature for them. On the basis of this observation, the hypothesis was offered
that any solid material would strengthen the rubber at the condition, that it was
in a very dispersed state and it could be dispersed in polymer matrix. Edwards
[5] points out that filler particles small size is necessary and, probably, the
main requirement for reinforcement effect realization in rubbers. Using
modern terminology, one can say, that for rubbers reinforcement the nanofiller
particles, for which their aggregation process is suppressed as far as possible,
would be the most effective ones [3, 12]. Therefore, the theoretical analysis of
a nanofiller particles size influence on polymer nanocomposites reinforcement
is necessary.
Proceeding from the said above, the present work’s purpose is the solution
of the considered-above paramount problems with the help of modern
experimental and theoretical techniques on the example of particulate-filled
butadiene-styrene rubber.
EXPERIMENTAL
The made industrially butadiene-styrene rubber of mark SKS-30, which
contains 7.0-12.3 % cis- and 71.8-72.0 % trans-bonds, with density of 920-
930 kg/m3, was used as matrix polymer. This rubber is fully amorphous one.
Fullerene-containing mineral shungite of Zazhoginsk’s deposit consists of
~ 30 % globular amorphous metastable carbon and ~ 70 % high-disperse
silicate particles. Besides, industrially made technical carbon of mark № 220
was used as nanofiller. The technical carbon, nano- and microshugite particles
average size makes up 20, 40 and 200 nm, respectively. The indicated filler
content is equal to 37 mass %. Nano- and microdimensional disperse shungite
particles were prepared from industrially output material by the original
technology processing. The size and polydispersity analysis of the received in
milling process shungite particles was monitored with the aid of analytical
disk centrifuge (CPS Instruments, Inc., USA), allowing determination with
high precision size and distribution by the sizes within the range from 2 nm up
to 50 mcm.
G. V. Kozlov, Yu. G. Yanovskii and G. E. Zaikov 58
Nanostructure was studied on atomic-forced microscopes Nano-DST
(Pacific Nanotechnology, USA) and Easy Scan DFM (Nanosurf, Switzerland)
by semi-contact method in the force modulation regime. Atomic-force
microscopy results were processed with the help of specialized software
package SPIP (Scanning Probe Image Processor, Denmark). SPIP is a
powerful programmes package for processing of images, obtained on SPM,
AFM, STM, scanning electron microscopes, transmission electron micro-
scopes, interferometers, confocal microscopes, profilometers, optical micro-
scopes and so on. The given package possesses the whole functions number,
which is necessary at images precise analysis, in a number of which the
following ones are included:
the possibility of three-dimensional reflecting objects obtaining
distortions automatized leveling, including Z-error mistakes removal
for examination of separate elements and so on;
quantitative analysis of particles or grains, more than 40 parameters
can be calculated for each found particle or pore: area, perimeter,
mean diameter, the ratio of linear sizes of grain width to its height
distance between grains, coordinates of grain center of mass a.a. can
be presented in a diagram form or in a histogram form.
The tests on elastomeric nanocomposites nanomechanical properties were
carried out by a nanointentation method [17] on apparatus Nano Test 600
(Micro Materials, Great Britain) in load wide range from 0.01 mN up to 2.0
mN. Sample indentation was conducted in ten points with interval of 30 mcm.
The load was increased with constant rate up to the greatest given load
reaching (for the rate 0.05 mN/s-1 mN). The indentation rate was changed in
conformity with the greatest load value counting, that loading cycle should
take 20 s. The unloading was conducted with the same rate as loading. In the
given experiment, the “Berkovich indentor” was used with the angle at the top
of 65.3 and rounding radius of 200 nm. Indentations were carried out in the
checked load regime with preload of 0.001 mN.
Elasticity modulus calculation obtained in the experiment by
nanoindentation course dependences of load on indentation depth (strain) in
ten points for each sample at loads of 0.01, 0.02, 0.03, 0.05, 0.10, 0.50, 1.0 and
2.0 mN were processed according to Oliver-Pharr method [18].
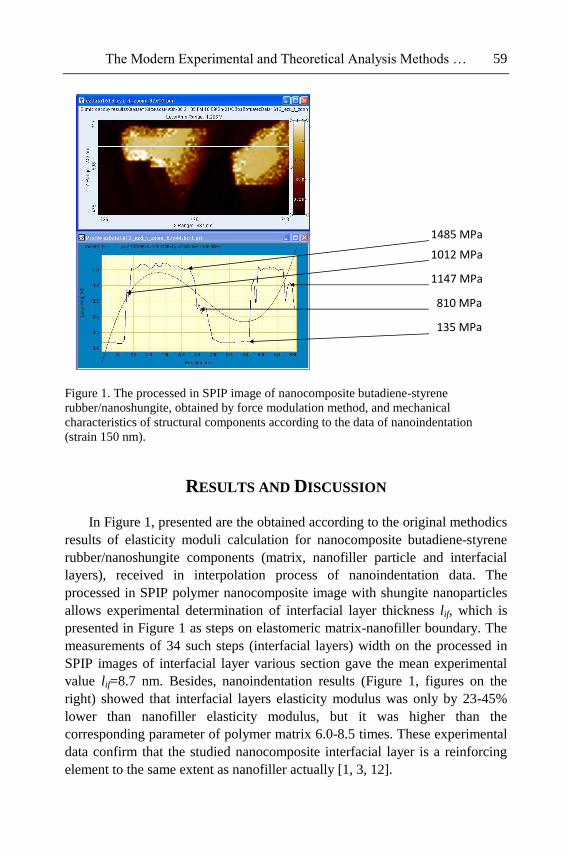
The Modern Experimental and Theoretical Analysis Methods … 59
Figure 1. The processed in SPIP image of nanocomposite butadiene-styrene
rubber/nanoshungite, obtained by force modulation method, and mechanical
characteristics of structural components according to the data of nanoindentation
(strain 150 nm).
RESULTS AND DISCUSSION
In Figure 1, presented are the obtained according to the original methodics
results of elasticity moduli calculation for nanocomposite butadiene-styrene
rubber/nanoshungite components (matrix, nanofiller particle and interfacial
layers), received in interpolation process of nanoindentation data. The
processed in SPIP polymer nanocomposite image with shungite nanoparticles
allows experimental determination of interfacial layer thickness lif, which is
presented in Figure 1 as steps on elastomeric matrix-nanofiller boundary. The
measurements of 34 such steps (interfacial layers) width on the processed in
SPIP images of interfacial layer various section gave the mean experimental
value lif=8.7 nm. Besides, nanoindentation results (Figure 1, figures on the
right) showed that interfacial layers elasticity modulus was only by 23-45%
lower than nanofiller elasticity modulus, but it was higher than the
corresponding parameter of polymer matrix 6.0-8.5 times. These experimental
data confirm that the studied nanocomposite interfacial layer is a reinforcing
element to the same extent as nanofiller actually [1, 3, 12].
Обработка 2мерного изображения в программе SPIP.
0,9 МПа (135 МПа)
7,65 МПа (1147 МПа)
5,4 МПа (810 МПа)
9,9 МПа (1485 МПа)
6,75 МПа (1012 МПа)
1485 MPa
1012 MPa
1147 MPa
810 MPa
135 MPa
G. V. Kozlov, Yu. G. Yanovskii and G. E. Zaikov 60
Let us fulfill further the value lif theoretical estimation according to the
two methods and compare these results with the ones obtained experimentally.
The first method simulates interfacial layer in polymer composites as a result
of interaction of two fractals – polymer matrix and nanofiller surface [19, 20].
In this case, there is a sole linear scale l, which defines these fractals
interpenetration distance [21]. Since nanofiller elasticity modulus is essentially
higher than the corresponding parameter for rubber (in the considered case –
11 times, see Figure 1), then the indicated interaction reduces to nanofiller
indentation in polymer matrix and then l=lif. In this case, it can be written [21]:
ddd
p
if
surf
a
Ral
/2
, (1)
where a is a lower linear scale of fractal behaviour, which is accepted for
polymers as equal to statistical segment length lst [22], Rp is a nanofiller
particle (more precisely, particles aggregates) radius, which for nanoshungite
is equal to ~ 84 nm [23], d is dimension of Euclidean space, in which fractal is
considered (it is obvious, that in our case d=3), dsurf is fractal dimension of
nanofiller particles aggregate surface.
The value lst is determined as follows [24]:
Cllst 0 , (2)
where l0 is the main chain skeletal bond length, which is equal to 0.154 nm for
both blocks of butadiene-styrene rubber [25], C is characteristic ratio, which
is a polymer chain statistical flexibility indicator [26] and is determined with
the help of the equation [22]:
2/1
129
C
STg
, (3)
where Tg is glass transition temperature, equal to 217 K for butadiene-styrene
rubber [3], S is macromolecule cross-sectional area, determined for the
mentioned rubber according to the additivity rule from the following
considerations. As it is known [27], the macromolecule diameter quadrate
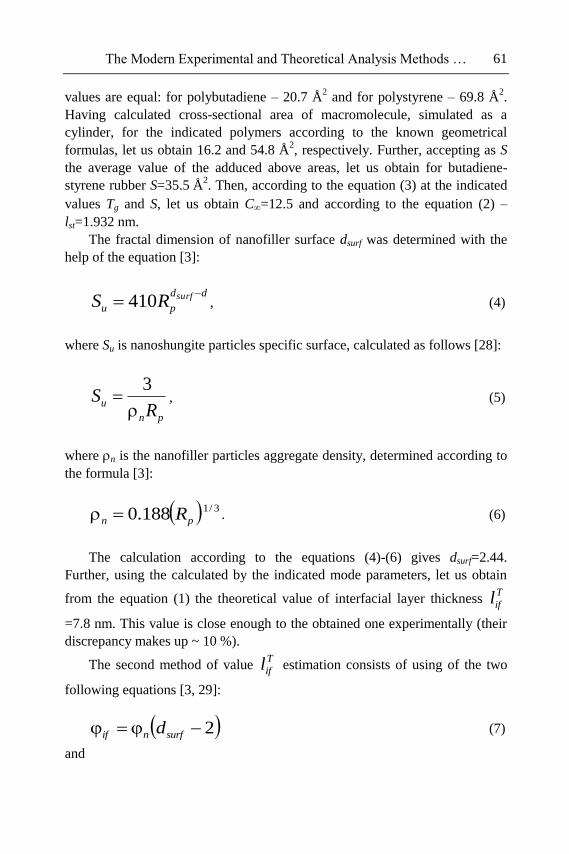
The Modern Experimental and Theoretical Analysis Methods … 61
values are equal: for polybutadiene – 20.7 Å2 and for polystyrene – 69.8 Å
2.
Having calculated cross-sectional area of macromolecule, simulated as a
cylinder, for the indicated polymers according to the known geometrical
formulas, let us obtain 16.2 and 54.8 Å2, respectively. Further, accepting as S
the average value of the adduced above areas, let us obtain for butadiene-
styrene rubber S=35.5 Å2. Then, according to the equation (3) at the indicated
values Tg and S, let us obtain C=12.5 and according to the equation (2) –
lst=1.932 nm.
The fractal dimension of nanofiller surface dsurf was determined with the
help of the equation [3]:
dd
pu
surfRS
410 , (4)
where Su is nanoshungite particles specific surface, calculated as follows [28]:
pn
uR
S
3
, (5)
where n is the nanofiller particles aggregate density, determined according to
the formula [3]:
3/1188.0 pn R . (6)
The calculation according to the equations (4)-(6) gives dsurf=2.44.
Further, using the calculated by the indicated mode parameters, let us obtain
from the equation (1) the theoretical value of interfacial layer thickness T
ifl
=7.8 nm. This value is close enough to the obtained one experimentally (their
discrepancy makes up ~ 10 %).
The second method of value T
ifl estimation consists of using of the two
following equations [3, 29]:
2 surfnif d (7)
and
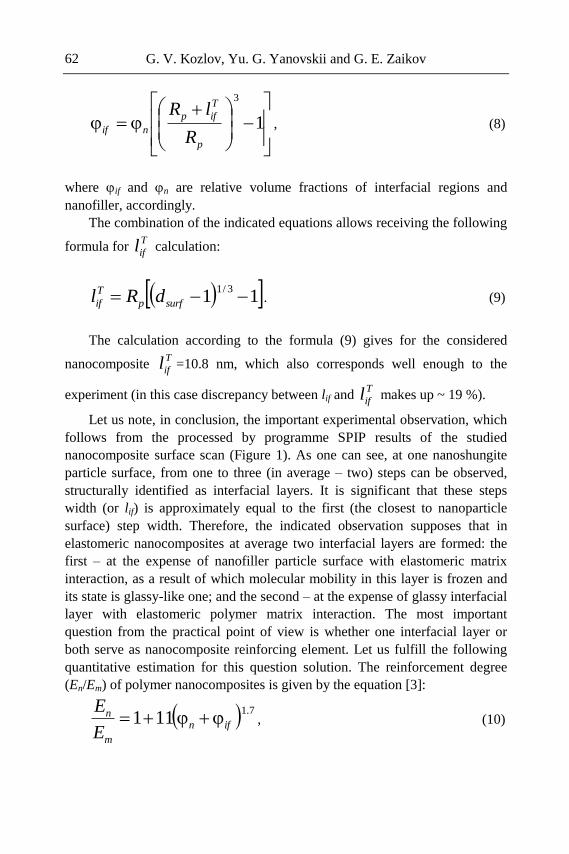
G. V. Kozlov, Yu. G. Yanovskii and G. E. Zaikov 62
1
3
p
T
ifp
nifR
lR, (8)
where if and n are relative volume fractions of interfacial regions and
nanofiller, accordingly.
The combination of the indicated equations allows receiving the following
formula for T
ifl calculation:
113/1 surfp
T
if dRl . (9)
The calculation according to the formula (9) gives for the considered
nanocomposite T
ifl =10.8 nm, which also corresponds well enough to the
experiment (in this case discrepancy between lif and T
ifl makes up ~ 19 %).
Let us note, in conclusion, the important experimental observation, which
follows from the processed by programme SPIP results of the studied
nanocomposite surface scan (Figure 1). As one can see, at one nanoshungite
particle surface, from one to three (in average – two) steps can be observed,
structurally identified as interfacial layers. It is significant that these steps
width (or lif) is approximately equal to the first (the closest to nanoparticle
surface) step width. Therefore, the indicated observation supposes that in
elastomeric nanocomposites at average two interfacial layers are formed: the
first – at the expense of nanofiller particle surface with elastomeric matrix
interaction, as a result of which molecular mobility in this layer is frozen and
its state is glassy-like one; and the second – at the expense of glassy interfacial
layer with elastomeric polymer matrix interaction. The most important
question from the practical point of view is whether one interfacial layer or
both serve as nanocomposite reinforcing element. Let us fulfill the following
quantitative estimation for this question solution. The reinforcement degree
(En/Em) of polymer nanocomposites is given by the equation [3]:
7.1111 ifn
m
n
E
E , (10)
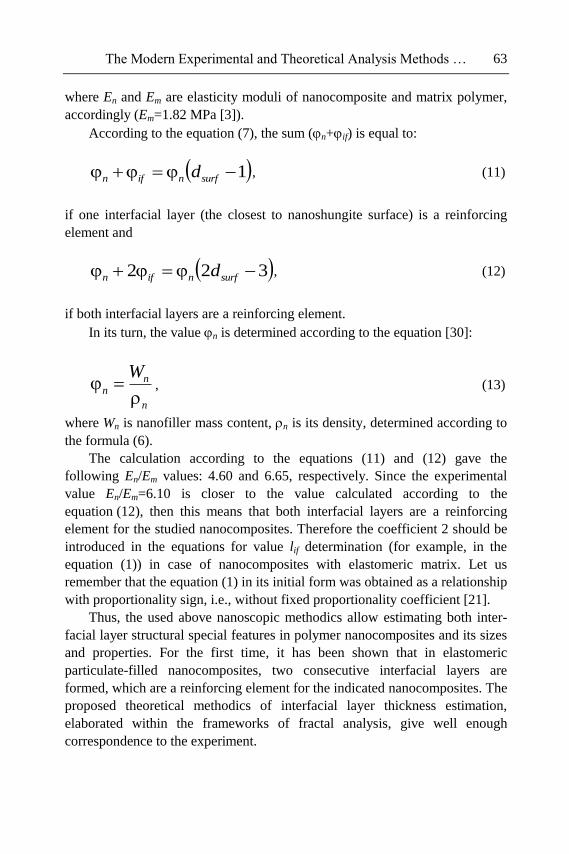
The Modern Experimental and Theoretical Analysis Methods … 63
where En and Em are elasticity moduli of nanocomposite and matrix polymer,
accordingly (Em=1.82 MPa [3]).
According to the equation (7), the sum (n+if) is equal to:
1 surfnifn d , (11)
if one interfacial layer (the closest to nanoshungite surface) is a reinforcing
element and
322 surfnifn d , (12)
if both interfacial layers are a reinforcing element.
In its turn, the value n is determined according to the equation [30]:
n
nn
W
, (13)
where Wn is nanofiller mass content, n is its density, determined according to
the formula (6).
The calculation according to the equations (11) and (12) gave the
following En/Em values: 4.60 and 6.65, respectively. Since the experimental
value En/Em=6.10 is closer to the value calculated according to the
equation (12), then this means that both interfacial layers are a reinforcing
element for the studied nanocomposites. Therefore the coefficient 2 should be
introduced in the equations for value lif determination (for example, in the
equation (1)) in case of nanocomposites with elastomeric matrix. Let us
remember that the equation (1) in its initial form was obtained as a relationship
with proportionality sign, i.e., without fixed proportionality coefficient [21].
Thus, the used above nanoscopic methodics allow estimating both inter-
facial layer structural special features in polymer nanocomposites and its sizes
and properties. For the first time, it has been shown that in elastomeric
particulate-filled nanocomposites, two consecutive interfacial layers are
formed, which are a reinforcing element for the indicated nanocomposites. The
proposed theoretical methodics of interfacial layer thickness estimation,
elaborated within the frameworks of fractal analysis, give well enough
correspondence to the experiment.
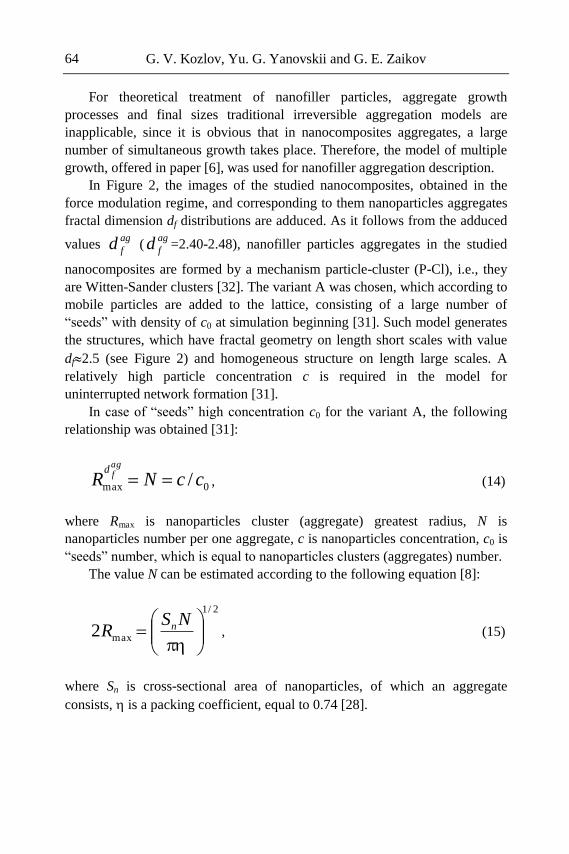
G. V. Kozlov, Yu. G. Yanovskii and G. E. Zaikov 64
For theoretical treatment of nanofiller particles, aggregate growth
processes and final sizes traditional irreversible aggregation models are
inapplicable, since it is obvious that in nanocomposites aggregates, a large
number of simultaneous growth takes place. Therefore, the model of multiple
growth, offered in paper [6], was used for nanofiller aggregation description.
In Figure 2, the images of the studied nanocomposites, obtained in the
force modulation regime, and corresponding to them nanoparticles aggregates
fractal dimension df distributions are adduced. As it follows from the adduced
values ag
fd (ag
fd =2.40-2.48), nanofiller particles aggregates in the studied
nanocomposites are formed by a mechanism particle-cluster (P-Cl), i.e., they
are Witten-Sander clusters [32]. The variant A was chosen, which according to
mobile particles are added to the lattice, consisting of a large number of
“seeds” with density of c0 at simulation beginning [31]. Such model generates
the structures, which have fractal geometry on length short scales with value
df2.5 (see Figure 2) and homogeneous structure on length large scales. A
relatively high particle concentration c is required in the model for
uninterrupted network formation [31].
In case of “seeds” high concentration c0 for the variant A, the following
relationship was obtained [31]:
0max / ccNRagf
d
, (14)
where Rmax is nanoparticles cluster (aggregate) greatest radius, N is
nanoparticles number per one aggregate, c is nanoparticles concentration, c0 is
“seeds” number, which is equal to nanoparticles clusters (aggregates) number.
The value N can be estimated according to the following equation [8]:
2/1
max2
NSR n
, (15)
where Sn is cross-sectional area of nanoparticles, of which an aggregate
consists, is a packing coefficient, equal to 0.74 [28].
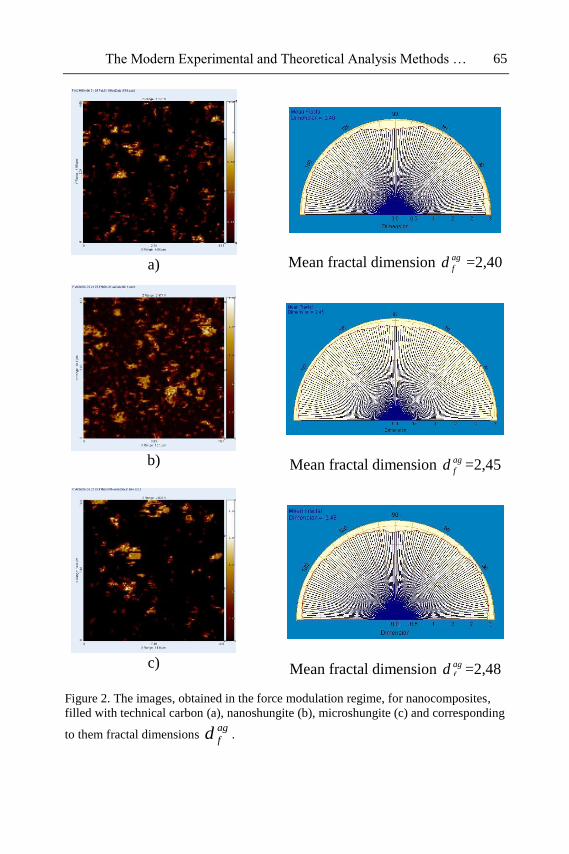
The Modern Experimental and Theoretical Analysis Methods … 65
Figure 2. The images, obtained in the force modulation regime, for nanocomposites,
filled with technical carbon (a), nanoshungite (b), microshungite (c) and corresponding
to them fractal dimensions ag
fd .
a)
Mean fractal dimension ag
fd =2,40
b)
Mean fractal dimension ag
fd =2,45
c)
Mean fractal dimension ag
fd =2,48
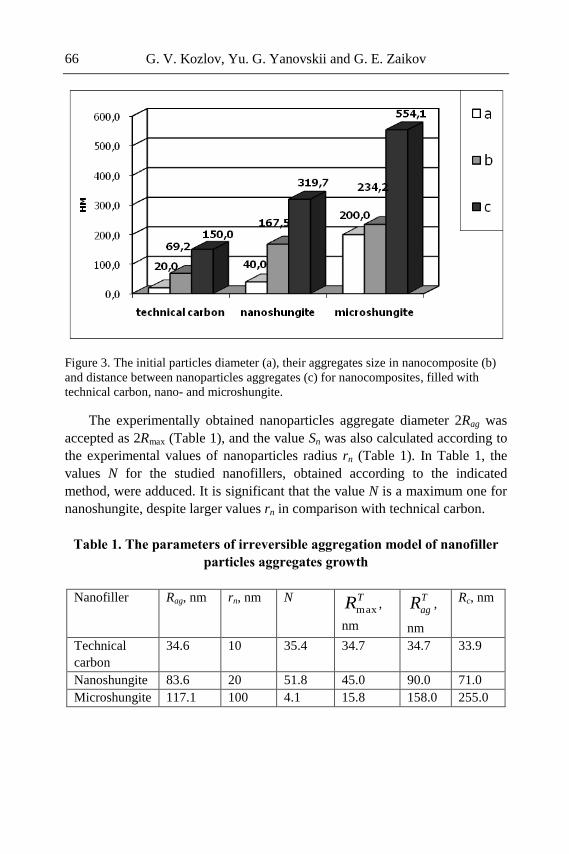
G. V. Kozlov, Yu. G. Yanovskii and G. E. Zaikov 66
Figure 3. The initial particles diameter (a), their aggregates size in nanocomposite (b)
and distance between nanoparticles aggregates (c) for nanocomposites, filled with
technical carbon, nano- and microshungite.
The experimentally obtained nanoparticles aggregate diameter 2Rag was
accepted as 2Rmax (Table 1), and the value Sn was also calculated according to
the experimental values of nanoparticles radius rn (Table 1). In Table 1, the
values N for the studied nanofillers, obtained according to the indicated
method, were adduced. It is significant that the value N is a maximum one for
nanoshungite, despite larger values rn in comparison with technical carbon.
Table 1. The parameters of irreversible aggregation model of nanofiller
particles aggregates growth
Nanofiller Rag, nm rn, nm N TRmax,
nm
T
agR ,
nm
Rc, nm
Technical
carbon
34.6 10 35.4 34.7 34.7 33.9
Nanoshungite 83.6 20 51.8 45.0 90.0 71.0
Microshungite 117.1 100 4.1 15.8 158.0 255.0
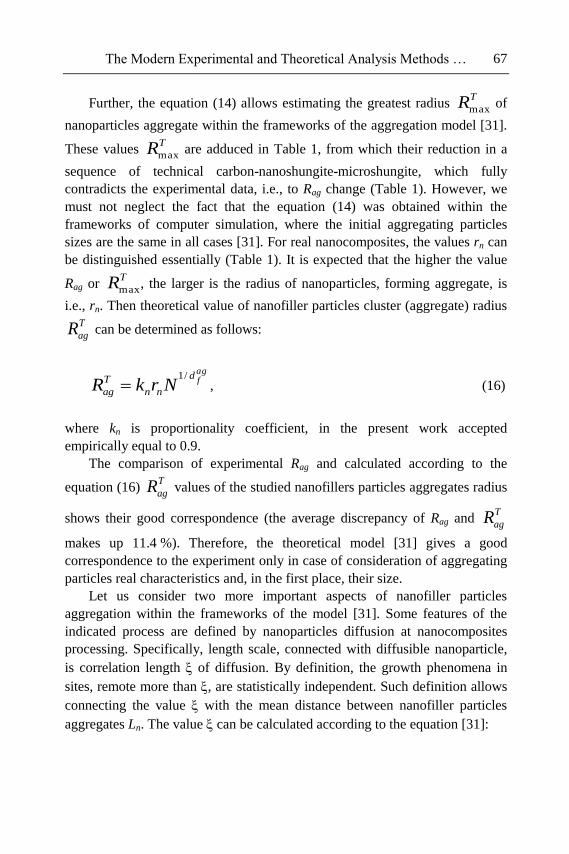
The Modern Experimental and Theoretical Analysis Methods … 67
Further, the equation (14) allows estimating the greatest radius TRmax
of
nanoparticles aggregate within the frameworks of the aggregation model [31].
These values TRmax
are adduced in Table 1, from which their reduction in a
sequence of technical carbon-nanoshungite-microshungite, which fully
contradicts the experimental data, i.e., to Rag change (Table 1). However, we
must not neglect the fact that the equation (14) was obtained within the
frameworks of computer simulation, where the initial aggregating particles
sizes are the same in all cases [31]. For real nanocomposites, the values rn can
be distinguished essentially (Table 1). It is expected that the higher the value
Rag or TRmax
, the larger is the radius of nanoparticles, forming aggregate, is
i.e., rn. Then theoretical value of nanofiller particles cluster (aggregate) radius
T
agR can be determined as follows:
agf
d
nn
T
ag NrkR/1
, (16)
where kn is proportionality coefficient, in the present work accepted
empirically equal to 0.9.
The comparison of experimental Rag and calculated according to the
equation (16) T
agR values of the studied nanofillers particles aggregates radius
shows their good correspondence (the average discrepancy of Rag and T
agR
makes up 11.4 %). Therefore, the theoretical model [31] gives a good
correspondence to the experiment only in case of consideration of aggregating
particles real characteristics and, in the first place, their size.
Let us consider two more important aspects of nanofiller particles
aggregation within the frameworks of the model [31]. Some features of the
indicated process are defined by nanoparticles diffusion at nanocomposites
processing. Specifically, length scale, connected with diffusible nanoparticle,
is correlation length of diffusion. By definition, the growth phenomena in
sites, remote more than , are statistically independent. Such definition allows
connecting the value with the mean distance between nanofiller particles
aggregates Ln. The value can be calculated according to the equation [31]:
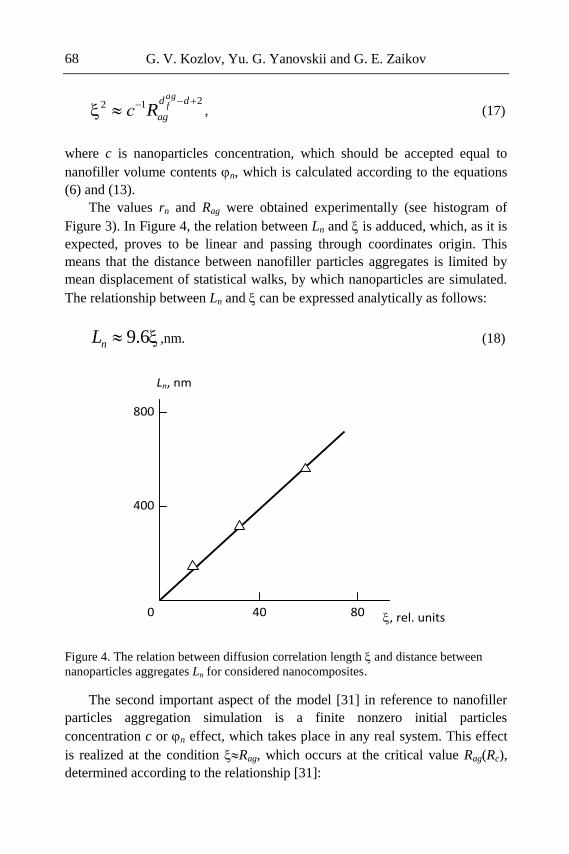
G. V. Kozlov, Yu. G. Yanovskii and G. E. Zaikov 68
212 dd
ag
agfRс , (17)
where c is nanoparticles concentration, which should be accepted equal to
nanofiller volume contents n, which is calculated according to the equations
(6) and (13).
The values rn and Rag were obtained experimentally (see histogram of
Figure 3). In Figure 4, the relation between Ln and is adduced, which, as it is
expected, proves to be linear and passing through coordinates origin. This
means that the distance between nanofiller particles aggregates is limited by
mean displacement of statistical walks, by which nanoparticles are simulated.
The relationship between Ln and can be expressed analytically as follows:
6.9nL ,nm. (18)
Figure 4. The relation between diffusion correlation length and distance between
nanoparticles aggregates Ln for considered nanocomposites.
The second important aspect of the model [31] in reference to nanofiller
particles aggregation simulation is a finite nonzero initial particles
concentration c or n effect, which takes place in any real system. This effect
is realized at the condition Rag, which occurs at the critical value Rag(Rc),
determined according to the relationship [31]:
800
400
40
Ln, nm
, rel. units 80 0
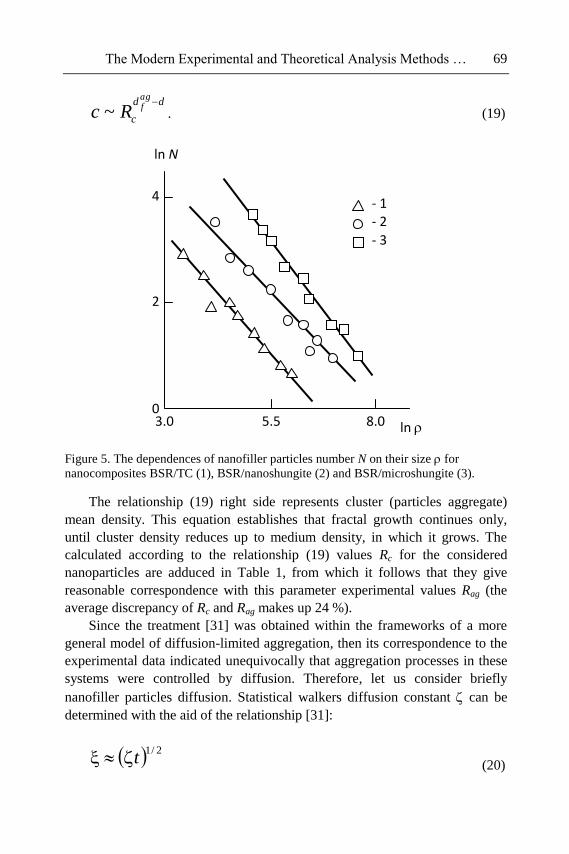
The Modern Experimental and Theoretical Analysis Methods … 69
dd
c
agfRc
~ . (19)
Figure 5. The dependences of nanofiller particles number N on their size for
nanocomposites BSR/TC (1), BSR/nanoshungite (2) and BSR/microshungite (3).
The relationship (19) right side represents cluster (particles aggregate)
mean density. This equation establishes that fractal growth continues only,
until cluster density reduces up to medium density, in which it grows. The
calculated according to the relationship (19) values Rc for the considered
nanoparticles are adduced in Table 1, from which it follows that they give
reasonable correspondence with this parameter experimental values Rag (the
average discrepancy of Rc and Rag makes up 24 %).
Since the treatment [31] was obtained within the frameworks of a more
general model of diffusion-limited aggregation, then its correspondence to the
experimental data indicated unequivocally that aggregation processes in these
systems were controlled by diffusion. Therefore, let us consider briefly
nanofiller particles diffusion. Statistical walkers diffusion constant can be
determined with the aid of the relationship [31]:
(20)
4
2
5.5
ln N
ln 8.0 3.0 0
- 1 - 2
- 3
2/1t
G. V. Kozlov, Yu. G. Yanovskii and G. E. Zaikov 70
where t is walk duration.
The equation (20) supposes (at t=const) increase in a number technical
carbon-nanoshungite-microshungite as 196-1069-3434 relative units, i.e.,
diffusion intensification at diffusible particles size growth. At the same time,
diffusivity D for these particles can be described by the well-known Einstein’s
relationship [33]:
nr
kTD
6, (21)
where k is Boltzmann constant, T is temperature, is medium viscosity, is
numerical coefficient, which further is accepted equal to 1.
In its turn, the value can be estimated according to the equation [34]:
n
n
1
5.21
0
, (22)
where 0 and are initial polymer and its mixture with nanofiller viscosity,
accordingly.
The calculation according to the equations (21) and (22) shows that within
the indicated above nanofillers number the value D changes as 1.32-1.14-0.44
relative units, i.e., reduces in three times, which was expected. This apparent
contradiction is due to the choice of the condition t=const (where t is
nanocomposite production duration) in the equation (20). In real conditions,
the value t is restricted by nanoparticle contact with growing aggregate and
then instead of t, the value t/c0 should be used, where c0 is the seeds
concentration, determined according to the equation (14). In this case, the
value for the indicated nanofillers changes as 0.288-0.118-0.086, i.e., it
reduces in 3.3 times, which corresponds fully to the calculation according to
Einstein’s relationship (the equation (21)). This means that nanoparticles
diffusion in polymer matrix obeys classical laws of Newtonian rheology [33].
Thus, the disperse nanofiller particles aggregation in elastomeric matrix
can be described theoretically within the frameworks of a modified model of
irreversible aggregation particle-cluster. The obligatory consideration of nano-
filler initial particles size is a feature of the indicated model application to real
systems description. The indicated particles diffusion in polymer matrix obeys
classical laws of Newtonian liquids hydrodynamics. The offered approach
The Modern Experimental and Theoretical Analysis Methods … 71
allows predicting nanoparticles aggregates final parameters as a function of the
initial particles size, their contents and other factors number.
At present, there are several methods of filler structure (distribution)
determination in polymer matrix, both experimental [10, 35] and theoretical
[4]. All the indicated methods describe this distribution by fractal dimension
Dn of filler particles network. However, correct determination of any object
fractal (Hausdorff) dimension includes three obligatory conditions. The first
from them is the indicated above determination of fractal dimension numerical
magnitude, which should not be equal to object topological dimension. As it is
known [36], any real (physical) fractal possesses fractal properties within a
certain scales range. Therefore, the second condition is the evidence of object
self-similarity in this scales range [37]. And at last, the third condition is the
correct choice of measurement scales range itself. As it has been shown in
papers [38, 39], the minimum range should exceed at any rate one self-
similarity iteration.
The first method of dimension Dn experimental determination uses the
following fractal relationship [40, 41]:
ln
ln NDn , (23)
where N is a number of particles with size .
Particles sizes were established on the basis of atomic-power microscopy
data (see Figure 2). For each, from the three studied nanocomposites, no less
than 200 particles were measured, the sizes of which were united into ten
groups, and mean values N and were obtained. The dependences N() in
double logarithmic coordinates were plotted, which proved to be linear, and
the values Dn were calculated according to their slope (see Figure 5). It is
obvious that at such approach fractal dimension Dn is determined in two-
dimensional Euclidean space, whereas real nanocomposite should be
considered in three-dimensional Euclidean space. The following relationship
can be used for Dn re-calculation for the case of three-dimensional space [42]:
2
2223
2/12
DdDd
D , (24)
G. V. Kozlov, Yu. G. Yanovskii and G. E. Zaikov 72
where D3 and D2 are corresponding fractal dimensions in three- and two-
dimensional Euclidean spaces, d=3.
The calculated according to the indicated method dimensions Dn are
adduced in Table 2. As it follows from the data of this table, the values Dn for
the studied nanocomposites are varied within the range of 1.10-1.36, i.e., they
characterize more or less branched linear formations (“chains”) of nanofiller
particles (aggregates of particles) in elastomeric nanocomposite structure. Let
us remember that for particulate-filled composites polyhydroxiether/graphite,
the value Dn changes within the range of ~ 2.30-2.80 [4, 10], i.e., for these
materials, filler particles network is a bulk object but not a linear one [36].
Table 2. The dimensions of nanofiller particles (aggregates of particles)
structure in elastomeric nanocomposites
Nanocomposite Dn, the
equation
(23)
Dn, the
equation
(25)
d0 dsurf n Dn, the
equation
(29)
BSR/TC 1.19 1.17 2.86 2.64 0.48 1.11
BSR/nanoshungite 1.10 1.10 2.81 2.56 0.36 0.78
BSR/microshungite 1.36 1.39 2.41 2.39 0.32 1.47
Another method of Dn experimental determination uses the so-called
“quadrates method” [43]. Its essence consists of the following. On the
enlarged nanocomposite microphotograph (see Figure 2), a net of quadrates
with quadrate side size i, changing from 4.5 up to 24 mm with constant ratio
i+1/i=1.5, is applied and then quadrates number Ni, into which nanofiller
particles hit (fully or partly), is counted up. Five arbitrary net positions
concerning microphotograph were chosen for each measurement. If nanofiller
particles network is a fractal, then the following relationship should be
fulfilled [43]:
2/
~ nD
ii SN
, (25)
where Si is quadrate area, which is equal to 2
i .
In Figure 6, the dependences of Ni on Si in double logarithmic coordinates
for the three studied nanocomposites, corresponding to the relationship (25), is
adduced. As one can see, these dependences are linear, which allows
determining the value Dn from their slope. The determined according to the
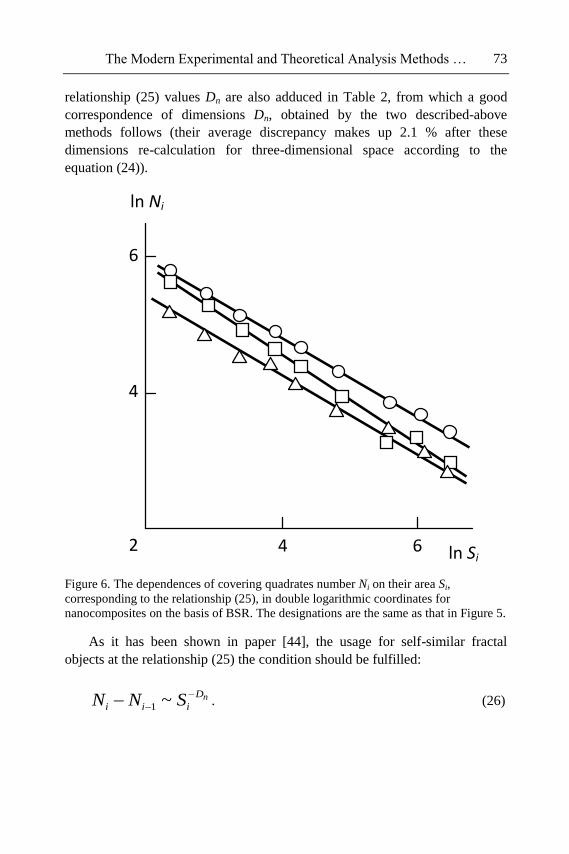
The Modern Experimental and Theoretical Analysis Methods … 73
relationship (25) values Dn are also adduced in Table 2, from which a good
correspondence of dimensions Dn, obtained by the two described-above
methods follows (their average discrepancy makes up 2.1 % after these
dimensions re-calculation for three-dimensional space according to the
equation (24)).
Figure 6. The dependences of covering quadrates number Ni on their area Si,
corresponding to the relationship (25), in double logarithmic coordinates for
nanocomposites on the basis of BSR. The designations are the same as that in Figure 5.
As it has been shown in paper [44], the usage for self-similar fractal
objects at the relationship (25) the condition should be fulfilled:
nD
iii SNN
~1. (26)
6
4
4
ln Ni
ln Si 6 2
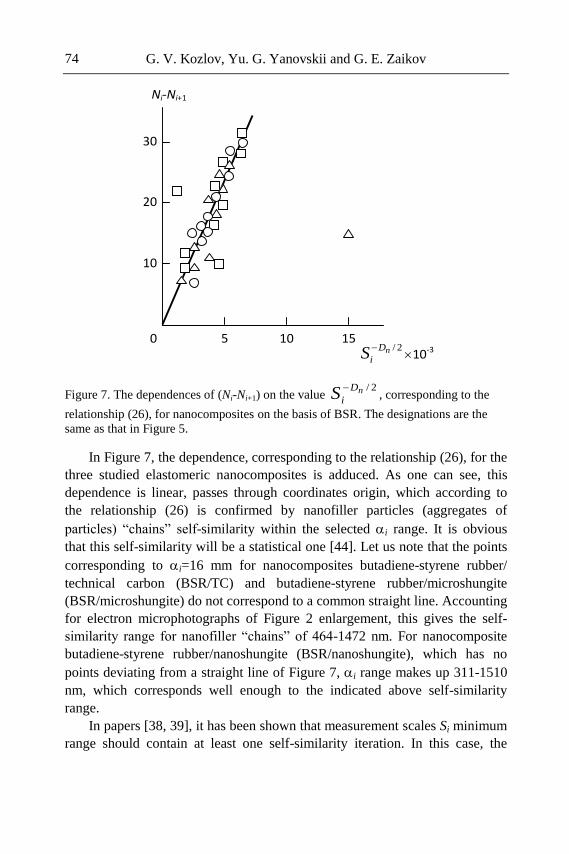
G. V. Kozlov, Yu. G. Yanovskii and G. E. Zaikov 74
Figure 7. The dependences of (Ni-Ni+1) on the value , corresponding to the
relationship (26), for nanocomposites on the basis of BSR. The designations are the
same as that in Figure 5.
In Figure 7, the dependence, corresponding to the relationship (26), for the
three studied elastomeric nanocomposites is adduced. As one can see, this
dependence is linear, passes through coordinates origin, which according to
the relationship (26) is confirmed by nanofiller particles (aggregates of
particles) “chains” self-similarity within the selected i range. It is obvious
that this self-similarity will be a statistical one [44]. Let us note that the points
corresponding to i=16 mm for nanocomposites butadiene-styrene rubber/
technical carbon (BSR/TC) and butadiene-styrene rubber/microshungite
(BSR/microshungite) do not correspond to a common straight line. Accounting
for electron microphotographs of Figure 2 enlargement, this gives the self-
similarity range for nanofiller “chains” of 464-1472 nm. For nanocomposite
butadiene-styrene rubber/nanoshungite (BSR/nanoshungite), which has no
points deviating from a straight line of Figure 7, i range makes up 311-1510
nm, which corresponds well enough to the indicated above self-similarity
range.
In papers [38, 39], it has been shown that measurement scales Si minimum
range should contain at least one self-similarity iteration. In this case, the
Ni-Ni+1
30
2/nD
iS
10-3
20
15 0 10 5
10
2/nD
iS
The Modern Experimental and Theoretical Analysis Methods … 75
condition for ratio of maximum Smax and minimum Smin areas of covering
quadrates should be fulfilled [39]:
nD
S
S /2
min
max 2 . (27)
Hence, accounting for the defined-above restriction, let us obtain
Smax/Smin=121/20.25=5.975, that is larger than values nD/22 for the studied
nanocomposites, which are equal to 2.71-3.52. This means that measurement
scales range is chosen correctly.
The self-similarity iterations number can be estimated from the
inequality [39]:
2
2/
min
max
nD
S
S. (28)
Using the indicated above values of the included in the inequality (28)
parameters, =1.42-1.75 is obtained for the studied nanocomposites, i.e., in
our experiment, conditions self-similarity iterations number is larger than
unity, which again confirms correctness of the value Dn estimation [35].
And let us consider in conclusion the physical grounds of smaller values
Dn for elastomeric nanocomposites in comparison with polymer
microcomposites, i.e., the causes of nanofiller particles (aggregates of
particles) “chains” formation in the first ones. The value Dn can be determined
theoretically according to the equation [4]:
18.4
10.755.2 0
dDnif , (29)
where if is interfacial regions relative fraction, d0 is nanofiller initial particles
surface dimension.
The dimension d0 estimation can be carried out with the help of the
equation (4), and the value if can be calculated according to the equation (7).
The results of dimension Dn theoretical calculation according to the
equation (29) are adduced in Table 2, from which a theory and experiment
good correspondence follows. The equation (29) indicates unequivocally to the
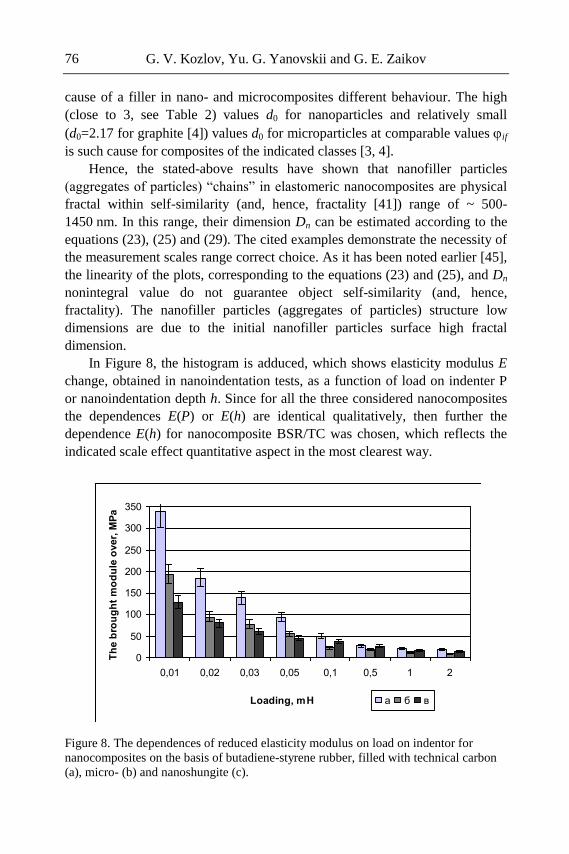
G. V. Kozlov, Yu. G. Yanovskii and G. E. Zaikov 76
cause of a filler in nano- and microcomposites different behaviour. The high
(close to 3, see Table 2) values d0 for nanoparticles and relatively small
(d0=2.17 for graphite [4]) values d0 for microparticles at comparable values if
is such cause for composites of the indicated classes [3, 4].
Hence, the stated-above results have shown that nanofiller particles
(aggregates of particles) “chains” in elastomeric nanocomposites are physical
fractal within self-similarity (and, hence, fractality [41]) range of ~ 500-
1450 nm. In this range, their dimension Dn can be estimated according to the
equations (23), (25) and (29). The cited examples demonstrate the necessity of
the measurement scales range correct choice. As it has been noted earlier [45],
the linearity of the plots, corresponding to the equations (23) and (25), and Dn
nonintegral value do not guarantee object self-similarity (and, hence,
fractality). The nanofiller particles (aggregates of particles) structure low
dimensions are due to the initial nanofiller particles surface high fractal
dimension.
In Figure 8, the histogram is adduced, which shows elasticity modulus E
change, obtained in nanoindentation tests, as a function of load on indenter P
or nanoindentation depth h. Since for all the three considered nanocomposites
the dependences E(P) or E(h) are identical qualitatively, then further the
dependence E(h) for nanocomposite BSR/TC was chosen, which reflects the
indicated scale effect quantitative aspect in the most clearest way.
Figure 8. The dependences of reduced elasticity modulus on load on indentor for
nanocomposites on the basis of butadiene-styrene rubber, filled with technical carbon
(a), micro- (b) and nanoshungite (c).
0
50
100
150
200
250
300
350
0,01 0,02 0,03 0,05 0,1 0,5 1 2
Loading, mН
Th
e b
rou
gh
t m
od
ule
over,
МP
а
a б в
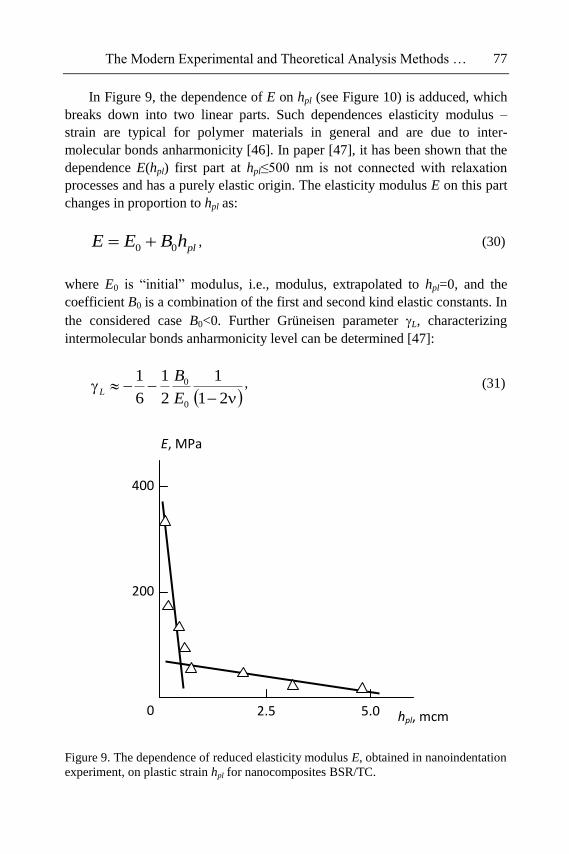
The Modern Experimental and Theoretical Analysis Methods … 77
In Figure 9, the dependence of E on hpl (see Figure 10) is adduced, which
breaks down into two linear parts. Such dependences elasticity modulus –
strain are typical for polymer materials in general and are due to inter-
molecular bonds anharmonicity [46]. In paper [47], it has been shown that the
dependence E(hpl) first part at hpl≤500 nm is not connected with relaxation
processes and has a purely elastic origin. The elasticity modulus E on this part
changes in proportion to hpl as:
plhBEE 00 , (30)
where E0 is “initial” modulus, i.e., modulus, extrapolated to hpl=0, and the
coefficient B0 is a combination of the first and second kind elastic constants. In
the considered case B0<0. Further Grüneisen parameter L, characterizing
intermolecular bonds anharmonicity level can be determined [47]:
21
1
2
1
6
1
0
0
E
BL
, (31)
Figure 9. The dependence of reduced elasticity modulus E, obtained in nanoindentation
experiment, on plastic strain hpl for nanocomposites BSR/TC.
400
200
2.5
E, MPa
hpl, mcm 5.0 0
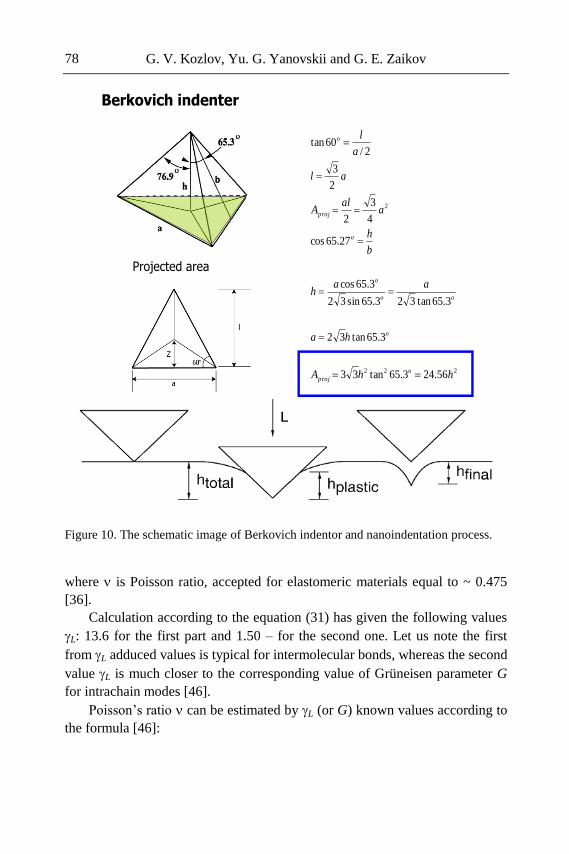
G. V. Kozlov, Yu. G. Yanovskii and G. E. Zaikov 78
Figure 10. The schematic image of Berkovich indentor and nanoindentation process.
where is Poisson ratio, accepted for elastomeric materials equal to ~ 0.475
[36].
Calculation according to the equation (31) has given the following values
L: 13.6 for the first part and 1.50 – for the second one. Let us note the first
from L adduced values is typical for intermolecular bonds, whereas the second
value L is much closer to the corresponding value of Grüneisen parameter G
for intrachain modes [46].
Poisson’s ratio can be estimated by L (or G) known values according to
the formula [46]:
Berkovich indenter
Projected area
222
2
56.243.65tan33
3.65tan32
3.65tan323.65sin32
3.65cos
27.65cos
4
3
2
2
3
2/60tan
hhA
ha
aah
b
h
aal
A
al
a
l
o
proj
o
oo
o
o
proj
o
b
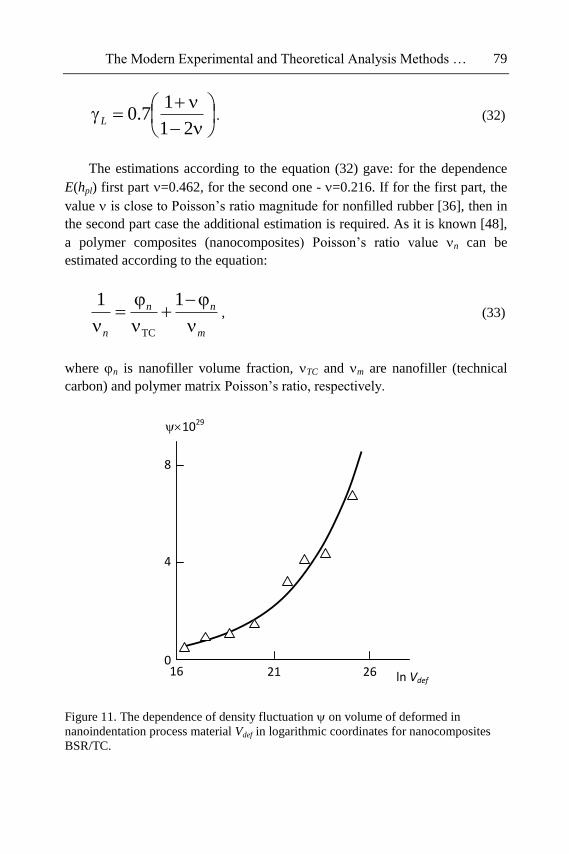
The Modern Experimental and Theoretical Analysis Methods … 79
21
17.0L . (32)
The estimations according to the equation (32) gave: for the dependence
E(hpl) first part =0.462, for the second one - =0.216. If for the first part, the
value is close to Poisson’s ratio magnitude for nonfilled rubber [36], then in
the second part case the additional estimation is required. As it is known [48],
a polymer composites (nanocomposites) Poisson’s ratio value n can be
estimated according to the equation:
m
nn
n
11
TC
, (33)
where n is nanofiller volume fraction, TC and m are nanofiller (technical
carbon) and polymer matrix Poisson’s ratio, respectively.
Figure 11. The dependence of density fluctuation on volume of deformed in
nanoindentation process material Vdef in logarithmic coordinates for nanocomposites
BSR/TC.
8
4
21
1029
ln Vdef 26
0 16
G. V. Kozlov, Yu. G. Yanovskii and G. E. Zaikov 80
The value m is accepted equal to 0.475 [36], and the magnitude TC is
estimated as follows [49]. As it is known [50], the nanoparticles TC aggregates
fractal dimension ag
fd value is equal to 2.40, and then the value TC can be
determined according to the equation [50]:
TC11 dd ag
f. (34)
According to the formula (34) TC=0.20 and calculation n according to
the equation (33) gives the value 0.283, that is close enough to the value
=0.216 according to the equation (32) estimation. The obtained by the
indicated methods values and n comparison demonstrates, that in the
dependence E(hpl) (hpl<0.5 mcm) the first part in nanoindentation tests only
rubber-like polymer matrix (=m0.475) is included and in this dependence
the second part – the entire nanocomposite as homogeneous system [51]—
=n0.22.
Let us consider further E reduction at hpl growth (Figure 9) within the
frameworks of density fluctuation theory, which value can be estimated as
follows [22]:
T
n
K
kT , (35)
where n is nanocomposite density, k is Boltzmann constant, T is testing
temperature, KT is isothermal modulus of dilatation, connected with Young’s
modulus E by the relationship [46]:
13
EKT
. (36)
In Figure 10, the scheme of volume of the deformed at nanoindentation
material Vdef calculation in case of Berkovich indentor using is adduced, and in
Figure 11, the dependence (Vdef) in logarithmic coordinates was shown. As it
follows from the data of this Figure, the density fluctuation growth is observed
at the deformed material volume increase. The plot (ln Vdef) extrapolation to
=0 gives ln Vdef13 or Vdef(cr
defV )=4.42105 nm
3. Having determined the
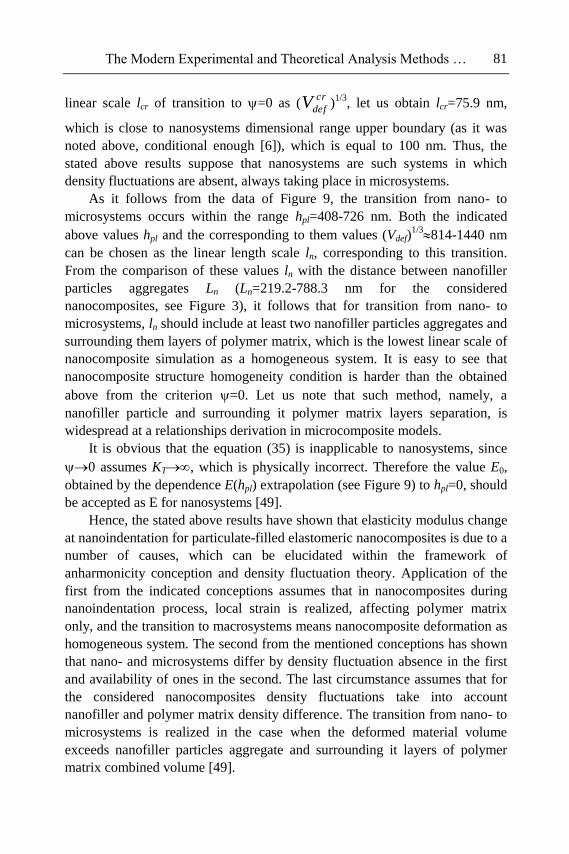
The Modern Experimental and Theoretical Analysis Methods … 81
linear scale lcr of transition to =0 as (cr
defV )1/3
, let us obtain lcr=75.9 nm,
which is close to nanosystems dimensional range upper boundary (as it was
noted above, conditional enough [6]), which is equal to 100 nm. Thus, the
stated above results suppose that nanosystems are such systems in which
density fluctuations are absent, always taking place in microsystems.
As it follows from the data of Figure 9, the transition from nano- to
microsystems occurs within the range hpl=408-726 nm. Both the indicated
above values hpl and the corresponding to them values (Vdef)1/3814-1440 nm
can be chosen as the linear length scale ln, corresponding to this transition.
From the comparison of these values ln with the distance between nanofiller
particles aggregates Ln (Ln=219.2-788.3 nm for the considered
nanocomposites, see Figure 3), it follows that for transition from nano- to
microsystems, ln should include at least two nanofiller particles aggregates and
surrounding them layers of polymer matrix, which is the lowest linear scale of
nanocomposite simulation as a homogeneous system. It is easy to see that
nanocomposite structure homogeneity condition is harder than the obtained
above from the criterion =0. Let us note that such method, namely, a
nanofiller particle and surrounding it polymer matrix layers separation, is
widespread at a relationships derivation in microcomposite models.
It is obvious that the equation (35) is inapplicable to nanosystems, since
0 assumes KT, which is physically incorrect. Therefore the value E0,
obtained by the dependence E(hpl) extrapolation (see Figure 9) to hpl=0, should
be accepted as E for nanosystems [49].
Hence, the stated above results have shown that elasticity modulus change
at nanoindentation for particulate-filled elastomeric nanocomposites is due to a
number of causes, which can be elucidated within the framework of
anharmonicity conception and density fluctuation theory. Application of the
first from the indicated conceptions assumes that in nanocomposites during
nanoindentation process, local strain is realized, affecting polymer matrix
only, and the transition to macrosystems means nanocomposite deformation as
homogeneous system. The second from the mentioned conceptions has shown
that nano- and microsystems differ by density fluctuation absence in the first
and availability of ones in the second. The last circumstance assumes that for
the considered nanocomposites density fluctuations take into account
nanofiller and polymer matrix density difference. The transition from nano- to
microsystems is realized in the case when the deformed material volume
exceeds nanofiller particles aggregate and surrounding it layers of polymer
matrix combined volume [49].
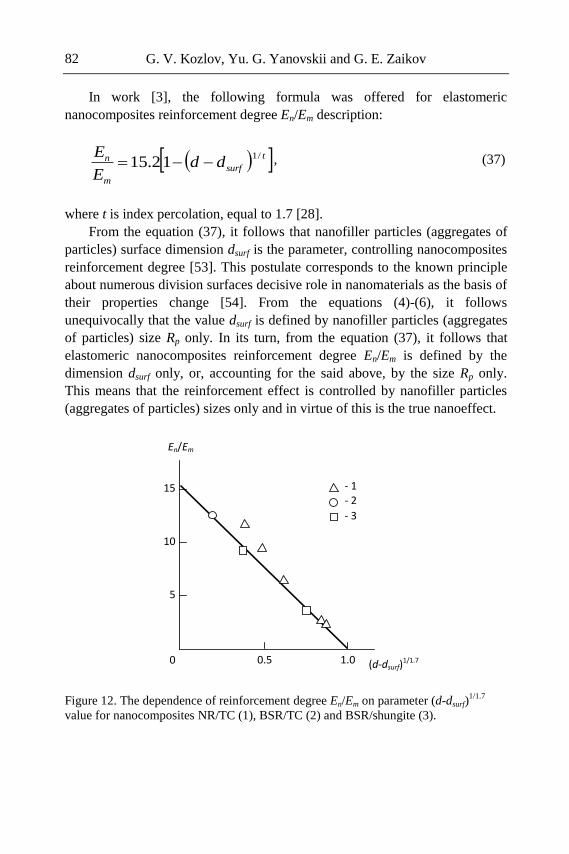
G. V. Kozlov, Yu. G. Yanovskii and G. E. Zaikov 82
In work [3], the following formula was offered for elastomeric
nanocomposites reinforcement degree En/Em description:
tsurf
m
n ddE
E /112.15 , (37)
where t is index percolation, equal to 1.7 [28].
From the equation (37), it follows that nanofiller particles (aggregates of
particles) surface dimension dsurf is the parameter, controlling nanocomposites
reinforcement degree [53]. This postulate corresponds to the known principle
about numerous division surfaces decisive role in nanomaterials as the basis of
their properties change [54]. From the equations (4)-(6), it follows
unequivocally that the value dsurf is defined by nanofiller particles (aggregates
of particles) size Rp only. In its turn, from the equation (37), it follows that
elastomeric nanocomposites reinforcement degree En/Em is defined by the
dimension dsurf only, or, accounting for the said above, by the size Rp only.
This means that the reinforcement effect is controlled by nanofiller particles
(aggregates of particles) sizes only and in virtue of this is the true nanoeffect.
Figure 12. The dependence of reinforcement degree En/Em on parameter (d-dsurf)1/1.7
value for nanocomposites NR/TC (1), BSR/TC (2) and BSR/shungite (3).
15
10
0.5
En/Em
(d-dsurf)1/1.7 1.0 0
- 1 - 2
- 3
5
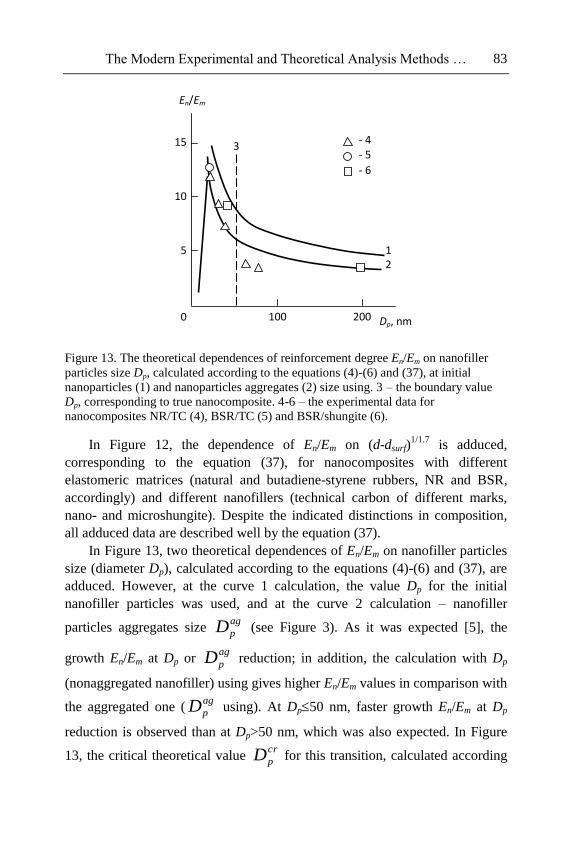
The Modern Experimental and Theoretical Analysis Methods … 83
Figure 13. The theoretical dependences of reinforcement degree En/Em on nanofiller
particles size Dp, calculated according to the equations (4)-(6) and (37), at initial
nanoparticles (1) and nanoparticles aggregates (2) size using. 3 – the boundary value
Dp, corresponding to true nanocomposite. 4-6 – the experimental data for
nanocomposites NR/TC (4), BSR/TC (5) and BSR/shungite (6).
In Figure 12, the dependence of En/Em on (d-dsurf)1/1.7
is adduced,
corresponding to the equation (37), for nanocomposites with different
elastomeric matrices (natural and butadiene-styrene rubbers, NR and BSR,
accordingly) and different nanofillers (technical carbon of different marks,
nano- and microshungite). Despite the indicated distinctions in composition,
all adduced data are described well by the equation (37).
In Figure 13, two theoretical dependences of En/Em on nanofiller particles
size (diameter Dp), calculated according to the equations (4)-(6) and (37), are
adduced. However, at the curve 1 calculation, the value Dp for the initial
nanofiller particles was used, and at the curve 2 calculation – nanofiller
particles aggregates size ag
pD (see Figure 3). As it was expected [5], the
growth En/Em at Dp or ag
pD reduction; in addition, the calculation with Dp
(nonaggregated nanofiller) using gives higher En/Em values in comparison with
the aggregated one (ag
pD using). At Dp50 nm, faster growth En/Em at Dp
reduction is observed than at Dp>50 nm, which was also expected. In Figure
13, the critical theoretical value cr
pD for this transition, calculated according
15
10
100
En/Em
Dp, nm 200 0
- 4 - 5
- 6
5 1 2
3
G. V. Kozlov, Yu. G. Yanovskii and G. E. Zaikov 84
to the indicated above general principles [54], is pointed out by a vertical
shaded line. In conformity with these principles, the nanoparticles size in
nanocomposite is determined according to the condition when division surface
fraction in the entire nanomaterial volume makes up about 50% and more.
This fraction is estimated approximately by the ratio 3lif/Dp, where lif is
interfacial layer thickness. As it was noted above, the data of Figure 1 gave the
average experimental value lif8.7 nm. Further, from the condition 3lif/Dp0.5,
let us obtain Dp52 nm, which is shown in Figure 13 by a vertical shaded line.
As it was expected, the value Dp52 nm is a boundary one for regions of slow
(Dp>52 nm) and fast (Dp≤52 nm) En/Em growth at Dp reduction. In other
words, the materials with nanofiller particles size Dp≤52 nm (“super-
reinforcing” filler according to the terminology of paper [5]) should be
considered true nanocomposites.
Let us note in conclusion that although the curves 1 and 2 of Figure 13 are
similar ones, nanofiller particles aggregation, which the curve 2 accounts for,
reduces essentially enough nanocomposites reinforcement degree. At the same
time, the experimental data correspond exactly to the curve 2, which was to be
expected in virtue of aggregation processes, which always took place in real
composites [4] (nanocomposites [55]). The values dsurf, obtained according to
the equations (4)-(6) correspond well to the determined experimentally ones.
So, for nanoshungite and two marks of technical carbon, the calculation by the
indicated method gives the following dsurf values: 2.81, 2.78 and 2.73, whereas
experimental values of this parameter are equal to: 2.81, 2.77 and 2.73, i.e.,
practically a full correspondence of theory and experiment was obtained.
CONCLUSION
Hence, the stated-above results have shown that the elastomeric
reinforcement effect is the true nanoeffect, which is defined by the initial
nanofiller particles size only. The indicated particles aggregation, always
taking place in real materials, changes reinforcement degree quantitatively
only, namely, reduces it. This effect theoretical treatment can be received
within the frameworks of fractal analysis. For the considered Nanocomposites,
the nanoparticle size upper limiting value makes up ~ 52 nm.
The Modern Experimental and Theoretical Analysis Methods … 85
REFERENCES
[1] Yanovskii Yu. G., Kozlov G.V., Karnet Yu.N. Mekhanika
Kompozitsionnykh Materialov i Konstruktsii, 2011, v. 17, № 2, p. 203-
208.
[2] Malamatov A.Kh., Kozlov G.V., Mikitaev M.A. Reinforcement
Mechanisms of Polymer Nanocomposites. Moscow, Publishers of the
D.I. Mendeleev RKhTU, 2006, 240 p.
[3] Mikitaev A.K., Kozlov G.V., Zaikov G.E. Polymer Nanocomposites:
Variety of Structural Forms and Applications. Moscow, Nauka, 2009,
278 p.
[4] Kozlov G.V., Yanovskii Yu. G., Karnet Yu. N. Structure and Properties
of Particulate-Filled Polymer Composites: the Fractal Analysis.
Moscow, Al’yanstransatom, 2008, 363 p.
[5] Edwards D.C. J. Mater. Sci., 1990, v. 25, № 12, p. 4175-4185.
[6] Buchachenko A.L. Uspekhi Khimii, 2003, v. 72, № 5, p. 419-437.
[7] Kozlov G.V., Yanovskii Yu.G., Burya A.I., Aphashagova Z.Kh.
Mekhanika Kompozitsionnykh Materialov i Konstruktsii, 2007, v. 13, №
4, p. 479-492.
[8] Lipatov Yu. S. The Physical Chemistry of Filled Polymers. Moscow,
Khimiya, 1977, 304 p.
[9] Bartenev G.M., Zelenev Yu. V. Physics and Mechanics of Polymers.
Moscow, Vysshaya Shkola, 1983, 391 p.
[10] Kozlov G.V., Mikitaev A.K. Mekhanika Kompozitsionnykh Materialov i
Konstruktsii, 1996, v. 2, № 3-4, p. 144-157.
[11] Kozlov G.V., Yanovskii Yu.G., Zaikov G.E. Structure and Properties of
Particulate-Filled Polymer Composites: the Fractal Analysis. New
York, Nova Science Publishers, Inc., 2010, 282 p.
[12] Mikitaev A.K., Kozlov G.V., Zaikov G.E. Polymer Nanocomposites:
Variety of Structural Forms and Applications. New York, Nova Science
Publishers, Inc., 2008, 319 p.
[13] McClintok F.A., Argon A.S. Mechanical Behavior of Materials.
Reading, Addison-Wesley Publishing Company, Inc., 1966, 440 p.
[14] Kozlov G.V., Mikitaev A.K. Doklady AN SSSR, 1987, v. 294, № 5, p.
1129-1131.
[15] Honeycombe R.W.K. The Plastic Deformation of Metals. Boston,
Edward Arnold (Publishers), Ltd., 1968, 398 p.
[16] Dickie R.A. In book: Polymer Blends. V. 1. New York, San-Francisco,
London, Academic Press, 1980, p. 386-431.
G. V. Kozlov, Yu. G. Yanovskii and G. E. Zaikov 86
[17] Kornev Yu. V., Yumashev O.B., Zhogin V.A., Karnet Yu. N.,
Yanovskii Yu.G. Kautschuk i Rezina, 2008, № 6, p. 18-23.
[18] Oliver W.C., Pharr G.M. J. Mater. Res., 1992, v. 7, № 6, p. 1564-1583.
[19] Kozlov G.V., Yanovskii Yu.G., Lipatov Yu.S. Mekhanika
Kompozitsionnykh Materialov i Konstruktsii, 2002, v. 8, № 1, p. 111-
149.
[20] Kozlov G.V., Burya A.I., Lipatov Yu.S. Mekhanika Kompozitnykh
Materialov, 2006, v. 42, № 6, p. 797-802.
[21] Hentschel H.G.E., Deutch J.M. Phys. Rev. A, 1984, v. 29, № 3, p. 1609-
1611.
[22] Kozlov G.V., Ovcharenko E.N., Mikitaev A.K. Structure of Polymers
Amorphous State. Moscow, Publishers of the D.I. Mendeleev RKhTU,
2009, 392 p.
[23] Yanovskii Yu.G., Kozlov G.V. Mater. VII Intern. Sci.-Pract. Conf.
“New Polymer Composite Materials.” Nal’chik, KBSU, 2011, p. 189-
194.
[24] Wu S. J. Polymer Sci.: Part B: Polymer Phys., 1989, v. 27, № 4, p. 723-
741.
[25] Aharoni S.M. Macromolecules, 1983, v. 16, № 9, p. 1722-1728.
[26] Budtov V.P. The Physical Chemistry of Polymer Solutions. Sankt-
Petersburg, Khimiya, 1992, 384 p.
[27] Aharoni S.M. Macromolecules, 1985, v. 18, № 12, p. 2624-2630.
[28] Bobryshev A.N., Kozomazov V.N., Babin L.O., Solomatov V.I.
Synergetics of Composite Materials. Lipetsk, NPO ORIUS, 1994, 154 p.
[29] Kozlov G.V., Yanovskii Yu.G., Karnet Yu. N. Mekhanika
Kompozitsionnykh Materialov i Konstruktsii, 2005, v. 11, № 3, p. 446-
456.
[30] Sheng N., Boyce M.C., Parks D.M., Rutledge G.C., Abes J.I., Cohen
R.E. Polymer, 2004, v. 45, № 2, p. 487-506.
[31] Witten T.A., Meakin P. Phys. Rev. B, 1983, v. 28, № 10, p. 5632-5642.
[32] Witten T.A., Sander L.M. Phys. Rev. B, 1983, v. 27, № 9, p. 5686-5697.
[33] Happel J., Brenner G. Hydrodynamics at Small Reynolds Numbers.
Moscow, Mir, 1976, 418 p.
[34] Mills N.J. J. Appl. Polymer Sci., 1971, v. 15, № 11, p. 2791-2805.
[35] Kozlov G.V., Yanovskii Yu.G., Mikitaev A.K. Mekhanika
Kompozitnykh Materialov, 1998, v. 34, № 4, p. 539-544.
[36] Balankin A.S. Synergetics of Deformable Body. Moscow, Publishers of
Ministry Defence SSSR, 1991, 404 p.
[37] Hornbogen E. Intern. Mater. Res., 1989, v. 34, № 6, p. 277-296.
The Modern Experimental and Theoretical Analysis Methods … 87
[38] Pfeifer P. Appl. Surf. Sci., 1984, v. 18, № 1, p. 146-164.
[39] Avnir D., Farin D., Pfeifer P. J. Colloid Interface Sci., 1985, v. 103, №
1, p. 112-123.
[40] Ishikawa K. J. Mater. Sci. Lett., 1990, v. 9, № 4, p. 400-402.
[41] Ivanova V.S., Balankin A.S., Bunin I. Zh., Oksogoev A.A. Synergetics
and Fractals in Material Science. Moscow, Nauka, 1994, 383 p.
[42] Vstovskii G.V., Kolmakov L.G., Terent’ev V.E. Metally, 1993, № 4, p.
164-178.
[43] Hansen J.P., Skjeitorp A.T. Phys. Rev. B, 1988, v. 38, № 4, p. 2635-
2638.
[44] Pfeifer P., Avnir D., Farin D. J. Stat. Phys., 1984, v. 36, № 5/6, p. 699-
716.
[45] Farin D., Peleg S., Yavin D., Avnir D. Langmuir, 1985, v. 1, № 4, p.
399-407.
[46] Kozlov G.V., Sanditov D.S. Anharmonical Effects and Physical-
Mechanical Properties of Polymers. Novosibirsk, Nauka, 1994, 261 p.
[47] Bessonov M.I., Rudakov A.P. Vysokomolek. Soed. B, 1971, V. 13, № 7,
p. 509-511.
[48] Kubat J., Rigdahl M., Welander M. J. Appl. Polymer Sci., 1990, v. 39,
№ 5, p. 1527-1539.
[49] Yanovskii Yu.G., Kozlov G.V., Kornev Yu.V., Boiko O.V., Karnet
Yu.N. Mekhanika Kompozitsionnykh Materialov i Konstruktsii, 2010, v.
16, № 3, p. 445-453.
[50] Yanovskii Yu.G., Kozlov G.V., Aloev V.Z. Mater. Intern. Sci.-Pract.
Conf. “Modern Problems of APK Innovation Development Theory and
Practice.” Nal’chik, KBSSKhA, 2011, p. 434-437.
[51] Chow T.S. Polymer, 1991, v. 32, № 1, p. 29-33.
[52] Ahmed S., Jones F.R. J. Mater. Sci., 1990, v. 25, № 12, p. 4933-4942.
[53] Kozlov G.V., Yanovskii Yu.G., Aloev V.Z. Mater. Intern. Sci.-Pract.
Conf., dedicated to FMEP 50-th Anniversary. Nal’chik, KBSSKhA,
2011, p. 83-89.
[54] Andrievskii R.A. Rossiiskii Khimicheskii Zhurnal, 2002, v. 46, № 5, p.
50-56.
[55] Kozlov G.V., Sultonov N.Zh., Shoranova L.O., Mikitaev A.K.
Naukoemkie Tekhnologii, 2011, v. 12, № 3, p. 17-22.

In: Advanced Nanotube and Nanofiber Materials ISBN: 978-1-62081-170-2
Editors: A. K. Haghi and G. E. Zaikov © 2012 Nova Science Publishers, Inc.
Chapter 4
CONDUCTIVE CARBON
NANOTUBE/NANOFIBER COMPOSITE
A. K. Haghi
University of Guilan, Iran
1. INTRODUCTION
Over the recent decades, scientists became interested in creation of
polymer nanofibers due to their potential in many engineering and medical
properties [1]. According to various outstanding properties such as very small
fiber diameters, large surface area per mass ratio, high porosity along with
small pore sizes and flexibility, electrospun nanofiber mats have found
numerous applications in diverse areas. For example in the biomedical field,
nanofibers play a substantial role in tissue engineering [2], drug delivery [3],
and wound dressing [4]. Electrospinning is a novel and efficient method by
which fibers with diameters in nanometer scale entitled as nanofibers can be
achieved. In electrospinning process, a strong electric field is applied on a
droplet of polymer solution (or melt) held by its surface tension at the tip of a
syringe needle (or a capillary tube). As a result, the pendent drop will become
highly electrified, and the induced charges are distributed over its surface.
Increasing the intensity of electric field, the surface of the liquid drop will be
distorted to a conical shape known as the Taylor cone [5]. Once the electric
* E-mail: [email protected].
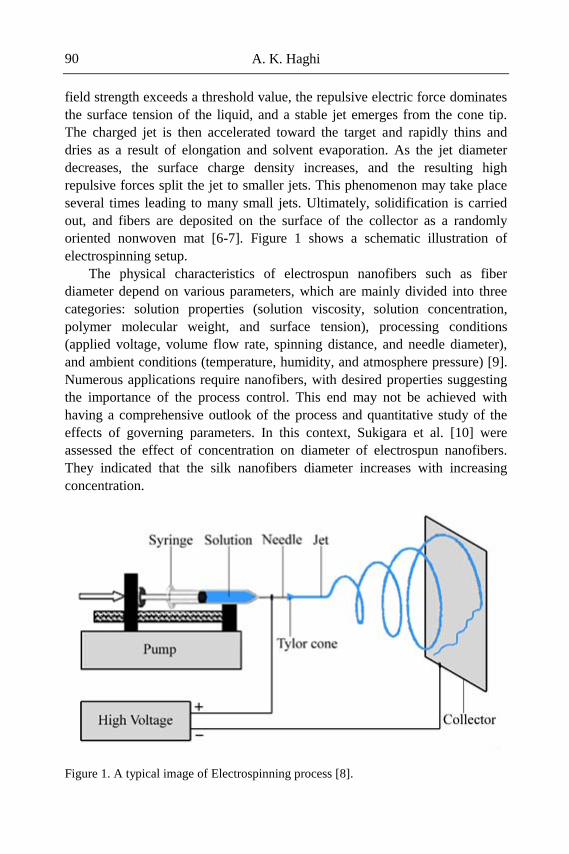
A. K. Haghi 90
field strength exceeds a threshold value, the repulsive electric force dominates
the surface tension of the liquid, and a stable jet emerges from the cone tip.
The charged jet is then accelerated toward the target and rapidly thins and
dries as a result of elongation and solvent evaporation. As the jet diameter
decreases, the surface charge density increases, and the resulting high
repulsive forces split the jet to smaller jets. This phenomenon may take place
several times leading to many small jets. Ultimately, solidification is carried
out, and fibers are deposited on the surface of the collector as a randomly
oriented nonwoven mat [6-7]. Figure 1 shows a schematic illustration of
electrospinning setup.
The physical characteristics of electrospun nanofibers such as fiber
diameter depend on various parameters, which are mainly divided into three
categories: solution properties (solution viscosity, solution concentration,
polymer molecular weight, and surface tension), processing conditions
(applied voltage, volume flow rate, spinning distance, and needle diameter),
and ambient conditions (temperature, humidity, and atmosphere pressure) [9].
Numerous applications require nanofibers, with desired properties suggesting
the importance of the process control. This end may not be achieved with
having a comprehensive outlook of the process and quantitative study of the
effects of governing parameters. In this context, Sukigara et al. [10] were
assessed the effect of concentration on diameter of electrospun nanofibers.
They indicated that the silk nanofibers diameter increases with increasing
concentration.
Figure 1. A typical image of Electrospinning process [8].
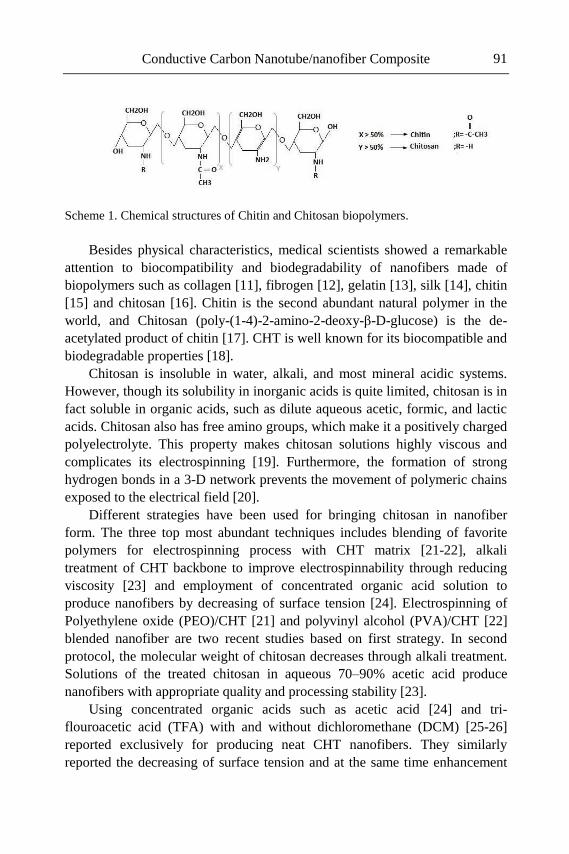
Conductive Carbon Nanotube/nanofiber Composite 91
Scheme 1. Chemical structures of Chitin and Chitosan biopolymers.
Besides physical characteristics, medical scientists showed a remarkable
attention to biocompatibility and biodegradability of nanofibers made of
biopolymers such as collagen [11], fibrogen [12], gelatin [13], silk [14], chitin
[15] and chitosan [16]. Chitin is the second abundant natural polymer in the
world, and Chitosan (poly-(1-4)-2-amino-2-deoxy-β-D-glucose) is the de-
acetylated product of chitin [17]. CHT is well known for its biocompatible and
biodegradable properties [18].
Chitosan is insoluble in water, alkali, and most mineral acidic systems.
However, though its solubility in inorganic acids is quite limited, chitosan is in
fact soluble in organic acids, such as dilute aqueous acetic, formic, and lactic
acids. Chitosan also has free amino groups, which make it a positively charged
polyelectrolyte. This property makes chitosan solutions highly viscous and
complicates its electrospinning [19]. Furthermore, the formation of strong
hydrogen bonds in a 3-D network prevents the movement of polymeric chains
exposed to the electrical field [20].
Different strategies have been used for bringing chitosan in nanofiber
form. The three top most abundant techniques includes blending of favorite
polymers for electrospinning process with CHT matrix [21-22], alkali
treatment of CHT backbone to improve electrospinnability through reducing
viscosity [23] and employment of concentrated organic acid solution to
produce nanofibers by decreasing of surface tension [24]. Electrospinning of
Polyethylene oxide (PEO)/CHT [21] and polyvinyl alcohol (PVA)/CHT [22]
blended nanofiber are two recent studies based on first strategy. In second
protocol, the molecular weight of chitosan decreases through alkali treatment.
Solutions of the treated chitosan in aqueous 70–90% acetic acid produce
nanofibers with appropriate quality and processing stability [23].
Using concentrated organic acids such as acetic acid [24] and tri-
flouroacetic acid (TFA) with and without dichloromethane (DCM) [25-26]
reported exclusively for producing neat CHT nanofibers. They similarly
reported the decreasing of surface tension and at the same time enhancement
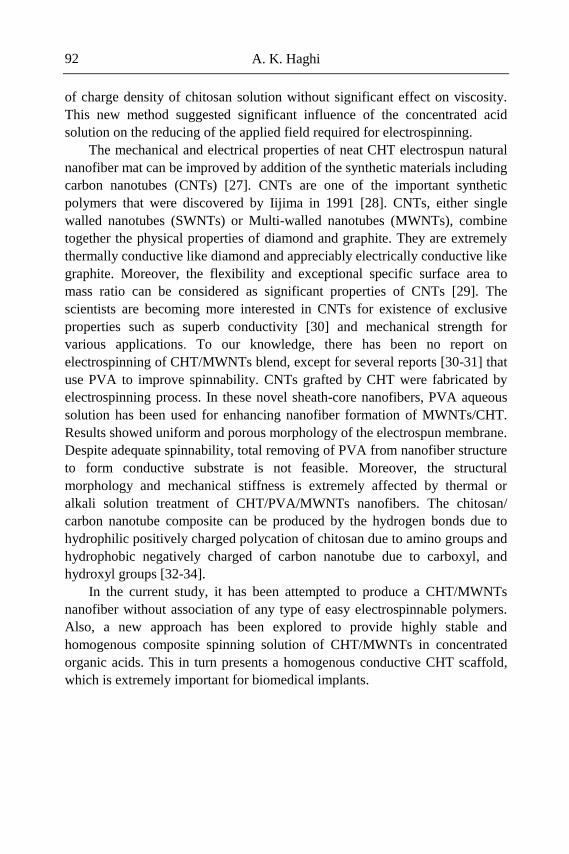
A. K. Haghi 92
of charge density of chitosan solution without significant effect on viscosity.
This new method suggested significant influence of the concentrated acid
solution on the reducing of the applied field required for electrospinning.
The mechanical and electrical properties of neat CHT electrospun natural
nanofiber mat can be improved by addition of the synthetic materials including
carbon nanotubes (CNTs) [27]. CNTs are one of the important synthetic
polymers that were discovered by Iijima in 1991 [28]. CNTs, either single
walled nanotubes (SWNTs) or Multi-walled nanotubes (MWNTs), combine
together the physical properties of diamond and graphite. They are extremely
thermally conductive like diamond and appreciably electrically conductive like
graphite. Moreover, the flexibility and exceptional specific surface area to
mass ratio can be considered as significant properties of CNTs [29]. The
scientists are becoming more interested in CNTs for existence of exclusive
properties such as superb conductivity [30] and mechanical strength for
various applications. To our knowledge, there has been no report on
electrospinning of CHT/MWNTs blend, except for several reports [30-31] that
use PVA to improve spinnability. CNTs grafted by CHT were fabricated by
electrospinning process. In these novel sheath-core nanofibers, PVA aqueous
solution has been used for enhancing nanofiber formation of MWNTs/CHT.
Results showed uniform and porous morphology of the electrospun membrane.
Despite adequate spinnability, total removing of PVA from nanofiber structure
to form conductive substrate is not feasible. Moreover, the structural
morphology and mechanical stiffness is extremely affected by thermal or
alkali solution treatment of CHT/PVA/MWNTs nanofibers. The chitosan/
carbon nanotube composite can be produced by the hydrogen bonds due to
hydrophilic positively charged polycation of chitosan due to amino groups and
hydrophobic negatively charged of carbon nanotube due to carboxyl, and
hydroxyl groups [32-34].
In the current study, it has been attempted to produce a CHT/MWNTs
nanofiber without association of any type of easy electrospinnable polymers.
Also, a new approach has been explored to provide highly stable and
homogenous composite spinning solution of CHT/MWNTs in concentrated
organic acids. This in turn presents a homogenous conductive CHT scaffold,
which is extremely important for biomedical implants.
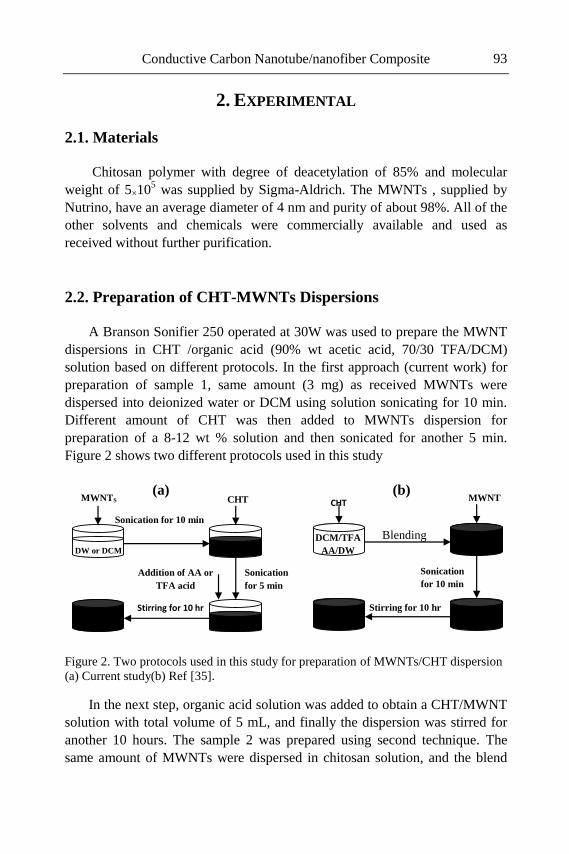
Conductive Carbon Nanotube/nanofiber Composite 93
2. EXPERIMENTAL
2.1. Materials
Chitosan polymer with degree of deacetylation of 85% and molecular
weight of 5×10⁵ was supplied by Sigma-Aldrich. The MWNTs , supplied by
Nutrino, have an average diameter of 4 nm and purity of about 98%. All of the
other solvents and chemicals were commercially available and used as
received without further purification.
2.2. Preparation of CHT-MWNTs Dispersions
A Branson Sonifier 250 operated at 30W was used to prepare the MWNT
dispersions in CHT /organic acid (90% wt acetic acid, 70/30 TFA/DCM)
solution based on different protocols. In the first approach (current work) for
preparation of sample 1, same amount (3 mg) as received MWNTs were
dispersed into deionized water or DCM using solution sonicating for 10 min.
Different amount of CHT was then added to MWNTs dispersion for
preparation of a 8-12 wt % solution and then sonicated for another 5 min.
Figure 2 shows two different protocols used in this study
Figure 2. Two protocols used in this study for preparation of MWNTs/CHT dispersion
(a) Current study(b) Ref [35].
In the next step, organic acid solution was added to obtain a CHT/MWNT
solution with total volume of 5 mL, and finally the dispersion was stirred for
another 10 hours. The sample 2 was prepared using second technique. The
same amount of MWNTs were dispersed in chitosan solution, and the blend
Sonication
for 5 min
MWNTS
Sonication for 10 min
CHT
Addition of AA or
TFA acid
Stirring for 10 hr
DW or DCM
CHT
Blending
MWNT
Stirring for 10 hr
DCM/TFA
AA/DW
Sonication
for 10 min
(a) (b)
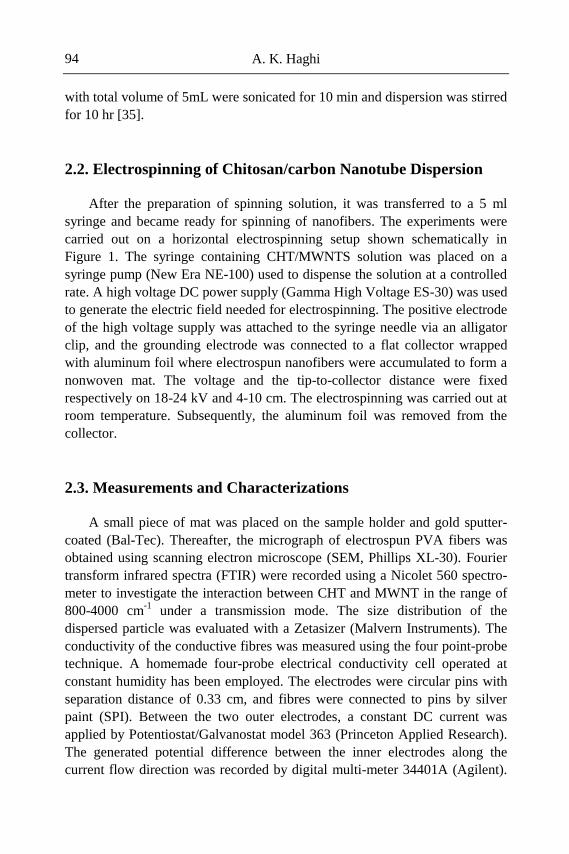
A. K. Haghi 94
with total volume of 5mL were sonicated for 10 min and dispersion was stirred
for 10 hr [35].
2.2. Electrospinning of Chitosan/carbon Nanotube Dispersion
After the preparation of spinning solution, it was transferred to a 5 ml
syringe and became ready for spinning of nanofibers. The experiments were
carried out on a horizontal electrospinning setup shown schematically in
Figure 1. The syringe containing CHT/MWNTS solution was placed on a
syringe pump (New Era NE-100) used to dispense the solution at a controlled
rate. A high voltage DC power supply (Gamma High Voltage ES-30) was used
to generate the electric field needed for electrospinning. The positive electrode
of the high voltage supply was attached to the syringe needle via an alligator
clip, and the grounding electrode was connected to a flat collector wrapped
with aluminum foil where electrospun nanofibers were accumulated to form a
nonwoven mat. The voltage and the tip-to-collector distance were fixed
respectively on 18-24 kV and 4-10 cm. The electrospinning was carried out at
room temperature. Subsequently, the aluminum foil was removed from the
collector.
2.3. Measurements and Characterizations
A small piece of mat was placed on the sample holder and gold sputter-
coated (Bal-Tec). Thereafter, the micrograph of electrospun PVA fibers was
obtained using scanning electron microscope (SEM, Phillips XL-30). Fourier
transform infrared spectra (FTIR) were recorded using a Nicolet 560 spectro-
meter to investigate the interaction between CHT and MWNT in the range of
800-4000 cm-1
under a transmission mode. The size distribution of the
dispersed particle was evaluated with a Zetasizer (Malvern Instruments). The
conductivity of the conductive fibres was measured using the four point-probe
technique. A homemade four-probe electrical conductivity cell operated at
constant humidity has been employed. The electrodes were circular pins with
separation distance of 0.33 cm, and fibres were connected to pins by silver
paint (SPI). Between the two outer electrodes, a constant DC current was
applied by Potentiostat/Galvanostat model 363 (Princeton Applied Research).
The generated potential difference between the inner electrodes along the
current flow direction was recorded by digital multi-meter 34401A (Agilent).
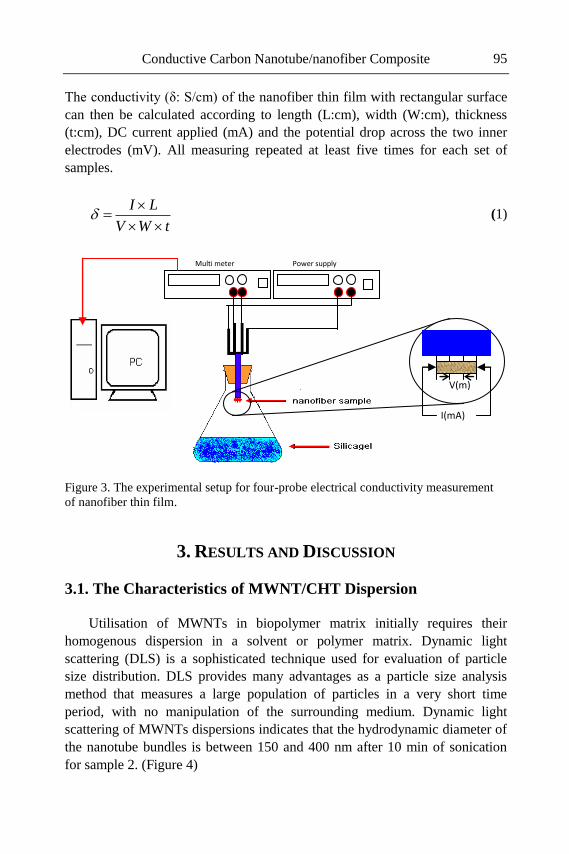
Conductive Carbon Nanotube/nanofiber Composite 95
The conductivity (δ: S/cm) of the nanofiber thin film with rectangular surface
can then be calculated according to length (L:cm), width (W:cm), thickness
(t:cm), DC current applied (mA) and the potential drop across the two inner
electrodes (mV). All measuring repeated at least five times for each set of
samples.
tWV
LI
(1)
Figure 3. The experimental setup for four-probe electrical conductivity measurement
of nanofiber thin film.
3. RESULTS AND DISCUSSION
3.1. The Characteristics of MWNT/CHT Dispersion
Utilisation of MWNTs in biopolymer matrix initially requires their
homogenous dispersion in a solvent or polymer matrix. Dynamic light
scattering (DLS) is a sophisticated technique used for evaluation of particle
size distribution. DLS provides many advantages as a particle size analysis
method that measures a large population of particles in a very short time
period, with no manipulation of the surrounding medium. Dynamic light
scattering of MWNTs dispersions indicates that the hydrodynamic diameter of
the nanotube bundles is between 150 and 400 nm after 10 min of sonication
for sample 2. (Figure 4)
Multi meter Power supply
V(m)
V)
I(mA)
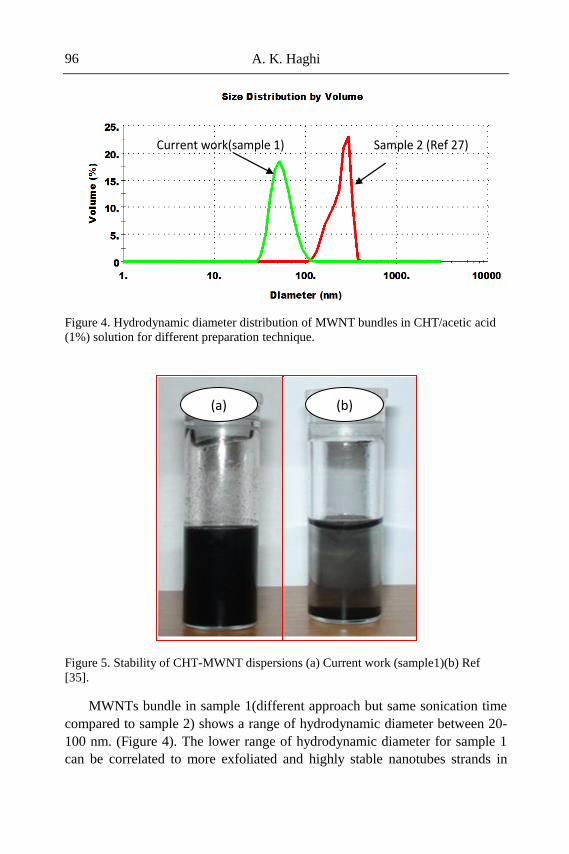
A. K. Haghi 96
Figure 4. Hydrodynamic diameter distribution of MWNT bundles in CHT/acetic acid
(1%) solution for different preparation technique.
Figure 5. Stability of CHT-MWNT dispersions (a) Current work (sample1)(b) Ref
[35].
MWNTs bundle in sample 1(different approach but same sonication time
compared to sample 2) shows a range of hydrodynamic diameter between 20-
100 nm. (Figure 4). The lower range of hydrodynamic diameter for sample 1
can be correlated to more exfoliated and highly stable nanotubes strands in
Current work(sample 1) Sample 2 (Ref 27)
(a) (b)
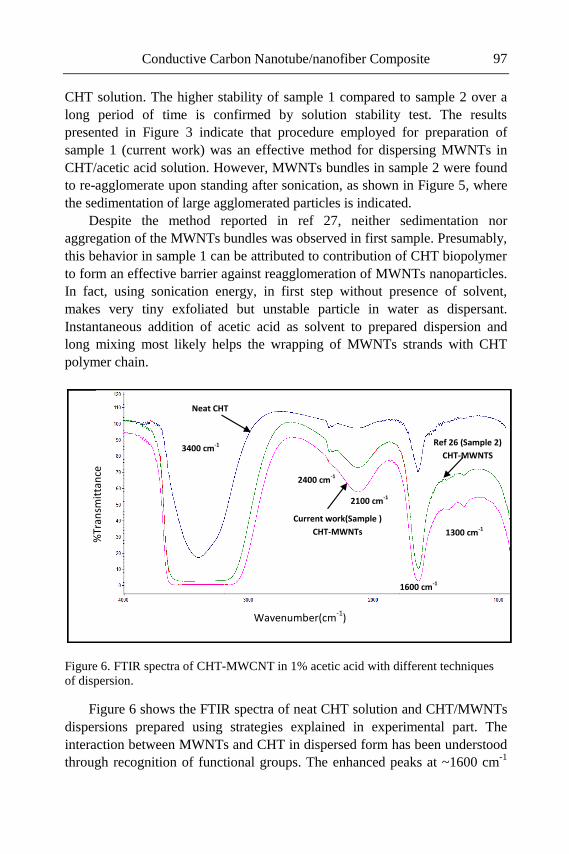
Conductive Carbon Nanotube/nanofiber Composite 97
CHT solution. The higher stability of sample 1 compared to sample 2 over a
long period of time is confirmed by solution stability test. The results
presented in Figure 3 indicate that procedure employed for preparation of
sample 1 (current work) was an effective method for dispersing MWNTs in
CHT/acetic acid solution. However, MWNTs bundles in sample 2 were found
to re-agglomerate upon standing after sonication, as shown in Figure 5, where
the sedimentation of large agglomerated particles is indicated.
Despite the method reported in ref 27, neither sedimentation nor
aggregation of the MWNTs bundles was observed in first sample. Presumably,
this behavior in sample 1 can be attributed to contribution of CHT biopolymer
to form an effective barrier against reagglomeration of MWNTs nanoparticles.
In fact, using sonication energy, in first step without presence of solvent,
makes very tiny exfoliated but unstable particle in water as dispersant.
Instantaneous addition of acetic acid as solvent to prepared dispersion and
long mixing most likely helps the wrapping of MWNTs strands with CHT
polymer chain.
Figure 6. FTIR spectra of CHT-MWCNT in 1% acetic acid with different techniques
of dispersion.
Figure 6 shows the FTIR spectra of neat CHT solution and CHT/MWNTs
dispersions prepared using strategies explained in experimental part. The
interaction between MWNTs and CHT in dispersed form has been understood
through recognition of functional groups. The enhanced peaks at ~1600 cm-1
Wavenumber(cm-1
)
%Tr
ansm
itta
nce
Current work(Sample )
CHT-MWNTs
Ref 26 (Sample 2)
CHT-MWNTS
Neat CHT
3400 cm-1
2400 cm-1
2100 cm-1
1600 cm-1
1300 cm-1
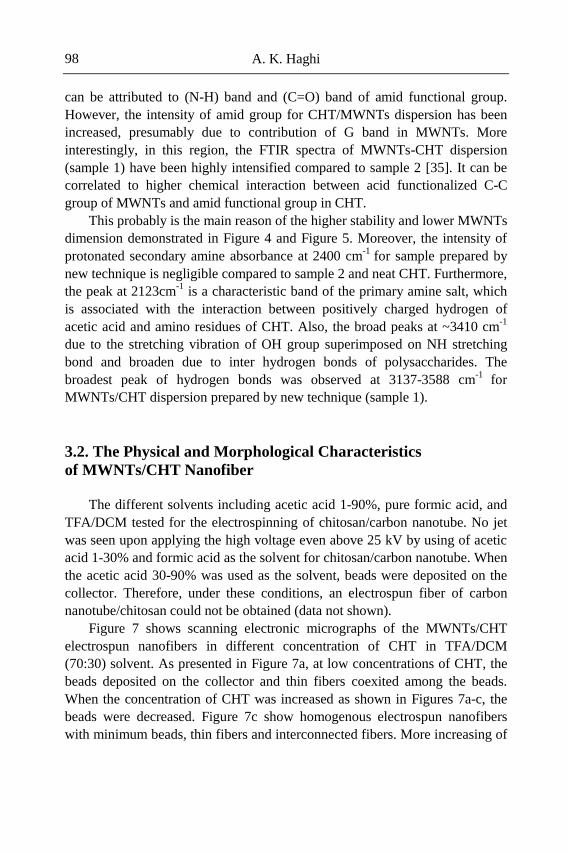
A. K. Haghi 98
can be attributed to (N-H) band and (C=O) band of amid functional group.
However, the intensity of amid group for CHT/MWNTs dispersion has been
increased, presumably due to contribution of G band in MWNTs. More
interestingly, in this region, the FTIR spectra of MWNTs-CHT dispersion
(sample 1) have been highly intensified compared to sample 2 [35]. It can be
correlated to higher chemical interaction between acid functionalized C-C
group of MWNTs and amid functional group in CHT.
This probably is the main reason of the higher stability and lower MWNTs
dimension demonstrated in Figure 4 and Figure 5. Moreover, the intensity of
protonated secondary amine absorbance at 2400 cm-1
for sample prepared by
new technique is negligible compared to sample 2 and neat CHT. Furthermore,
the peak at 2123cm-1
is a characteristic band of the primary amine salt, which
is associated with the interaction between positively charged hydrogen of
acetic acid and amino residues of CHT. Also, the broad peaks at ~3410 cm-1
due to the stretching vibration of OH group superimposed on NH stretching
bond and broaden due to inter hydrogen bonds of polysaccharides. The
broadest peak of hydrogen bonds was observed at 3137-3588 cm-1
for
MWNTs/CHT dispersion prepared by new technique (sample 1).
3.2. The Physical and Morphological Characteristics
of MWNTs/CHT Nanofiber
The different solvents including acetic acid 1-90%, pure formic acid, and
TFA/DCM tested for the electrospinning of chitosan/carbon nanotube. No jet
was seen upon applying the high voltage even above 25 kV by using of acetic
acid 1-30% and formic acid as the solvent for chitosan/carbon nanotube. When
the acetic acid 30-90% was used as the solvent, beads were deposited on the
collector. Therefore, under these conditions, an electrospun fiber of carbon
nanotube/chitosan could not be obtained (data not shown).
Figure 7 shows scanning electronic micrographs of the MWNTs/CHT
electrospun nanofibers in different concentration of CHT in TFA/DCM
(70:30) solvent. As presented in Figure 7a, at low concentrations of CHT, the
beads deposited on the collector and thin fibers coexited among the beads.
When the concentration of CHT was increased as shown in Figures 7a-c, the
beads were decreased. Figure 7c show homogenous electrospun nanofibers
with minimum beads, thin fibers and interconnected fibers. More increasing of
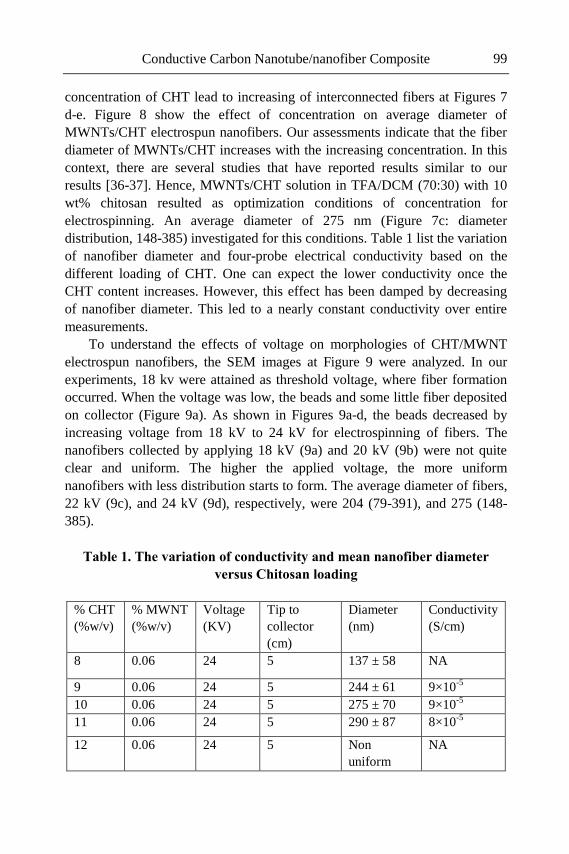
Conductive Carbon Nanotube/nanofiber Composite 99
concentration of CHT lead to increasing of interconnected fibers at Figures 7
d-e. Figure 8 show the effect of concentration on average diameter of
MWNTs/CHT electrospun nanofibers. Our assessments indicate that the fiber
diameter of MWNTs/CHT increases with the increasing concentration. In this
context, there are several studies that have reported results similar to our
results [36-37]. Hence, MWNTs/CHT solution in TFA/DCM (70:30) with 10
wt% chitosan resulted as optimization conditions of concentration for
electrospinning. An average diameter of 275 nm (Figure 7c: diameter
distribution, 148-385) investigated for this conditions. Table 1 list the variation
of nanofiber diameter and four-probe electrical conductivity based on the
different loading of CHT. One can expect the lower conductivity once the
CHT content increases. However, this effect has been damped by decreasing
of nanofiber diameter. This led to a nearly constant conductivity over entire
measurements.
To understand the effects of voltage on morphologies of CHT/MWNT
electrospun nanofibers, the SEM images at Figure 9 were analyzed. In our
experiments, 18 kv were attained as threshold voltage, where fiber formation
occurred. When the voltage was low, the beads and some little fiber deposited
on collector (Figure 9a). As shown in Figures 9a-d, the beads decreased by
increasing voltage from 18 kV to 24 kV for electrospinning of fibers. The
nanofibers collected by applying 18 kV (9a) and 20 kV (9b) were not quite
clear and uniform. The higher the applied voltage, the more uniform
nanofibers with less distribution starts to form. The average diameter of fibers,
22 kV (9c), and 24 kV (9d), respectively, were 204 (79-391), and 275 (148-
385).
Table 1. The variation of conductivity and mean nanofiber diameter
versus Chitosan loading
% CHT
(%w/v)
% MWNT
(%w/v)
Voltage
(KV)
Tip to
collector
(cm)
Diameter
(nm)
Conductivity
(S/cm)
8 0.06 24 5 137 ± 58 NA
9 0.06 24 5 244 ± 61 9×10⁻⁵
10 0.06 24 5 275 ± 70 9×10⁻⁵
11 0.06 24 5 290 ± 87 8×10⁻⁵
12 0.06 24 5 Non
uniform
NA
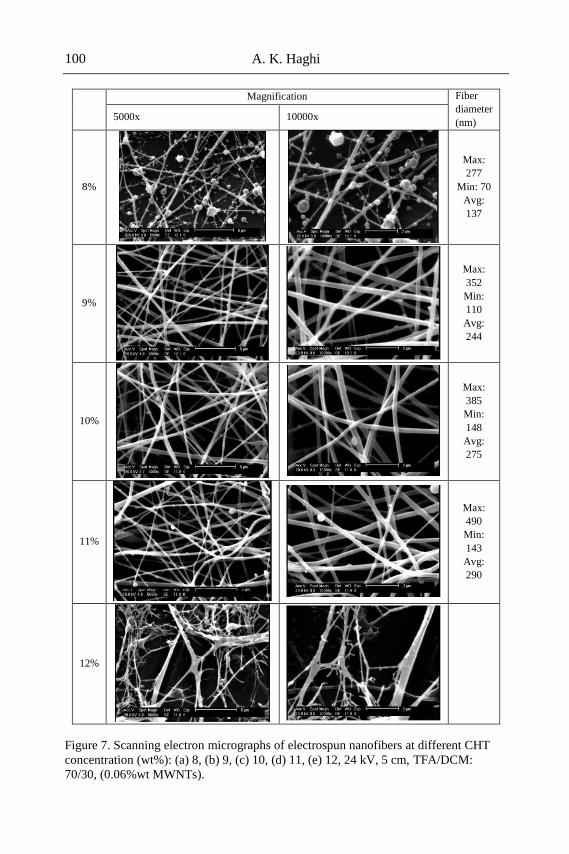
A. K. Haghi 100
Magnification Fiber
diameter
(nm) 5000x 10000x
8%
Max:
277
Min: 70
Avg:
137
9%
Max:
352
Min:
110
Avg:
244
10%
Max:
385
Min:
148
Avg:
275
11%
Max:
490
Min:
143
Avg:
290
12%
Figure 7. Scanning electron micrographs of electrospun nanofibers at different CHT
concentration (wt%): (a) 8, (b) 9, (c) 10, (d) 11, (e) 12, 24 kV, 5 cm, TFA/DCM:
70/30, (0.06%wt MWNTs).
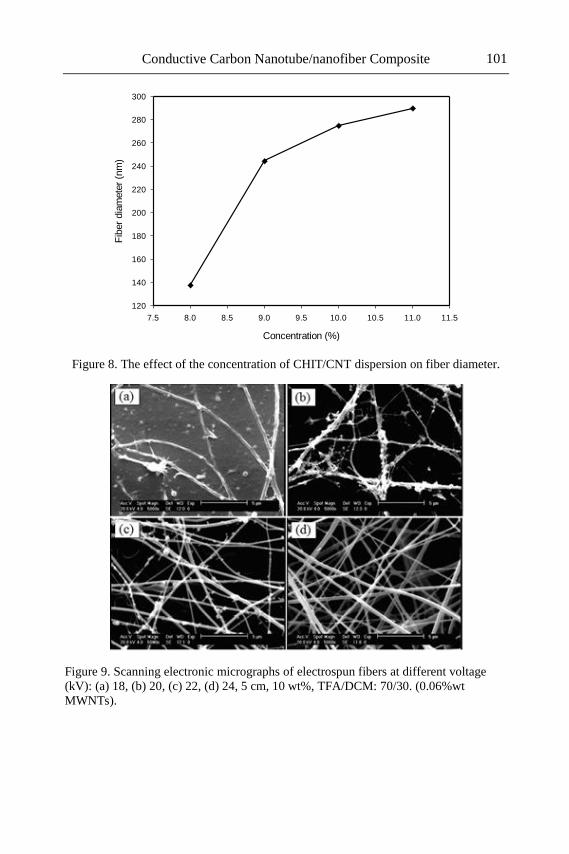
Conductive Carbon Nanotube/nanofiber Composite 101
Concentration (%)
7.5 8.0 8.5 9.0 9.5 10.0 10.5 11.0 11.5
Fib
er
dia
mete
r (n
m)
120
140
160
180
200
220
240
260
280
300
Figure 8. The effect of the concentration of CHIT/CNT dispersion on fiber diameter.
Figure 9. Scanning electronic micrographs of electrospun fibers at different voltage
(kV): (a) 18, (b) 20, (c) 22, (d) 24, 5 cm, 10 wt%, TFA/DCM: 70/30. (0.06%wt
MWNTs).
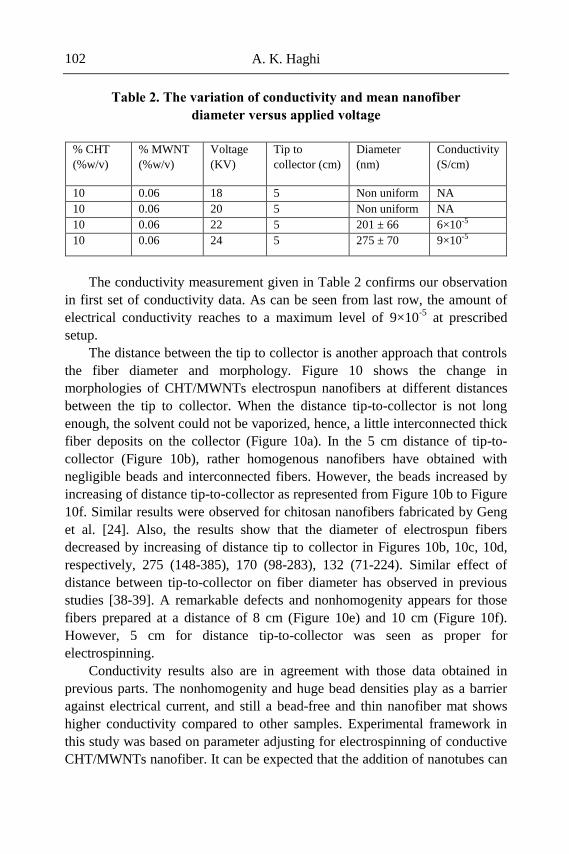
A. K. Haghi 102
Table 2. The variation of conductivity and mean nanofiber
diameter versus applied voltage
% CHT
(%w/v)
% MWNT
(%w/v)
Voltage
(KV)
Tip to
collector (cm)
Diameter
(nm)
Conductivity
(S/cm)
10 0.06 18 5 Non uniform NA
10 0.06 20 5 Non uniform NA
10 0.06 22 5 201 ± 66 6×10⁻⁵
10 0.06 24 5 275 ± 70 9×10⁻⁵
The conductivity measurement given in Table 2 confirms our observation
in first set of conductivity data. As can be seen from last row, the amount of
electrical conductivity reaches to a maximum level of 9×10⁻⁵
at prescribed
setup.
The distance between the tip to collector is another approach that controls
the fiber diameter and morphology. Figure 10 shows the change in
morphologies of CHT/MWNTs electrospun nanofibers at different distances
between the tip to collector. When the distance tip-to-collector is not long
enough, the solvent could not be vaporized, hence, a little interconnected thick
fiber deposits on the collector (Figure 10a). In the 5 cm distance of tip-to-
collector (Figure 10b), rather homogenous nanofibers have obtained with
negligible beads and interconnected fibers. However, the beads increased by
increasing of distance tip-to-collector as represented from Figure 10b to Figure
10f. Similar results were observed for chitosan nanofibers fabricated by Geng
et al. [24]. Also, the results show that the diameter of electrospun fibers
decreased by increasing of distance tip to collector in Figures 10b, 10c, 10d,
respectively, 275 (148-385), 170 (98-283), 132 (71-224). Similar effect of
distance between tip-to-collector on fiber diameter has observed in previous
studies [38-39]. A remarkable defects and nonhomogenity appears for those
fibers prepared at a distance of 8 cm (Figure 10e) and 10 cm (Figure 10f).
However, 5 cm for distance tip-to-collector was seen as proper for
electrospinning.
Conductivity results also are in agreement with those data obtained in
previous parts. The nonhomogenity and huge bead densities play as a barrier
against electrical current, and still a bead-free and thin nanofiber mat shows
higher conductivity compared to other samples. Experimental framework in
this study was based on parameter adjusting for electrospinning of conductive
CHT/MWNTs nanofiber. It can be expected that the addition of nanotubes can
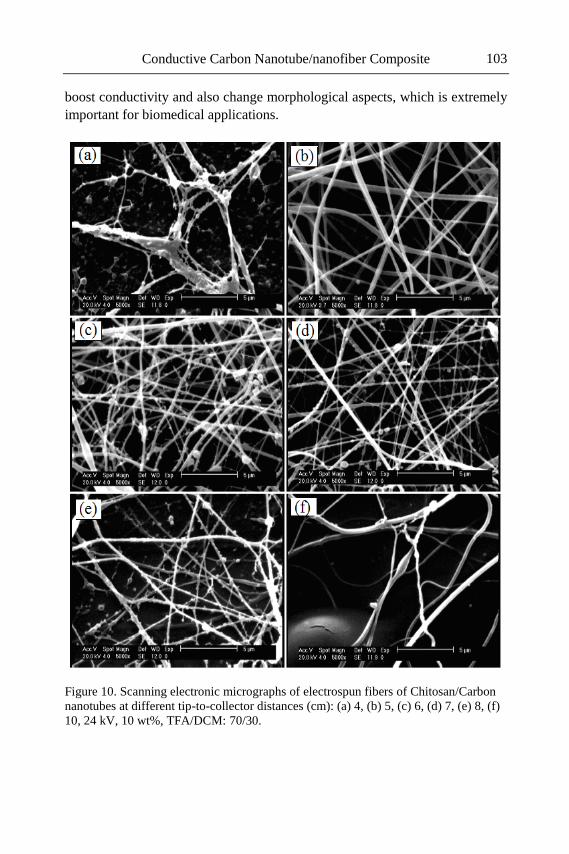
Conductive Carbon Nanotube/nanofiber Composite 103
boost conductivity and also change morphological aspects, which is extremely
important for biomedical applications.
Figure 10. Scanning electronic micrographs of electrospun fibers of Chitosan/Carbon
nanotubes at different tip-to-collector distances (cm): (a) 4, (b) 5, (c) 6, (d) 7, (e) 8, (f)
10, 24 kV, 10 wt%, TFA/DCM: 70/30.
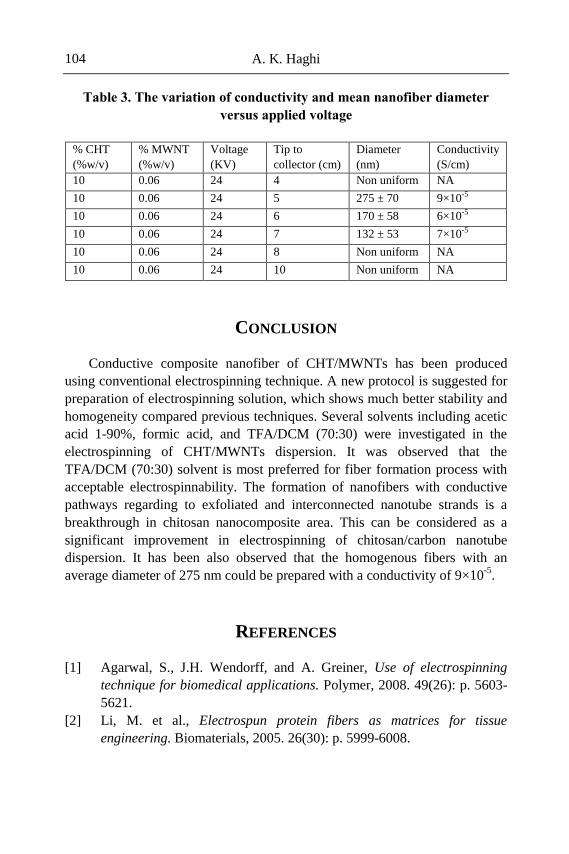
A. K. Haghi 104
Table 3. The variation of conductivity and mean nanofiber diameter
versus applied voltage
% CHT
(%w/v)
% MWNT
(%w/v)
Voltage
(KV)
Tip to
collector (cm)
Diameter
(nm)
Conductivity
(S/cm)
10 0.06 24 4 Non uniform NA
10 0.06 24 5 275 ± 70 9×10⁻⁵
10 0.06 24 6 170 ± 58 6×10⁻⁵
10 0.06 24 7 132 ± 53 7×10⁻⁵
10 0.06 24 8 Non uniform NA
10 0.06 24 10 Non uniform NA
CONCLUSION
Conductive composite nanofiber of CHT/MWNTs has been produced
using conventional electrospinning technique. A new protocol is suggested for
preparation of electrospinning solution, which shows much better stability and
homogeneity compared previous techniques. Several solvents including acetic
acid 1-90%, formic acid, and TFA/DCM (70:30) were investigated in the
electrospinning of CHT/MWNTs dispersion. It was observed that the
TFA/DCM (70:30) solvent is most preferred for fiber formation process with
acceptable electrospinnability. The formation of nanofibers with conductive
pathways regarding to exfoliated and interconnected nanotube strands is a
breakthrough in chitosan nanocomposite area. This can be considered as a
significant improvement in electrospinning of chitosan/carbon nanotube
dispersion. It has been also observed that the homogenous fibers with an
average diameter of 275 nm could be prepared with a conductivity of 9×10⁻⁵
.
REFERENCES
[1] Agarwal, S., J.H. Wendorff, and A. Greiner, Use of electrospinning
technique for biomedical applications. Polymer, 2008. 49(26): p. 5603-
5621.
[2] Li, M. et al., Electrospun protein fibers as matrices for tissue
engineering. Biomaterials, 2005. 26(30): p. 5999-6008.
Conductive Carbon Nanotube/nanofiber Composite 105
[3] Zeng, J. et al., Influence of the drug compatibility with polymer solution
on the release kinetics of electrospun fiber formulation. Journal of
Controlled Release, 2005. 105(1-2): p. 43-51.
[4] Khil, M.-S. et al., Electrospun nanofibrous polyurethane membrane as
wound dressing. Journal of Biomedical Materials Research Part B:
Applied Biomaterials, 2003. 67B(2): p. 675-679.
[5] G.I.Taylor, Electrically driven jets. Proc Roy Soc London 1969. 313: p.
453-475.
[6] Doshi, J. and D.H. Reneker, Electrospinning process and applications
of electrospun fibers. Journal of Electrostatics, 1995. 35(2-3): p. 151-
160.
[7] Li, D. and Y. Xia, Electrospinning of Nanofibers: Reinventing the
Wheel? Advanced Materials, 2004. 16(14): p. 1151-1170.
[8] Ziabari, M., V. Mottaghitalab, and A.K. Haghi, Evaluation of
electrospun nanofiber pore structure parameters. Korean J. Chem.
Eng., 2008. 25(4): p. 923-932.
[9] Tan, S.H. et al., Systematic parameter study for ultra-fine fiber
fabrication via electrospinning process. Polymer, 2005. 46(16): p.
6128-6134.
[10] Sukigara, S. et al., Regeneration of Bombyx mori silk by
electrospinning—part 1: processing parameters and geometric
properties. Polymer, 2003. 44: p. 5721-5727.
[11] Matthews, J.A. et al., Electrospinning of collagen nanofibers.
Biomacromolecules, 2002. 3(2): p. 232-8.
[12] McManus, M.C. et al., Electrospun fibrinogen: Feasibility as a tissue
engineering scaffold in a rat cell culture model. Journal of Biomedical
Materials Research Part A, 2007. 81A(2): p. 299-309.
[13] Huang, Z.-M. et al., Electrospinning and mechanical characterization of
gelatin nanofibers. Polymer, 2004. 45(15): p. 5361-5368.
[14] Zhang, X., M.R. Reagan, and D.L. Kaplan, Electrospun silk biomaterial
scaffolds for regenerative medicine. Advanced Drug Delivery Reviews,
2009. 61(12): p. 988-1006.
[15] Noh, H.K. et al., Electrospinning of chitin nanofibers: Degradation
behavior and cellular response to normal human keratinocytes and
fibroblasts. Biomaterials, 2006. 27(21): p. 3934-3944.
[16] K. Ohkawa et al., Chitosan Nanofiber. Biomacromolecules, 2006. 7: p.
3291-3294.
[17] Agboh, O.C. and Y. Qin, Chitin and Chitosan Fibers. Polymers for
Advanced Technologies, 1997. 8: p. 355-365.
A. K. Haghi 106
[18] Rinaudo, M., Chitin and chitosan: Properties and applications. Prog.
Polym. Sci., 2006. 31: p. 603-632.
[19] Aranaz, I. et al., Functional Characterization of Chitin and Chitosan.
Current Chemical Biology, 2009. 3: p. 203-230.
[20] Neamnark, A., R. Rujiravanit, and P. Supaphol, Electrospinning of
hexanoyl chitosan. Carbohydrate Polymers, 2006. 66(3): p. 298-305.
[21] Duan, B. et al., Electrospinning of chitosan solutions in acetic acid with
poly(ethylene oxide). Vol. 15. 2004, Leiden, PAYS-BAS: Brill. 15.
[22] Jia, Y.T. et al., Fabrication and characterization of poly (vinyl
alcohol)/chitosan blend nanoWbers produced by electrospinning
method. Carbohydrate Polymers, 2007. 67: p. 403-409.
[23] Homayoni, H., S.A.H. Ravandi, and M. Valizadeh, Electrospinning of
chitosan nanofibers: Processing optimization. Carbohydrate Polymers,
2009. 77: p. 656-661.
[24] Geng, X., O.H. Kwon, and J. Jang, Electrospinning of chitosan
dissolved in concentrated acetic acid solution. Biomaterials, 2005. 26:
p. 5427-5432.
[25] TORRES-GINER et al., Development of Active Antimicrobial Fiber
Based Chitosan Polysaccharide Nanostructures using Electrospinning.
2008, Weinheim, ALLEMAGNE: Wiley. 12.
[26] Vrieze, S.D. et al., Electrospinning of chitosan nanofibrous structures:
feasibility study. Journal of Materials Science, 2007. 42(19): p. 8029-
8034.
[27] Ohkawa, K. et al., Electrospinning of Chitosan. Macromolecular Rapid
Communications, 2004. 25(18): p. 1600-1605.
[28] Iijima, S., Helical microtubules of graphitic carbon. Nature, 1991.
354(6348): p. 56–58.
[29] Esawi, A.M.K. and M.M. Farag, Carbon nanotube reinforced
composites: Potential and current challenges. Materials & Design,
2007. 28(9): p. 2394-2401.
[30] Feng, W. et al., The fabrication and electrochemical properties of
electrospun nanofibers of a multi-walled carbon nanotube grafted by
chitosan. Nanotechnology, 2008. 19(10): p. 105707.
[31] Liao, H. et al., Improved cellular response on multi-walled carbon
nanotube-incorporated electrospun polyvinyl alcohol/chitosan
nanofibrous scaffolds. Colloids and Surfaces B: Biointerfaces, 2011. In
Press, Accepted Manuscript(doi:10.1016/j.colsurfb.2011.02.010): p. 1-
28.
Conductive Carbon Nanotube/nanofiber Composite 107
[32] Baek, S.-H., B. Kim, and K.-D. Suh, Chitosan particle/multi-wall
carbon nanotube composites by electrostatic interactions. Colloids and
Surfaces A: Physicochemical and Engineering Aspects, 2008. 316(1-3):
p. 292-296.
[33] Liu, Y.-L., W.-H. Chen, and Y.-H. Chang, Preparation and properties
of chitosan/carbon nanotube nanocomposites using poly(styrene
sulfonic acid)-modified CNTs. Carbohydrate Polymers, 2009. 76(2): p.
232-238.
[34] Tkac, J., J.W. Whittaker, and T. Ruzgas, The use of single walled
carbon nanotubes dispersed in a chitosan matrix for preparation of a
galactose biosensor. Biosensors and Bioelectronics, 2007. 22(8): p.
1820-1824.
[35] Spinks, G.M. et al., Mechanical properties of chitosan/CNT microfibers
obtained with improved dispersion. Sensors and Actuators B: Chemical,
2006. 115(2): p. 678-684.
[36] Zhang, H. et al., Regenerated-Cellulose/Multi-walled-Carbon-Nanotube
Composite Fibers with Enhanced Mechanical Properties Prepared with
the Ionic Liquid 1-Allyl-3-methylimidazolium Chloride. Adv. Mater. ,
2007. 19: p. 698–704.
[37] Deitzel, J.M. et al., The effect of processing variables on the
morphology of electrospun nanofibers and textiles. Polymer, 2001.
42(1): p. 261-272.
[38] Zhang, S., W.S. Shim, and J. Kim, Design of ultra-fine nonwovens via
electrospinning of Nylon 6: Spinning parameters and filtration
efficiency. Materials & Design, 2009. 30(9): p. 3659-3666.
[39] Li, Y., Z. Huang, and Yandong, Electrospinning of nylon-6,66,1010
terpolymer. European Polymer Journal, 2006. 42(7): p. 1696-1704.

In: Advanced Nanotube and Nanofiber Materials ISBN: 978-1-62081-170-2
Editors: A. K. Haghi and G. E. Zaikov © 2012 Nova Science Publishers, Inc.
Chapter 5
NANOSTRUCTURED FABRICS BASED
ON ELECTROSPUN NANOFIBERS
A. K. Haghi University of Guilan, Iran
INTRODUCTION
Nowadays, there are different types of protective clothing—some of are
disposable and some are non-disposable. The simplest and most preliminary of
this equipment is made from rubber or plastic that is completely impervious to
hazardous substances. Unfortunately, these materials are also impervious to air
and water vapor and thus retain body heat, exposing their wearer to heat stress,
which can build quite rapidly to a dangerous level. Another approach to
protective clothing is incorporating activated carbon into multi-layer fabric in
order to absorb toxic vapors from environment and prevent penetration to the
skin. The use of activated carbon is considered only a short-term solution
because it loses its effectiveness upon exposure to sweat and moisture. The use
of semi-permeable membranes as a constituent of the protective material is a
another approach. In this way, reactive chemical decontaminants encapsulates
in microparticles or fills in Microporous Hollow fibers and then coats onto
fabric. The microparticle or fiber walls are permeable to toxic vapors but
E-mail: [email protected].
A. K. Haghi 110
impermeable to decontaminants, so that the toxic agents diffuse selectively
into them and neutralize [1-3].
Generally, a negative relationship always exists between thermal comfort
and protection performance for currently available protective clothing. Thus
there still exists a very real demand for improved protective clothing that can
offer acceptable levels of impermeability to highly toxic pollutions of low
molecular weight, while minimizing wearer discomfort and heat stress.
Electrospinning provides an ultrathin membrane-like web of extremely
fine fibers with very small pore size and high porosity, which makes them
excellent candidates for use in filtration, membrane, and possibly protective
clothing applications. Preliminary investigations have indicated that the using
of nanofiber web in protective clothing structure could present minimal
impedance to air permeability and extremely efficiency in trapping dust and
aerosol particles. Meanwhile, it is found that the electrospun webs of nylon
6,6, polybenzimidazole, polyacrylonitrile, and polyurethane provided good
aerosol particle protection, without a considerable change in moisture vapor
transport or breathability of the system. While nanofiber webs suggest exciting
characteristics, it has been reported that they have limited mechanical
properties. In order to provide suitable mechanical properties for use as cloth,
nanofiber webs must be laminated via an adhesive into a fabric system. This
system could protect ultrathin nanofiber web versus mechanical stresses over
an extended period of time [4-14].
The adhesives could be as melt adhesive or solvent-based adhesive. When
a melt adhesive is used, the hot-press laminating is carried out at temperatures
above the softening or melting point of adhesive. If a solvent-based adhesive is
used, laminating process could perform at room temperature. In addition, the
solvent-based adhesive is generally environmentally unfriendly, more
expensive and usually flammable, whereas the hot-melt adhesive is
environmentally friendly, inexpensive requires less heat, and so is now more
preferred. However, without disclosure of laminating details, the hot-press
method is more suitable for nanofiber web lamination. In this method,
laminating temperature is one of the most important parameters. Incorrect
selection of this parameter may lead to change or damage nanofiber web.
Thus, it is necessary to find out a laminating temperature that has the least
effect on the nanofiber web.
It has been found that morphology such as fiber diameter and its
uniformity of the electrospun polymer fibers are dependent on many
processing parameters. These parameters can be divided into three groups as
shown in Table 1. Under certain conditions, not only uniform fibers but also
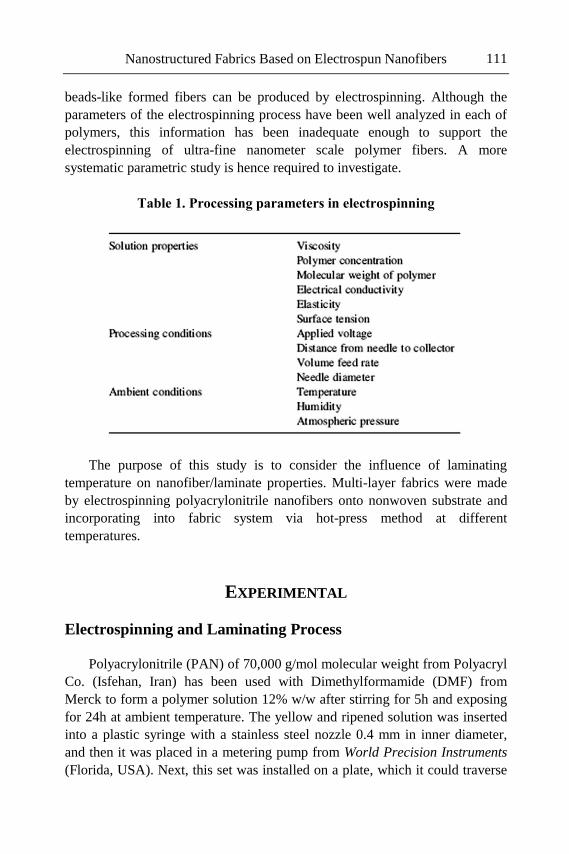
Nanostructured Fabrics Based on Electrospun Nanofibers 111
beads-like formed fibers can be produced by electrospinning. Although the
parameters of the electrospinning process have been well analyzed in each of
polymers, this information has been inadequate enough to support the
electrospinning of ultra-fine nanometer scale polymer fibers. A more
systematic parametric study is hence required to investigate.
Table 1. Processing parameters in electrospinning
The purpose of this study is to consider the influence of laminating
temperature on nanofiber/laminate properties. Multi-layer fabrics were made
by electrospinning polyacrylonitrile nanofibers onto nonwoven substrate and
incorporating into fabric system via hot-press method at different
temperatures.
EXPERIMENTAL
Electrospinning and Laminating Process
Polyacrylonitrile (PAN) of 70,000 g/mol molecular weight from Polyacryl
Co. (Isfehan, Iran) has been used with Dimethylformamide (DMF) from
Merck to form a polymer solution 12% w/w after stirring for 5h and exposing
for 24h at ambient temperature. The yellow and ripened solution was inserted
into a plastic syringe with a stainless steel nozzle 0.4 mm in inner diameter,
and then it was placed in a metering pump from World Precision Instruments
(Florida, USA). Next, this set was installed on a plate, which it could traverse
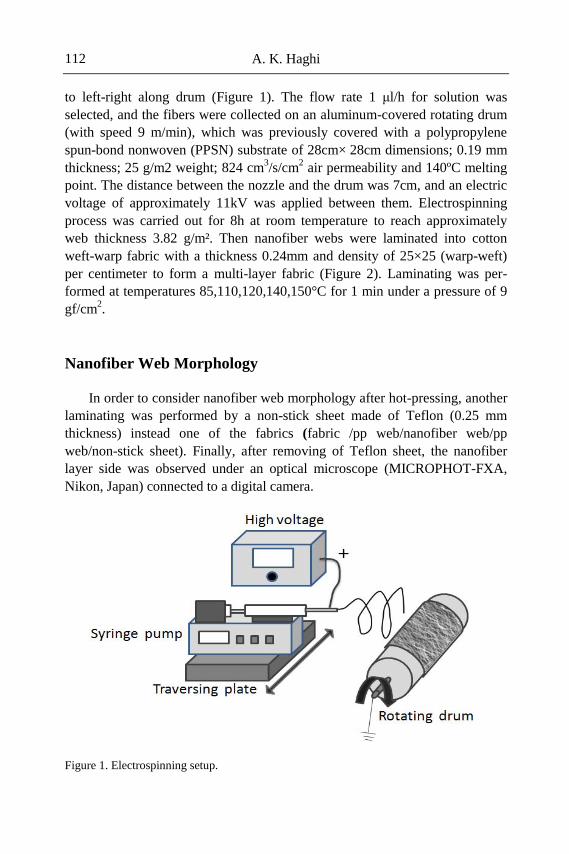
A. K. Haghi 112
to left-right along drum (Figure 1). The flow rate 1 μl/h for solution was
selected, and the fibers were collected on an aluminum-covered rotating drum
(with speed 9 m/min), which was previously covered with a polypropylene
spun-bond nonwoven (PPSN) substrate of 28cm× 28cm dimensions; 0.19 mm
thickness; 25 g/m2 weight; 824 cm3/s/cm
2 air permeability and 140ºC melting
point. The distance between the nozzle and the drum was 7cm, and an electric
voltage of approximately 11kV was applied between them. Electrospinning
process was carried out for 8h at room temperature to reach approximately
web thickness 3.82 g/m². Then nanofiber webs were laminated into cotton
weft-warp fabric with a thickness 0.24mm and density of 25×25 (warp-weft)
per centimeter to form a multi-layer fabric (Figure 2). Laminating was per-
formed at temperatures 85,110,120,140,150°C for 1 min under a pressure of 9
gf/cm2.
Nanofiber Web Morphology
In order to consider nanofiber web morphology after hot-pressing, another
laminating was performed by a non-stick sheet made of Teflon (0.25 mm
thickness) instead one of the fabrics (fabric /pp web/nanofiber web/pp
web/non-stick sheet). Finally, after removing of Teflon sheet, the nanofiber
layer side was observed under an optical microscope (MICROPHOT-FXA,
Nikon, Japan) connected to a digital camera.
Figure 1. Electrospinning setup.
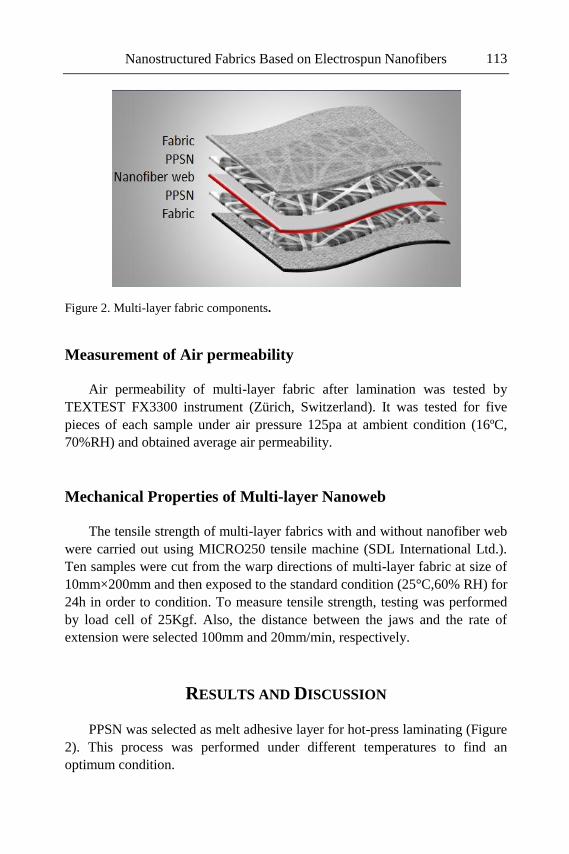
Nanostructured Fabrics Based on Electrospun Nanofibers 113
Figure 2. Multi-layer fabric components.
Measurement of Air permeability
Air permeability of multi-layer fabric after lamination was tested by
TEXTEST FX3300 instrument (Zürich, Switzerland). It was tested for five
pieces of each sample under air pressure 125pa at ambient condition (16ºC,
70%RH) and obtained average air permeability.
Mechanical Properties of Multi-layer Nanoweb
The tensile strength of multi-layer fabrics with and without nanofiber web
were carried out using MICRO250 tensile machine (SDL International Ltd.).
Ten samples were cut from the warp directions of multi-layer fabric at size of
10mm×200mm and then exposed to the standard condition (25°C,60% RH) for
24h in order to condition. To measure tensile strength, testing was performed
by load cell of 25Kgf. Also, the distance between the jaws and the rate of
extension were selected 100mm and 20mm/min, respectively.
RESULTS AND DISCUSSION
PPSN was selected as melt adhesive layer for hot-press laminating (Figure
2). This process was performed under different temperatures to find an
optimum condition.
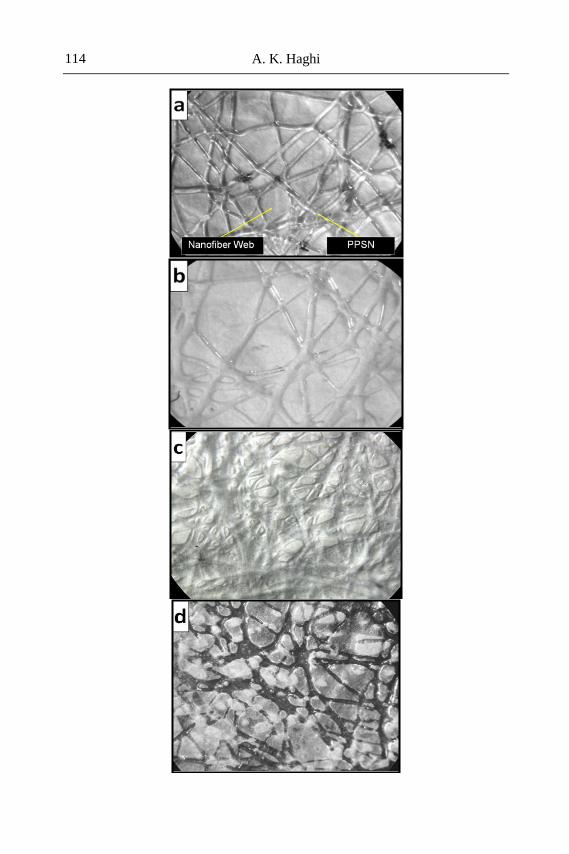
A. K. Haghi 114
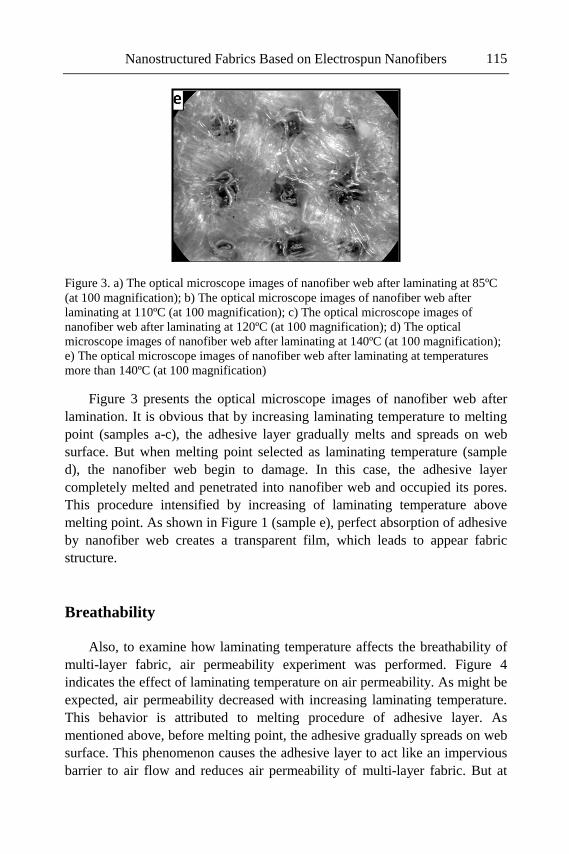
Nanostructured Fabrics Based on Electrospun Nanofibers 115
Figure 3. a) The optical microscope images of nanofiber web after laminating at 85ºC
(at 100 magnification); b) The optical microscope images of nanofiber web after
laminating at 110ºC (at 100 magnification); c) The optical microscope images of
nanofiber web after laminating at 120ºC (at 100 magnification); d) The optical
microscope images of nanofiber web after laminating at 140ºC (at 100 magnification);
e) The optical microscope images of nanofiber web after laminating at temperatures
more than 140ºC (at 100 magnification)
Figure 3 presents the optical microscope images of nanofiber web after
lamination. It is obvious that by increasing laminating temperature to melting
point (samples a-c), the adhesive layer gradually melts and spreads on web
surface. But when melting point selected as laminating temperature (sample
d), the nanofiber web begin to damage. In this case, the adhesive layer
completely melted and penetrated into nanofiber web and occupied its pores.
This procedure intensified by increasing of laminating temperature above
melting point. As shown in Figure 1 (sample e), perfect absorption of adhesive
by nanofiber web creates a transparent film, which leads to appear fabric
structure.
Breathability
Also, to examine how laminating temperature affects the breathability of
multi-layer fabric, air permeability experiment was performed. Figure 4
indicates the effect of laminating temperature on air permeability. As might be
expected, air permeability decreased with increasing laminating temperature.
This behavior is attributed to melting procedure of adhesive layer. As
mentioned above, before melting point, the adhesive gradually spreads on web
surface. This phenomenon causes the adhesive layer to act like an impervious
barrier to air flow and reduces air permeability of multi-layer fabric. But at
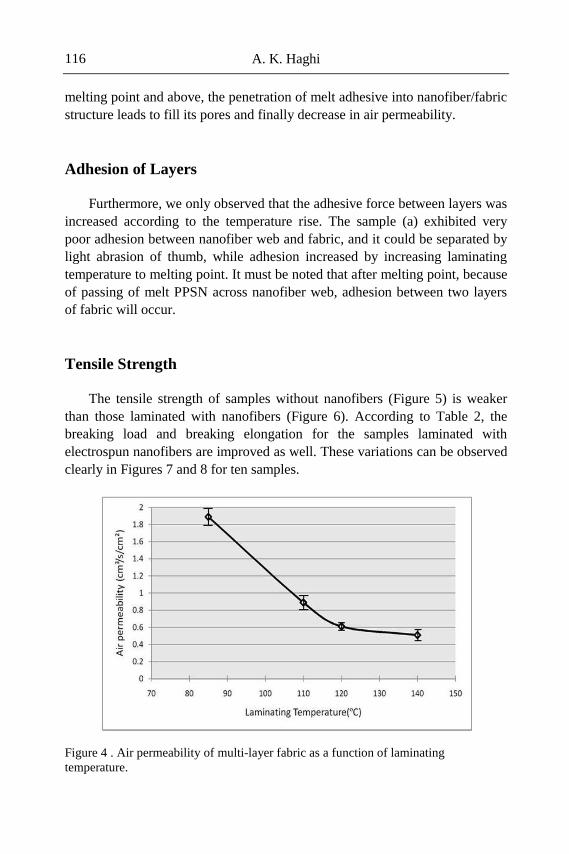
A. K. Haghi 116
melting point and above, the penetration of melt adhesive into nanofiber/fabric
structure leads to fill its pores and finally decrease in air permeability.
Adhesion of Layers
Furthermore, we only observed that the adhesive force between layers was
increased according to the temperature rise. The sample (a) exhibited very
poor adhesion between nanofiber web and fabric, and it could be separated by
light abrasion of thumb, while adhesion increased by increasing laminating
temperature to melting point. It must be noted that after melting point, because
of passing of melt PPSN across nanofiber web, adhesion between two layers
of fabric will occur.
Tensile Strength
The tensile strength of samples without nanofibers (Figure 5) is weaker
than those laminated with nanofibers (Figure 6). According to Table 2, the
breaking load and breaking elongation for the samples laminated with
electrospun nanofibers are improved as well. These variations can be observed
clearly in Figures 7 and 8 for ten samples.
Figure 4 . Air permeability of multi-layer fabric as a function of laminating
temperature.
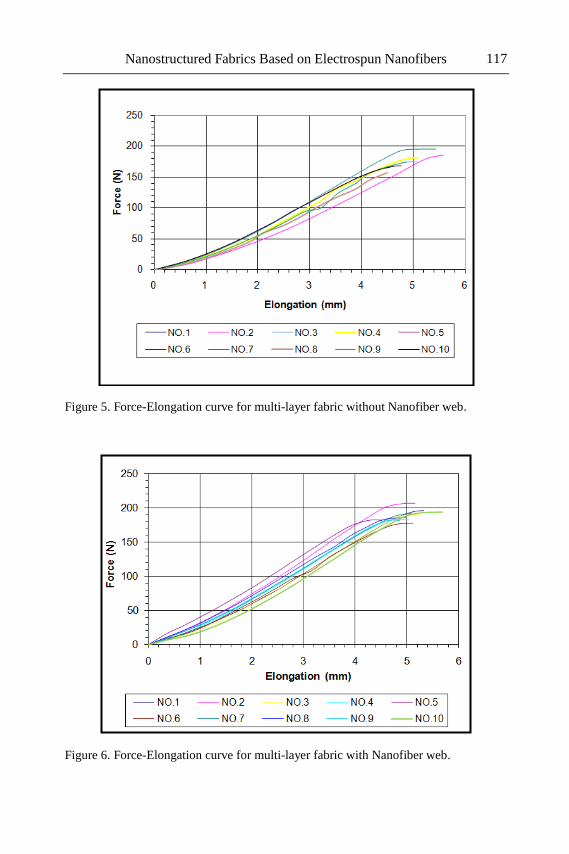
Nanostructured Fabrics Based on Electrospun Nanofibers 117
Figure 5. Force-Elongation curve for multi-layer fabric without Nanofiber web.
Figure 6. Force-Elongation curve for multi-layer fabric with Nanofiber web.
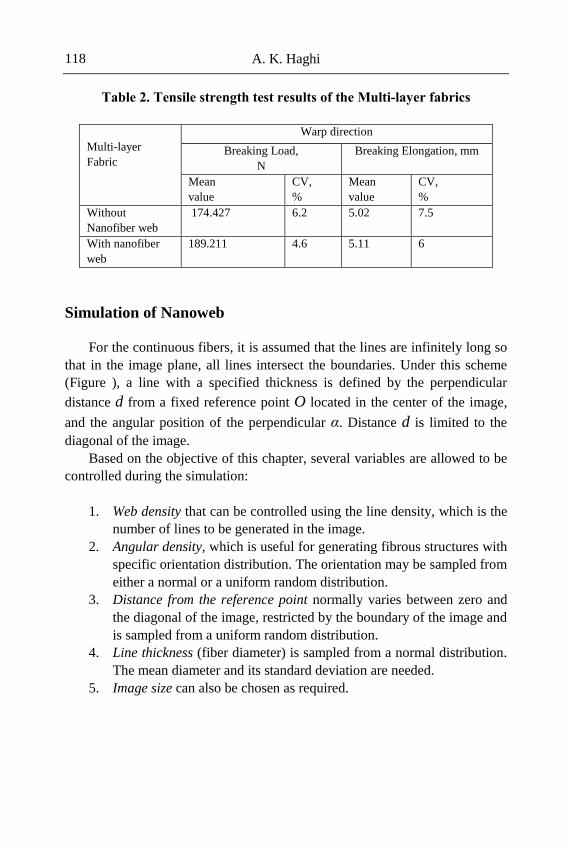
A. K. Haghi 118
Table 2. Tensile strength test results of the Multi-layer fabrics
Multi-layer
Fabric
Warp direction
Breaking Load,
N
Breaking Elongation, mm
Mean
value
CV,
%
Mean
value
CV,
%
Without
Nanofiber web
174.427 6.2 5.02 7.5
With nanofiber
web
189.211 4.6 5.11 6
Simulation of Nanoweb
For the continuous fibers, it is assumed that the lines are infinitely long so
that in the image plane, all lines intersect the boundaries. Under this scheme
(Figure ), a line with a specified thickness is defined by the perpendicular
distance d from a fixed reference point O located in the center of the image,
and the angular position of the perpendicular α. Distance d is limited to the
diagonal of the image.
Based on the objective of this chapter, several variables are allowed to be
controlled during the simulation:
1. Web density that can be controlled using the line density, which is the
number of lines to be generated in the image.
2. Angular density, which is useful for generating fibrous structures with
specific orientation distribution. The orientation may be sampled from
either a normal or a uniform random distribution.
3. Distance from the reference point normally varies between zero and
the diagonal of the image, restricted by the boundary of the image and
is sampled from a uniform random distribution.
4. Line thickness (fiber diameter) is sampled from a normal distribution.
The mean diameter and its standard deviation are needed.
5. Image size can also be chosen as required.
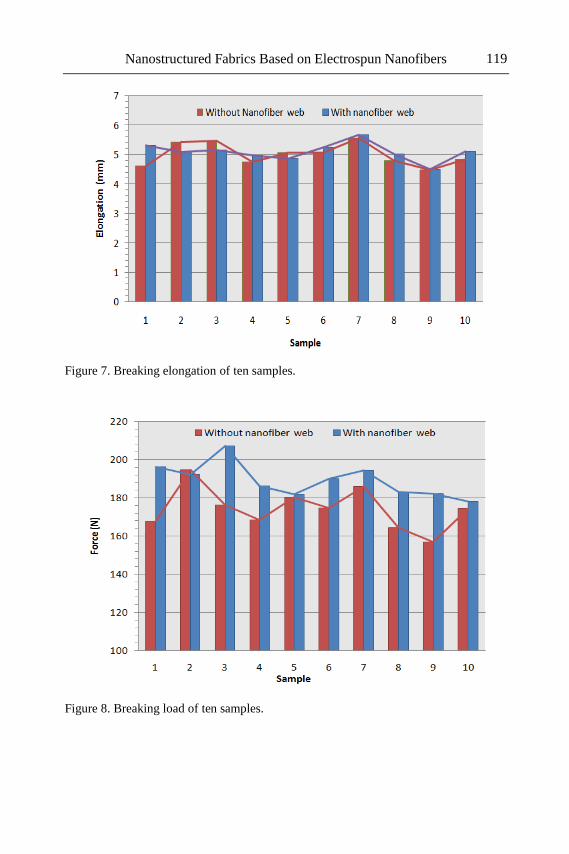
Nanostructured Fabrics Based on Electrospun Nanofibers 119
Figure 7. Breaking elongation of ten samples.
Figure 8. Breaking load of ten samples.
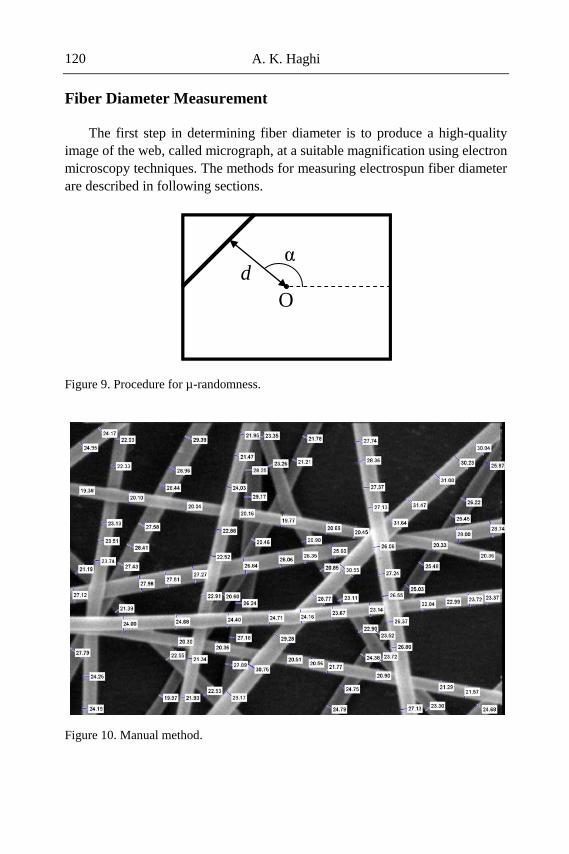
A. K. Haghi 120
Fiber Diameter Measurement
The first step in determining fiber diameter is to produce a high-quality
image of the web, called micrograph, at a suitable magnification using electron
microscopy techniques. The methods for measuring electrospun fiber diameter
are described in following sections.
Figure 9. Procedure for µ-randomness.
Figure 10. Manual method.
αd
O
αd
O
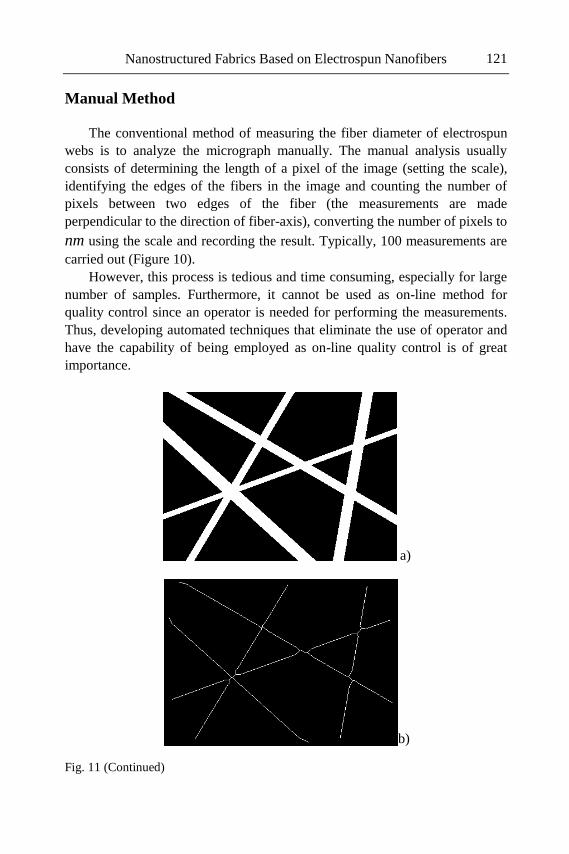
Nanostructured Fabrics Based on Electrospun Nanofibers 121
Manual Method
The conventional method of measuring the fiber diameter of electrospun
webs is to analyze the micrograph manually. The manual analysis usually
consists of determining the length of a pixel of the image (setting the scale),
identifying the edges of the fibers in the image and counting the number of
pixels between two edges of the fiber (the measurements are made
perpendicular to the direction of fiber-axis), converting the number of pixels to
nm using the scale and recording the result. Typically, 100 measurements are
carried out (Figure 10).
However, this process is tedious and time consuming, especially for large
number of samples. Furthermore, it cannot be used as on-line method for
quality control since an operator is needed for performing the measurements.
Thus, developing automated techniques that eliminate the use of operator and
have the capability of being employed as on-line quality control is of great
importance.
a)
b)
Fig. 11 (Continued)
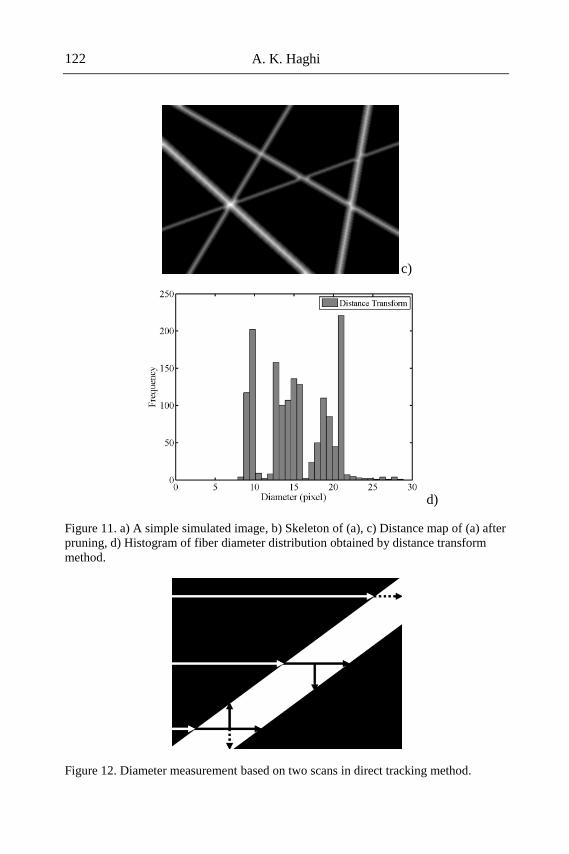
A. K. Haghi 122
c)
d)
Figure 11. a) A simple simulated image, b) Skeleton of (a), c) Distance map of (a) after
pruning, d) Histogram of fiber diameter distribution obtained by distance transform
method.
Figure 12. Diameter measurement based on two scans in direct tracking method.
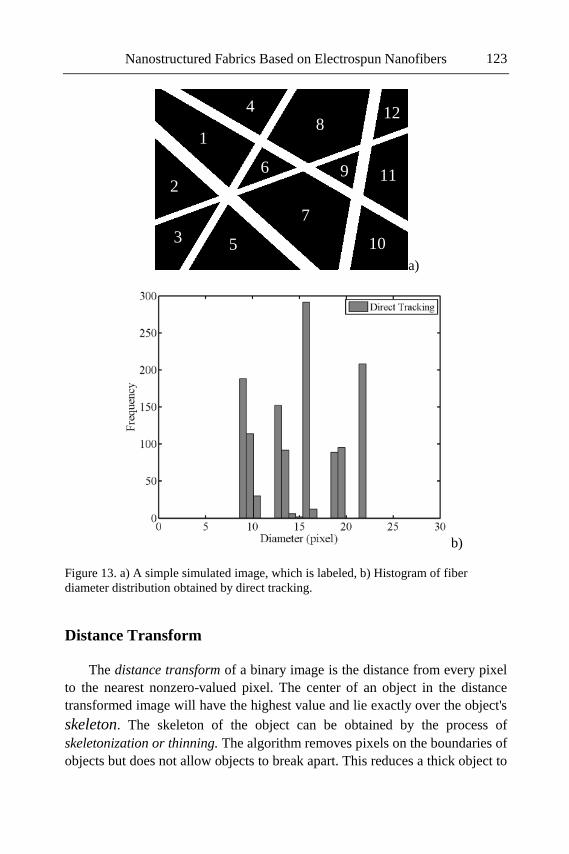
Nanostructured Fabrics Based on Electrospun Nanofibers 123
a)
b)
Figure 13. a) A simple simulated image, which is labeled, b) Histogram of fiber
diameter distribution obtained by direct tracking.
Distance Transform
The distance transform of a binary image is the distance from every pixel
to the nearest nonzero-valued pixel. The center of an object in the distance
transformed image will have the highest value and lie exactly over the object's
skeleton. The skeleton of the object can be obtained by the process of
skeletonization or thinning. The algorithm removes pixels on the boundaries of
objects but does not allow objects to break apart. This reduces a thick object to
1
2
3
48
6
7
5
9
12
11
10
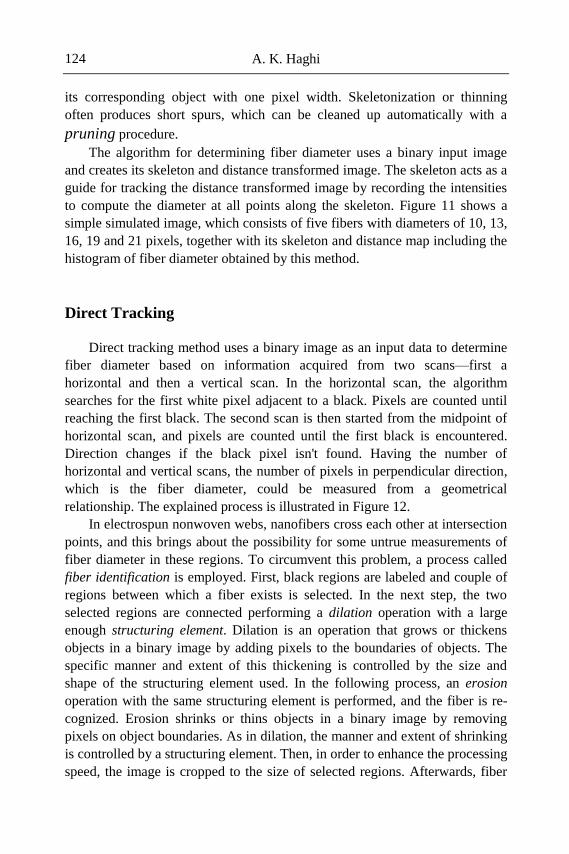
A. K. Haghi 124
its corresponding object with one pixel width. Skeletonization or thinning
often produces short spurs, which can be cleaned up automatically with a
pruning procedure.
The algorithm for determining fiber diameter uses a binary input image
and creates its skeleton and distance transformed image. The skeleton acts as a
guide for tracking the distance transformed image by recording the intensities
to compute the diameter at all points along the skeleton. Figure 11 shows a
simple simulated image, which consists of five fibers with diameters of 10, 13,
16, 19 and 21 pixels, together with its skeleton and distance map including the
histogram of fiber diameter obtained by this method.
Direct Tracking
Direct tracking method uses a binary image as an input data to determine
fiber diameter based on information acquired from two scans—first a
horizontal and then a vertical scan. In the horizontal scan, the algorithm
searches for the first white pixel adjacent to a black. Pixels are counted until
reaching the first black. The second scan is then started from the midpoint of
horizontal scan, and pixels are counted until the first black is encountered.
Direction changes if the black pixel isn't found. Having the number of
horizontal and vertical scans, the number of pixels in perpendicular direction,
which is the fiber diameter, could be measured from a geometrical
relationship. The explained process is illustrated in Figure 12.
In electrospun nonwoven webs, nanofibers cross each other at intersection
points, and this brings about the possibility for some untrue measurements of
fiber diameter in these regions. To circumvent this problem, a process called
fiber identification is employed. First, black regions are labeled and couple of
regions between which a fiber exists is selected. In the next step, the two
selected regions are connected performing a dilation operation with a large
enough structuring element. Dilation is an operation that grows or thickens
objects in a binary image by adding pixels to the boundaries of objects. The
specific manner and extent of this thickening is controlled by the size and
shape of the structuring element used. In the following process, an erosion
operation with the same structuring element is performed, and the fiber is re-
cognized. Erosion shrinks or thins objects in a binary image by removing
pixels on object boundaries. As in dilation, the manner and extent of shrinking
is controlled by a structuring element. Then, in order to enhance the processing
speed, the image is cropped to the size of selected regions. Afterwards, fiber
Nanostructured Fabrics Based on Electrospun Nanofibers 125
diameter is measured according to the previously explained algorithm. This
trend is continued until all of the fibers are analyzed. Finally, the data in pixels
may be converted to nm, and the histogram of fiber diameter distribution is
plotted. Figure 13 shows a labeled simple simulated image and the histogram
of fiber diameter obtained by this method.
CONCLUSION
In this chapter, effect of laminating temperature on nanofiber/laminate
properties were investigated to make next-generation protective clothing. First,
surface images of nanofiber web after lamination were taken using optical
microscope in order to consider morphology changes. It was observed that
nanofiber web remains unchanged as laminating temperature is below PPSN
melting point. In addition, to compare breathability of laminates, air
permeability was measured. It was found that by increasing laminating temp,
air permeability was decreased. Furthermore, it only was observed that the
adhesive force between layers in laminate was increased with temperature rise.
The mechanical properties of the samples laminated by electrospun nanofibers
showed significant improvements.
These results indicated that laminating temperature is effective parameter
for lamination of nanofiber web into fabric structure. Thus, by varying this
parameter, fabrics with different levels of thermal comfort and protection
could be developed depending on our need and use.
REFERENCES
[1] M. Ziabari, V. Mottaghitalab, S. T. McGovern and A. K. Haghi, Chim.
Phys. Lett., 25, 3071 (2008).
[2] M. Ziabari, V. Mottaghitalab, S. T. McGovern and A. K. Haghi,
Nanoscale Research Letter, 2, 297(2007).
[3] M. Ziabari, V. Mottaghitalab and A. K. Haghi, Korean J. Chem. Eng.,
25, 919 (2008).
[4] M. Ziabari, V. Mottaghitalab and A. K. Haghi, Korean J. Chem. Eng.,
25, 923 (2008).
[5] M. Ziabari, V. Mottaghitalab and A. K. Haghi, Korean J. Chem. Eng.,
25, 905 (2008).
A. K. Haghi 126
[6] A. K. Haghi and M. Akbari, Physica Status Solidi, 204, 1830 (2007).
[7] M. Kanafchian, M. Valizadeh and A.K. Haghi, Korean J. Chem. Eng.,
28, 428 (2011).
[8] M. Kanafchian, M. Valizadeh and A.K. Haghi, Korean J. Chem. Eng.,
28, 763 (2011).
[9] M. Kanafchian, M. Valizadeh and A.K. Haghi, Korean J. Chem. Eng.,
28, 751 (2011).
[10] M. Kanafchian, M. Valizadeh and A.K. Haghi, Korean J. Chem. Eng.,
28, 445(2011).
[11] A. Afzali, V. Mottaghitalab, M. Motlagh, A.K. Haghi, Korean J. Chem.
Eng., 27, 1145(2010).
[12] Z. Moridi, V. Mottaghitalab, A.K. Haghi, Korean J. Chem. Eng., 28,
445(2011).
[13] A.K. Haghi, Cellulose Chem. Technol., 44, 343 (2010)
[14] Z. Moridi, V. Mottaghitalab, A. K. Haghi, Cellulose Chem. Technol.,
45, 549 (2011)
In: Advanced Nanotube and Nanofiber Materials ISBN: 978-1-62081-170-2
Editors: A. K. Haghi and G. E. Zaikov © 2012 Nova Science Publishers, Inc.
Chapter 6
CARBON NANOTUBES GEOMETRY
AND REINFORCEMENT DEGREE
OF POLYMER NANOCOMPOSITES
Z. M. Zhirikova1, V. Z. Aloev
1, G. V. Kozlov
1
and G. E. Zaikov2
1Kabardino-Balkarian State Agricultural Academy,
Nal’chik Russian Federation 2N.M. Emanuel Institute of Biochemical Physics
of Russian Academy of Sciences,
Moscow, Russian Federation
INTRODUCTION
At present, it is considered that carbon nanotubes (CNT) are one of the
most perspective nanofillers for polymer nanocomposites [1]. The high
anisotropy degree (their length to diameter large ratio) and low transverse
stiffness are CNTs-specific features. These factors define CNTs ring-like
structures formation at manufacture and their introduction in polymer matrix.
Such structures radius depends to a considerable extent on CNTs length and
diameter. Thus, the strong dependence of nanofiller structure on its geometry
is CNTs application-specific feature. Therefore, the present work purpose is to
study the dependence of nanocomposites butadiene-styrene rubber/carbon
Z. M. Zhirikova, V. Z. Aloev, G. V. Kozlov et al. 128
nanorubes (BSR/CNT) properties on nanofiller structure, received by CVD
method with two catalysts usage.
EXPERIMENTAL
The nanocomposites BSR/CNT with CNT content of 0.3 mass % have
been used as the study object. CNT have been received in the Institute of
Applied Mechanics of Russian Academy of Sciences by the vapors catalytic
chemical deposition method (CVD), based on carbon-containing gas
thermochemical deposition on non metallic catalyst surface. Two catalysts –
Fe/Al2O3 (CNT-Fe) and Co/Al2O3 (CNT-Co) – have been used for the studied
CNT. The received nanotubes have diameter of 20 nm and length of order of 2
mcm.
The nanofiller structure was studied on force-atomic microscope Nano-
DST (Pacific Nanotechnology, USA) by a semi-contact method in the force
modulation regime. The received CNT size and polydispersity analysis was
made with the aid of the analytical disk centrifuge (CPS Instrument, Inc.,
USA), allowing to determine with high precision the size and distribution by
sizes in range from 2 nm up to 5 mcm. The nanocomposites BSR/CNT
elasticity modulus was determined by nanoindentation method on apparatus
Nano-Test 600 (Great Britain).
RESULTS AND DISCUSSION
In Figure 1, the electron microphotographs of CNT coils are adduced,
which demonstrate ring-like structures formation for this nanofiller. In Figure
2, the indicated structures distribution by sizes was shown, from which it
follows that for CNT-Fe, narrow enough monodisperse distribution with
maximum at 280 nm is observed and for CNT-Co – polydisperse distribution
with maximums at ~ 50 and 210 nm.
Further, let us carry out the analytical estimation of CNT formed ring-like
structures radius RCNT. The first method uses the following formula, obtained
within the frameworks of percolation theory [2]:
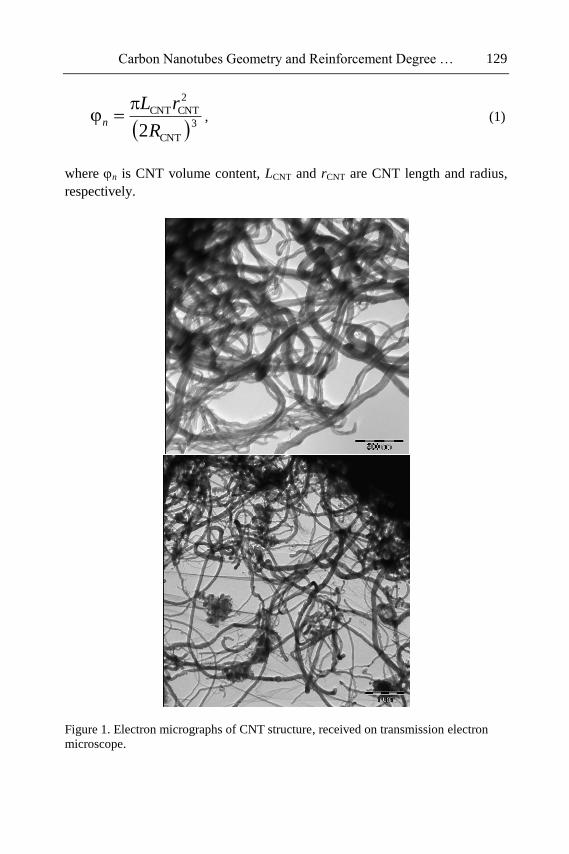
Carbon Nanotubes Geometry and Reinforcement Degree … 129
3
CNT
2
CNTCNT
2R
rLn
, (1)
where n is CNT volume content, LCNT and rCNT are CNT length and radius,
respectively.
Figure 1. Electron micrographs of CNT structure, received on transmission electron
microscope.
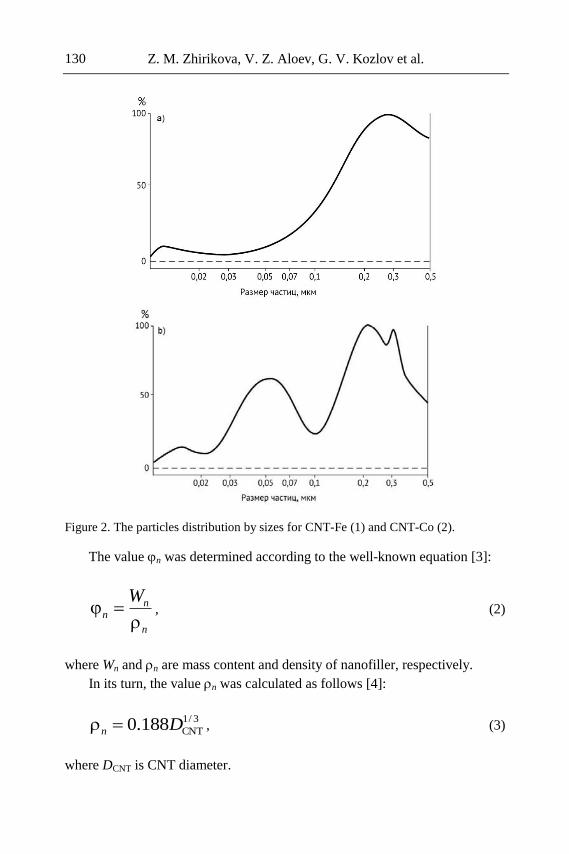
Z. M. Zhirikova, V. Z. Aloev, G. V. Kozlov et al. 130
Figure 2. The particles distribution by sizes for CNT-Fe (1) and CNT-Co (2).
The value n was determined according to the well-known equation [3]:
n
nn
W
, (2)
where Wn and n are mass content and density of nanofiller, respectively.
In its turn, the value n was calculated as follows [4]:
3/1
CNT188.0 Dn , (3)
where DCNT is CNT diameter.
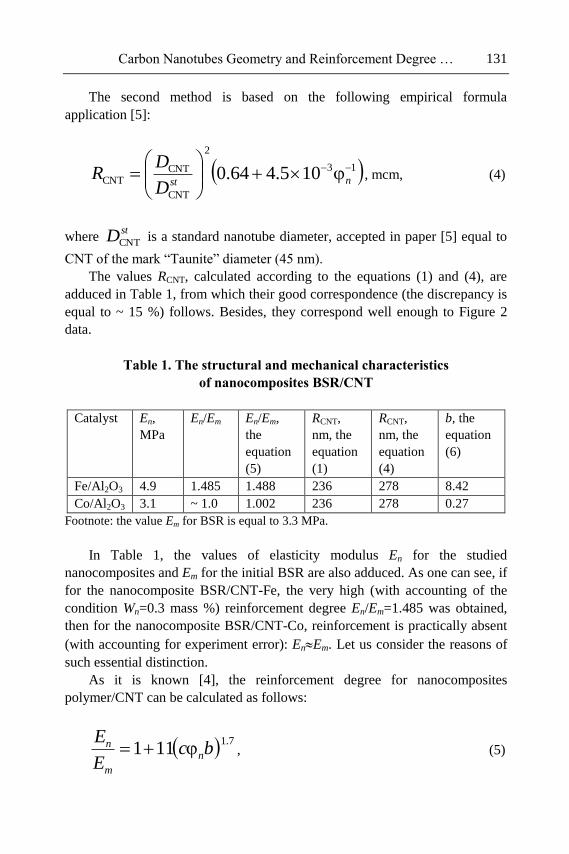
Carbon Nanotubes Geometry and Reinforcement Degree … 131
The second method is based on the following empirical formula
application [5]:
13
2
CNT
CNTCNT 105.464.0
nstD
DR , mcm, (4)
where stDCNT
is a standard nanotube diameter, accepted in paper [5] equal to
CNT of the mark “Taunite” diameter (45 nm).
The values RCNT, calculated according to the equations (1) and (4), are
adduced in Table 1, from which their good correspondence (the discrepancy is
equal to ~ 15 %) follows. Besides, they correspond well enough to Figure 2
data.
Table 1. The structural and mechanical characteristics
of nanocomposites BSR/CNT
Catalyst En,
MPa
En/Em En/Em,
the
equation
(5)
RCNT,
nm, the
equation
(1)
RCNT,
nm, the
equation
(4)
b, the
equation
(6)
Fe/Al2O3 4.9 1.485 1.488 236 278 8.42
Co/Al2O3 3.1 ~ 1.0 1.002 236 278 0.27
Footnote: the value Em for BSR is equal to 3.3 MPa.
In Table 1, the values of elasticity modulus En for the studied
nanocomposites and Em for the initial BSR are also adduced. As one can see, if
for the nanocomposite BSR/CNT-Fe, the very high (with accounting of the
condition Wn=0.3 mass %) reinforcement degree En/Em=1.485 was obtained,
then for the nanocomposite BSR/CNT-Co, reinforcement is practically absent
(with accounting for experiment error): EnEm. Let us consider the reasons of
such essential distinction.
As it is known [4], the reinforcement degree for nanocomposites
polymer/CNT can be calculated as follows:
7.1111 bc
E
En
m
n , (5)
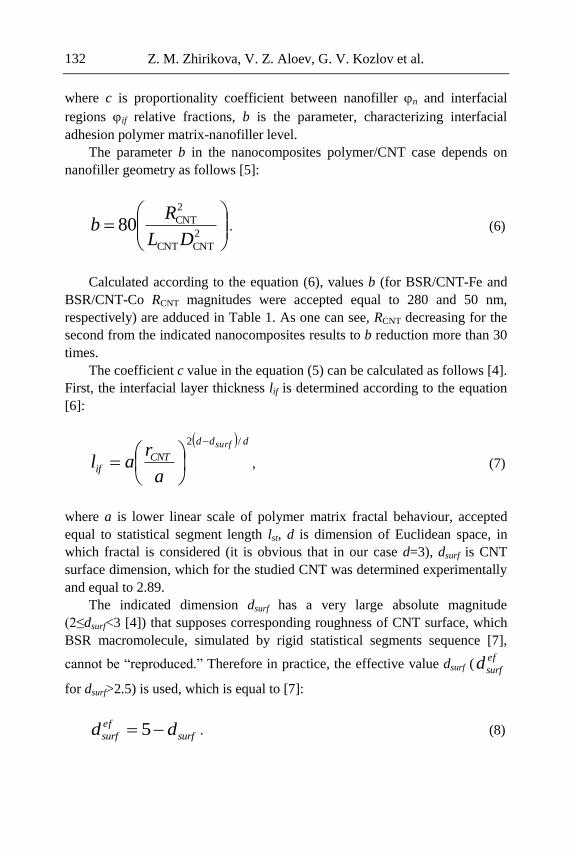
Z. M. Zhirikova, V. Z. Aloev, G. V. Kozlov et al. 132
where c is proportionality coefficient between nanofiller n and interfacial
regions if relative fractions, b is the parameter, characterizing interfacial
adhesion polymer matrix-nanofiller level.
The parameter b in the nanocomposites polymer/CNT case depends on
nanofiller geometry as follows [5]:
2
CNTCNT
2
CNT80DL
Rb . (6)
Calculated according to the equation (6), values b (for BSR/CNT-Fe and
BSR/CNT-Co RCNT magnitudes were accepted equal to 280 and 50 nm,
respectively) are adduced in Table 1. As one can see, RCNT decreasing for the
second from the indicated nanocomposites results to b reduction more than 30
times.
The coefficient c value in the equation (5) can be calculated as follows [4].
First, the interfacial layer thickness lif is determined according to the equation
[6]:
ddd
CNTif
surf
a
ral
/2
, (7)
where a is lower linear scale of polymer matrix fractal behaviour, accepted
equal to statistical segment length lst, d is dimension of Euclidean space, in
which fractal is considered (it is obvious that in our case d=3), dsurf is CNT
surface dimension, which for the studied CNT was determined experimentally
and equal to 2.89.
The indicated dimension dsurf has a very large absolute magnitude
(2≤dsurf<3 [4]) that supposes corresponding roughness of CNT surface, which
BSR macromolecule, simulated by rigid statistical segments sequence [7],
cannot be “reproduced.” Therefore in practice, the effective value dsurf (ef
surfd
for dsurf>2.5) is used, which is equal to [7]:
surf
ef
surf dd 5 . (8)
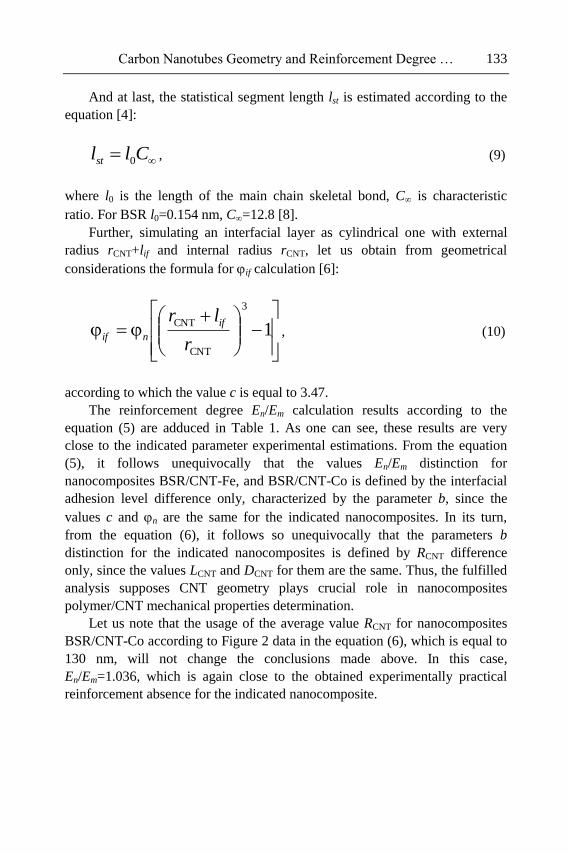
Carbon Nanotubes Geometry and Reinforcement Degree … 133
And at last, the statistical segment length lst is estimated according to the
equation [4]:
Cllst 0 , (9)
where l0 is the length of the main chain skeletal bond, C is characteristic
ratio. For BSR l0=0.154 nm, C=12.8 [8].
Further, simulating an interfacial layer as cylindrical one with external
radius rCNT+lif and internal radius rCNT, let us obtain from geometrical
considerations the formula for if calculation [6]:
1
3
CNT
CNT
r
lr if
nif , (10)
according to which the value c is equal to 3.47.
The reinforcement degree En/Em calculation results according to the
equation (5) are adduced in Table 1. As one can see, these results are very
close to the indicated parameter experimental estimations. From the equation
(5), it follows unequivocally that the values En/Em distinction for
nanocomposites BSR/CNT-Fe, and BSR/CNT-Co is defined by the interfacial
adhesion level difference only, characterized by the parameter b, since the
values c and n are the same for the indicated nanocomposites. In its turn,
from the equation (6), it follows so unequivocally that the parameters b
distinction for the indicated nanocomposites is defined by RCNT difference
only, since the values LCNT and DCNT for them are the same. Thus, the fulfilled
analysis supposes CNT geometry plays crucial role in nanocomposites
polymer/CNT mechanical properties determination.
Let us note that the usage of the average value RCNT for nanocomposites
BSR/CNT-Co according to Figure 2 data in the equation (6), which is equal to
130 nm, will not change the conclusions made above. In this case,
En/Em=1.036, which is again close to the obtained experimentally practical
reinforcement absence for the indicated nanocomposite.
Z. M. Zhirikova, V. Z. Aloev, G. V. Kozlov et al. 134
CONCLUSION
Thus, the obtained in the present work results have shown that the
nanotubes geometry, characterized by their length, diameter and ring-like
structures radius, is nanocomposites polymer/CNT-specific feature. This factor
plays a crucial role in the interfacial adhesion polymer matrix – nanofiller
level determination and, as consequence, in polymer nanocomposites, filled
with CNT, mechanical properties formation.
REFERENCES
[1] Yanovskii Yu. G. Nanomechanics and Strength of Composite Materials.
Moscow, Publishers of IPRIM RAN, 2008, 179 p.
[2] Bridge B. J. Mater. Sci. Lett., 1989, v. 8, № 2, p. 102-103.
[3] Sheng N., Boyce M.C., Parks D.M., Rutledge G.C., Abes J.I., Cohen
R.E. Polymer, 2004, v. 45, № 2, p. 487-506.
[4] Mikitaev A.K., Kozlov G.V., Zaikov G.E. Polymer Nanocomposites:
Variety of Structural Forms and Applications. New York, Nova Science
Publishers, Inc., 2008, 319 p.
[5] Zhirikova Z.M., Kozlov G.V., Aloev V.Z. Mater. of VII Intern. Sci.-
Pract. Conf. “New Polymer Composite Materials.” Nal’chik, KBSU,
2011, p. 158-164.
[6] Kozlov G.V., Burya A.I., Lipatov Yu.S. Mekhanika Kompozitnykh
Materialov, 2006, v. 42, № 6, p. 797-802.
[7] Van Damme H., Levitz P., Bergaya F., Alcover J.F., Gatineau L., Fripiat
J.J. J. Chem. Phys., 1986, v. 85, № 1, p. 616-625.
[8] Yanovskii Yu.G., Kozlov G.V., Karnet Yu.N. Mekhanika
Kompozitsionnykh Materialov i Konstruktsii, 2011, v. 17, № 2, p. 203-
208.
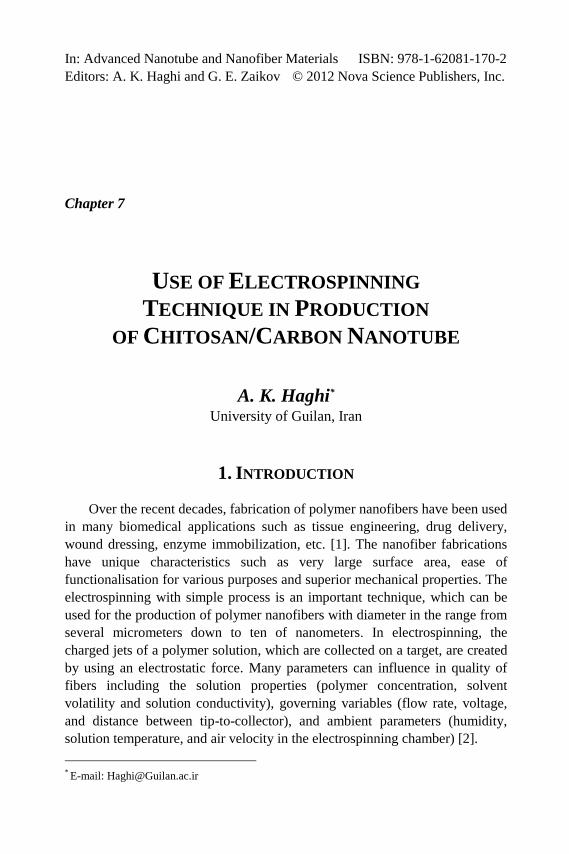
In: Advanced Nanotube and Nanofiber Materials ISBN: 978-1-62081-170-2
Editors: A. K. Haghi and G. E. Zaikov © 2012 Nova Science Publishers, Inc.
Chapter 7
USE OF ELECTROSPINNING
TECHNIQUE IN PRODUCTION
OF CHITOSAN/CARBON NANOTUBE
A. K. Haghi* University of Guilan, Iran
1. INTRODUCTION
Over the recent decades, fabrication of polymer nanofibers have been used
in many biomedical applications such as tissue engineering, drug delivery,
wound dressing, enzyme immobilization, etc. [1]. The nanofiber fabrications
have unique characteristics such as very large surface area, ease of
functionalisation for various purposes and superior mechanical properties. The
electrospinning with simple process is an important technique, which can be
used for the production of polymer nanofibers with diameter in the range from
several micrometers down to ten of nanometers. In electrospinning, the
charged jets of a polymer solution, which are collected on a target, are created
by using an electrostatic force. Many parameters can influence in quality of
fibers including the solution properties (polymer concentration, solvent
volatility and solution conductivity), governing variables (flow rate, voltage,
and distance between tip-to-collector), and ambient parameters (humidity,
solution temperature, and air velocity in the electrospinning chamber) [2].
* E-mail: [email protected]
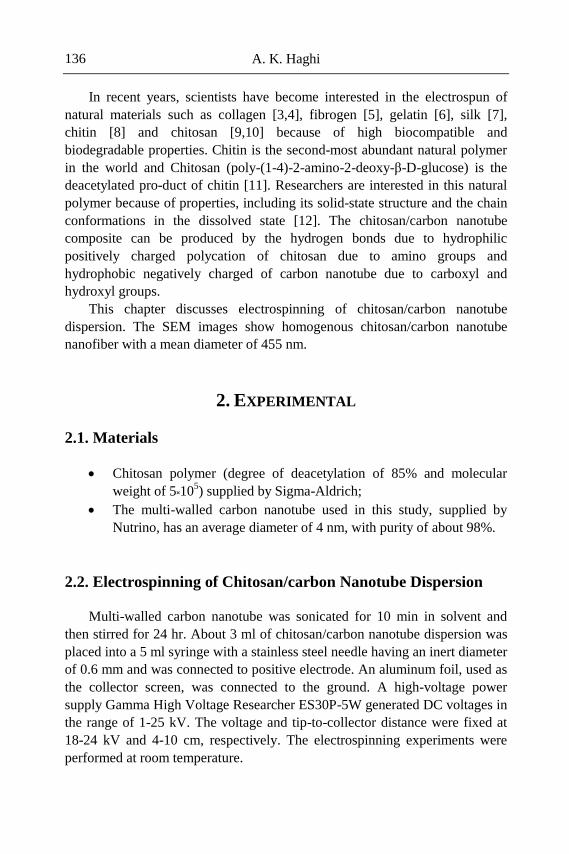
A. K. Haghi 136
In recent years, scientists have become interested in the electrospun of
natural materials such as collagen [3,4], fibrogen [5], gelatin [6], silk [7],
chitin [8] and chitosan [9,10] because of high biocompatible and
biodegradable properties. Chitin is the second-most abundant natural polymer
in the world and Chitosan (poly-(1-4)-2-amino-2-deoxy-β-D-glucose) is the
deacetylated pro-duct of chitin [11]. Researchers are interested in this natural
polymer because of properties, including its solid-state structure and the chain
conformations in the dissolved state [12]. The chitosan/carbon nanotube
composite can be produced by the hydrogen bonds due to hydrophilic
positively charged polycation of chitosan due to amino groups and
hydrophobic negatively charged of carbon nanotube due to carboxyl and
hydroxyl groups.
This chapter discusses electrospinning of chitosan/carbon nanotube
dispersion. The SEM images show homogenous chitosan/carbon nanotube
nanofiber with a mean diameter of 455 nm.
2. EXPERIMENTAL
2.1. Materials
Chitosan polymer (degree of deacetylation of 85% and molecular
weight of 5˟105) supplied by Sigma-Aldrich;
The multi-walled carbon nanotube used in this study, supplied by
Nutrino, has an average diameter of 4 nm, with purity of about 98%.
2.2. Electrospinning of Chitosan/carbon Nanotube Dispersion
Multi-walled carbon nanotube was sonicated for 10 min in solvent and
then stirred for 24 hr. About 3 ml of chitosan/carbon nanotube dispersion was
placed into a 5 ml syringe with a stainless steel needle having an inert diameter
of 0.6 mm and was connected to positive electrode. An aluminum foil, used as
the collector screen, was connected to the ground. A high-voltage power
supply Gamma High Voltage Researcher ES30P-5W generated DC voltages in
the range of 1-25 kV. The voltage and tip-to-collector distance were fixed at
18-24 kV and 4-10 cm, respectively. The electrospinning experiments were
performed at room temperature.
Use of Electrospinning Technique … 137
Figure 1. Scanning electron micrographs of electrospun fibers at different chitosan
concentration (wt%): (a) 8, (b) 9, (c) 10, (d) 11, (e) 12, 24 kV, 5 cm, TFA/DCM:
70/30.
Figure 2. Scanning electronic micrographs of electrospun fibers at different voltage
(kV): (a) 18, (b) 20, (c) 22, (d) 24, 5 cm, 10 wt%, TFA/DCM: 70/30.
A. K. Haghi 138
3. RESULTS AND DISCUSSION
The different solvents including acetic acid 1-90%, formic acid, and
TFA/DCM tested for the electrospinning of chitosan/carbon nanotube. No jet
was seen upon applying the high voltage even above 25 kV by using of acetic
acid 1-30% and formic acid as the solvent for chitosan/carbon nanotube. When
the acetic acid is 30-90%, used as the solvent, beads were deposited on the
collector. Therefore, under these conditions, nanofiber of carbon nanotube/
chitosan was not obtained.
Figure 1 shows Scanning electronic micrographs of the carbon chitosan/
nanotube electrospun fibers in different concentration of chitosan in TFA/
DCM (70:30) solvent. As presented in Figure 1a, at low concentrations of
chitosan, the beads deposited on the collector, and thin fibers coexited among
the beads. As the concentration of chitosan increased (Figures 1a-c), the beads
decreased significantly. Figure 1c show homogenous electrospun fibers with
minimum beads, thin fibers and interconnected fibers. Increase of chitosan
concentration leads to increase of interconnected fibers as shown in Figures
1d-e. The average diameter of chitosan/carbon nanotube fibers were increased
by increasing concentration of chitosan (Figures 1 a-e). Hence, chitosan/
carbon nanotube solution of TFA/DCM (70:30) with 10 wt% of chitosan
resulted in optimized conditions for electrospinning of this solution with an
average diameter of 455 nm (Figure 1c: with diameter distribution of, 306-
672).
When the voltage was low, the beads were deposited on collector (Figure
2a). As shown in Figures 2a-d, the number of beads decreased by increasing
the voltage from 18 kV to 24 kV. In our study, the average diameter of fibers
prepared by 18 kV measured as 307 nm. As the applied voltage increased, the
average fiber diameters increased as well. The average diameter of fibers for
20 kV (2b), 22 kV (2c), and 24 kV (2d), was 308 (194-792), 448 (267-656),
455 (306-672) respectively.
The morphologies of chitosan/carbon nanotube electrospun fibers at
different distance tip-to-collector are presented in Figure 3. When the distance
tip-to-collector was low, the solvent did not vapor, hence a little
interconnected fiber (with high fiber diameter) deposited on the collector (as
shown in Figure 3a). In 5 cm distance tip-to-collector (Figure 3b), more
homogenous fibers with negligible beads were obtained. However, the beads
increased by increasing of distance tip-to-collector (Figure 3b to Figure 3f).
Also, our study represented that the diameter of electrospun fibers decreased
by increasing of distance tip-to-collector (as shown in Figures 3b, 3c, 3d, we
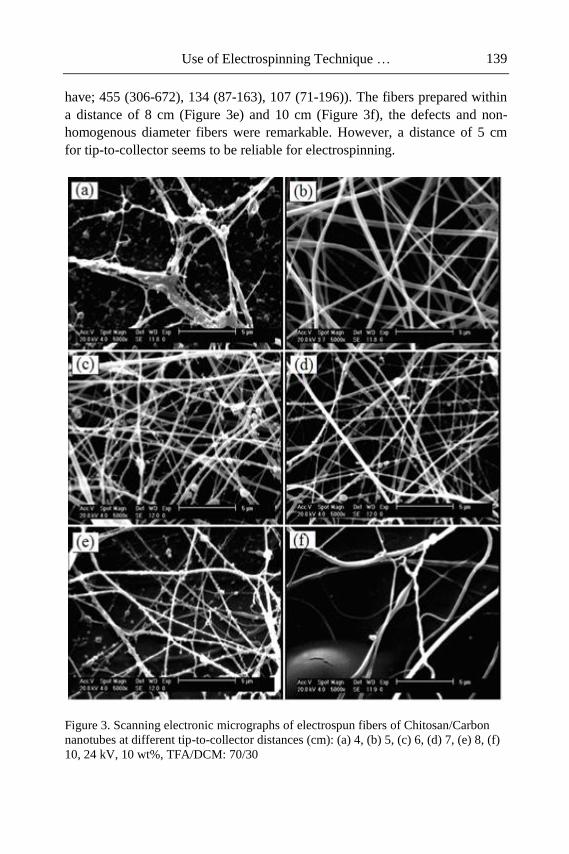
Use of Electrospinning Technique … 139
have; 455 (306-672), 134 (87-163), 107 (71-196)). The fibers prepared within
a distance of 8 cm (Figure 3e) and 10 cm (Figure 3f), the defects and non-
homogenous diameter fibers were remarkable. However, a distance of 5 cm
for tip-to-collector seems to be reliable for electrospinning.
Figure 3. Scanning electronic micrographs of electrospun fibers of Chitosan/Carbon
nanotubes at different tip-to-collector distances (cm): (a) 4, (b) 5, (c) 6, (d) 7, (e) 8, (f)
10, 24 kV, 10 wt%, TFA/DCM: 70/30
A. K. Haghi 140
CONCLUSION
Several solvents including acetic acid 1-90%, formic acid, and TFA/DCM
(70:30) were used for electrospinning of chitosan/carbon nanotube dispersion.
It is observed that the TFA/DCM (70:30) solvent was the only solvent with a
proper reliability for electrospinnability of chitosan/carbon nanotube. This is a
significant improvement in electrospinning of chitosan/carbon nanotube
dispersion. It is also observed that the homogenous fibers with an average
diameter of 455 nm (306-672) could be prepared with chitosan/carbon
nanotube dispersion in TFA/DCM 70:30. Meanwhile, the SEM images
showed that the fiber diameter decreased by decreasing of voltage and
increasing the distance of tip-to-collector.
REFERENCES
[1] M. Ziabari, V. Mottaghitalab, A. K. Haghi, Simulated image of
electrospun nonwoven web of PVA and corresponding nanofiber
diameter distribution, Korean Journal of Chemical engng, Vol.25, No.
4, pp. 919-922,2008.
[2] M. Ziabari, V. Mottaghitalab, A. K. Haghi, Evaluation of electrospun
nanofiber pore structure parameters, Korean Journal of Chemical
engng, Vol.25, No. 4, pp. 923-932,2008.
[3] M. Ziabari, V. Mottaghitalab, A. K. Haghi, Distance transform
algorithm for measuring nanofiber diameter, Korean Journal of
Chemical engng, Vol25, No. 4, pp. 905-918,2008.
[4] Kyong Su Rho, Lim Jeong, Gene Lee, Byoung-Moo Seo, Yoon Jeong
Park, Seong-Doo Hong, Sangho Roh, Jae Jin Cho, Won Ho Park,
Byung-Moo Min, Electrospinning of collagen nanofibers: Effects on the
behavior of normal human keratinocytes and early-stage wound healing,
Biomaterials 27 (2006) 1452–1461.
[5] Michael C. McManus, Eugene D. Boland, David G. Simpson, Catherine
P. Barnes, Gary L. Bowlin, Electrospun fibrinogen: Feasibility as a
tissue engineering scaffold in a rat cell culture model, InterScience.
DOI: 10.1002/jbm.a.30989.
[6] Zheng-Ming Huang, Y.Z. Zhang, S. Ramakrishna, C.T. Lim,
Electrospinning and mechanical characterization of gelatin nanofibers,
Polymer 45 (2004) 5361–5368.
Use of Electrospinning Technique … 141
[7] Xiaohui Zhang, Michaela R. Reagan, David L. Kaplan, Electrospun silk
biomaterial scaffolds for regenerative medicine, Advanced Drug
Delivery Reviews 61 (2009) 988–1006.
[8] Hyung Kil Noh, Sung Won Lee, Jin-Man Kim, Ju-Eun Oh, Kyung-Hwa
Kim, Chong-Pyoung Chung, Soon-Chul Choi, Won Ho Park, Byung-
Moo Min, Electrospinning of chitin nanofibers: Degradation behavior
and cellular response to normal human keratinocytes and fibroblasts,
Biomaterials 27 (2006) 3934–3944.
[9] Kousaku Ohkawa, Ken-Ichi Minato, Go Kumagai, Shinya Hayashi, and
Hiroyuki Yamamoto, Chitosan Nanofiber, Biomacromolecules 2006, 7,
3291-3294.
[10] Xinying Geng, Oh-Hyeong Kwon, Jinho Jang, Electrospinning of
chitosan dissolved in concentrated acetic acid solution, Biomaterials 26
(2005) 5427–5432.
[11] O. C. Agboh and Y. Qin, Chitin and Chitosan Fibers, Polymers for
Advanced Technologies 8 (1997) 355–365. [12] R. Marguerite, Chitin
and chitosan: properties and applications, Prog. Polym. Sci. 31 (2006)
603-632.

In: Advanced Nanotube and Nanofiber Materials ISBN: 978-1-62081-170-2
Editors: A. K. Haghi and G. E. Zaikov © 2012 Nova Science Publishers, Inc.
Chapter 8
COMBUSTION AND THERMAL
DEGRADATION OF POLYPROPYLENE IN THE
PRESENCE OF MULTI-WALLED CARBON
NANOTUBE COMPOSITES
G. E. Zaikov1, S. M. Lomakin
1,
N. G. Shilkina2 and R. Kozlowski
3
1 NM Emanuel Institute of Biochemical Physics of Russian
Academy of Sciences, Moscow, Russia 2 NN Semenov Institute of Chemical Physics of Russian
Academy of Sciences, Moscow, Russia 3 Institut Inzynierii Materialow Polimerowych I Barwnikow,
Torun, Poland
INTRODUCTION
At present time, great attention is given to the study of properties of
polymeric nanocomposites produced on the basis of well-known thermo-
plastics (PP, PE, PS, PMMA, polycarbonates, polyamides) and carbon
nanotubes (CN). CNs are considered to have the wide set of important
properties like thermal stability, reduced combustibility, electroconductivity,
etc. [1-7]. Thermoplastic polymer nanocomposites are generally produced with
the use of melting technique [1-12].
G. E. Zaikov, S. M. Lomakin, N. G. Shilkina et al. 144
Development of synthetic methods and the thermal characteristics study of
PP/multi-walled carbon nanotube (MWCNT) nanocomposites were taken as
an objective in this paper.
A number of papers pointed at synthesis and research of thermal
properties of nanocomposites (atactic polypropylene (aPP)/MWCNT) were
reported [10-12]. It is remarkable that PP/MWCNT composites with minor
level of nanocarbon content (1-5% by weight) were determined to obtain an
increase in thermal and thermal-oxidative stability in the majority of these
publications.
Thermal stability of aPP and aPP/MWCNT nanocomposites with the
various concentrations of MWCNT was studied in the paper [10]. It was
shown that thermal degradation processes are similar for aPP and
aPP/MWCNT nanocomposites, and initial degradation temperatures are the
same. However, the maximum mass loss rate temperature of PP/MWCNT
nanocomposites with 1 and 5% wt of MWCNT raised by 40° - 70°C as
compared with pristine aPP.
Kashiwagi et al. published the results of study of thermal and combustion
properties of PP/MWCNT nanocomposites [11, 12]. A significant decrease of
maximum heat release rate was detected during combustion research with use
of cone calorimeter. A formation of char network structure during the
combustion process was considered to be the main reason of combustibility
decrease. The carbonization influence upon combustibility of polymeric
nanocomposites was widely presented in literature [10-12, 13]. Notably,
Kashiwagi et al. [11, 12] were the first to hypothesize that abnormal
dependence of maximum heat release rate upon MWCNT concentration is
closely related with thermal conductivity growth of PP/MWCNT
nanocomposites during high-temperature pyrolysis and combustion.
EXPERIMENTAL
Materials
Isotactic polypropylene (melting flow index = 0.7 g/10 min) was used as a
polymer matrix in this paper. Multi-walled carbon nanotubes (MWCNT)
(purchased from Shenzhen Nanotechnologies Co. Ltd.) were used as a carbon-
containing nanofillers. This product contains low amount of amorphous carbon
(less than 0.3 wt%) and could be produced with different size characteristics—
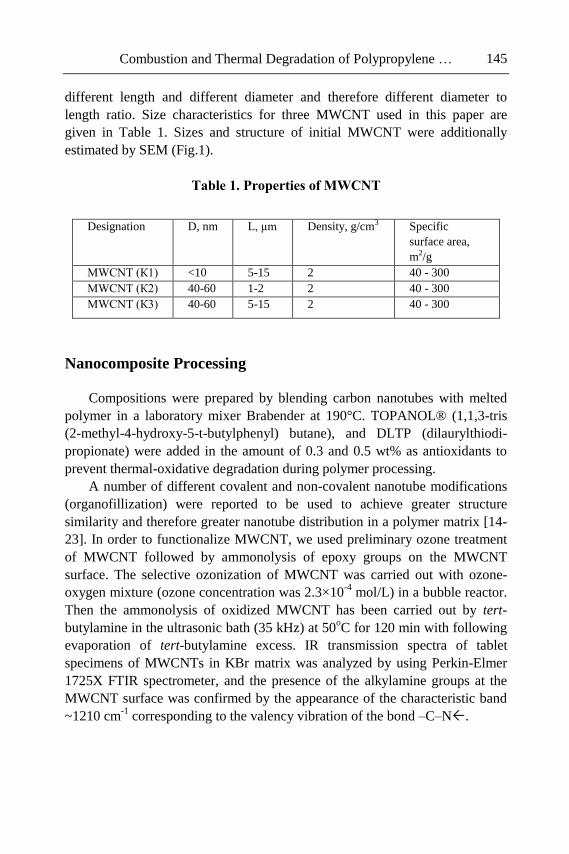
Combustion and Thermal Degradation of Polypropylene … 145
different length and different diameter and therefore different diameter to
length ratio. Size characteristics for three MWCNT used in this paper are
given in Table 1. Sizes and structure of initial MWCNT were additionally
estimated by SEM (Fig.1).
Table 1. Properties of MWCNT
Designation D, nm L, μm Density, g/cm3 Specific
surface area,
m2/g
MWCNT (К1) <10 5-15 2 40 - 300
MWCNT (К2) 40-60 1-2 2 40 - 300
MWCNT (К3) 40-60 5-15 2 40 - 300
Nanocomposite Processing
Compositions were prepared by blending carbon nanotubes with melted
polymer in a laboratory mixer Brabender at 190°C. TOPANOL® (1,1,3-tris
(2-methyl-4-hydroxy-5-t-butylphenyl) butane), and DLTP (dilaurylthiodi-
propionate) were added in the amount of 0.3 and 0.5 wt% as antioxidants to
prevent thermal-oxidative degradation during polymer processing.
A number of different covalent and non-covalent nanotube modifications
(organofillization) were reported to be used to achieve greater structure
similarity and therefore greater nanotube distribution in a polymer matrix [14-
23]. In order to functionalize MWCNT, we used preliminary ozone treatment
of MWCNT followed by ammonolysis of epoxy groups on the MWCNT
surface. The selective ozonization of MWCNT was carried out with ozone-
oxygen mixture (ozone concentration was 2.3×10⁻⁴
mol/L) in a bubble reactor.
Then the ammonolysis of oxidized MWCNT has been carried out by tert-
butylamine in the ultrasonic bath (35 kHz) at 50oC for 120 min with following
evaporation of tert-butylamine excess. IR transmission spectra of tablet
specimens of MWCNTs in KBr matrix was analyzed by using Perkin-Elmer
1725X FTIR spectrometer, and the presence of the alkylamine groups at the
MWCNT surface was confirmed by the appearance of the characteristic band
~1210 cm-1
corresponding to the valency vibration of the bond –C–N.
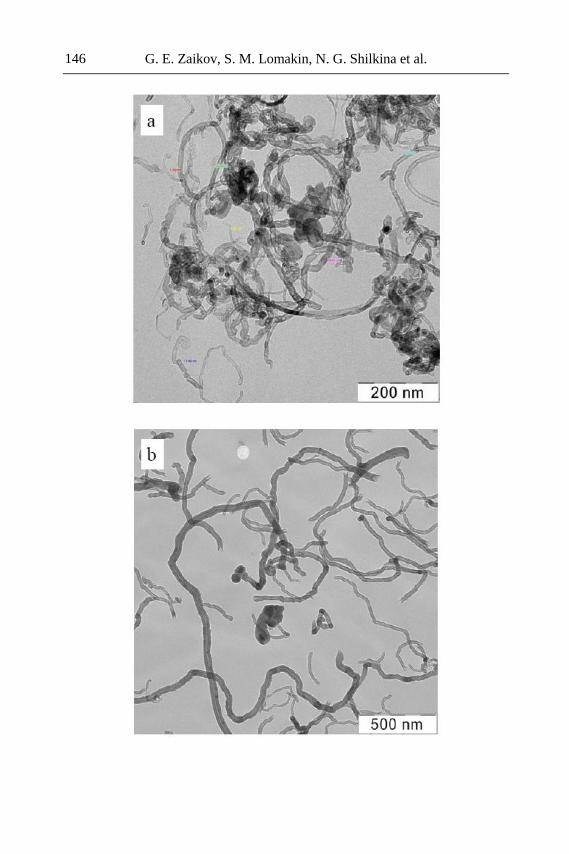
G. E. Zaikov, S. M. Lomakin, N. G. Shilkina et al. 146
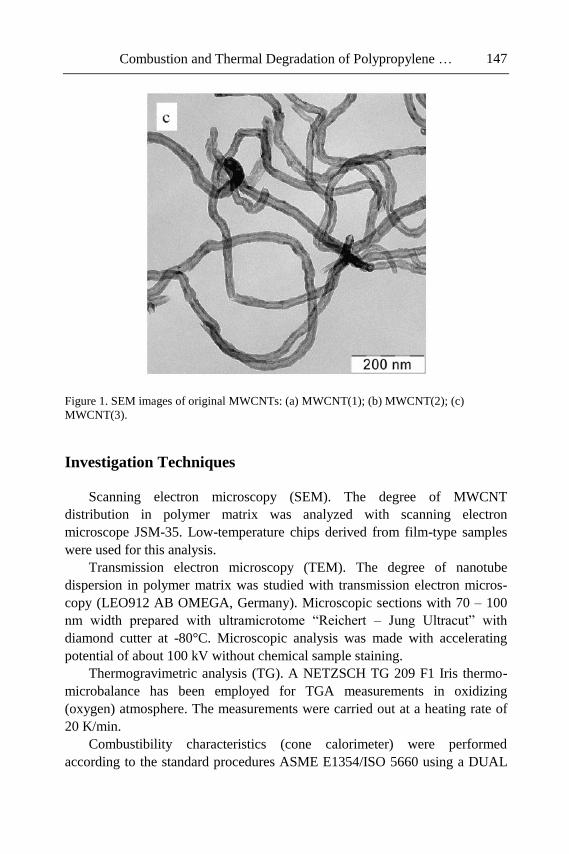
Combustion and Thermal Degradation of Polypropylene … 147
Figure 1. SEM images of original MWCNTs: (a) MWCNT(1); (b) MWCNT(2); (c)
MWCNT(3).
Investigation Techniques
Scanning electron microscopy (SEM). The degree of MWCNT
distribution in polymer matrix was analyzed with scanning electron
microscope JSM-35. Low-temperature chips derived from film-type samples
were used for this analysis.
Transmission electron microscopy (TEM). The degree of nanotube
dispersion in polymer matrix was studied with transmission electron micros-
copy (LEO912 AB OMEGA, Germany). Microscopic sections with 70 – 100
nm width prepared with ultramicrotome “Reichert – Jung Ultracut” with
diamond cutter at -80°C. Microscopic analysis was made with accelerating
potential of about 100 kV without chemical sample staining.
Thermogravimetric analysis (TG). A NETZSCH TG 209 F1 Iris thermo-
microbalance has been employed for TGA measurements in oxidizing
(oxygen) atmosphere. The measurements were carried out at a heating rate of
20 K/min.
Combustibility characteristics (cone calorimeter) were performed
according to the standard procedures ASME E1354/ISO 5660 using a DUAL
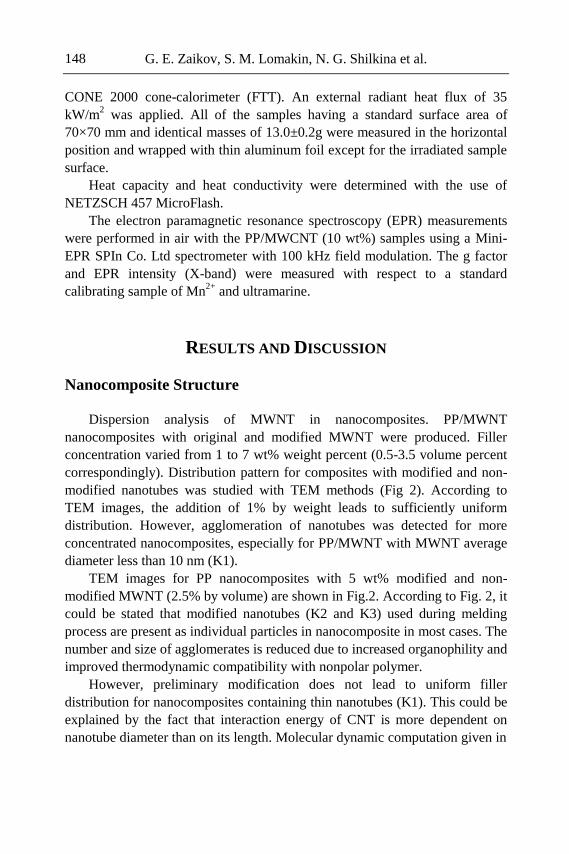
G. E. Zaikov, S. M. Lomakin, N. G. Shilkina et al. 148
CONE 2000 cone-calorimeter (FTT). An external radiant heat flux of 35
kW/m2 was applied. All of the samples having a standard surface area of
70×70 mm and identical masses of 13.0±0.2g were measured in the horizontal
position and wrapped with thin aluminum foil except for the irradiated sample
surface.
Heat capacity and heat conductivity were determined with the use of
NETZSCH 457 MicroFlash.
The electron paramagnetic resonance spectroscopy (EPR) measurements
were performed in air with the PP/MWCNT (10 wt%) samples using a Mini-
EPR SPIn Co. Ltd spectrometer with 100 kHz field modulation. The g factor
and EPR intensity (X-band) were measured with respect to a standard
calibrating sample of Mn2+
and ultramarine.
RESULTS AND DISCUSSION
Nanocomposite Structure
Dispersion analysis of MWNT in nanocomposites. PP/MWNT
nanocomposites with original and modified MWNT were produced. Filler
concentration varied from 1 to 7 wt% weight percent (0.5-3.5 volume percent
correspondingly). Distribution pattern for composites with modified and non-
modified nanotubes was studied with TEM methods (Fig 2). According to
TEM images, the addition of 1% by weight leads to sufficiently uniform
distribution. However, agglomeration of nanotubes was detected for more
concentrated nanocomposites, especially for PP/MWNT with MWNT average
diameter less than 10 nm (K1).
TEM images for PP nanocomposites with 5 wt% modified and non-
modified MWNT (2.5% by volume) are shown in Fig.2. According to Fig. 2, it
could be stated that modified nanotubes (K2 and K3) used during melding
process are present as individual particles in nanocomposite in most cases. The
number and size of agglomerates is reduced due to increased organophility and
improved thermodynamic compatibility with nonpolar polymer.
However, preliminary modification does not lead to uniform filler
distribution for nanocomposites containing thin nanotubes (K1). This could be
explained by the fact that interaction energy of CNT is more dependent on
nanotube diameter than on its length. Molecular dynamic computation given in
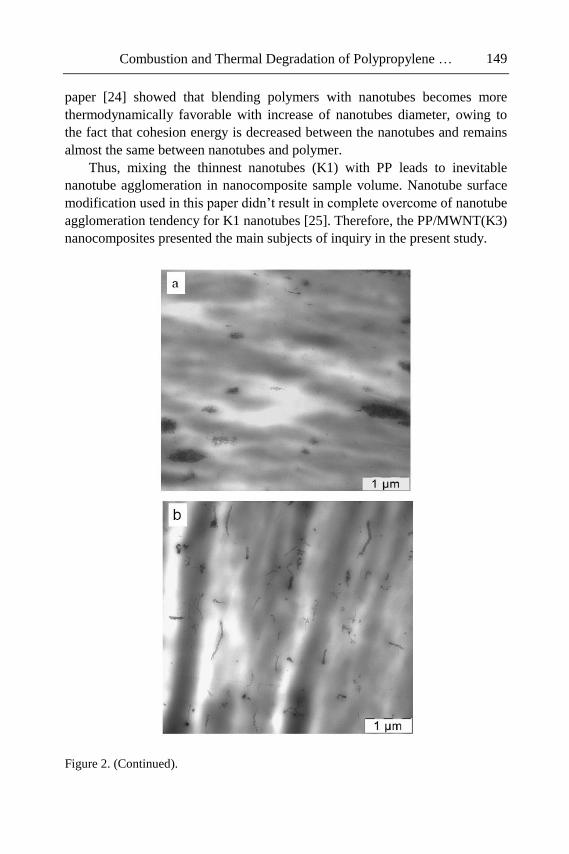
Combustion and Thermal Degradation of Polypropylene … 149
paper [24] showed that blending polymers with nanotubes becomes more
thermodynamically favorable with increase of nanotubes diameter, owing to
the fact that cohesion energy is decreased between the nanotubes and remains
almost the same between nanotubes and polymer.
Thus, mixing the thinnest nanotubes (K1) with PP leads to inevitable
nanotube agglomeration in nanocomposite sample volume. Nanotube surface
modification used in this paper didn’t result in complete overcome of nanotube
agglomeration tendency for K1 nanotubes [25]. Therefore, the PP/MWNT(K3)
nanocomposites presented the main subjects of inquiry in the present study.
Figure 2. (Continued).
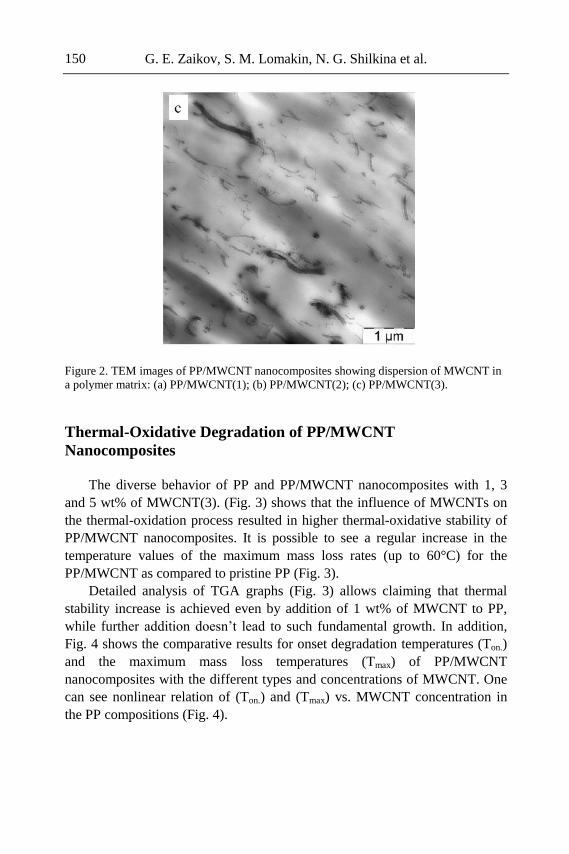
G. E. Zaikov, S. M. Lomakin, N. G. Shilkina et al. 150
Figure 2. TEM images of PP/MWCNT nanocomposites showing dispersion of MWCNT in
a polymer matrix: (a) PP/MWCNT(1); (b) PP/MWCNT(2); (c) PP/MWCNT(3).
Thermal-Oxidative Degradation of PP/MWCNT
Nanocomposites
The diverse behavior of PP and PP/MWCNT nanocomposites with 1, 3
and 5 wt% of MWCNT(3). (Fig. 3) shows that the influence of MWCNTs on
the thermal-oxidation process resulted in higher thermal-oxidative stability of
PP/MWCNT nanocomposites. It is possible to see a regular increase in the
temperature values of the maximum mass loss rates (up to 60°C) for the
PP/MWCNT as compared to pristine PP (Fig. 3).
Detailed analysis of TGA graphs (Fig. 3) allows claiming that thermal
stability increase is achieved even by addition of 1 wt% of MWCNT to PP,
while further addition doesn’t lead to such fundamental growth. In addition,
Fig. 4 shows the comparative results for onset degradation temperatures (Ton.)
and the maximum mass loss temperatures (Tmax) of PP/MWCNT
nanocomposites with the different types and concentrations of MWCNT. One
can see nonlinear relation of (Ton.) and (Tmax) vs. MWCNT concentration in
the PP compositions (Fig. 4).
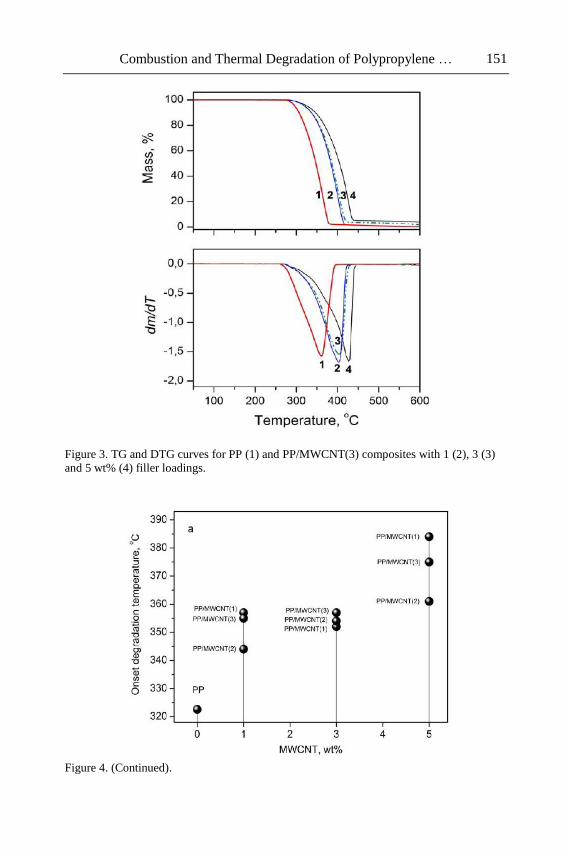
Combustion and Thermal Degradation of Polypropylene … 151
Figure 3. TG and DTG curves for PP (1) and PP/MWCNT(3) composites with 1 (2), 3 (3)
and 5 wt% (4) filler loadings.
Figure 4. (Continued).
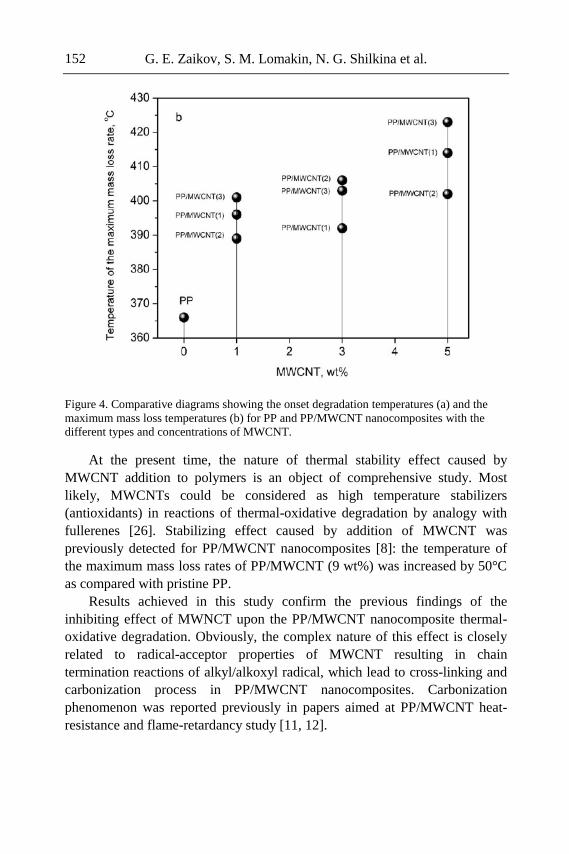
G. E. Zaikov, S. M. Lomakin, N. G. Shilkina et al. 152
Figure 4. Comparative diagrams showing the onset degradation temperatures (a) and the
maximum mass loss temperatures (b) for PP and PP/MWCNT nanocomposites with the
different types and concentrations of MWCNT.
At the present time, the nature of thermal stability effect caused by
MWCNT addition to polymers is an object of comprehensive study. Most
likely, MWCNTs could be considered as high temperature stabilizers
(antioxidants) in reactions of thermal-oxidative degradation by analogy with
fullerenes [26]. Stabilizing effect caused by addition of MWCNT was
previously detected for PP/MWCNT nanocomposites [8]: the temperature of
the maximum mass loss rates of PP/MWCNT (9 wt%) was increased by 50°C
as compared with pristine PP.
Results achieved in this study confirm the previous findings of the
inhibiting effect of MWNCT upon the PP/MWCNT nanocomposite thermal-
oxidative degradation. Obviously, the complex nature of this effect is closely
related to radical-acceptor properties of MWCNT resulting in chain
termination reactions of alkyl/alkoxyl radical, which lead to cross-linking and
carbonization process in PP/MWCNT nanocomposites. Carbonization
phenomenon was reported previously in papers aimed at PP/MWCNT heat-
resistance and flame-retardancy study [11, 12].
Combustion and Thermal Degradation of Polypropylene … 153
Kinetic Analysis of Thermal Degradation of PP/MWNT
Kinetic studies of material degradation have a long history, and there
exists a long list of data analysis techniques employed for the purpose. Often,
TGA is the method of choice for acquiring experimental data for subsequent
kinetic calculations, and this technique was employed here. It is commonly
accepted that the degradation of materials follows the base equation (1) [27]
dc/dt = - F(t, T, c, p ) (1)
where: t - time, T - temperature, co - initial concentration of the reactant, and p
- concentration of the final product. The right-hand part of the equation F(t, T,
c, p) can be represented by the two separable functions, k(T) and f(c, p):
F(t, T, c, p) = k [T(t)·f(c, p)] (2)
Arrhenius equation (4) will be assumed to be valid for the following:
k(T) = A·exp(-E/RT) (3)
Therefore,
dc/dt= - A·exp(-E/RT)·f(c,p) (4)
All feasible reactions can be subdivided onto classic homogeneous reactions
and typical solid-state reactions, which are listed in Table 2. The analytical
output must provide good fit to measurements with different temperature
profiles by means of a common kinetic model.
Thermogravimetric analysis of PP and PP nanocomposite degradation was
carried out in dynamic conditions at the rates of 2.5, 5 and 10 K/min on air.
Model-independent estimation of activation energy using Friedman
approach [28] was taken to get preliminary model analysis for thermal
degradation and selection of initial conditions. According to this evaluation, a
two-step process (A→X1→B→X2→C) was chosen for PP degradation. Taking
into account the carbonization stage, the more complex three-step process
(A→X1→B→X2→C→X3→D) was selected for PP/MWNT degradation [27,
29].
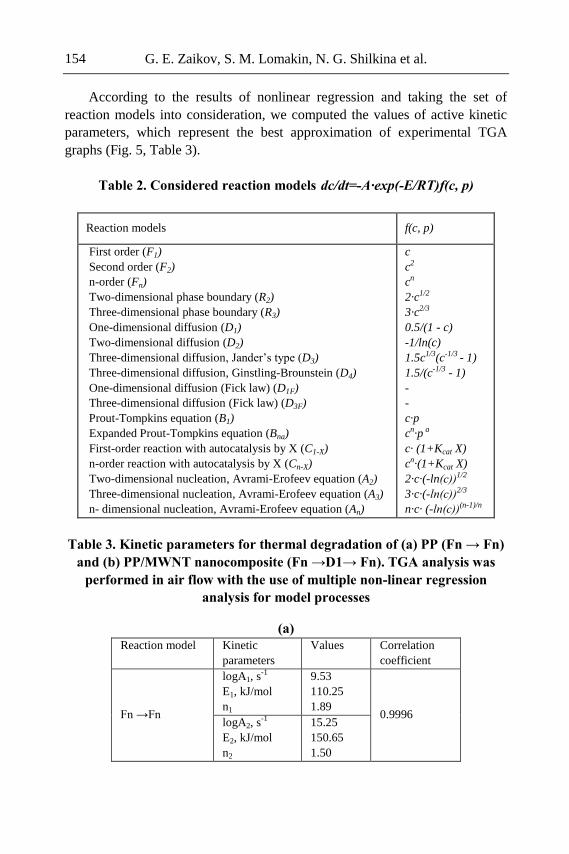
G. E. Zaikov, S. M. Lomakin, N. G. Shilkina et al. 154
According to the results of nonlinear regression and taking the set of
reaction models into consideration, we computed the values of active kinetic
parameters, which represent the best approximation of experimental TGA
graphs (Fig. 5, Table 3).
Table 2. Considered reaction models dc/dt=-A·exp(-E/RT)f(c, p)
Reaction models f(c, p)
First order (F1)
Second order (F2)
n-order (Fn)
Two-dimensional phase boundary (R2)
Three-dimensional phase boundary (R3)
One-dimensional diffusion (D1)
Two-dimensional diffusion (D2)
Three-dimensional diffusion, Jander’s type (D3)
Three-dimensional diffusion, Ginstling-Brounstein (D4)
One-dimensional diffusion (Fick law) (D1F)
Three-dimensional diffusion (Fick law) (D3F)
Prout-Tompkins equation (B1)
Expanded Prout-Tompkins equation (Bna)
First-order reaction with autocatalysis by X (C1-X)
n-order reaction with autocatalysis by X (Cn-X)
Two-dimensional nucleation, Avrami-Erofeev equation (A2)
Three-dimensional nucleation, Avrami-Erofeev equation (A3)
n- dimensional nucleation, Avrami-Erofeev equation (An)
c
c2
cn
2·c1/2
3·c2/3
0.5/(1 - c)
-1/ln(c)
1.5c1/3(c-1/3 - 1)
1.5/(c-1/3 - 1)
-
-
c·p
cn·p a
c· (1+Kcat X)
cn·(1+Kcat X)
2·c·(-ln(с))1/2
3·c·(-ln(с))2/3
n·c· (-ln(с))(n-1)/n
Table 3. Kinetic parameters for thermal degradation of (a) PP (Fn → Fn)
and (b) PP/MWNT nanocomposite (Fn →D1→ Fn). TGA analysis was
performed in air flow with the use of multiple non-linear regression
analysis for model processes
(a)
Reaction model Kinetic
parameters
Values Correlation
coefficient
Fn →Fn
logA1, s-1
E1, kJ/mol
n1
9.53
110.25
1.89 0.9996
logA2, s-1
E2, kJ/mol
n2
15.25
150.65
1.50
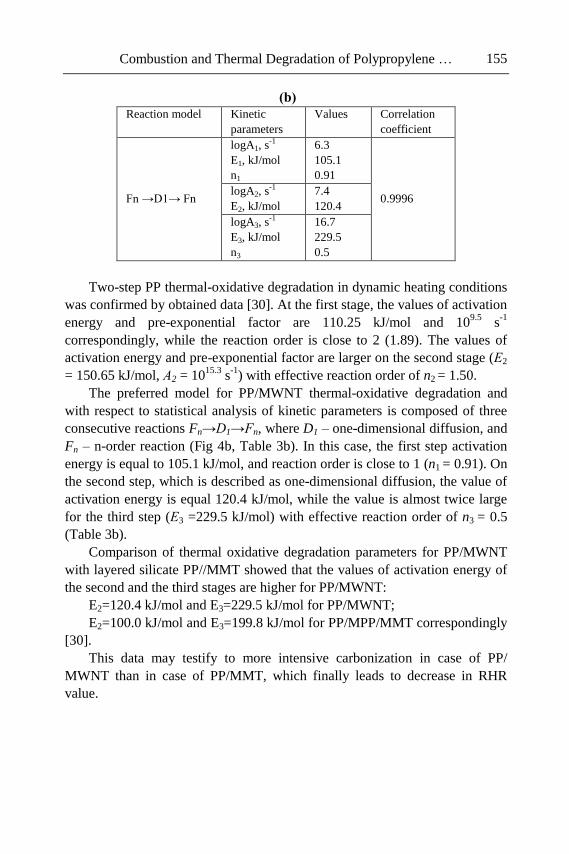
Combustion and Thermal Degradation of Polypropylene … 155
(b)
Reaction model Kinetic
parameters
Values Correlation
coefficient
Fn →D1→ Fn
logA1, s-1
E1, kJ/mol
n1
6.3
105.1
0.91
0.9996 logA2, s
-1
E2, kJ/mol
7.4
120.4
logA3, s-1
E3, kJ/mol
n3
16.7
229.5
0.5
Two-step PP thermal-oxidative degradation in dynamic heating conditions
was confirmed by obtained data [30]. At the first stage, the values of activation
energy and pre-exponential factor are 110.25 kJ/mol and 109.5
s-1
correspondingly, while the reaction order is close to 2 (1.89). The values of
activation energy and pre-exponential factor are larger on the second stage (Е2
= 150.65 kJ/mol, А2 = 1015.3
s-1
) with effective reaction order of n2 = 1.50.
The preferred model for PP/MWNT thermal-oxidative degradation and
with respect to statistical analysis of kinetic parameters is composed of three
consecutive reactions Fn→D1→Fn, where D1 – one-dimensional diffusion, and
Fn – n-order reaction (Fig 4b, Table 3b). In this case, the first step activation
energy is equal to 105.1 kJ/mol, and reaction order is close to 1 (n1 = 0.91). On
the second step, which is described as one-dimensional diffusion, the value of
activation energy is equal 120.4 kJ/mol, while the value is almost twice large
for the third step (Е3 =229.5 kJ/mol) with effective reaction order of n3 = 0.5
(Table 3b).
Comparison of thermal oxidative degradation parameters for PP/MWNT
with layered silicate PP//MMT showed that the values of activation energy of
the second and the third stages are higher for PP/MWNT:
E2=120.4 kJ/mol and E3=229.5 kJ/mol for PP/MWNT;
E2=100.0 kJ/mol and E3=199.8 kJ/mol for PP/MPP/MMT correspondingly
[30].
This data may testify to more intensive carbonization in case of PP/
MWNT than in case of PP/MMT, which finally leads to decrease in RHR
value.
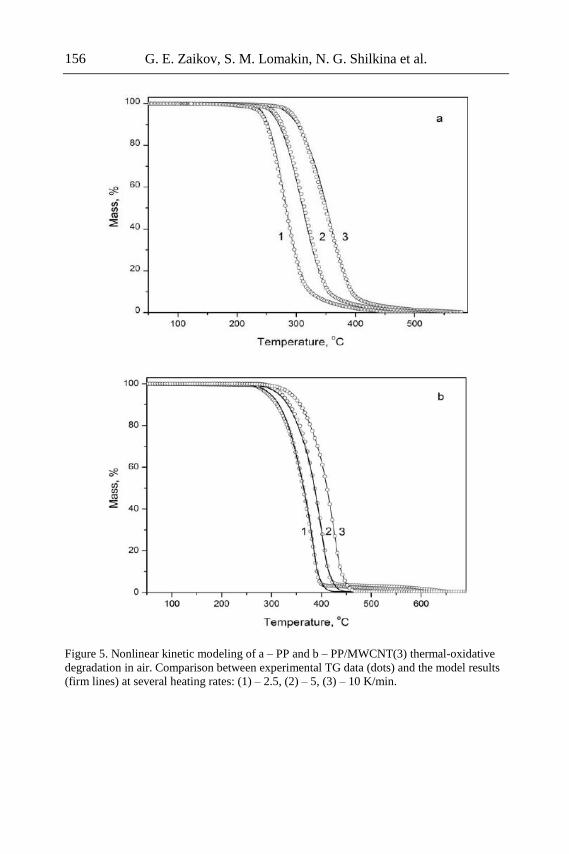
G. E. Zaikov, S. M. Lomakin, N. G. Shilkina et al. 156
Figure 5. Nonlinear kinetic modeling of a – PP and b – PP/MWCNT(3) thermal-oxidative
degradation in air. Comparison between experimental TG data (dots) and the model results
(firm lines) at several heating rates: (1) – 2.5, (2) – 5, (3) – 10 K/min.
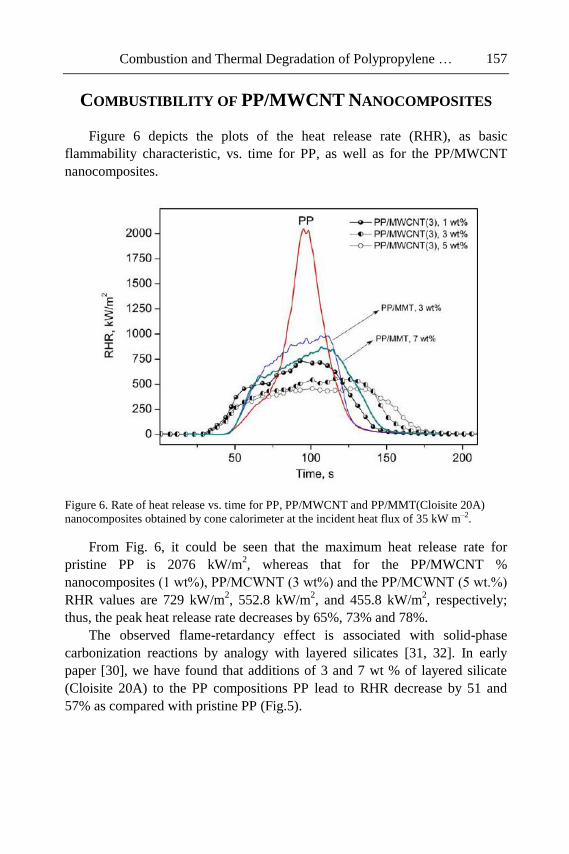
Combustion and Thermal Degradation of Polypropylene … 157
COMBUSTIBILITY OF PP/MWCNT NANOCOMPOSITES
Figure 6 depicts the plots of the heat release rate (RHR), as basic
flammability characteristic, vs. time for PP, as well as for the PP/MWCNT
nanocomposites.
Figure 6. Rate of heat release vs. time for PP, PP/MWCNT and PP/MMT(Cloisite 20A)
nanocomposites obtained by cone calorimeter at the incident heat flux of 35 kW m–2.
From Fig. 6, it could be seen that the maximum heat release rate for
pristine PP is 2076 kW/m2, whereas that for the PP/MWCNT %
nanocomposites (1 wt%), PP/MСWNT (3 wt%) and the PP/MСWNT (5 wt.%)
RHR values are 729 kW/m2, 552.8 kW/m
2, and 455.8 kW/m
2, respectively;
thus, the peak heat release rate decreases by 65%, 73% and 78%.
The observed flame-retardancy effect is associated with solid-phase
carbonization reactions by analogy with layered silicates [31, 32]. In early
paper [30], we have found that additions of 3 and 7 wt % of layered silicate
(Cloisite 20A) to the PP compositions PP lead to RHR decrease by 51 and
57% as compared with pristine PP (Fig.5).
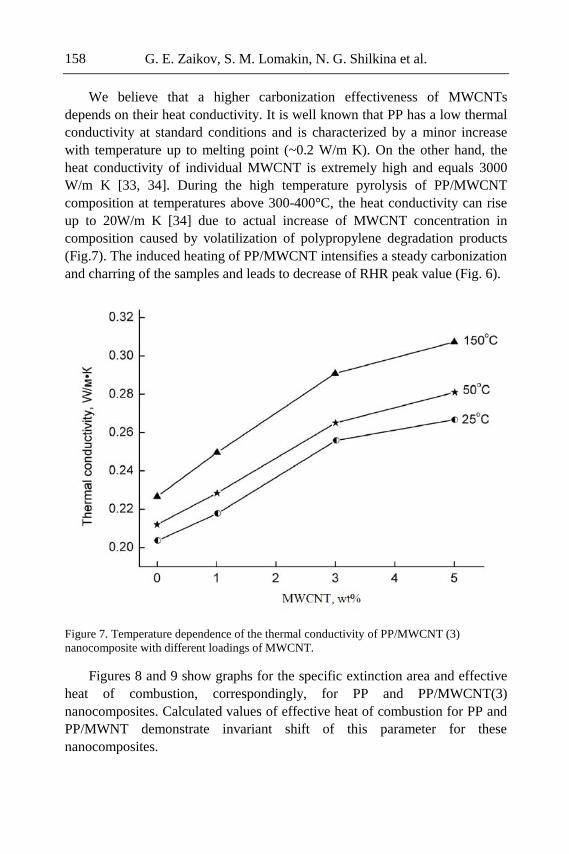
G. E. Zaikov, S. M. Lomakin, N. G. Shilkina et al. 158
We believe that a higher carbonization effectiveness of MWCNTs
depends on their heat conductivity. It is well known that PP has a low thermal
conductivity at standard conditions and is characterized by a minor increase
with temperature up to melting point (~0.2 W/m K). On the other hand, the
heat conductivity of individual MWCNT is extremely high and equals 3000
W/m K [33, 34]. During the high temperature pyrolysis of PP/MWCNT
composition at temperatures above 300-400°C, the heat conductivity can rise
up to 20W/m K [34] due to actual increase of MWCNT concentration in
composition caused by volatilization of polypropylene degradation products
(Fig.7). The induced heating of PP/MWCNT intensifies a steady carbonization
and charring of the samples and leads to decrease of RHR peak value (Fig. 6).
Figure 7. Temperature dependence of the thermal conductivity of PP/MWCNT (3)
nanocomposite with different loadings of MWCNT.
Figures 8 and 9 show graphs for the specific extinction area and effective
heat of combustion, correspondingly, for PP and PP/MWCNT(3)
nanocomposites. Calculated values of effective heat of combustion for PP and
PP/MWNT demonstrate invariant shift of this parameter for these
nanocomposites.
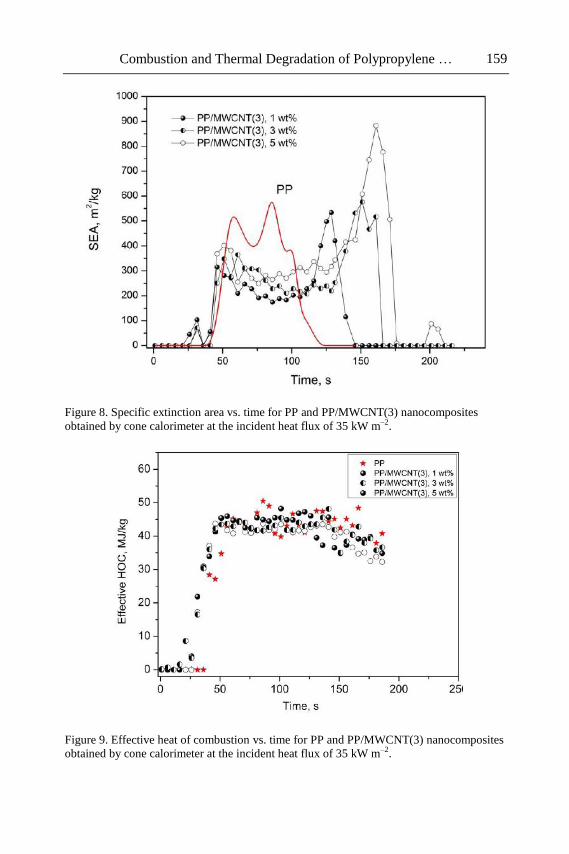
Combustion and Thermal Degradation of Polypropylene … 159
Figure 8. Specific extinction area vs. time for PP and PP/MWCNT(3) nanocomposites
obtained by cone calorimeter at the incident heat flux of 35 kW m–2.
Figure 9. Effective heat of combustion vs. time for PP and PP/MWCNT(3) nanocomposites
obtained by cone calorimeter at the incident heat flux of 35 kW m–2.
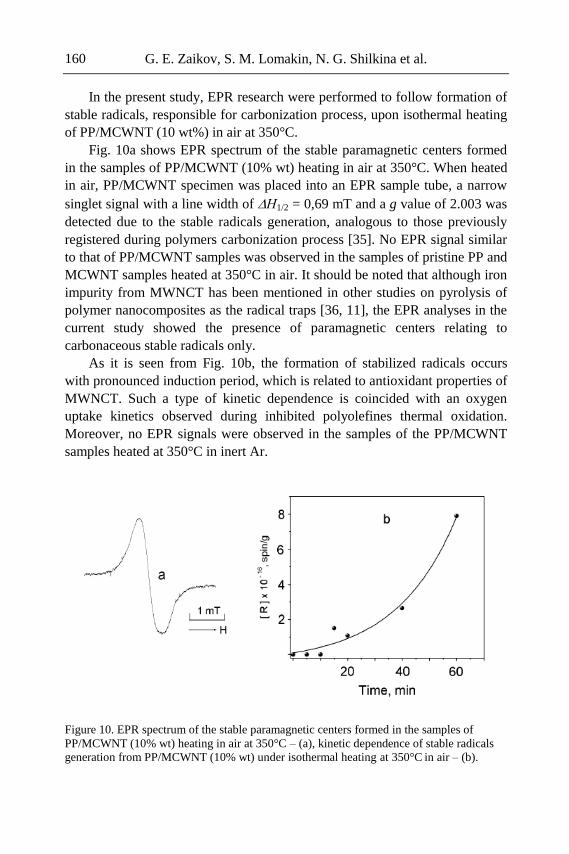
G. E. Zaikov, S. M. Lomakin, N. G. Shilkina et al. 160
In the present study, EPR research were performed to follow formation of
stable radicals, responsible for carbonization process, upon isothermal heating
of PP/MCWNT (10 wt%) in air at 350°C.
Fig. 10a shows EPR spectrum of the stable paramagnetic centers formed
in the samples of PP/MCWNT (10% wt) heating in air at 350°C. When heated
in air, PP/MCWNT specimen was placed into an EPR sample tube, a narrow
singlet signal with a line width of Н1/2 = 0,69 mT and a g value of 2.003 was
detected due to the stable radicals generation, analogous to those previously
registered during polymers carbonization process [35]. No EPR signal similar
to that of PP/MCWNT samples was observed in the samples of pristine PP and
MCWNT samples heated at 350°C in air. It should be noted that although iron
impurity from MWNCT has been mentioned in other studies on pyrolysis of
polymer nanocomposites as the radical traps [36, 11], the EPR analyses in the
current study showed the presence of paramagnetic centers relating to
carbonaceous stable radicals only.
As it is seen from Fig. 10b, the formation of stabilized radicals occurs
with pronounced induction period, which is related to antioxidant properties of
MWNCT. Such a type of kinetic dependence is coincided with an oxygen
uptake kinetics observed during inhibited polyolefines thermal oxidation.
Moreover, no EPR signals were observed in the samples of the PP/MCWNT
samples heated at 350°C in inert Ar.
Figure 10. EPR spectrum of the stable paramagnetic centers formed in the samples of
PP/MCWNT (10% wt) heating in air at 350°C – (a), kinetic dependence of stable radicals
generation from PP/MCWNT (10% wt) under isothermal heating at 350°C in air – (b).
Combustion and Thermal Degradation of Polypropylene … 161
Thus, multi-walled carbon nanotubes are considered to be more effective
filling agents than layered silicates in the terms of improvement of thermal
properties and flame retardancy of PP matrix. This could be explained by the
specific antioxidant properties and high thermal conductivity of MWCNT,
which determine the carbonization reactions during thermal-oxidative
degradation process.
REFERENCES
[1] Shaffer MSP, Windle AH. Adv. Mater. 1999, 11, 937.
[2] Qian D, Dickey EC, Andrews R, Rantell T. Appl. Phys. Lett. 2000, 76,
2868.
[3] Jin Z, Pramoda KP, Xu G, Goh SH. Chem. Phys. Lett. 2001, 337, 43.
[4] Thostenson ET, Chou TW. J. Phys. D: Appl. Phys. 2002, 35, L77.
[5] Bin Y, Kitanaka M, Zhu D, Matsuo M. Macromolecules 2003, 36, 6213.
[6] Potschke P, Dudkin SM, Alig I. Polymer. 2003, 44, 5023.
[7] Safadi B, Andrews R, Grulke EA. J. Appl. Polym. Sci. 2002, 84, 2660.
[8] P.C.P. Watts, P.K. Fearon, W.K. Hsu, N.C. Billingham, H.W. Kroto and
D.R.M. Walton, J. Mater. Chem. 2003, 13, 491.
[9] Watts PCP, Hsu WK, Randall DP, Kroto HW and Walton DRM., Phys.
Chem. Chem. Phys., 2002, 4, 5655.
[10] Jun Yang, Yuhan Lin, Jinfeng Wang. J. Appl. Polym. Sci. 2005,
98,3,1087.
[11] Kashiwagi T, Grulke E, Hilding J, Groth K,; Harris RH, Butler K.,
Shields JR,; Kharchenko S, Douglas J, Polymer. 2004, 45, 4227–4239.
[12] Kashiwagi T, Grulke E, Hilding J, Harris Jr RH, Awad WH, Dougls J.
Macromol. Rapid Commun. 2002, 23, 761, 5.
[13] Lomakin SM, Novokshonova LA, Brevnov PN, Shchegolikhin AN,
Journal of Materials Science. 2008, 43, 4, 1340.
[14] Chen J, Hamon M A, Hu H, Chen Y, Rao A M, Eklund P C and Haddon
R C Science. 1998, 282, 95.
[15] Stevens J L, Huang A Y, Peng H, Chiang I W, Khabashesku V N and
Margrave J L Nano Lett., 2003, 3, 331.
[16] Eitan A, Jiang K, Dukes D, Andrews R and Schadler L S Chem. Mater.,
2003, 15 3198.
[17] Hu H, Ni Y, Montana V, Haddon R C and Parpura V Nano Lett., 2004,
4, 507.
[18] Kong H, Gao C and Yan D J. Am. Chem. Soc., 2004,126, 412.
G. E. Zaikov, S. M. Lomakin, N. G. Shilkina et al. 162
[19] Holzinger M, Vostrowsky O, Hirsch A, Hennrich F, Kappes M, Weiss R
and Jellen F Angew. Chem. Int. Edn 2001,40, 4002.
[20] Holzinger M, Abraham J, Whelan P, Graupner R, Ley L, Hennrich F,
Kappes M and Hirsch A J. Am. Chem. Soc., 2003, 125, 8566.
[21] Yao Z, Braidy N, Botton G A and Adronov A 2003 J. Am.Chem. Soc.
125, 16015.
[22] Ying Y, Saini R K, Liang F, Sadana A K and Billups W E Org. Lett.
2003, 5, 1471.
[23] Alvaro M, Atienzar P, de la Cruz P, Delgado J L, Garcia H and Langa F
2004 J. Phys. Chem. B 108 12691.
[24] M R. Nyden, S I. Stoliarov, Polymer. 2008,49, 635-641.
[25] Rakhimkulov AD, Lomakin SM, Alexeyeva OV, Dubnikova IL,
Schegolikhin AN, Zaikov GE in Proceedings of IBCP International
Conference (2006) 56.
[26] Krusic J, Wasserman E, Keizer PN, Morton JR, Preston KF. Science.
1991, 254, 1183.
[27] Opfermann J. J. Thermal Anal Cal. 2000, 60, 3, 641.
[28] Friedman H.L., J. Polym. Sci., 1965, C6, 175.
[29] Opfermann J., Kaisersberger E. Thermochim. Acta. 1992, 11, 1, 167.
[30] Lomakin SM, Dubnikova IL, Berezina SM, Zaikov GE, Polymer
Science. 2006, 48, Ser. A, 1, 72.
[31] Gilman GW, Jackson CL, Morgan AB, Harris RH, Manias E, Giannelis
EP, Wuthenow M, Hilton D, Phillips S, Chem. Mater. 2000, 12, 1866.
[32] Kashiwagi T, Harris RH Jr., Zhang X, Briber RM, Cipriano BH,
Raghavan SR, Awad WH, Shields J R. Polymer. 2004, 45, 881.
[33] Kim P, Shi L, Majumdar A, McEuen PL. Phys. Rev. Lett. 2001, 87,
215502.
[34] Yi, W.; Lu, L; Zhang, D.L.; Pan, Z.W.; Xie, S.S. Phys. Rev. B 1999, 59,
R9015–8.
[35] Echevskii GV, Kalinina NG, Anufrienko VF, Poluboyarov VA. React.
Kinet. Catal. Lett. 1987, 33, 8, 305.
[36] Zhu. J, Uhl F, Morgan AB, Wilkie CA, Chem. Mater. 2001, 13,4649–54.
INDEX
A
acetic acid, 37, 38, 39, 91, 93, 96, 97, 98,
104, 106, 138, 140, 141
acetylcholinesterase, 36, 52
acid, 36, 37, 38, 39, 49, 52, 91, 93, 98, 104,
107, 138, 140
activated carbon, 109
activation energy, 153, 155
actuation, 32
adhesives, 110
adsorption, 24, 26, 35
aggregation, 26, 28, 56, 57, 64, 67, 68, 69,
70, 84, 97
algorithm, 123, 124, 125
amine, 23, 26, 45, 98
amino, 23, 91, 92, 98, 136
ammonia, 36
anisotropy, 127
antibiotic, 39
antioxidant, 160, 161
Arrhenius equation, 153
atoms, vii, viii, 2, 3, 5, 7, 8, 10, 11, 13, 16,
26
autocatalysis, 154
B
bacteria, 35
biocompatibility, 21, 22, 23, 24, 25, 32, 42,
49
biodegradability, 21, 23, 24, 25
biodegradable materials, 21
biofuel, 35
biological systems, 45
biomedical applications, 25, 32, 40, 41, 42,
47, 49, 103, 104, 135
biopolymers, 21, 22, 25, 26, 27, 31, 32, 33,
42, 91, 95, 97
biosensors, 24, 27, 32, 34, 36, 39, 41, 50, 52
Boltzmann constant, 70, 80
bonds, 26, 57, 77, 78, 98
bone, viii, 18, 37, 39
BSR, 69, 72, 73, 74, 76, 77, 79, 82, 83, 128,
131, 132, 133
butadiene-styrene, 57, 59, 60, 74, 76, 83,
127
C
cadmium, xiii, 36, 42
calcium carbonate, viii, 18
cancer, x, xi
carbon, ix, x, xii, 1, 2, 3, 4, 5, 6, 7, 8, 9, 10,
12, 14, 16, 17, 19, 22, 25, 28, 30, 31, 32,
34, 35, 36, 38, 39, 40, 43, 44, 45, 46, 47,
48, 49, 50, 51, 52, 53, 57, 66, 92, 94, 98,
104, 106, 107, 109, 127, 128, 136, 138,
140, 143, 144, 145, 161
carbon nanotubes, ix, x, xii, 3, 4, 5, 6, 9, 10,
12, 19, 22, 25, 28, 32, 34, 36, 39, 40, 43,
44, 45, 46, 47, 48, 49, 50, 51, 52, 53, 92,
127, 143, 144, 145, 161
Index 164
carbonization, 144, 152, 153, 155, 157, 160,
161
carboxyl, 26, 92, 136
catalyst, 25, 128
cationic surfactants, 27, 36
cell culture, 105, 140
cellulose, 31, 49
ceramic, vii, ix, 18, 19
chemical(s), viii, ix, 22, 25, 26, 48, 57, 93,
98, 109, 128, 147
chemico-physical properties, ix, x
chirality, 10, 12, 13, 15, 16, 26
chitin, 22, 23, 42, 91, 105, 136, 141
chitosan, 21, 22, 23, 24, 25, 27, 31, 33, 34,
35, 36, 37, 38, 39, 40, 41, 42, 43, 47, 49,
50, 51, 52, 53, 54, 91, 92, 93, 98, 99,
102, 104, 106, 107, 136, 137, 138, 140,
141
Chitosan, v, 21, 22, 23, 24, 25, 33, 42, 43,
48, 51, 52, 53, 91, 93, 94, 99, 103, 105,
106, 107, 135, 136, 139, 141
chromatography, 43
clothing, 109, 110, 125
clusters, 64
coatings, xii
cobalt, 43
collagen, 31, 48, 91, 105, 136, 140
color, iv
combined effect, 41
combustibility, 144
combustion, xiii, 144, 158, 159
compatibility, 105, 148
composites, vii, ix, x, 9, 18, 19, 22, 28, 29,
30, 32, 34, 35, 38, 45, 46, 47, 48, 49, 50,
53, 56, 76, 84, 106, 107, 144, 148, 151
concentration of silver, xii
conductivity, 5, 24, 29, 30, 32, 33, 47, 50,
92, 94, 99, 102, 104, 135, 144, 158, 161
constituent materials, viii, 18
COOH, 36, 37
copper, 36
cotton, 112
covalent bond, 25, 26
crystalline, x, 1, 9, 18, 29
CVD, 25, 44, 128
cytocompatibility, 38
D
deacetylation, 42, 93, 136
defects, 19, 26, 36, 102, 139
degradation, xi, 144, 145, 150, 152, 153,
155, 156, 158, 161
density fluctuations, 81
detection, 34, 35, 36, 37, 51, 52
diffusion, 19, 67, 68, 69, 70, 154, 155
dispersion, x, 19, 28, 34, 37, 39, 40, 46, 49,
54, 93, 95, 97, 98, 101, 104, 107, 136,
140, 147, 150
distribution, 20, 28, 57, 71, 94, 95, 96, 99,
118, 122, 123, 125, 128, 138, 140, 145,
147, 148
DNA, x, 26, 34, 46, 51
dopamine, 52
double logarithmic coordinates, 71, 72, 73
drug delivery, viii, 27, 32, 35, 41, 42, 53,
89, 135
drug release, xi
DWNT, 30
E
elasticity modulus, 56, 58, 59, 60, 76, 77,
81, 128, 131
electrical conductivity, 26, 28, 32, 48, 94,
95, 99, 102
electrical properties, 31, 32, 45, 46, 48, 92
electrochemistry, ix, 50, 51
electrodes, 5, 34, 36, 37, 94
electrolyte, 43, 50
electromagnetic waves, 9
electron(s), 1, 26, 32, 34, 35, 40, 44, 50, 58,
74, 94, 100, 120, 128, 129, 137, 147, 148
electron microscopy, 120, 147
electron paramagnetic resonance, 148
electrospinning, 22, 39, 41, 89, 91, 92, 94,
98, 99, 102, 104, 105, 106, 107, 111,
135, 136, 138, 139, 140
elongation, 90, 116, 119
energy, viii, 9, 97, 148, 155
engineering, viii, xii, xiii, 32, 42, 50, 89
enlargement, 74
environment, viii, 21, 32, 109
Index 165
enzyme(s), 24, 34, 36, 42, 50, 52, 135
enzyme immobilization, 42, 135
epoxy groups, 145
ethanol, 39
ethylene, 45, 106
Euclidean space, 60, 71, 72, 132
evaporation, 31, 34, 90, 145
exploitation, vii, 18
extinction, 158, 159
F
fabrication, xiii, 36, 105, 106, 135
fiber, 1, 28, 32, 39, 40, 44, 46, 89, 90, 94,
98, 99, 101, 102, 104, 105, 109, 110,
112, 118, 120, 121, 122, 123, 124, 125,
135, 137, 138, 139, 140
fibrinogen, 105, 140
fibroblasts, 105, 141
field of nanotechnology, vii
filler particles, ix, 19, 20, 56, 57, 71, 72
fillers, ix, 19, 25, 28
flame, 152, 157, 161
flammability, 157
flexibility, 32, 60, 89, 92
fluorescence, xi
food, 24, 41, 43, 50
force, 58, 59, 64, 65, 90, 116, 125, 128, 135
formation, 56, 64, 75, 91, 92, 99, 104, 127,
128, 134, 144, 160
formula, 15, 56, 61, 62, 63, 78, 80, 82, 128,
131, 133
fractal analysis, 64, 84
fractal dimension, 56, 60, 61, 64, 65, 71, 72,
76, 80
fractal growth, 69
fractal objects, 73
fractal properties, 71
fracture toughness, 18
fullerene, 1, 7, 8, 25, 46
functionalization, 26, 27, 28, 30, 46, 48
fungi, 24
G
gas sensors, 32
geometry, 32, 64, 127, 132, 133, 134
glass transition temperature, 60
glucose, 23, 34, 36, 37, 50, 91, 136
glycerol, 41
grain size, 56
graphene sheet, 3, 10, 25
graphite, 1, 2, 3, 4, 5, 7, 8, 9, 10, 11, 14, 25,
72, 76, 92
growth, 43, 64, 66, 67, 70, 80, 83, 144, 150
H
hazardous substances, 109
heat conductivity, 148, 157
heat release, 144, 157
heating rate, 147, 156
heavy metals, 36, 52
hemoglobin, 35, 51
high-stiffness polymer composites, ix, 19
histogram, 58, 68, 76, 124, 125
homogeneity, 81, 104
humidity, 90, 94, 135
hybrid, viii
hybridization, 25
hydrogen, 9, 35, 51, 91, 92, 98, 136
hydrogen peroxide, 35, 51
hydrophilicity, 24
hydroxyapatite, viii, 18
hydroxyl, 92, 136
I
ideal, ix, 19, 29
identification, 48, 124
image(s), xiii, 10, 40, 58, 59, 64, 78, 90, 99,
115, 118, 120, 121, 122, 123, 124, 125,
136, 140, 147, 148, 150
immune system, xi
in vitro, 26
in vivo, 21
indentation, 58, 60
induction period, 160
industrial sectors, xiii
interface, 29, 30
interfacial adhesion, 45, 132, 133, 134
interfacial layer, 56, 59, 60, 61, 62, 63, 84,
132, 133
internal fixation, 39
interphase, 20
ions, 36
Index 166
IR transmission, 145
Iran, xiii, 1, 21, 89, 109, 111, 135
iron, 160
irradiation, 38
irreversible aggregation, 64, 66, 70
isothermal heating, 160
K
KBr, 145
keratinocytes, 105, 140, 141
kinetic model, 153, 156
kinetic parameters, 154, 155
kinetics, xi, 42, 105, 160
L
lactate dehydrogenase, 34, 50
lactic acid, 37, 91
lamination, 110, 113, 115, 125
laser ablation, 25
LED, 24
light, 95, 116
liquids, 49, 70
lithium, 9
logarithmic coordinates, 79, 80
Luo, 37, 52, 53
M
macromolecules, 36
macroscopic components, vii, 18
magnetic resonance imaging, xi
magnetoresistance, xii
magnitude, 71, 79, 80, 132
malignant tumors, xi
mass, x, 15, 16, 17, 57, 58, 63, 89, 92, 128,
130, 131, 144, 150, 152
material(s), vii, viii, x, xi, xii, xiii, 9, 18, 21,
22, 25, 28, 32, 38, 41, 42, 48, 50, 55, 56,
57, 72, 78, 84, 92, 109, 136, 153
matrix, viii, x, 18, 19, 21, 25, 27, 28, 29, 32,
34, 35, 37, 38, 48, 50, 51, 52, 56, 57, 59,
60, 62, 63, 70, 81, 91, 95, 107, 145, 161
mechanical properties, viii, 18, 21, 22, 26,
28, 29, 30, 35, 37, 39, 45, 46, 47, 48, 56,
110, 125, 133, 134, 135
medical, x, 22, 89, 91
medicine, viii, x, 46
melt(ing), 47, 89, 110, 112, 115, 116, 125,
143, 144, 158
membranes, 35, 36, 51
metal ion, 24
metals, xii, xiii, 5, 56
mice, 42
microorganism, 24
microparticles, 56, 76, 109
microphotographs, 74, 128
microscope, 1, 94, 112, 115, 125, 128, 129,
147
microscopic length scales, viii, 18
microspheres, 38, 42
modulus, 5, 18, 25, 28, 29, 31, 33, 37, 59,
77, 80
molecular manufacturing, vii
molecular weight, 35, 38, 53, 90, 91, 93,
110, 111, 136
morphology, 22, 32, 35, 39, 92, 102, 107,
110, 112, 125
multi-walled carbon nanotubes, 28, 44, 52,
53
muscles, 32, 50
N
NaCl, 39
NADH, 37, 52
nanochemistry, ix, x, xi
nanocomposites, viii, xiii, 18, 19, 21, 22,
25, 28, 29, 34, 36, 37, 41, 46, 47, 48, 55,
56, 58, 62, 63, 64, 65, 66, 67, 68, 69, 71,
72, 73, 74, 75, 76, 77, 79, 81, 82, 83, 84,
127, 128, 131, 132, 133, 134, 143, 144,
148, 149, 150, 152, 157, 158, 159
nanocomposites, vii, ix, 18, 28, 56, 82, 144,
150, 158
nanofibers, x, 25, 40, 42, 89, 90, 91, 92, 94,
98, 99, 100, 102, 104, 105, 106, 107,
111, 116, 124, 125, 135, 140, 141
nanoindentation, 58, 59, 76, 77, 78, 79, 80,
81, 128
nanomaterials, viii, ix, x, xii, xiii, 82
nanometer scale, 89, 111
nanometer(s), 1, 3, 25, 89, 111, 135
Index 167
nanoparticles, viii, xi, xii, 20, 25, 27, 38, 42,
56, 59, 64, 66, 67, 68, 69, 70, 71, 76, 80,
83, 84
nanoscale materials, viii
nanostructures, ix, x, xiii, 3, 19, 44, 46, 106
nanotechnology, vii, viii, x, xi, xii, xiii, 4
nanotube, x, xii, 4, 5, 6, 7, 8, 9, 10, 11, 13,
15, 16, 22, 25, 27, 28, 29, 30, 32, 34, 35,
36, 38, 40, 44, 45, 46, 47, 48, 49, 50, 51,
52, 53, 92, 95, 98, 104, 106, 107, 131,
136, 138, 140, 144, 145, 147, 148, 149
nanowires, viii
natural polymers, 31
NH2, 24
nickel, 36
nontoxicity, 24
normal distribution, 118
nucleation, 154
nucleic acid, 21
O
oil, xii
optical properties, xii, 39
oxidation, 26, 37, 52, 150
oxygen, 147, 160
ozone-oxygen mixture, 145
P
particle-cluster, 64, 70
percolation, 82, 128
permeability, 110, 112, 113, 115, 116, 125
pH, xi, 36, 37, 38
pharmaceuticals, xi
photovoltaic devices, 32
physical and mechanical properties, viii, 18
physical properties, ix, x, 19, 22, 25, 27, 92
Poisson ratio, 78
pollutants, 32, 35
poly(methyl methacrylate), 45
polyamides, 143
polybutadiene, 61
polycarbonate, 46
polycarbonates, 143
polydispersity, 57, 128
polymer, vii, ix, xi, 18, 19, 22, 26, 27, 28,
29, 30, 31, 36, 41, 43, 45, 46, 47, 48, 55,
56, 57, 59, 60, 62, 63, 70, 71, 75, 77, 79,
80, 81, 89, 90, 91, 93, 95, 97, 105, 110,
111, 127, 131, 132, 133, 134, 135, 136,
143, 144, 145, 147, 148, 149, 150, 160
polymer chain, 23, 60, 97
polymer composites, ix, 19, 29, 45, 47, 48,
56, 60, 79
polymer materials, 55, 57, 77
polymer matrix, 28, 30, 48, 56, 57, 59, 60,
62, 70, 71, 79, 80, 81, 95, 127, 132, 134,
144, 145, 147, 150
polymer nanocomposites, 19, 28, 55, 56, 57,
62, 63, 127, 134, 143, 160
polymeric chains, 91
polymerization, 26
polymers, xii, 9, 21, 25, 26, 27, 31, 47, 60,
61, 91, 92, 111, 148, 152, 160
polypropylene, 47, 112, 144, 158
polysaccharide(s), 21, 22, 23, 27, 42, 98
polystyrene, 61
polyurethane, 105, 110
polyvinyl alcohol, 29, 91, 106
potassium, 37
precipitation, 38, 39
preservative, 24
probe, 94, 95, 99
processing variables, 107
propane, 49
proportionality, 63, 67, 132
protection, 110, 125
proteins, x, 21, 22, 24, 27, 47
pruning, 122, 124
purification, 38, 93
purity, x, 29, 93, 136
PVA, 91, 92, 94, 140
pyrolysis, 144, 158, 160
Q
quantification, 34
quantitative estimation, 62
quantum bit memory space, xiii
quantum computer, xii
quantum confinement, 19
R
radicals, 160
Index 168
radius, 58, 60, 64, 66, 67, 127, 128, 129,
133, 134
reaction order, 155
reactions, 37, 152, 153, 155, 157, 161
recognition, 98
reduced combustibility, 143
regenerative medicine, 105, 141
regression, 153, 154
regression analysis, 154
reinforcement, viii, ix, x, 18, 19, 21, 25, 27,
28, 40, 56, 57, 62, 82, 83, 84, 131, 133
relaxation process, 77
renewable energy, 32
resistance, 24, 152
response, 34, 36, 105, 106, 141
RH, 113, 161, 162
rheology, 70
rods, 5, 39
room temperature, 49, 94, 110, 112, 136
rubber(s), 56, 57, 59, 60, 74, 76, 79, 80, 83,
109, 127
S
science, vii, viii, ix, xiii, 25, 27, 41
sedimentation, 97
self-similarity, 71, 74, 75, 76
semiconductor(s), xii, 5, 11, 13
semi-permeable membrane, 109
sensitivity, 34, 35, 36, 37
sensors, viii, 32
shape, ix, x, 9, 19, 89, 124
signal transduction, 34
silica, xi, xiii
silicon, 44
silk, 31, 49, 90, 91, 105, 136, 141
silver, xii, 94
simulation, 56, 64, 67, 68, 81, 118
single walled carbon nanotubes, 25, 45, 50,
107
smart materials, 32, 49
sol-gel, 25
solid tumors, xi
solidification, 90
solution, xii, 26, 33, 34, 35, 36, 37, 38, 39,
52, 55, 57, 62, 89, 90, 91, 92, 93, 94, 96,
97, 99, 105, 106, 109, 111, 135, 138, 141
solvents, 29, 39, 93, 98, 138
specific surface, 19, 25, 61, 92
spectroscopy, 148
spiral nanotube, 6
stability, 28, 33, 34, 35, 36, 37, 52, 91, 97,
98, 104, 144, 150
stable radicals, 160
steel, 5, 111, 136
stress, 19, 28, 30, 56, 109, 110
structure, vii, 1, 2, 4, 8, 10, 11, 18, 22, 25,
26, 39, 45, 55, 56, 64, 71, 72, 76, 81, 92,
105, 110, 115, 116, 125, 127, 128, 129,
136, 140, 144, 145
structure formation, 56
styrene, 36, 49, 52, 61, 74, 107
substrate, 25, 92, 111, 112
substrates, 35, 39, 44
superconductivity, 9
surface area, x, xi, 20, 25, 44, 89, 135, 145,
148
surface chemistry, x
surface modification, 26, 149
surface structure, ix
surface tension, 89, 90, 91
surfactants, 26, 27, 46
SWNTs, 25, 27, 32, 38, 47, 92
synthesis, ix, x, xi, 25, 26, 32, 38, 53, 144
synthetic methods, 144
synthetic polymers, 21, 92
T
technical carbon, 57, 65, 66, 67, 70, 74, 76,
79, 83, 84
TEM, 147, 148, 150
temperature, 70, 80, 90, 110, 111, 115, 116,
125, 135, 144, 147, 150, 152, 153, 158
tensile strength, 18, 25, 29, 113, 116
textiles, 107
TGA, 147, 150, 153, 154
therapeutics, xi
thermal degradation, 144, 153, 154
thermal oxidation, 160
thermal oxidative degradation, 155
thermal properties, 25, 27, 37, 39, 144, 161
thermal stability, 33, 143, 150, 152
thermodynamics, ix
Index 169
thermoplastics, 143
three-dimensional space, 71, 73
tissue, 24, 27, 32, 37, 38, 41, 42, 47, 48, 89,
104, 105, 135, 140
toxicity, 24
transmission, 33, 58, 94, 129, 147
transmission electron microscopy, 147
treatment, xiii, 30, 32, 64, 69, 84, 91, 92,
145
U
uniform, 28, 92, 99, 102, 104, 110, 118, 148
UV, 46
V
vapor, 44, 110, 138
variables, 118, 135
vector, 10, 13
velocity, 135
vibration, 98, 145
viscosity, 19, 33, 70, 90, 91, 92
volatility, 135
volatilization, 158
W
water, xii, 24, 27, 29, 33, 35, 37, 38, 52, 91,
93, 97, 109
web, 110, 112, 113, 115, 116, 117, 118,
120, 125, 140
Witten-Sander clusters, 64
wound healing, 24, 42, 140
Z
zinc, 36