GraphenePolyaniline Nanofiber Composites as Supercapacitor
10
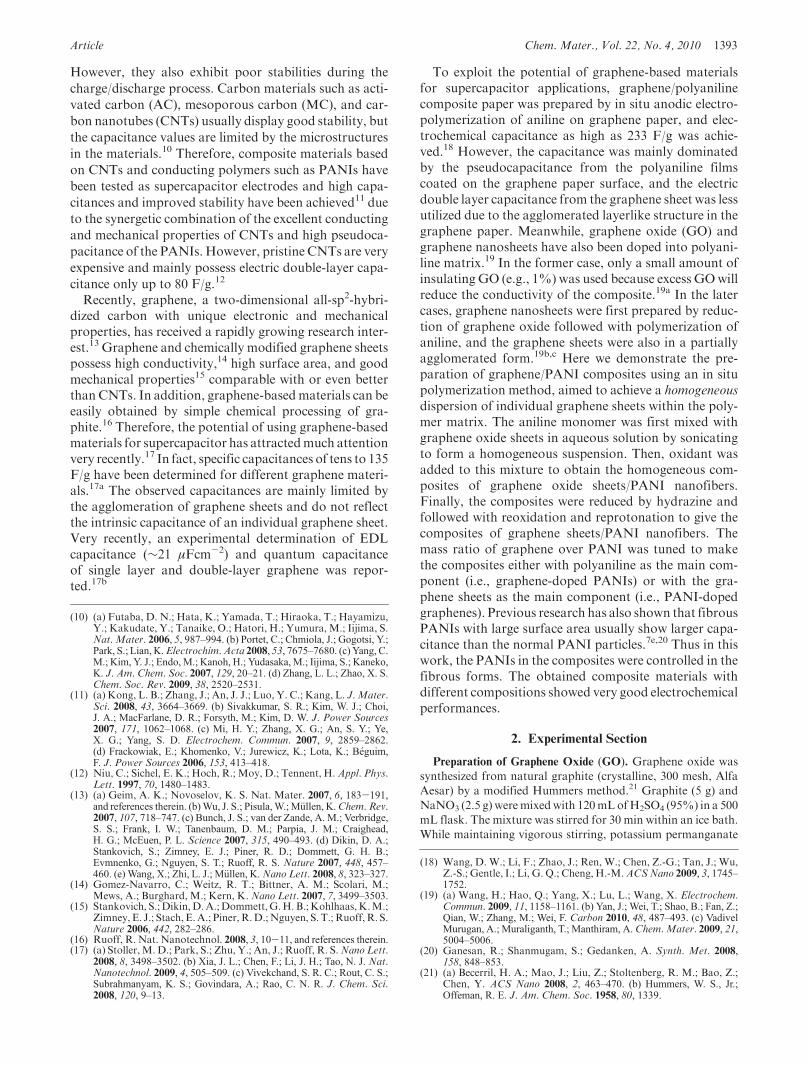
pubs.acs.org/cm Published on Web 01/27/2010 r 2010 American Chemical Society 1392 Chem. Mater. 2010, 22, 1392–1401 DOI:10.1021/cm902876u Graphene/Polyaniline Nanofiber Composites as Supercapacitor Electrodes Kai Zhang, † Li Li Zhang, ‡ X. S. Zhao,* ,‡ and Jishan Wu* ,† † Department of Chemistry, National University of Singapore, 3 Science Drive 3, 117543, Singapore, and ‡ Department of Chemical and Biomolecular Engineering, National University of Singapore, 4 Engineering Drive 4, Singapore 117576, Singapore Received September 15, 2009. Revised Manuscript Received December 18, 2009 Chemically modified graphene and polyaniline (PANI) nanofiber composites were prepared by in situ polymerization of aniline monomer in the presence of graphene oxide under acid conditions. The obtained graphene oxide/PANI composites with different mass ratios were reduced to graphene using hydrazine followed by reoxidation and reprotonation of the reduced PANI to give the graphene/PANI nanocomposites. The morphology, composition, and electronic structure of the composites together with pure polyaniline fibers (PANI-F), graphene oxide (GO), and graphene (GR) were characterized using X-ray diffraction (XRD), solid-state 13 C NMR, FT-IR, scanning electron microscope (SEM), transmission electron microscope (TEM), thermogravimetric analysis (TGA), and X-ray photoelectron spectroscopy (XPS). It was found that the chemically modified graphene and the PANI nanofibers formed a uniform nanocomposite with the PANI fibers absorbed on the graphene surface and/or filled between the graphene sheets. Such uniform structure together with the observed high conductivities afforded high specific capacitance and good cycling stability during the charge-discharge process when used as supercapacitor electrodes. A specific capacitance of as high as 480 F/g at a current density of 0.1 A/g was achieved over a PANI-doped graphene composite. The research data revealed that high specific capacitance and good cycling stability can be achieved either by doping chemically modified graphenes with PANI or by doping the bulky PANIs with graphene/graphene oxide. 1. Introduction In the wake of increasing pollution and depleting of traditional energy resource, the development of renewable energy production and hybrid electric vehicles with low CO 2 emission have been attracting much attention since the end of last century. 1 Meanwhile, great efforts have gone into developing lithium ion and other secondary batteries to store energy for autonomy purpose. 2 However, with the growing demand for portable systems and hybrid electric vehicles, which require high power in short-term pulses, the electrochemical capacitors are gathering pace. 3 Compared with secondary batteries, electrochemical ca- pacitors, also known as supercapacitors or ultracapacitors, exhibit faster and higher power capability, long life, wide thermal operating range, and low maintenance cost. 4 Supercapacitors have two energy storage mechanisms, namely the electrical double-layer (EDL) capacitance and the pseudocapacitance. 3a For EDL capacitors, carbon- based materials with a high surface area are usually used, and the capacitance comes from the charge accumulated at the electrode/electrolyte interface. 5 On the other hand, the pseudocapacitors or redox supercapacitors use con- ducting polymers and metal oxides as electrode materials, which undergo fast and reversible faradic redox reaction. 6 Among various materials used for supercapacitors, light- weight conducting polymers such as polyanilines (PANIs), 7 polypyrroles (PPYs), 8 and polythiophenes (PTs) 9 have been shown to display high capacitances. *Corresponding author e-mail: [email protected]; [email protected]. (1) Simon, P.; Gogotsi, Y. Nat. Mater. 2008, 7, 845–854. (2) (a) Tarascon, J. M.; Armand, M. Nature 2001, 414, 359–367. (b) Arico, A. S.; Bruce, P.; Scrosati, B.; Tarascon, J. M.; Van Schalkwijk, W. Nat. Mater. 2005, 4, 366–377. (3) (a) Conway, B. E. Electrochemical Supercapacitors: Scientific Fundamentals and Technological Applications; Kluwer: 1999. (b) Miller, J. R.; Simon, P. Science 2008, 321, 651–652. (4) (a) Winter, M.; Brodd, R. J. Chem. Rev. 2004, 104, 4245–4269. (b) Pandolfo, A. G.; Hollenkamp, A. F. J. Power Sources 2006, 157, 11–27. (5) Nishino, A. Proc. Electrochem. Soc. 1993, 93-23, 1. (6) Conway, B. E. Proc. Electrochem. Soc. 1995, 93-29, 15. (7) (a) Jang, J. Adv. Polym. Sci. 2006, 199, 189–259. (b) Fusalba, F.; Gouerec., P.; Belanger, D. J. Electrochem. Soc. 2001, 148, A1. (c) Hu, C. C.; Chu, C. H. Mater. Chem. Phys. 2000, 65, 329–338. (d) Ryu, K. S.; Kim, K. M.; Park, N.-G.; Park, Y. J.; Chang, S. H. J. Power Sources 2002, 103, 305–309. (e) Gupta, V.; Miura, N. Electrochem. Solid-State Lett. 2005, 8, A630–632. (f) B elanger, D.; Ren, X.; Davey, J.; Uribe, F.; Gottesfeld, S. J. Electrochem. Soc. 2000, 147, 2923– 2929. (8) (a) Frackowiak, E.; Khomenko, V.; Jurewicz, K.; Lota, K.; B eguin, F. J. Power Sources 2006, 153, 413–418. (b) Jurewicz, K.; Delpeux, S.; Bertaggna, V.; B eguin, F.; Frackowiak, E. Chem. Phys. Lett. 2001, 347, 36–40. (9) (a) Rudge, A.; Davey, J.; Raistrick, I.; Gottesfeld, S.; Ferraris, J. P. J. Power Sources 1994, 47, 89–107. (b) Laforgue, A.; Simon, P.; Sarrazin, C.; Fauvarque, J.-F. J. Power Sources 1999, 80, 142–148. (c) Mastragostino, M.; Arbizzani, C.; Soavi, F. J. Power Sources 2001, 97-98, 812–815. (d) Arbizzani, C.; Mastragostino, M.; Soavi, F. J. Power Sources 2001, 100, 164–170.
-
Upload
flor-renteria-baltierrez -
Category
Documents
-
view
56 -
download
4
description
GraphenePolyaniline Nanofiber Composites as Supercapacitor
Transcript of GraphenePolyaniline Nanofiber Composites as Supercapacitor
pubs.acs.org/cm Published on Web 01/27/2010 r 2010 American Chemical Society
1392 Chem. Mater. 2010, 22, 1392–1401DOI:10.1021/cm902876u
Graphene/Polyaniline Nanofiber Composites as Supercapacitor
Electrodes
Kai Zhang,† Li Li Zhang,‡ X. S. Zhao,*,‡ and Jishan Wu*,†
†Department of Chemistry, National University of Singapore, 3 Science Drive 3, 117543, Singapore, and‡Department of Chemical and Biomolecular Engineering, National University of Singapore, 4 Engineering
Drive 4, Singapore 117576, Singapore
Received September 15, 2009. Revised Manuscript Received December 18, 2009
Chemically modified graphene and polyaniline (PANI) nanofiber composites were prepared by insitu polymerization of aniline monomer in the presence of graphene oxide under acid conditions. Theobtained graphene oxide/PANI composites with different mass ratios were reduced to grapheneusing hydrazine followed by reoxidation and reprotonation of the reduced PANI to give thegraphene/PANI nanocomposites. The morphology, composition, and electronic structure ofthe composites together with pure polyaniline fibers (PANI-F), graphene oxide (GO), and graphene(GR) were characterized using X-ray diffraction (XRD), solid-state 13C NMR, FT-IR, scanningelectron microscope (SEM), transmission electron microscope (TEM), thermogravimetric analysis(TGA), and X-ray photoelectron spectroscopy (XPS). It was found that the chemically modifiedgraphene and the PANI nanofibers formed a uniform nanocomposite with the PANI fibers absorbedon the graphene surface and/or filled between the graphene sheets. Such uniform structure togetherwith the observed high conductivities afforded high specific capacitance and good cycling stabilityduring the charge-discharge process when used as supercapacitor electrodes. A specific capacitanceof as high as 480 F/g at a current density of 0.1 A/g was achieved over a PANI-doped graphenecomposite. The research data revealed that high specific capacitance and good cycling stability can beachieved either by doping chemically modified graphenes with PANI or by doping the bulky PANIswith graphene/graphene oxide.
1. Introduction
In the wake of increasing pollution and depleting oftraditional energy resource, the development of renewableenergy production and hybrid electric vehicles with lowCO2 emission have been attracting much attention sincethe end of last century.1 Meanwhile, great efforts havegone into developing lithium ion and other secondarybatteries to store energy for autonomypurpose.2However,with the growing demand for portable systems and hybridelectric vehicles, which require high power in short-termpulses, the electrochemical capacitors are gathering pace.3
Compared with secondary batteries, electrochemical ca-pacitors, alsoknownas supercapacitors or ultracapacitors,exhibit faster and higher power capability, long life, widethermal operating range, and low maintenance cost.4
Supercapacitors have two energy storage mechanisms,namely the electrical double-layer (EDL) capacitance and
the pseudocapacitance.3a For EDL capacitors, carbon-based materials with a high surface area are usually used,and the capacitance comes from the charge accumulatedat the electrode/electrolyte interface.5 On the other hand,the pseudocapacitors or redox supercapacitors use con-ducting polymers andmetal oxides as electrode materials,which undergo fast and reversible faradic redox reaction.6
Among various materials used for supercapacitors, light-weight conducting polymers such as polyanilines(PANIs),7 polypyrroles (PPYs),8 and polythiophenes(PTs)9 have been shown to display high capacitances.
*Corresponding author e-mail: [email protected]; [email protected].(1) Simon, P.; Gogotsi, Y. Nat. Mater. 2008, 7, 845–854.(2) (a) Tarascon, J. M.; Armand, M. Nature 2001, 414, 359–367.
(b) Arico, A. S.; Bruce, P.; Scrosati, B.; Tarascon, J. M.; Van Schalkwijk,W. Nat. Mater. 2005, 4, 366–377.
(3) (a) Conway, B. E. Electrochemical Supercapacitors: ScientificFundamentals and Technological Applications; Kluwer: 1999.(b) Miller, J. R.; Simon, P. Science 2008, 321, 651–652.
(4) (a) Winter, M.; Brodd, R. J. Chem. Rev. 2004, 104, 4245–4269.(b) Pandolfo, A. G.; Hollenkamp, A. F. J. Power Sources 2006, 157,11–27.
(5) Nishino, A. Proc. Electrochem. Soc. 1993, 93-23, 1.(6) Conway, B. E. Proc. Electrochem. Soc. 1995, 93-29, 15.(7) (a) Jang, J. Adv. Polym. Sci. 2006, 199, 189–259. (b) Fusalba, F.;
Gouerec., P.; Belanger, D. J. Electrochem. Soc. 2001, 148, A1. (c) Hu,C. C.; Chu, C. H. Mater. Chem. Phys. 2000, 65, 329–338. (d) Ryu,K. S.; Kim, K. M.; Park, N.-G.; Park, Y. J.; Chang, S. H. J. PowerSources 2002, 103, 305–309. (e) Gupta, V.; Miura, N. Electrochem.Solid-State Lett. 2005, 8, A630–632. (f) B�elanger, D.; Ren, X.; Davey,J.; Uribe, F.; Gottesfeld, S. J. Electrochem. Soc. 2000, 147, 2923–2929.
(8) (a) Frackowiak, E.;Khomenko,V.; Jurewicz,K.; Lota,K.; B�eguin,F. J. Power Sources 2006, 153, 413–418. (b) Jurewicz, K.; Delpeux,S.; Bertaggna, V.; B�eguin, F.; Frackowiak, E.Chem. Phys. Lett. 2001,347, 36–40.
(9) (a) Rudge, A.; Davey, J.; Raistrick, I.; Gottesfeld, S.; Ferraris, J. P.J. Power Sources 1994, 47, 89–107. (b) Laforgue, A.; Simon, P.;Sarrazin, C.; Fauvarque, J.-F. J. Power Sources 1999, 80, 142–148.(c) Mastragostino, M.; Arbizzani, C.; Soavi, F. J. Power Sources 2001,97-98, 812–815. (d) Arbizzani, C.; Mastragostino, M.; Soavi, F.J. Power Sources 2001, 100, 164–170.
Article Chem. Mater., Vol. 22, No. 4, 2010 1393
However, they also exhibit poor stabilities during the
charge/discharge process. Carbon materials such as acti-
vated carbon (AC), mesoporous carbon (MC), and car-
bon nanotubes (CNTs) usually display good stability, but
the capacitance values are limited by the microstructures
in the materials.10 Therefore, composite materials based
on CNTs and conducting polymers such as PANIs have
been tested as supercapacitor electrodes and high capa-
citances and improved stability have been achieved11 due
to the synergetic combination of the excellent conducting
and mechanical properties of CNTs and high pseudoca-
pacitance of the PANIs. However, pristine CNTs are very
expensive and mainly possess electric double-layer capa-
citance only up to 80 F/g.12
Recently, graphene, a two-dimensional all-sp2-hybri-dized carbon with unique electronic and mechanicalproperties, has received a rapidly growing research inter-est.13 Graphene and chemically modified graphene sheetspossess high conductivity,14 high surface area, and goodmechanical properties15 comparable with or even betterthan CNTs. In addition, graphene-basedmaterials can beeasily obtained by simple chemical processing of gra-phite.16 Therefore, the potential of using graphene-basedmaterials for supercapacitor has attractedmuch attentionvery recently.17 In fact, specific capacitances of tens to 135F/g have been determined for different graphene materi-als.17a The observed capacitances are mainly limited bythe agglomeration of graphene sheets and do not reflectthe intrinsic capacitance of an individual graphene sheet.Very recently, an experimental determination of EDLcapacitance (∼21 μFcm-2) and quantum capacitanceof single layer and double-layer graphene was repor-ted.17b
To exploit the potential of graphene-based materialsfor supercapacitor applications, graphene/polyanilinecomposite paper was prepared by in situ anodic electro-polymerization of aniline on graphene paper, and elec-trochemical capacitance as high as 233 F/g was achie-ved.18 However, the capacitance was mainly dominatedby the pseudocapacitance from the polyaniline filmscoated on the graphene paper surface, and the electricdouble layer capacitance from the graphene sheet was lessutilized due to the agglomerated layerlike structure in thegraphene paper. Meanwhile, graphene oxide (GO) andgraphene nanosheets have also been doped into polyani-line matrix.19 In the former case, only a small amount ofinsulating GO (e.g., 1%) was used because excess GOwillreduce the conductivity of the composite.19a In the latercases, graphene nanosheets were first prepared by reduc-tion of graphene oxide followed with polymerization ofaniline, and the graphene sheets were also in a partiallyagglomerated form.19b,c Here we demonstrate the pre-paration of graphene/PANI composites using an in situpolymerization method, aimed to achieve a homogeneousdispersion of individual graphene sheets within the poly-mer matrix. The aniline monomer was first mixed withgraphene oxide sheets in aqueous solution by sonicatingto form a homogeneous suspension. Then, oxidant wasadded to this mixture to obtain the homogeneous com-posites of graphene oxide sheets/PANI nanofibers.Finally, the composites were reduced by hydrazine andfollowed with reoxidation and reprotonation to give thecomposites of graphene sheets/PANI nanofibers. Themass ratio of graphene over PANI was tuned to makethe composites either with polyaniline as the main com-ponent (i.e., graphene-doped PANIs) or with the gra-phene sheets as the main component (i.e., PANI-dopedgraphenes). Previous research has also shown that fibrousPANIs with large surface area usually show larger capa-citance than the normal PANI particles.7e,20 Thus in thiswork, the PANIs in the composites were controlled in thefibrous forms. The obtained composite materials withdifferent compositions showed very good electrochemicalperformances.
2. Experimental Section
Preparation of Graphene Oxide (GO). Graphene oxide was
synthesized from natural graphite (crystalline, 300 mesh, Alfa
Aesar) by a modified Hummers method.21 Graphite (5 g) and
NaNO3 (2.5 g) weremixedwith 120mLofH2SO4 (95%) in a 500
mL flask. The mixture was stirred for 30 min within an ice bath.
While maintaining vigorous stirring, potassium permanganate
(10) (a) Futaba, D. N.; Hata, K.; Yamada, T.; Hiraoka, T.; Hayamizu,Y.; Kakudate, Y.; Tanaike, O.; Hatori, H.; Yumura, M.; Iijima, S.Nat. Mater. 2006, 5, 987–994. (b) Portet, C.; Chmiola, J.; Gogotsi, Y.;Park, S.; Lian, K.Electrochim.Acta 2008, 53, 7675–7680. (c) Yang, C.M.; Kim, Y. J.; Endo, M.; Kanoh, H.; Yudasaka, M.; Iijima, S.; Kaneko,K. J. Am. Chem. Soc. 2007, 129, 20–21. (d) Zhang, L. L.; Zhao, X. S.Chem. Soc. Rev. 2009, 38, 2520–2531.
(11) (a) Kong, L. B.; Zhang, J.; An, J. J.; Luo, Y. C.; Kang, L. J.Mater.Sci. 2008, 43, 3664–3669. (b) Sivakkumar, S. R.; Kim, W. J.; Choi,J. A.; MacFarlane, D. R.; Forsyth, M.; Kim, D. W. J. Power Sources2007, 171, 1062–1068. (c) Mi, H. Y.; Zhang, X. G.; An, S. Y.; Ye,X. G.; Yang, S. D. Electrochem. Commun. 2007, 9, 2859–2862.(d) Frackowiak, E.; Khomenko, V.; Jurewicz, K.; Lota, K.; B�eguim,F. J. Power Sources 2006, 153, 413–418.
(12) Niu, C.; Sichel, E. K.; Hoch, R.; Moy, D.; Tennent, H. Appl. Phys.Lett. 1997, 70, 1480–1483.
(13) (a) Geim, A. K.; Novoselov, K. S. Nat. Mater. 2007, 6, 183-191,and references therein. (b)Wu, J. S.; Pisula,W.; M€ullen, K.Chem. Rev.2007, 107, 718–747. (c) Bunch, J. S.; van der Zande, A. M.; Verbridge,S. S.; Frank, I. W.; Tanenbaum, D. M.; Parpia, J. M.; Craighead,H. G.; McEuen, P. L. Science 2007, 315, 490–493. (d) Dikin, D. A.;Stankovich, S.; Zimney, E. J.; Piner, R. D.; Dommett, G. H. B.;Evmnenko, G.; Nguyen, S. T.; Ruoff, R. S. Nature 2007, 448, 457–460. (e) Wang, X.; Zhi, L. J.; M€ullen, K.Nano Lett. 2008, 8, 323–327.
(14) Gomez-Navarro, C.; Weitz, R. T.; Bittner, A. M.; Scolari, M.;Mews, A.; Burghard, M.; Kern, K. Nano Lett. 2007, 7, 3499–3503.
(15) Stankovich, S.;Dikin,D.A.;Dommett,G.H. B.;Kohlhaas,K.M.;Zimney, E. J.; Stach, E.A.; Piner,R.D.;Nguyen, S. T.; Ruoff,R. S.Nature 2006, 442, 282–286.
(16) Ruoff, R. Nat. Nanotechnol. 2008, 3, 10-11, and references therein.(17) (a) Stoller,M.D.; Park, S.; Zhu, Y.; An, J.; Ruoff, R. S.Nano Lett.
2008, 8, 3498–3502. (b) Xia, J. L.; Chen, F.; Li, J. H.; Tao, N. J. Nat.Nanotechnol. 2009, 4, 505–509. (c) Vivekchand, S. R. C.; Rout, C. S.;Subrahmanyam, K. S.; Govindara, A.; Rao, C. N. R. J. Chem. Sci.2008, 120, 9–13.
(18) Wang, D. W.; Li, F.; Zhao, J.; Ren, W.; Chen, Z.-G.; Tan, J.; Wu,Z.-S.; Gentle, I.; Li, G. Q.; Cheng, H.-M.ACSNano 2009, 3, 1745–1752.
(19) (a) Wang, H.; Hao, Q.; Yang, X.; Lu, L.; Wang, X. Electrochem.Commun. 2009, 11, 1158–1161. (b) Yan, J.; Wei, T.; Shao, B.; Fan, Z.;Qian, W.; Zhang, M.; Wei, F. Carbon 2010, 48, 487–493. (c) VadivelMurugan, A.; Muraliganth, T.; Manthiram, A.Chem.Mater. 2009, 21,5004–5006.
(20) Ganesan, R.; Shanmugam, S.; Gedanken, A. Synth. Met. 2008,158, 848–853.
(21) (a) Becerril, H. A.; Mao, J.; Liu, Z.; Stoltenberg, R. M.; Bao, Z.;Chen, Y. ACS Nano 2008, 2, 463–470. (b) Hummers, W. S., Jr.;Offeman, R. E. J. Am. Chem. Soc. 1958, 80, 1339.
1394 Chem. Mater., Vol. 22, No. 4, 2010 Zhang et al.
(15 g) was added to the suspension. The rate of addition was
carefully controlled to keep the reaction temperature lower than
20 �C. The ice bath was then removed, and the mixture was
stirred at room temperature overnight. As the reaction pro-
gressed, the mixture gradually became pasty, and the color
turned into light brownish. At the end, 150 mL of H2O was
slowly added to the pasty with vigorous agitation. The reaction
temperature was rapidly increased to 98 �C with effervescence,
and the color changed to yellow. The diluted suspension was
stirred at 98 �C for one day. Then, 50 mL of 30% H2O2 was
added to the mixture. For purification, the mixture was washed
by rinsing and centrifugation with 5% HCl and then deionized
(DI) water for several times. After filtration and dry under
vacuum, the graphene oxide (GO) was obtained as a gray
powder.
Reduction of Graphene Oxide. Chemical conversion of gra-
phene oxide to reduced graphene oxide (GR) was done accord-
ing to the reported method.22 In a typical experiment, 0.1 g of
graphene oxide was dispersed in 50 mL of DI water. Then 0.1 mL
of hydrazine monohydrate was added, and the mixture was
heated at 95 �C for 1 h. Once the reaction is completed, the
reduced graphene oxide (GR) was collected by filtration as a
black powder. The obtained cake was washed with DI water
several times to remove the excess hydrazine, and the final
product was dried in a vacuum oven at 80 �C.Preparation of Polyaniline Nanofibers (PANI-F). Polyaniline
nanofibers were synthesized by a rapid mixing reaction.23 Ani-
line was first distilled under vacuum to remove the oxidation
impurities. The purified aniline (0.3 g, 3.2 mmol) was dissolved
in 10 mL of 1 M HCl aqueous solution. While maintaining
vigorous stirring at room temperature, ammonium peroxydi-
sulfate (0.18 g, 0.8mmol) in 10mL of 1MHCl aqueous solution
was rapidly poured into the aniline solution. Polymerizationwas
observed in about 5 min when the characteristic green color of
polyaniline emeraldine salt appeared. The mixture was allowed
to stir at room temperature overnight. At the end, the mixture
was diluted by 100 mL of water. The precipitated polymer was
collected by filtration and repetitively washed with water,
ethanol, and hexane until the filtrate became colorless. After
having been dried under vacuum at 60 �C, the PANI-F sample
(0.08 g) was collected as a deep blue powder in 27% yield.
Preparation of Polyaniline-Graphene Oxide Composites.
Homogenous composites of graphene oxide and polyaniline
nanofibers were prepared by in situ polymerization of aniline
in a suspension of graphene oxide in acidic solution. The weight
feed ratio of aniline to graphene oxidewas varied as 90:10, 50:50,
and 20:80, and the resulting composites were named as
PAGO10, PAGO50, and PAGO80, respectively. Typically,
the purified aniline was dissolved in 1MHCl at a concentration
of 0.3M.Graphene oxide was dispersed in the resulting solution
by bath-sonicating for 1 h. While maintaining vigorous stirring
at room temperature, another solution of ammonium peroxy-
disulfate, with a mole ratio to aniline of 1:4, in 1 M HCl was
rapidly poured to the mixture. Polymerization of aniline started
after about 5 min, while the color of the mixture changed into
green. The mixture was allowed to stir at room temperature
overnight and then diluted by 100 mL of water. The composites
were collected by filtration and repetitively washed with water,
ethanol, and hexane until the filtrate become colorless. The real
mass percentages of the polyaniline in the composites are
estimated as 73% for PAGO10, 20% for PAGO50, and 5%
for PAGO80 by weighting the GO powder before and after
polymerization.
Preparation of the Graphene-Polyaniline Nanofiber Compo-
sites. The polyaniline-graphene oxide composites (PAGO10,
PAGO50, and PAGO80) were reduced by hydrazine following
a similar procedure to that forGR. Typically, 0.1 g of composite
was heated with 0.1 mL of hydrazine in 50 mL of water at 95 �Cfor 1 h. The reduced composite was filtered and repetitively
washed withDIwater to remove excess hydrazine. The resulting
material was dispersed in 10mL of 1MHCl solution containing
0.06 g of ammonium peroxydisulfate. Themixture was stirred at
room temperature overnight, and the powder was collected by
filtration and repetitively washed with DI water, ethanol, and
hexane. The final composites were dried at 60 �C in a vacuum
oven, and the dry powder was named as PAG10, PAG50, and
PAG80, respectively.
General Characterization. Transmission electron microscope
(TEM) measurements were conducted on A JEOL 2010 FEG
microscope at 200 keV. The TEM samples were prepared by
dispensing a small amount of dry powder in ethanol. Then, one
drop of the suspension was dropped on 300 mesh copper TEM
grids covered with thin amorphous carbon films. Scanning
electron microscope (SEM) measurements were carried out a
field emission scanning electron microanalyzer (JEOL-6300F)
at 5 kV. The SEM sample was prepared by placing a drop of
dilute ethanol dispersion of the composites onto a copper plate
attached to an aluminum sample holder, and the solvent was
allowed to evaporate at room temperature. X-ray diffraction
(XRD) patterns of the composites were measured on a Bruker-
AXS D8 DISCOVER with GADDS Powder X-ray diffracto-
meter. Copper KR line was used as a radiation source with λ =
1.5406 A. X-ray photoelectron spectroscopy (XPS) analysis was
carried out on an AXIS HIS 165 spectrometer (Kratos Ana-
lytical) using a monochromatized Al KR X-ray source (1486.71
eV photons). Infrared spectra were recorded on a Varian 3100
FT-IR spectrometer by using pressed KBr pellets. High-resolu-
tion solid-state 13C NMR experiments were carried out on a
Bruker DRX-400 MHz NMR spectrometer. Thermogravi-
metric analysis (TGA) was carried out on a TA Instruments
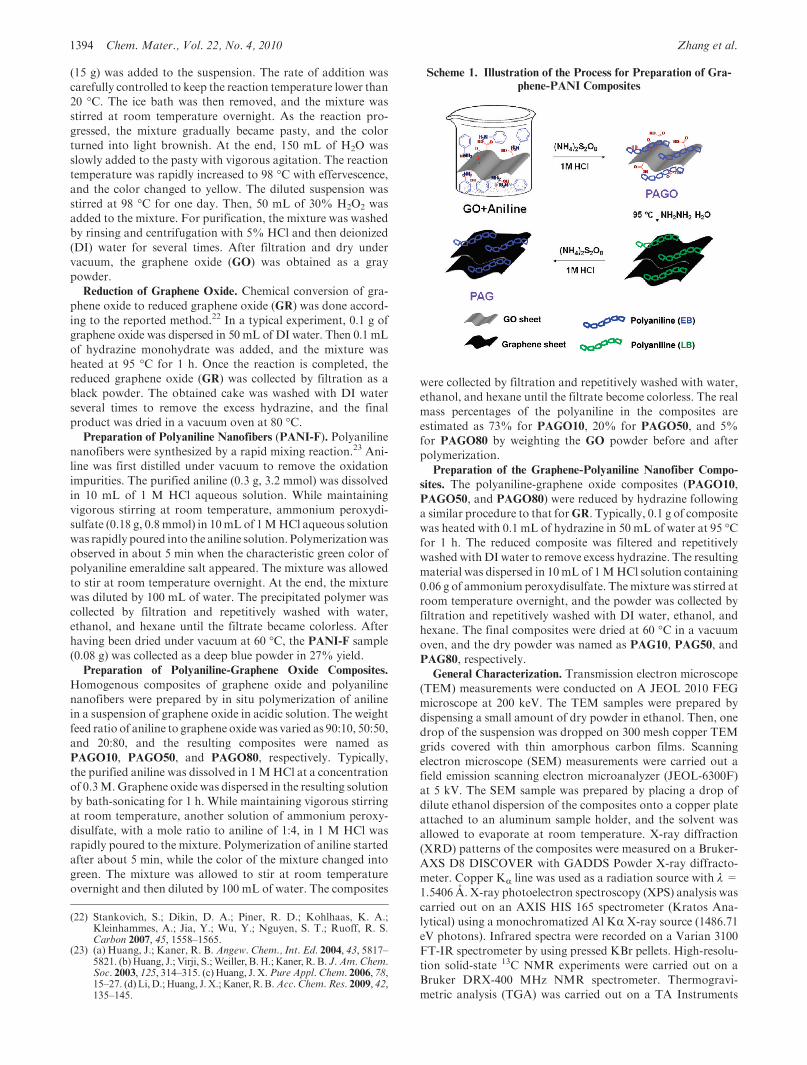
Scheme 1. Illustration of the Process for Preparation of Gra-
phene-PANI Composites
(22) Stankovich, S.; Dikin, D. A.; Piner, R. D.; Kohlhaas, K. A.;Kleinhammes, A.; Jia, Y.; Wu, Y.; Nguyen, S. T.; Ruoff, R. S.Carbon 2007, 45, 1558–1565.
(23) (a) Huang, J.; Kaner, R. B. Angew. Chem., Int. Ed. 2004, 43, 5817–5821. (b) Huang, J.; Virji, S.; Weiller, B. H.; Kaner, R. B. J. Am. Chem.Soc. 2003, 125, 314–315. (c) Huang, J. X.Pure Appl. Chem. 2006, 78,15–27. (d) Li, D.; Huang, J. X.; Kaner, R. B.Acc. Chem.Res. 2009, 42,135–145.
Article Chem. Mater., Vol. 22, No. 4, 2010 1395
2960 at a heating rate of 10 �C/min under nitrogen flow. The
Bulk DC conductivity measurements of the composites were
made on pressed pellets (1.3 cm diameter, <1 mm thickness)
with an Alessi four-probe-point conductivity probe. A Keithley
617 programmable electrometer and a Keithley 224 program-
mable current source were used for the measurement of voltage
as a function of current. The specific surface areas (SBET) were
determined according to the Brunauer-Emmett-Teller (BET)
plot of nitrogen adsorption isotherm in the relative pressure
range of 0.05-0.2.
Electrochemical Measurements. The working electrode was
prepared by casting a nafion-impregnated sample onto a glassy
carbon electrode with a diameter of 5 mm. Typically, 5 mg of a
composite was dispersed in 1mLof an ethanol solution contain-
ing 5 μL of a nafion solution (5 wt% in water) by sonication for
20 min. This sample was then dropped onto the glassy carbon
electrode and dried in an oven before the electrochemical test. A
three-electrode cell system was used to evaluate the electroche-
mical performance by electrochemical impedance spectroscopy,
cyclic voltammetry (CV), and galvanostatic charge-discharge
techniques on an Autolab PGSTAT302N at room temperature.
The electrolyte used is a 2 M H2SO4 aqueous solution. A
platinum sheet and a AgCl/Ag electrode were used as the
counter and the reference electrodes, respectively.
3. Results and Discussion
3.1. Preparation of Graphene/Polyaniline Nanofiber
Composites. The preparation method is illustrated inScheme 1. First, the graphene oxide (GO) was preparedaccording to amodified Hummer’s method.21 It is knownthatGO can form stable suspension in water, and, thus, ahomogeneousmixture ofGO in acidic solution (1MHCl)containing various amounts of aniline can be easilyobtained. Under vigorous stirring, oxidant ammonium
peroxydisulfate (APS) in 1 M HCl solution was rapidlyadded, and the mixture was stirred at room temperatureovernight to generate a polyaniline-graphene oxide com-posite. Based on the mass feed ratios of the anilinemonomer to the graphene oxide (10%, 50%, and 80%GO), the obtained composites are designed as PAGO10,PAGO50, and PAGO80, respectively. Under such fastmixing conditions, polyaniline fibers are believed to formin the composites.23 In situ polymerization of aniline inthe presence ofGO in the acidic aqueous solution allowedus to prepare homogeneous composites in which PANIandGO are believed to intercalate with each other insteadof individually being in an agglomerated form as ob-served previously.17a,c The composites were then treatedwith hydrazine at 95 �C for 1 h. Most GO is believed tohave been reduced to form conductive graphene sheets.22
However, the PANI in the compositesmay have also beenreduced from the highly conductive halfly oxidized emer-aldine base (EB) state to the reduced, neutral leucoemer-aldine (LB) state during the reduction process,24 soreoxidation and reprotonation are necessary to recoverthe conductive PANI structure after the reduction of GO.The reduced composites were then stirred in 1 M HClsolution in the presence of ammonium peroxydisulfate atroom temperature overnight. After filtration, washing,and drying, polyaniline/graphene composites, designedas PAG10, PAG50, and PAG80, respectively, were ob-tained from the corresponding polyaniline/GOcomposites.
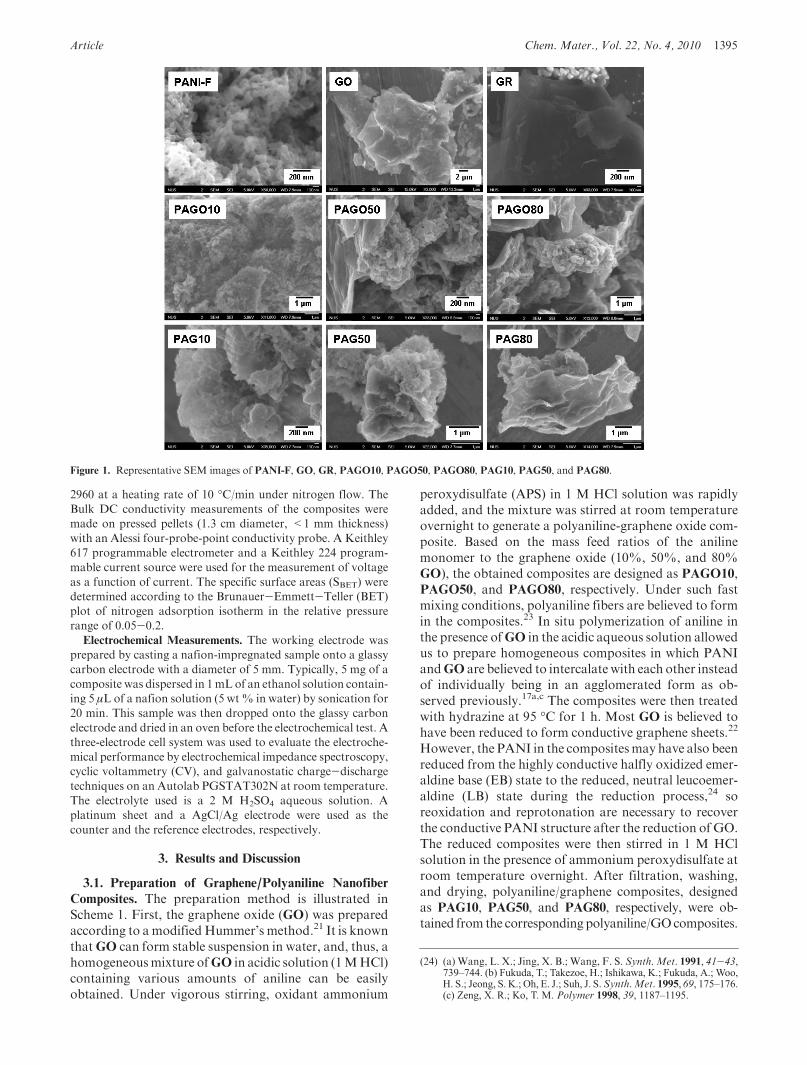
Figure 1. Representative SEM images of PANI-F, GO, GR, PAGO10, PAGO50, PAGO80, PAG10, PAG50, and PAG80.
(24) (a) Wang, L. X.; Jing, X. B.; Wang, F. S. Synth. Met. 1991, 41-43,739–744. (b) Fukuda, T.; Takezoe, H.; Ishikawa, K.; Fukuda, A.; Woo,H. S.; Jeong, S. K.; Oh, E. J.; Suh, J. S.Synth.Met. 1995, 69, 175–176.(c) Zeng, X. R.; Ko, T. M. Polymer 1998, 39, 1187–1195.
1396 Chem. Mater., Vol. 22, No. 4, 2010 Zhang et al.
For comparison purposes, pure polyaniline nanofibers(PANI-F) and reduced graphene (GR) were also preparedvia the similar polymerization and reduction processes asdescribed above.3.2. Morphology and Structure. The morphology and
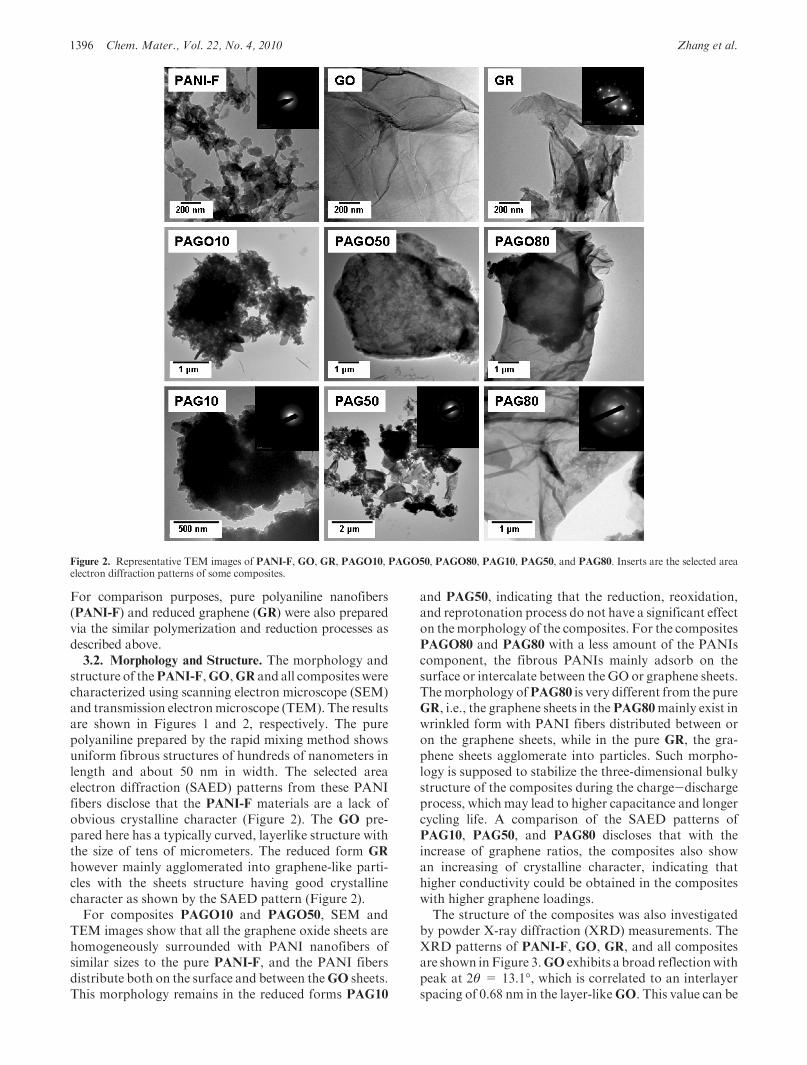
structure of thePANI-F,GO,GR and all compositeswerecharacterized using scanning electron microscope (SEM)and transmission electronmicroscope (TEM). The resultsare shown in Figures 1 and 2, respectively. The purepolyaniline prepared by the rapid mixing method showsuniform fibrous structures of hundreds of nanometers inlength and about 50 nm in width. The selected areaelectron diffraction (SAED) patterns from these PANIfibers disclose that the PANI-F materials are a lack ofobvious crystalline character (Figure 2). The GO pre-pared here has a typically curved, layerlike structure withthe size of tens of micrometers. The reduced form GR
however mainly agglomerated into graphene-like parti-cles with the sheets structure having good crystallinecharacter as shown by the SAED pattern (Figure 2).For composites PAGO10 and PAGO50, SEM and
TEM images show that all the graphene oxide sheets arehomogeneously surrounded with PANI nanofibers ofsimilar sizes to the pure PANI-F, and the PANI fibersdistribute both on the surface and between theGO sheets.This morphology remains in the reduced forms PAG10
and PAG50, indicating that the reduction, reoxidation,and reprotonation process do not have a significant effecton themorphology of the composites. For the compositesPAGO80 and PAG80 with a less amount of the PANIscomponent, the fibrous PANIs mainly adsorb on thesurface or intercalate between theGO or graphene sheets.Themorphology ofPAG80 is very different from the pureGR, i.e., the graphene sheets in thePAG80mainly exist inwrinkled form with PANI fibers distributed between oron the graphene sheets, while in the pure GR, the gra-phene sheets agglomerate into particles. Such morpho-logy is supposed to stabilize the three-dimensional bulkystructure of the composites during the charge-dischargeprocess, which may lead to higher capacitance and longercycling life. A comparison of the SAED patterns ofPAG10, PAG50, and PAG80 discloses that with theincrease of graphene ratios, the composites also showan increasing of crystalline character, indicating thathigher conductivity could be obtained in the compositeswith higher graphene loadings.The structure of the composites was also investigated
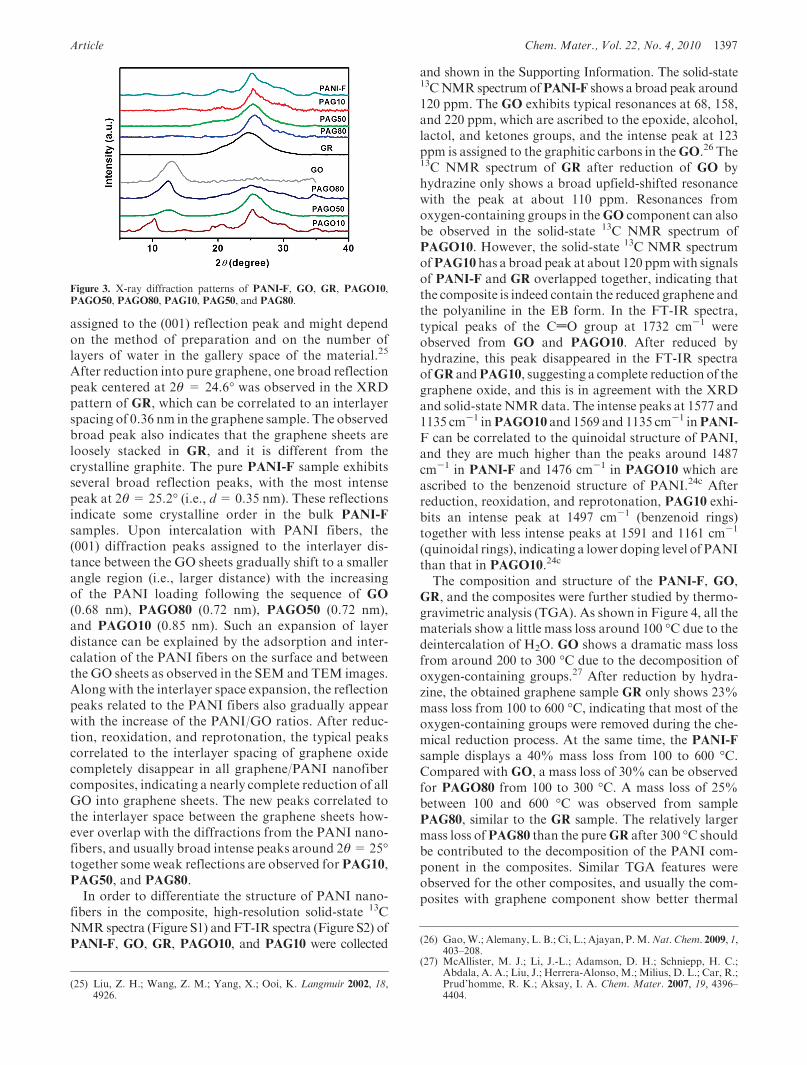
by powder X-ray diffraction (XRD) measurements. TheXRD patterns of PANI-F, GO, GR, and all compositesare shown inFigure 3.GO exhibits a broad reflectionwithpeak at 2θ = 13.1�, which is correlated to an interlayerspacing of 0.68 nm in the layer-likeGO. This value can be
Figure 2. Representative TEM images of PANI-F, GO, GR, PAGO10, PAGO50, PAGO80, PAG10, PAG50, and PAG80. Inserts are the selected areaelectron diffraction patterns of some composites.
Article Chem. Mater., Vol. 22, No. 4, 2010 1397
assigned to the (001) reflection peak and might dependon the method of preparation and on the number oflayers of water in the gallery space of the material.25
After reduction into pure graphene, one broad reflectionpeak centered at 2θ = 24.6� was observed in the XRDpattern of GR, which can be correlated to an interlayerspacing of 0.36 nm in the graphene sample. The observedbroad peak also indicates that the graphene sheets areloosely stacked in GR, and it is different from thecrystalline graphite. The pure PANI-F sample exhibitsseveral broad reflection peaks, with the most intensepeak at 2θ= 25.2� (i.e., d= 0.35 nm). These reflectionsindicate some crystalline order in the bulk PANI-F
samples. Upon intercalation with PANI fibers, the(001) diffraction peaks assigned to the interlayer dis-tance between the GO sheets gradually shift to a smallerangle region (i.e., larger distance) with the increasingof the PANI loading following the sequence of GO
(0.68 nm), PAGO80 (0.72 nm), PAGO50 (0.72 nm),and PAGO10 (0.85 nm). Such an expansion of layerdistance can be explained by the adsorption and inter-calation of the PANI fibers on the surface and betweenthe GO sheets as observed in the SEM and TEM images.Along with the interlayer space expansion, the reflectionpeaks related to the PANI fibers also gradually appearwith the increase of the PANI/GO ratios. After reduc-tion, reoxidation, and reprotonation, the typical peakscorrelated to the interlayer spacing of graphene oxidecompletely disappear in all graphene/PANI nanofibercomposites, indicating a nearly complete reduction of allGO into graphene sheets. The new peaks correlated tothe interlayer space between the graphene sheets how-ever overlap with the diffractions from the PANI nano-fibers, and usually broad intense peaks around 2θ=25�together some weak reflections are observed for PAG10,PAG50, and PAG80.In order to differentiate the structure of PANI nano-
fibers in the composite, high-resolution solid-state 13CNMR spectra (Figure S1) andFT-IR spectra (Figure S2) ofPANI-F, GO, GR, PAGO10, and PAG10 were collected
and shown in the Supporting Information. The solid-state13CNMRspectrumofPANI-F shows a broad peak around120 ppm. The GO exhibits typical resonances at 68, 158,and 220 ppm, which are ascribed to the epoxide, alcohol,lactol, and ketones groups, and the intense peak at 123ppm is assigned to the graphitic carbons in theGO.26 The13C NMR spectrum of GR after reduction of GO byhydrazine only shows a broad upfield-shifted resonancewith the peak at about 110 ppm. Resonances fromoxygen-containing groups in theGO component can alsobe observed in the solid-state 13C NMR spectrum ofPAGO10. However, the solid-state 13C NMR spectrumofPAG10 has a broad peak at about 120 ppmwith signalsof PANI-F and GR overlapped together, indicating thatthe composite is indeed contain the reduced graphene andthe polyaniline in the EB form. In the FT-IR spectra,typical peaks of the CdO group at 1732 cm-1 wereobserved from GO and PAGO10. After reduced byhydrazine, this peak disappeared in the FT-IR spectraofGR andPAG10, suggesting a complete reduction of thegraphene oxide, and this is in agreement with the XRDand solid-state NMRdata. The intense peaks at 1577 and1135 cm-1 inPAGO10 and 1569 and 1135 cm-1 inPANI-
F can be correlated to the quinoidal structure of PANI,and they are much higher than the peaks around 1487cm-1 in PANI-F and 1476 cm-1 in PAGO10 which areascribed to the benzenoid structure of PANI.24c Afterreduction, reoxidation, and reprotonation, PAG10 exhi-bits an intense peak at 1497 cm-1 (benzenoid rings)together with less intense peaks at 1591 and 1161 cm-1
(quinoidal rings), indicating a lower doping level of PANIthan that in PAGO10.24c
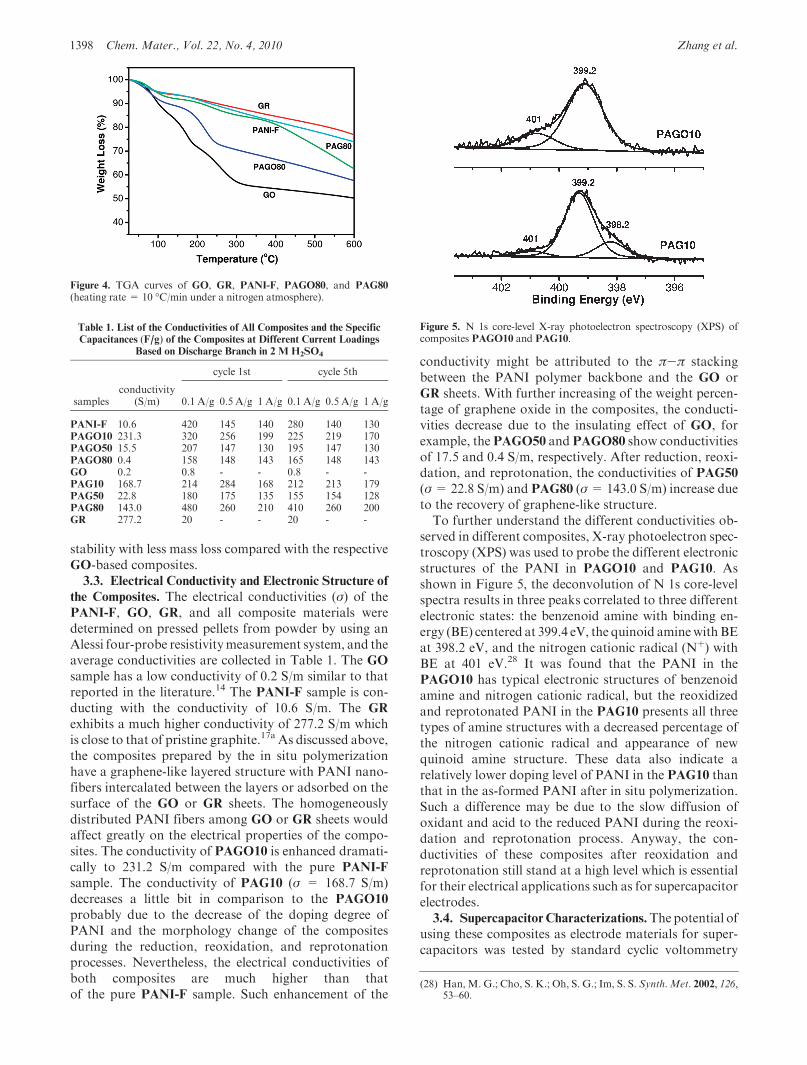
The composition and structure of the PANI-F, GO,GR, and the composites were further studied by thermo-gravimetric analysis (TGA). As shown in Figure 4, all thematerials show a little mass loss around 100 �C due to thedeintercalation of H2O. GO shows a dramatic mass lossfrom around 200 to 300 �C due to the decomposition ofoxygen-containing groups.27 After reduction by hydra-zine, the obtained graphene sample GR only shows 23%mass loss from 100 to 600 �C, indicating that most of theoxygen-containing groups were removed during the che-mical reduction process. At the same time, the PANI-F
sample displays a 40% mass loss from 100 to 600 �C.Compared with GO, a mass loss of 30% can be observedfor PAGO80 from 100 to 300 �C. A mass loss of 25%between 100 and 600 �C was observed from samplePAG80, similar to the GR sample. The relatively largermass loss ofPAG80 than the pureGR after 300 �C shouldbe contributed to the decomposition of the PANI com-ponent in the composites. Similar TGA features wereobserved for the other composites, and usually the com-posites with graphene component show better thermal
Figure 3. X-ray diffraction patterns of PANI-F, GO, GR, PAGO10,PAGO50, PAGO80, PAG10, PAG50, and PAG80.
(25) Liu, Z. H.; Wang, Z. M.; Yang, X.; Ooi, K. Langmuir 2002, 18,4926.
(26) Gao,W.; Alemany, L. B.; Ci, L.; Ajayan, P.M.Nat. Chem. 2009, 1,403–208.
(27) McAllister, M. J.; Li, J.-L.; Adamson, D. H.; Schniepp, H. C.;Abdala, A. A.; Liu, J.; Herrera-Alonso, M.; Milius, D. L.; Car, R.;Prud’homme, R. K.; Aksay, I. A. Chem. Mater. 2007, 19, 4396–4404.
1398 Chem. Mater., Vol. 22, No. 4, 2010 Zhang et al.
stability with less mass loss compared with the respectiveGO-based composites.3.3. Electrical Conductivity and Electronic Structure of
the Composites. The electrical conductivities (σ) of thePANI-F, GO, GR, and all composite materials weredetermined on pressed pellets from powder by using anAlessi four-probe resistivitymeasurement system, and theaverage conductivities are collected in Table 1. The GO
sample has a low conductivity of 0.2 S/m similar to thatreported in the literature.14 The PANI-F sample is con-ducting with the conductivity of 10.6 S/m. The GR
exhibits a much higher conductivity of 277.2 S/m whichis close to that of pristine graphite.17a As discussed above,the composites prepared by the in situ polymerizationhave a graphene-like layered structure with PANI nano-fibers intercalated between the layers or adsorbed on thesurface of the GO or GR sheets. The homogeneouslydistributed PANI fibers among GO or GR sheets wouldaffect greatly on the electrical properties of the compo-sites. The conductivity of PAGO10 is enhanced dramati-cally to 231.2 S/m compared with the pure PANI-F
sample. The conductivity of PAG10 (σ = 168.7 S/m)decreases a little bit in comparison to the PAGO10
probably due to the decrease of the doping degree ofPANI and the morphology change of the compositesduring the reduction, reoxidation, and reprotonationprocesses. Nevertheless, the electrical conductivities ofboth composites are much higher than thatof the pure PANI-F sample. Such enhancement of the
conductivity might be attributed to the π-π stackingbetween the PANI polymer backbone and the GO orGR sheets. With further increasing of the weight percen-tage of graphene oxide in the composites, the conducti-vities decrease due to the insulating effect of GO, forexample, thePAGO50 and PAGO80 show conductivitiesof 17.5 and 0.4 S/m, respectively. After reduction, reoxi-dation, and reprotonation, the conductivities of PAG50
(σ=22.8 S/m) and PAG80 (σ=143.0 S/m) increase dueto the recovery of graphene-like structure.To further understand the different conductivities ob-
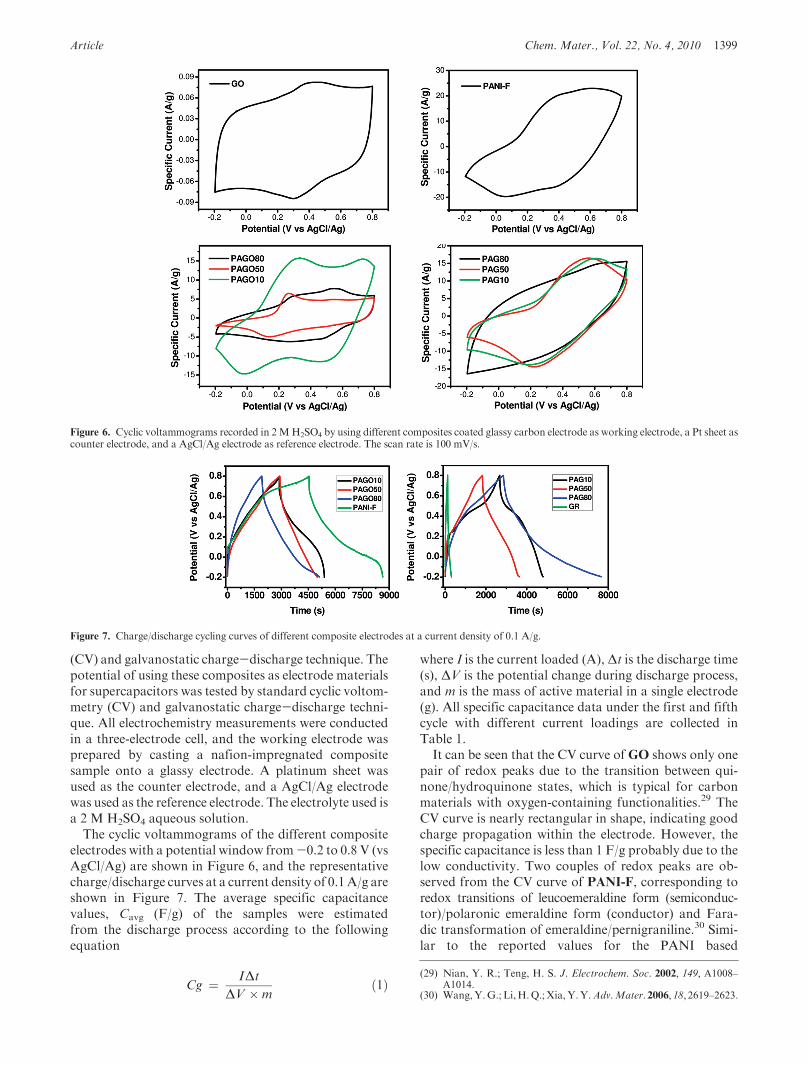
served in different composites, X-ray photoelectron spec-troscopy (XPS) was used to probe the different electronicstructures of the PANI in PAGO10 and PAG10. Asshown in Figure 5, the deconvolution of N 1s core-levelspectra results in three peaks correlated to three differentelectronic states: the benzenoid amine with binding en-ergy (BE) centered at 399.4 eV, the quinoid aminewithBEat 398.2 eV, and the nitrogen cationic radical (Nþ) withBE at 401 eV.28 It was found that the PANI in thePAGO10 has typical electronic structures of benzenoidamine and nitrogen cationic radical, but the reoxidizedand reprotonated PANI in the PAG10 presents all threetypes of amine structures with a decreased percentage ofthe nitrogen cationic radical and appearance of newquinoid amine structure. These data also indicate arelatively lower doping level of PANI in the PAG10 thanthat in the as-formed PANI after in situ polymerization.Such a difference may be due to the slow diffusion ofoxidant and acid to the reduced PANI during the reoxi-dation and reprotonation process. Anyway, the con-ductivities of these composites after reoxidation andreprotonation still stand at a high level which is essentialfor their electrical applications such as for supercapacitorelectrodes.3.4. SupercapacitorCharacterizations.The potential of
using these composites as electrode materials for super-capacitors was tested by standard cyclic voltommetry
Figure 4. TGA curves of GO, GR, PANI-F, PAGO80, and PAG80
(heating rate = 10 �C/min under a nitrogen atmosphere).
Table 1. List of the Conductivities of All Composites and the Specific
Capacitances (F/g) of the Composites at Different Current Loadings
Based on Discharge Branch in 2 M H2SO4
cycle 1st cycle 5th
samplesconductivity
(S/m) 0.1 A/g 0.5 A/g 1 A/g 0.1 A/g 0.5 A/g 1 A/g
PANI-F 10.6 420 145 140 280 140 130PAGO10 231.3 320 256 199 225 219 170PAGO50 15.5 207 147 130 195 147 130PAGO80 0.4 158 148 143 165 148 143GO 0.2 0.8 - - 0.8 - -PAG10 168.7 214 284 168 212 213 179PAG50 22.8 180 175 135 155 154 128PAG80 143.0 480 260 210 410 260 200GR 277.2 20 - - 20 - -
Figure 5. N 1s core-level X-ray photoelectron spectroscopy (XPS) ofcomposites PAGO10 and PAG10.
(28) Han, M. G.; Cho, S. K.; Oh, S. G.; Im, S. S. Synth.Met. 2002, 126,53–60.
Article Chem. Mater., Vol. 22, No. 4, 2010 1399
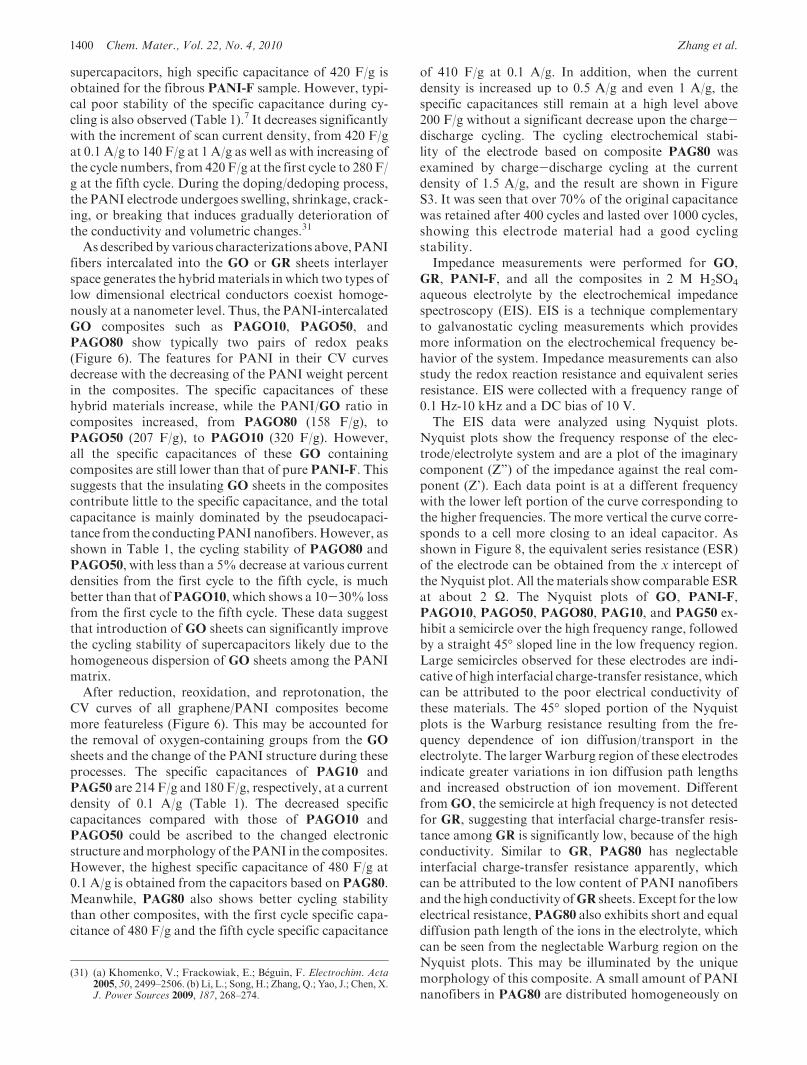
(CV) and galvanostatic charge-discharge technique. Thepotential of using these composites as electrode materialsfor supercapacitors was tested by standard cyclic voltom-metry (CV) and galvanostatic charge-discharge techni-que. All electrochemistry measurements were conductedin a three-electrode cell, and the working electrode wasprepared by casting a nafion-impregnated compositesample onto a glassy electrode. A platinum sheet wasused as the counter electrode, and a AgCl/Ag electrodewas used as the reference electrode. The electrolyte used isa 2 M H2SO4 aqueous solution.The cyclic voltammograms of the different composite
electrodes with a potential window from-0.2 to 0.8 V (vsAgCl/Ag) are shown in Figure 6, and the representativecharge/discharge curves at a current density of 0.1A/g areshown in Figure 7. The average specific capacitancevalues, Cavg (F/g) of the samples were estimatedfrom the discharge process according to the followingequation
Cg ¼ IΔt
ΔV �mð1Þ
where I is the current loaded (A), Δt is the discharge time(s), ΔV is the potential change during discharge process,and m is the mass of active material in a single electrode(g). All specific capacitance data under the first and fifthcycle with different current loadings are collected inTable 1.It can be seen that the CV curve ofGO shows only one
pair of redox peaks due to the transition between qui-none/hydroquinone states, which is typical for carbonmaterials with oxygen-containing functionalities.29 TheCV curve is nearly rectangular in shape, indicating goodcharge propagation within the electrode. However, thespecific capacitance is less than 1 F/g probably due to thelow conductivity. Two couples of redox peaks are ob-served from the CV curve of PANI-F, corresponding toredox transitions of leucoemeraldine form (semiconduc-tor)/polaronic emeraldine form (conductor) and Fara-dic transformation of emeraldine/pernigraniline.30 Simi-lar to the reported values for the PANI based
Figure 6. Cyclic voltammograms recorded in 2MH2SO4 by using different composites coated glassy carbon electrode as working electrode, a Pt sheet ascounter electrode, and a AgCl/Ag electrode as reference electrode. The scan rate is 100 mV/s.
Figure 7. Charge/discharge cycling curves of different composite electrodes at a current density of 0.1 A/g.
(29) Nian, Y. R.; Teng, H. S. J. Electrochem. Soc. 2002, 149, A1008–A1014.
(30) Wang,Y.G.; Li,H.Q.;Xia,Y.Y.Adv.Mater. 2006, 18, 2619–2623.
1400 Chem. Mater., Vol. 22, No. 4, 2010 Zhang et al.
supercapacitors, high specific capacitance of 420 F/g isobtained for the fibrous PANI-F sample. However, typi-cal poor stability of the specific capacitance during cy-cling is also observed (Table 1).7 It decreases significantlywith the increment of scan current density, from 420 F/gat 0.1 A/g to 140 F/g at 1 A/g as well as with increasing ofthe cycle numbers, from 420F/g at the first cycle to 280 F/g at the fifth cycle. During the doping/dedoping process,the PANI electrode undergoes swelling, shrinkage, crack-ing, or breaking that induces gradually deterioration ofthe conductivity and volumetric changes.31
As described by various characterizations above, PANIfibers intercalated into the GO or GR sheets interlayerspace generates the hybridmaterials in which two types oflow dimensional electrical conductors coexist homoge-nously at a nanometer level. Thus, the PANI-intercalatedGO composites such as PAGO10, PAGO50, andPAGO80 show typically two pairs of redox peaks(Figure 6). The features for PANI in their CV curvesdecrease with the decreasing of the PANI weight percentin the composites. The specific capacitances of thesehybrid materials increase, while the PANI/GO ratio incomposites increased, from PAGO80 (158 F/g), toPAGO50 (207 F/g), to PAGO10 (320 F/g). However,all the specific capacitances of these GO containingcomposites are still lower than that of pure PANI-F. Thissuggests that the insulating GO sheets in the compositescontribute little to the specific capacitance, and the totalcapacitance is mainly dominated by the pseudocapaci-tance from the conducting PANI nanofibers.However, asshown in Table 1, the cycling stability of PAGO80 andPAGO50, with less than a 5% decrease at various currentdensities from the first cycle to the fifth cycle, is muchbetter than that ofPAGO10, which shows a 10-30% lossfrom the first cycle to the fifth cycle. These data suggestthat introduction of GO sheets can significantly improvethe cycling stability of supercapacitors likely due to thehomogeneous dispersion of GO sheets among the PANImatrix.After reduction, reoxidation, and reprotonation, the
CV curves of all graphene/PANI composites becomemore featureless (Figure 6). This may be accounted forthe removal of oxygen-containing groups from the GO
sheets and the change of the PANI structure during theseprocesses. The specific capacitances of PAG10 andPAG50 are 214 F/g and 180 F/g, respectively, at a currentdensity of 0.1 A/g (Table 1). The decreased specificcapacitances compared with those of PAGO10 andPAGO50 could be ascribed to the changed electronicstructure andmorphology of the PANI in the composites.However, the highest specific capacitance of 480 F/g at0.1 A/g is obtained from the capacitors based on PAG80.Meanwhile, PAG80 also shows better cycling stabilitythan other composites, with the first cycle specific capa-citance of 480 F/g and the fifth cycle specific capacitance
of 410 F/g at 0.1 A/g. In addition, when the currentdensity is increased up to 0.5 A/g and even 1 A/g, thespecific capacitances still remain at a high level above200 F/g without a significant decrease upon the charge-discharge cycling. The cycling electrochemical stabi-lity of the electrode based on composite PAG80 wasexamined by charge-discharge cycling at the currentdensity of 1.5 A/g, and the result are shown in FigureS3. It was seen that over 70% of the original capacitancewas retained after 400 cycles and lasted over 1000 cycles,showing this electrode material had a good cyclingstability.Impedance measurements were performed for GO,
GR, PANI-F, and all the composites in 2 M H2SO4
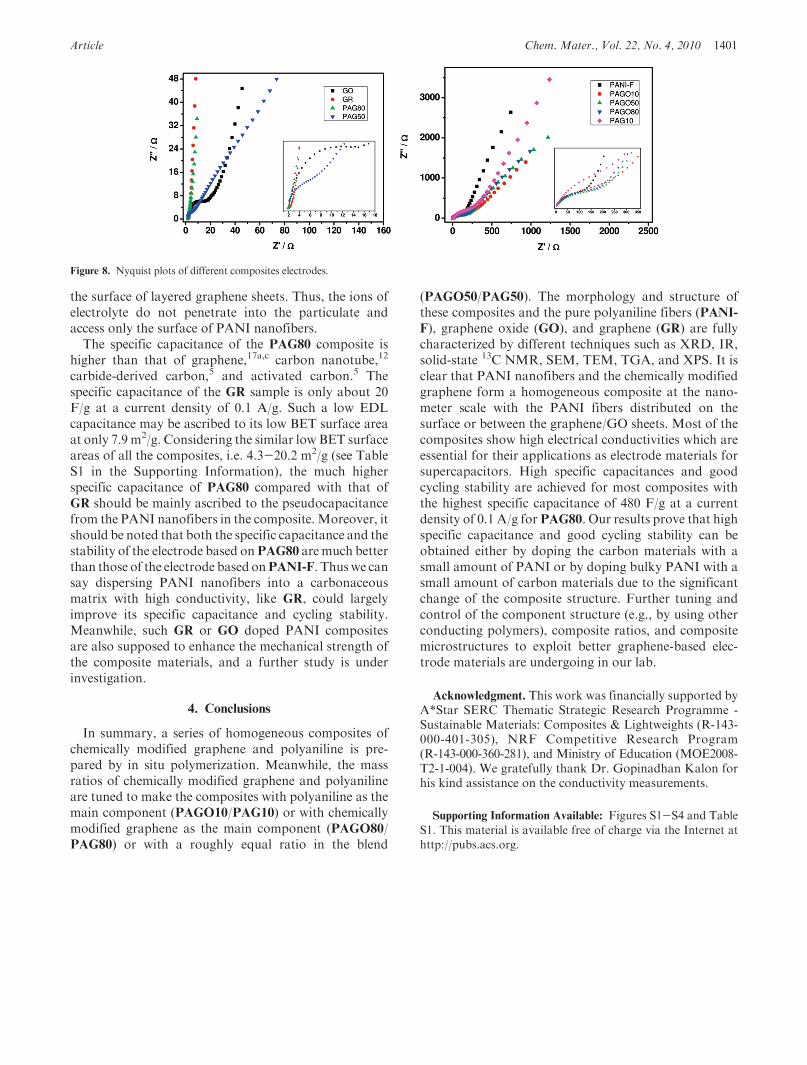
aqueous electrolyte by the electrochemical impedancespectroscopy (EIS). EIS is a technique complementaryto galvanostatic cycling measurements which providesmore information on the electrochemical frequency be-havior of the system. Impedance measurements can alsostudy the redox reaction resistance and equivalent seriesresistance. EIS were collected with a frequency range of0.1 Hz-10 kHz and a DC bias of 10 V.The EIS data were analyzed using Nyquist plots.
Nyquist plots show the frequency response of the elec-trode/electrolyte system and are a plot of the imaginarycomponent (Z”) of the impedance against the real com-ponent (Z’). Each data point is at a different frequencywith the lower left portion of the curve corresponding tothe higher frequencies. The more vertical the curve corre-sponds to a cell more closing to an ideal capacitor. Asshown in Figure 8, the equivalent series resistance (ESR)of the electrode can be obtained from the x intercept ofthe Nyquist plot. All the materials show comparable ESRat about 2 Ω. The Nyquist plots of GO, PANI-F,PAGO10, PAGO50, PAGO80, PAG10, and PAG50 ex-hibit a semicircle over the high frequency range, followedby a straight 45� sloped line in the low frequency region.Large semicircles observed for these electrodes are indi-cative of high interfacial charge-transfer resistance, whichcan be attributed to the poor electrical conductivity ofthese materials. The 45� sloped portion of the Nyquistplots is the Warburg resistance resulting from the fre-quency dependence of ion diffusion/transport in theelectrolyte. The largerWarburg region of these electrodesindicate greater variations in ion diffusion path lengthsand increased obstruction of ion movement. DifferentfromGO, the semicircle at high frequency is not detectedfor GR, suggesting that interfacial charge-transfer resis-tance among GR is significantly low, because of the highconductivity. Similar to GR, PAG80 has neglectableinterfacial charge-transfer resistance apparently, whichcan be attributed to the low content of PANI nanofibersand the high conductivity ofGR sheets. Except for the lowelectrical resistance, PAG80 also exhibits short and equaldiffusion path length of the ions in the electrolyte, whichcan be seen from the neglectable Warburg region on theNyquist plots. This may be illuminated by the uniquemorphology of this composite. A small amount of PANInanofibers in PAG80 are distributed homogeneously on
(31) (a) Khomenko, V.; Frackowiak, E.; B�eguin, F. Electrochim. Acta2005, 50, 2499–2506. (b) Li, L.; Song, H.; Zhang, Q.; Yao, J.; Chen, X.J. Power Sources 2009, 187, 268–274.
Article Chem. Mater., Vol. 22, No. 4, 2010 1401
the surface of layered graphene sheets. Thus, the ions ofelectrolyte do not penetrate into the particulate andaccess only the surface of PANI nanofibers.The specific capacitance of the PAG80 composite is
higher than that of graphene,17a,c carbon nanotube,12
carbide-derived carbon,5 and activated carbon.5 Thespecific capacitance of the GR sample is only about 20F/g at a current density of 0.1 A/g. Such a low EDLcapacitance may be ascribed to its low BET surface areaat only 7.9 m2/g. Considering the similar low BET surfaceareas of all the composites, i.e. 4.3-20.2 m2/g (see TableS1 in the Supporting Information), the much higherspecific capacitance of PAG80 compared with that ofGR should be mainly ascribed to the pseudocapacitancefrom the PANI nanofibers in the composite. Moreover, itshould be noted that both the specific capacitance and thestability of the electrode based onPAG80 aremuch betterthan those of the electrode based onPANI-F. Thuswe cansay dispersing PANI nanofibers into a carbonaceousmatrix with high conductivity, like GR, could largelyimprove its specific capacitance and cycling stability.Meanwhile, such GR or GO doped PANI compositesare also supposed to enhance the mechanical strength ofthe composite materials, and a further study is underinvestigation.
4. Conclusions
In summary, a series of homogeneous composites ofchemically modified graphene and polyaniline is pre-pared by in situ polymerization. Meanwhile, the massratios of chemically modified graphene and polyanilineare tuned to make the composites with polyaniline as themain component (PAGO10/PAG10) or with chemicallymodified graphene as the main component (PAGO80/PAG80) or with a roughly equal ratio in the blend
(PAGO50/PAG50). The morphology and structure ofthese composites and the pure polyaniline fibers (PANI-
F), graphene oxide (GO), and graphene (GR) are fullycharacterized by different techniques such as XRD, IR,solid-state 13C NMR, SEM, TEM, TGA, and XPS. It isclear that PANI nanofibers and the chemically modifiedgraphene form a homogeneous composite at the nano-meter scale with the PANI fibers distributed on thesurface or between the graphene/GO sheets. Most of thecomposites show high electrical conductivities which areessential for their applications as electrode materials forsupercapacitors. High specific capacitances and goodcycling stability are achieved for most composites withthe highest specific capacitance of 480 F/g at a currentdensity of 0.1 A/g for PAG80. Our results prove that highspecific capacitance and good cycling stability can beobtained either by doping the carbon materials with asmall amount of PANI or by doping bulky PANI with asmall amount of carbon materials due to the significantchange of the composite structure. Further tuning andcontrol of the component structure (e.g., by using otherconducting polymers), composite ratios, and compositemicrostructures to exploit better graphene-based elec-trode materials are undergoing in our lab.
Acknowledgment. This work was financially supported byA*Star SERC Thematic Strategic Research Programme -Sustainable Materials: Composites & Lightweights (R-143-000-401-305), NRF Competitive Research Program(R-143-000-360-281), and Ministry of Education (MOE2008-T2-1-004). We gratefully thank Dr. Gopinadhan Kalon forhis kind assistance on the conductivity measurements.
Supporting Information Available: Figures S1-S4 and Table
S1. This material is available free of charge via the Internet at
http://pubs.acs.org.
Figure 8. Nyquist plots of different composites electrodes.