7.8.2 Main Criteria for Selection of Disinfection...
50
For small and medium-size water-recycling works (<50,000 p.e.), chlor- ination and UV irradiation are more competitive than ozonation, with average total annualized cost of about US$ 2.2–8 cents/m 3 . The cost difference between UV and ozone decreases with plant size. The competitiveness of ozonation appears clear for large recycling plants (>100,000p.e.), where total costs are in the typical range of US$ 0.8–2.5 cents/m 3 , and in some cases could be less than UV irradiation. Given that ozone also improves the visual aspect of the recycled water and sometimes lessens its odor, this process should be considered as a viable option for large plants. The costs of membrane filtration (MF and UF) are significantly higher compared to the other disinfection processes and typically reach US$ 0.40–0.70/m 3 for plant capacity of 20,000–500,000 p.e. The cost difference decreases when compared with combined sand filtration and UV or ozone disinfection. In all cases, recycled water quality is significantly higher, as well as operational reliability, which is often the decisive criteria for the choice of treatment train for some urban applications for unrestricted landscape irrigation. The high cost of membranes is also the main constraint for the widespread application of membrane bioreactors (MBRs), despite all the process advantages. Compared to activated sludge, the overall costs remain up to 20% and 50% higher than activated sludge, depending on plant size. Reported MBR costs typically vary from US$ 0.095 to 0.20/m 3 for treatment plant size up to 50,000 p.e. The operating costs are about 45–50% of the total annual costs for UV irradiation and increase up to 50–70% for chlorination and ozonation, respectively, for small to large water-recycling plants. Operation and maintenance costs incurred by chlorination and ozonation are primarily those associated with chemical costs. Operating costs for UV systems consist mostly of lamp replacement and cleaning. Energy costs are about 2–5% of the operating costs for chlorination. Energy costs for UV irradiation and ozonation are between 15 and 35% respectively, depending on plant size. Higher reagent costs are characteristic for chlorination—up to 60% of the operating costs. 7.8.2 Main Criteria for Selection of Disinfection Process The choice of a given disinfection process is generally driven by several criteria, such as regulatory requirements, cost-effectiveness, safety, practicality, environmental impact, and public health-related issues (Table 7.18). Systematic procedures cannot be used to ease the choice, because site-specific constraints prevail in many cases (permit or safety regulations, existing treatment chain, etc.). However, some general trends, advantages, and disadvantages can provide helpful guidelines for disinfection-process selection. A good definition of the appropriate criteria for process selection is especially important nowadays, when new indicators or pathogens other than bacteria 228 Water Reuse for Irrigation: Agriculture, Landscapes, and Turfgrass
Transcript of 7.8.2 Main Criteria for Selection of Disinfection...
For small and medium-size water-recycling works (<50,000 p.e.), chlor-
ination and UV irradiation are more competitive than ozonation, with average
total annualized cost of about US$ 2.2–8 cents/m3. The cost difference between
UV and ozone decreases with plant size. The competitiveness of ozonation
appears clear for large recycling plants (>100,000 p.e.), where total costs are in
the typical range of US$ 0.8–2.5 cents/m3, and in some cases could be less than
UV irradiation. Given that ozone also improves the visual aspect of the
recycled water and sometimes lessens its odor, this process should be
considered as a viable option for large plants.The costs of membrane filtration (MF and UF) are significantly higher
compared to the other disinfection processes and typically reach US$
0.40–0.70/m3 for plant capacity of 20,000–500,000 p.e. The cost difference
decreases when compared with combined sand filtration and UV or ozone
disinfection. In all cases, recycled water quality is significantly higher, as well as
operational reliability, which is often the decisive criteria for the choice of
treatment train for some urban applications for unrestricted landscape
irrigation.The high cost of membranes is also the main constraint for the widespread
application of membrane bioreactors (MBRs), despite all the process
advantages. Compared to activated sludge, the overall costs remain up to
20% and 50% higher than activated sludge, depending on plant size. Reported
MBR costs typically vary from US$ 0.095 to 0.20/m3 for treatment plant size
up to 50,000 p.e.The operating costs are about 45–50% of the total annual costs for UV
irradiation and increase up to 50–70% for chlorination and ozonation,
respectively, for small to large water-recycling plants. Operation and
maintenance costs incurred by chlorination and ozonation are primarily
those associated with chemical costs. Operating costs for UV systems consist
mostly of lamp replacement and cleaning. Energy costs are about 2–5% of the
operating costs for chlorination. Energy costs for UV irradiation and
ozonation are between 15 and 35% respectively, depending on plant size.
Higher reagent costs are characteristic for chlorination—up to 60% of the
operating costs.
7.8.2 Main Criteria for Selection of Disinfection Process
The choice of a given disinfection process is generally driven by several criteria,
such as regulatory requirements, cost-effectiveness, safety, practicality,
environmental impact, and public health-related issues (Table 7.18).
Systematic procedures cannot be used to ease the choice, because site-specific
constraints prevail in many cases (permit or safety regulations, existing
treatment chain, etc.). However, some general trends, advantages, and
disadvantages can provide helpful guidelines for disinfection-process selection.
A good definition of the appropriate criteria for process selection is especially
important nowadays, when new indicators or pathogens other than bacteria
228 Water Reuse for Irrigation: Agriculture, Landscapes, and Turfgrass

Tab
le7
.18
Cri
teri
afo
rC
ho
ice
of
Dis
infe
ctio
nT
ech
no
logy
Ch
arac
teri
stic
s/
Cri
teri
aC
hlo
rin
atio
nU
VO
zon
eU
F/M
FM
BR
Mat
ura
tio
n
po
nd
s
Sizeofplant
Allsizes
Smallto
medium
Medium
tolarge
Smallto
medium
Smallto
medium
Small
Pretreatm
ent
level
Alllevels
Secondary
Atleast
primary,
inpreference
secondary
Secondary
Primary
Secondary
Reliability
Good
Good
Good
Verygood
Verygood
Fairto
good
Relative
complexity
Sim
ple
to
moderate
Sim
ple
to
moderate
Complex
Complex
Moderate
to
complex
Sim
ple
Safety
concerns
Yes
No
Yes
No
No
No
Transportation
onsite
Substantial
Minim
al
Minim
al
Minim
al
Minim
al
No
Bacteria
removal
Good
Good
Good
Verygood
Verygood
Poorto
good
Virusremoval
Poor
Good
Verygood
Verygood
Verygood
Poorto
good
Protozoaand
cyst
removal
Poor
Good
Good
Verygood
Verygood
Good
Residualtoxicity
(fishes)
Toxic
Nontoxic
Noneexpected
None
None
None (Continued
)
Wastewater Treatment for Water Recycling 229
Tab
le7
.18
Co
nti
nu
ed
Ch
arac
teri
stic
s/
Cri
teri
aC
hlo
rin
atio
nU
VO
zon
eU
F/M
FM
BR
Mat
ura
tio
n
po
nd
s
Bacteria
regrowth
Low
Moderate
Low
None
None
Possible
‘‘wild’’
contamination
Hazardous
by-products
Yes
No
No;yes
insome
conditions
No
No
No
Persistantresidue
Long
None
None
None
None
None
Contributes
dissolved
oxygen
No
No
Yes
No
No
No
ReactswithNH
4Yes
No
No
No
No
No
Colorremoval
No
No
Yes
Low
effect
expected
Low
effect
expected
No
Algalgrowth
No
No
No
No
No
Substantial
Increased
dissolved
solids
Yes
No
No
No
No
No
pH-dependent
Yes
No
SlightathighpH
No
No
Yes
O&M
sensitive
Minim
al
Moderate
High
High
High
Minim
al
Corrosiveeffect
Yes
No
Yes
No
No
No
O&M
costs
Low
Low
Moderate
High
High
Verylow
Investm
entcosts
Moderate
Moderate
High
Veryhigh
High
Low
tomoderate
230 Water Reuse for Irrigation: Agriculture, Landscapes, and Turfgrass

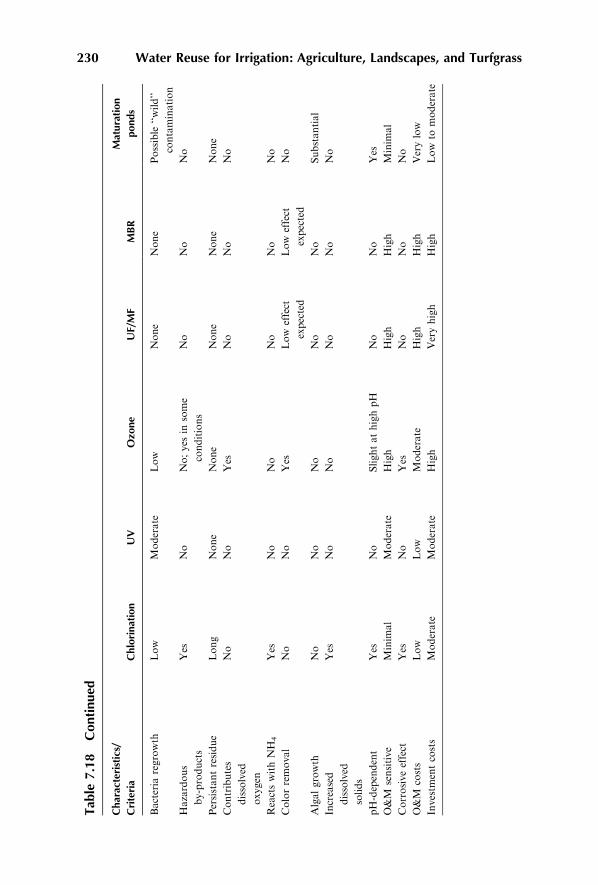
are often issued in wastewater discharge and reuse permits (enteroviruses,E. coli, Giardia, Cryptosporidium, etc.).
Chlorination has proved to be a reliable means of removing bacteria andrespecting conventional permits for disinfection of primary, secondary, andtertiary effluents. However, toxic by-products may present a risk to publichealth. In most cases, the presence of residual chlorine represents a threatto the environment (discharge in water streams, groundwater recharge), anddechlorination must be implemented, increasing disinfection costs. Also, theeffectiveness of chlorine on some viruses is questionable. Protozoa are notaffected by the commonly applied chlorine doses and residence times.Chlorination is not longer authorized for wastewater disinfection in Franceor the United Kingdom.
The reliability of UV disinfection is also well established for disinfection ofsecondary and tertiary effluents. Its main advantage over chlorination is theabsence of toxicity and by-product formation and comparable costs.Moreover, UV systems require no specific safety control or equipment.These advantages make UV irradiation particularly suitable for wastewaterdisinfection and various reuse applications, including unrestricted irrigation.
With slightly higher costs, ozonation may be recommended for large plantswhen viruses and/or protozoan parasites are targeted. This might becomeincreasingly the case because of the increasing concern about some epidemicmicroorganisms such as viruses and Giardia and Cryptosporidium, in particularfor unrestricted landscape irrigation or irrigation of crops eaten uncooked.Ozone also removes odor and color, which would be desirable for some reuseapplications. Recent studies reported high efficiency of ozonation for theoxidation of some emerging organic pollutants such as endocrine disruptorsand pharmaceutical products that are of increasing concern in new regulations.Ozonation also leads to an increase in bulk oxygen concentration, as well as toan enhancement of the biodegradability of residual organic matter. After itsfirst contact with the effluent, the carrier gas can be recycled to the activatedsludge to reduce secondary treatment size requirements.
UV and ozone are both considered as safe processes, but safety measureswith UV are more straightforward. The maintenance of an ozone systemusually requires more skill than a UV system. Finally, most studies show thatUV and ozone will not increase effluent toxicity.
Membrane filtration is a highly efficient process for wastewater disinfec-tion. The excellent water quality of the effluent makes it appropriate forunrestricted landscape irrigation. Its main disadvantage is still relatively highcost, but it is the only technology that guarantees reliability, absence oftoxicity, and almost complete disinfection.
REFERENCES
1. Lazarova, V., Role of water reuse in enhancing integrated water resource
management, Final Report of the EU project CatchWater, EU Commission, 2001.
Wastewater Treatment for Water Recycling 231
2. Metcalf & Eddy, Wastewater Engineering: Treatment and Reuse, 4rd ed., Mc-Graw-Hill Inc., New York, 2003.
3. Petty grove, S.G., and Asano, T., Irrigation with Reclaimed Municipal Wastewater—A Guidance Manual, Lewis Publishers Inc., Chelsea, 1985.
4. Metcalf & Eddy, Wastewater Engineering. Treatment, Disposal, Reuse, 3rd ed.,
Mc-Graw-Hill Inc., New York, 1991.5. WEF Manual of Practices 8, Design of Municipal Wastewater Treatment Plants, 4th
ed., ASCEManuals and Reports on Engineering Practices N�76, WEF, Alexandria,
1998.6. Degremont, Memento Technique de l’Eau, Degremont, Paris, 1989.7. Lazarova, V., et al., Production of high quality water for reuse purposes: the West
Basin experience, Water Supply, 3, 3, 167, 2003.
8. Lazarova, V., and Manem, J., Innovative biofilm treatment technologies for waterand wastewater treatment, in Biofilms II: Process Analysis and Applications, Bryers,J.D., ed., New York, Wiley-Liss Inc., 2000, 159.
9. Lazarova, V., Perera, J., Bowen, M., and Sheilds, P., Application of aeratedbiofilters for production of high quality water for industrial water reuse inWest Basin, Wat. Sci. Techn., 41, 4/5, 417–424, 2000.
10. Lazarova, V., Guidelines for irrigation with recycled water, Internal Report Suez-Environment-CIRSEE, France, 2003.
11. Berland et al., Procedes extensifs d’epuration des eaux usees, adaptes aux petites et
moyennes collectivites (500-1500 eq-hab), Guide, Office International de l’Eau,Office des publications officielles desCommunautes europeennes,Luxembourg, 2001.
12. WHO, World Health Organization, Health Guidelines for the Use of Wastewater inAgriculture and Aquaculture, Report of a WHO Scientific Group, Technical Report
Series 778, World Health Organization, Geneva, Switzerland, 1989.13. WEFManual of Practices 11, Operation of Municipal Wastewater Treatment Plants,
Technical Practice Committee Control Group, WEF, Alexandria, 1990.
14. Lazarova, V., Levine, B., and Renaud, P., Wastewater reclamation in Africa:assessment of the reuse applications and available technologies, in Actes IXeme
Congres de l’Union Africaine des Distributeurs d’Eau, Casablanca, February 16–20,
1998.15. Aguilera, G.S., Audic, J.M., and Geneys, C., Rhizopur: a green solution for the
treatment of wastewaters of small communities, in Proc. 9th International IWASpecialist Group Conference on Wetlands Systems, Avignon, France, September
27–30, 2004.16. Brissaud, F., and Lesavre, J., Infiltration percolation in France: 10 years experience,
Wat. Sci. Techn., 28, 10, 73–81, 1993.
17. Icekson-Tal, N., Abraham, O., Sack, J., and Cikurel, H., Water reuse in Israel–theDan Region Project: evaluation of water quality and reliability of plant’s operation,Wat. Sci. Techn.: Water Supply, 3, 4, 231–237, 2003.
18. Idelovitch, E., Icekson-Tal, N., Abraham, O., and Michall, M., The long-termperformance of soil aquifer treatment (SAT) for effluent reuse, Wat. Sci. Techn.:Water Supply, 3, 4, 239–246, 2003.
19. Lazarova, V., Wastewater disinfection: assessment of the available technologies forwater reclamation, in Water Conservation Vol. 3. Water Management, Purificationand Conservation in Arid Climates, Goosen, M.F.A. and Shayya, W.H., eds.,Technomic Publishing Co. Inc., 2000, 171.
20. Connell, G.F., The Chlorination Dechlorination Handbook, 2002. WaterEnvironment Federation (WEF), Alexandria, VA, 2002.
232 Water Reuse for Irrigation: Agriculture, Landscapes, and Turfgrass

21. USEPA, Guidelines for Water Reuse, manual, EPA (United States EnvironmentalProtection Agency) & USAID (United States Agency for International
Development), Cincinnati, OH, 1992.22. State of California, Water recycling criteria, California Code of Regulations, Title
22, Division 4, Chapter 3, California Department of Health Services, Sacramento,
CA, 2000.23. King, C.H., Shotts, E.B., Wooley, R.E., and Porter, K.G., Survival of coliforms
and bacterial pathogens within protozoa during chlorination. Appl. Environ.
Microbiol., 54, 12, 3023–3033, 1988.24. Venczel, L.V., Arrowood, M., Hurd, M., and Sobsey, M.D., Inactivation of
Cryptosporidium parvum oocysts and Clostridium perfringens spores by a mixed-oxidant disinfectant and by free chlorine, Appl. Environ. Microbiol., 63, 4,
1598–1601, 1997.25. Abarnou, A., and Miossec, L., Chlorinated waters discharged to the marine
environment chemistry and environmental impact. An overview, Sci. Total
Environ., 126, 173–197, 1992.26. Szal, G.M., Nola, P.M., Kennedy, L.E., Barr, C.P., and Bilger, M.D., The toxicity
of chlorinated wastewater: instream and laboratory case studies, Res. J. WPCF, 63,
6, 910–920, 1991.27. Heltz, G.R., and Nweke, A.C., Incompleteness of wastewater dechlorination,
Environ. Sci. Tech., 29, 4, 1018–1022, 1995.
28. Huang, J.L., Wang, L., Ren, N.Q., Liu, X.L., Sun, R.F., and Yang, G.L.,Disinfection effects of chlorine dioxide on viruses, algae and animal planktons inwater, Wat. Res., 31, 3, 455–460, 1997.
29. Junli, H., Li, W., Nenqi, L., Li, L.X., Fun, S.R., and Guanle, Y., Disinfection effect
of chlorine dioxide on viruses, algae and animal planktons in water, Wat. Res., 31,3, 455–460, 1997.
30. Savoye, P., Janex, M.L., and Lazarova, V., Wastewater disinfection by low-pressure
UV and ozone: a design approach based on water quality, Wat. Sci. Techn., 43,10, 163–171, 2001.
31. Lazarova, V., Savoye, P., Janex, M.L., Blatchley, III, E.R., and Pommepuy, M.,
Advanced wastewater disinfection technonogies: state of the art and perspective,Wat. Sci. Techn., 40, 4/5, 203, 1999.
32. National Water Research Institute, NWRI and American Water WorksAssociation Research Foundation, AWWARF, Ultraviolet Disinfection
Guidelines for Drinking Water and Water Reuse, NWRI-00-03, Fountain Valley,CA, 2000.
33. Lazarova, V., et al., Wastewater disinfection by UV: evaluation of the MS2 phages
as a biodosimeter for plant design, in Proc. WaterReuse Asssos. Symposium XV,Sept 12–15, Napa, CA, 2000.
34. United States Environment Protection Agency (USEPA), Ultraviolet Disinfection
Guidance Manual, United States Environment Protection Agency, Office of Water(4601), EPA 815-D-03-007, Draft, Washington DC, June 2003.
35. Darby, J., Emerick, R., Loge, F., and Tchobanoglous, G., Effect of Upstream
Treatment Processes on UV Disinfection Performance, Water EnvironmentResearch Foundation (WERF), Alexandria, VA, 1999.
36. Savoye, P., et al., Evaluation of UV disinfection for wastewater recycling at WestBasin, California: technical and sanitary aspects, in Proc.73rd Annual Conference &
Exposition on Water Quality and Wastewater Treatment, WEFTEC 2000, Anaheim,CA, October, 10–14, 2000, Session 15.
Wastewater Treatment for Water Recycling 233

37. Lazarova, V., and Savoye, Ph., Guidelines for UV Wastewater Disinfection, InternalReport Suez Environment—CIRSEE, 2004.
38. Lazarova, V., Technical and economic evaluation of UV and ozone for wastewaterdisinfection, in Proc. IWSA World Water Congress, Symp. IWA/AIDIS, Reuse oftreated sewage effluents, September 18, Buenos Aires, 1999.
39. Xu, P., Janex, M.L., Savoye, P., Cockx, A., and Lazarova, V., Wastewaterdisinfection by ozone: main parameters for process design, Wat. Res., 36, 4,1043–1055, 2002.
40. Gottberg, A., and Vaccaro, G., Kuwait’s giant membrane plant starts to take shape,Desalin. Wat. Reuse, 13, 2, 30, 2003.
41. Manem, J., and Sanderson, R., Membrane bioreactors, in Water TreatmentMembrane Processes, Mallevialle J., Odendaal P., and Wiesner M.R., eds.,
McGraw-Hill, New York, 1996, chapter 17.42. Stephenson, T., Judd, S., Jefferson, B., and Brindle, K., Membrane Bioreactors for
Wastewater Treatment, IWA Publishing, London, 2000.
43. Wallis-Lage, C., MBR systems: similarities and differences between manufacturers,in Proc.WEFTEC, Los Angeles, CA, WEF, 2003.
44. Foussereau, X., Roderick, P., and Sudhanva, P., The current status of the use
of membranes for wastewater treatment, in Proc. WEFTEC, Los Angeles, CA,WEF, 2003.
45. Thompson, D., Clinghab, P., Scheinder, C., and Thibault, N., Municipal membrane
biorector in the Northeast, in Proc. WEFTEC, Los Angeles, CA, WEF, 2003.46. Sethi, S., Juby, G., Schuler, P., and Holmes, L., Evaluation of MF for microbial
removal in reuse applications: performance assessment from three pilot studies, inProc. AWWA Annual Conf., Nashville, TN, AWWA, 2001.
47. Juanico, M., Process design and operation, in Reservoirs for Wastewater Storageand Reuse, Juanico, M. and Dor, I., eds., Springer, New York, 2002.
48. Indelicato, S., Barbagallo, S., and Cirelli, G., Change in wastewater quality during
seasonal storage, in Proc. Conf. Natural and Constructed Wetlands WastewaterTreatment and Reuse, Perugia, Italy, 195, 1995.
49. Juanico, M., The performance of batch stabilization reservoirs for wastewater
treatment, storage and reuse in Israel, Wat. Res., 33, 10, 149, 1996.50. Juanico, M., and Shelef, G., The performance of stabilization reservoirs as a
function of design and operation parameters, Wat. Sci. Techn., 23, 7, 1991.51. Liran, A., Juanico, M., and Shelef, G., Bacterial removal in a stabilization reservoir
for wastewater irrigation in Israel, Wat. Res., 28, 6, 1305, 1994.52. Miller, G., et al., Impact of surface storage on reclaimed water: seasonal and long
term, Report 99-PUM-4, Water Environment Research Foundation, Alexandria,
VA, and IWA Publishing, London, 2003.
234 Water Reuse for Irrigation: Agriculture, Landscapes, and Turfgrass

8Adverse Effects of Sewage
Irrigation on Plants, Crops,
Soil, and Groundwater
Herman Bouwer
CONTENTS
8.1 Toward a healthy environment and sustainable development .. .. . . . . 236
8.2 Compounds with potential adverse effects on recycledwater for irrigation..... . . . . . . . . . . . . . . . . . . . . . . . . . . . . . . . . . . . . . . . . . . . . . . . . . . . . . . 237
8.3 Behavior of some compounds during irrigation withsewage effluent.... . . . . . . . . . . . . . . . . . . . . . . . . . . . . . . . . . . . . . . . . . . . . . . . . . . . . . . . . . . . . 2388.3.1 Salt and water relations in irrigation soils .. . . . . . . . . . . . . . . . . . . . . 2398.3.2 Behavior and potential adverse effects of nutrients in
irrigation soils . .. . . . . . . . . . . . . . . . . . . . . . . . . . . . . . . . . . . . . . . . . . . . . . . . . . . . . 2448.3.3 Effects of disinfection by-products on groundwater .... . . . . . . 2478.3.4 Effects of pharmaceuticals and other organic
contaminants... . . . . . . . . . . . . . . . . . . . . . . . . . . . . . . . . . . . . . . . . . . . . . . . . . . . . . . 248
8.4 Salt and groundwater water-table management for sustainableirrigation ... .. . . . . . . . . . . . . . . . . . . . . . . . . . . . . . . . . . . . . . . . . . . . . . . . . . . . . . . . . . . . . . . . . . . 2538.4.1 Salt loadings ... . . . . . . . . . . . . . . . . . . . . . . . . . . . . . . . . . . . . . . . . . . . . . . . . . . . . . . 2548.4.2 Salt tolerance of plants... . . . . . . . . . . . . . . . . . . . . . . . . . . . . . . . . . . . . . . . . . . 2558.4.3 Management of salty water .. .. . . . . . . . . . . . . . . . . . . . . . . . . . . . . . . . . . . . 2568.4.4 Future aspects for salinity management in
south-central Arizona .... . . . . . . . . . . . . . . . . . . . . . . . . . . . . . . . . . . . . . . . . . . 259
References .... . . . . . . . . . . . . . . . . . . . . . . . . . . . . . . . . . . . . . . . . . . . . . . . . . . . . . . . . . . . . . . . . . . . . . . . 260
1-56670-649-1/05/$0.00+$1.50� 2005 by CRC Press 235

8.1 TOWARD A HEALTHY ENVIRONMENT AND SUSTAINABLEDEVELOPMENT
There was a time when human and other wastes were simply thrown out ofthe window. The only environmental concern then was a direct hit on thepeople in the street. Thus, as a courtesy to passers-by, the thrower would yell‘‘gardez l’eau’’ (watch out for the water). This term was anglicized to gardyloo,which is the name of a British ship used for ocean dumping of municipalsludge. From the streets, the waste could readily run into streams or othersurface water, along with raw wastewater from the early sewers. The discoverythat sewage contamination of drinking water was the main cause of outbreaksof diseases such as dysentery, cholera, and typhoid made it necessary to keepwastewater out of surface water, since adequate treatment and disinfectiontechnology for drinking water had not yet been developed. This led to theestablishment of ‘‘sewage farms’’ around many cities. Applying sewage toland rather than discharging it into surface water was an early form of zerodischarge.
In the early part of the previous century, disinfection of drinking waterby chlorination was discovered and put into use. This allowed the discharge ofsewage into surface water to be resumed because now the surface water couldbe treated and disinfected for drinking, and microbiological contamination wasno longer a health problem.
As a result, the average human life expectancy increased dramatically.Also, the cities were growing and needed the sewage farms around them formore streets and houses. As the sewage farms disappeared, better sewage-treatment processes were developed and applied, primarily to prevent undueoxygen ‘‘sags’’ in the streams and to not exceed the ‘‘assimilative’’ and ‘‘self-purification’’ power of the receiving water. Removal of biochemical oxygendemand (BOD) and suspended solids (SS) were the main objectives. Thencame the era of ‘‘better living through chemistry,’’ causing more and morechemicals to enter sewage through discharges from households, industries,hospitals, etc.
This era was followed by increasing environmental awareness and arealization that pollution of surface water should be drastically minimized oravoided. Now environmental concerns are calling for increasingly stringentstandards for discharging sewage or other wastewater into surface water toprevent eutrophication and to protect aquatic life, recreational areas, andwater reuse opportunities. For example, the U.S. Clean Water Act of 19721
called for the elimination of all pollutant discharges into the nation’s waters.Until recently this law was not strongly enforced, but that is changingnow with the introduction of the total maximum daily load (TMDL)principle, which also applies to nonpoint (watershed) sources of surfacewater pollution.2
The trend towards more stringent regulations will undoubtedly continueuntil wastewater treatment becomes so expensive that municipalities may wantto stop discharging their sewage effluent into the surface water and use it
236 Water Reuse for Irrigation: Agriculture, Landscapes, and Turfgrass

themselves. When that happens, we will have come full circle to zero discharge.Reuse and zero discharge of wastewater are the ultimate forms of preventionof point-source pollution of surface water. Combined with stricter regulationson non–point-source pollution, such as watershed runoff, this should maintaindrinkable, swimmable, fishable, and optimum recreational conditions in ourrivers and streams.
8.2 COMPOUNDS WITH POTENTIAL ADVERSE EFFECTS ONRECYCLED WATER FOR IRRIGATION
In principle, sewage effluent or other wastewater can be used for any purpose,provided it is treated to meet the quality requirements of the intended use.As mentioned in Chapter 1, due to treatment costs and economic feasibility,wastewater will most commonly be used for nonpotable purposes that do notrequire water of a very high quality, as does drinking water. These nonpotablepurposes include industrial use (power plant cooling, processing, construction,aggregate washing, dust control, etc.) and agricultural and urban irrigation.
Since sewage treatment for irrigation use is primarily aimed at removingpathogens (primary and secondary treatment followed by granular mediafiltration and/or disinfection), the effluent may still contain a wide varietyof other chemicals that can have adverse effects on plants and groundwaterquality and its use for drinking and irrigation. This concern is especially acutefor efficient irrigation in dry climates, where chemical concentrations in thedrainage water or deep-percolation can be many times those in the wastewateritself (typically by factors of 2–10, depending on rainfall and irrigationefficiency).
The chemicals of concern include salts, pesticide residues, nitrogen (mostlyas nitrates in the drainage water), disinfection by-products, pharmaceuticallyactive chemicals, other chemicals, and precursors of disinfection by-products,like humic substances and other dissolved organic matter, that form a newgroup of disinfection by-products when the groundwater is pumped up againand chlorinated or otherwise disinfected for drinking.
Most domestic effluents meet the normal chemical requirements for cropirrigation. Industrial discharges into the sewer system can cause excessivelyhigh concentrations of heavy metals and other trace elements.
In the case of irrigation, the most important factor in terms of potentialagronomic adverse effects is salinity. All natural waters contain some salt,which is expressed as total dissolved solids (TDS). Rainfall and otheratmospheric precipitation have the lowest TDS content, averaging about10mg/L.3 Surface waters in streams and lakes have higher TDS contentsbecause the water has been in contact with soil and rocks, from which itpicks up dissolved minerals and other constituents. Also, water evaporatesfrom the watershed, which increases TDS in the remaining water. TDS con-tents of surface water typically are on the order of a few tens to a few hundredmg/L. As mentioned in Chapter 2, urban uses add about 300� 100mg/L
Adverse Effects of Sewage Irrigation 237

of dissolved salts. This is due to the addition of salts and other chemicalsin homes and industries and the removal of distilled or very pure water byevaporation (evaporative coolers or cooling towers) or membrane filtration(reverse osmosis) by industries needing ultra-pure water and putting the rejectbrine into the sewers. If all the reject brines are returned to the sewer and allthe ‘‘good’’ water is not returned because of, for example, outdoor use andevaporation, sewage effluent has a higher salt content than the input water.
The TDS increase from one cycle of municipal use also depends on thein-house water use, which may vary from 400L per person per day in water-rich countries to 60L per person per day or less in water-poor countries.A great deal of water also evaporates during the agricultural and urbanirrigation of crops, plants, and turf, leaving salts behind in the soil which mustbe leached out of the root zone by applying more irrigation water than neededto meet the evaporative needs of the plants. The salty ‘‘deep-percolation’’ watercreated by this leaching moves down to underlying groundwater, where itincreases the salt content of the groundwater and causes groundwater levelsto rise where there is not enough drainage or groundwater pumping.
Of course, the biggest evaporators are the oceans themselves, the saltcontent of which is now about 35,000mg/L. Oceans contain about 97% ofthe global water.3 Of the remaining 3%, about 2% is in the form of snow andice in our polar regions and mountain ranges. This leaves only about 1% asliquid fresh water, almost all of which occurs as groundwater and very littleas surface water, which often is fed by groundwater. This shows the importanceof groundwater and the need for proper management of that resource toprevent depletion and quality degradation.
Sometimes toxic chemicals are leached from the soil. Serious environmentalproblems are resulting from such leaching.4 The major concern in this casestudy was the selenium leaching in drainage water from irrigated land inCalifornia’s Central Valley that was discharged into Lake Kesterson.
8.3 BEHAVIOR OF SOME COMPOUNDS DURING IRRIGATIONWITH SEWAGE EFFLUENT
Increasingly, sewage effluent will be used for urban and agricultural irrigation.The main concern, as discussed in Chapter 3, is the potential for infectiousdiseases in farm workers and city dwellers exposed to the effluent, as well asin people who consume crops irrigated with effluent, especially when thosecrops are eaten raw or brought raw into the kitchen.
Prevention of diseases requires adequate disinfection of the effluent tomeet the strict California Water Recycling Criteria (Table 8.1)5 or the lessstrict WHO guidelines6 that are more achievable in developing countries.The effluent also must meet normal irrigation water requirements forparameters such as salt content, boron, sodium adsorption ratio, and traceelements,7,8 as presented in detail in Chapter 5 (see Tables 5.6, 5.11 and5.13–5.17).
238 Water Reuse for Irrigation: Agriculture, Landscapes, and Turfgrass

Unfortunately, little or no attention is paid to the long-term effects ofsewage irrigation on underlying groundwater. Since most of the water appliedfor irrigation in dry climates evaporates, the concentrations of nonbiodegrad-
able chemicals in the drainage or deep-percolation water going down to thegroundwater can be much higher than in the effluent itself (about five timeshigher for an irrigation efficiency of 80%). These chemicals comprise not only
the salts, nitrates, and possibly pesticide residues normally expected in irrigatedagriculture, but also ‘‘sewage chemicals’’ like synthetic organic compounds,disinfection by-products, including the very carcinogenic compound nitroso-
dimethyl-amine (NDMA),9 pharmaceuticals, and pharmaceutically activechemicals such as the endocrine disrupters fulvic and humic acids.
The humic acids, for example, are known precursors of disinfectionby-products formed when drainage water ends up in drinking water supplies
that are then chlorinated. Thus, groundwater below sewage-irrigated areasmay become unfit for drinking, which in some cases may raise questionsof liability. More research on the long-term effects of sewage irrigation on
groundwater is urgently needed. Long-range planning is necessary to ensuresustainability of such irrigation with minimum adverse environmental andhealth effects.
Two parameters of special concern in irrigation with sewage effluent are
the salinity or salt content of the effluent and the nitrogen concentration.
8.3.1 Salt and Water Relations in Irrigation Soils
To avoid salt accumulation in the root zone of irrigated land, more irrigation
water needs to be applied with irrigation than is needed for crop evapotrans-piration (see also Chapter 5, § 5.5.1). This causes excess water to move downthrough the root zone and then out of the root zone to underlying groundwater
with the salts that had accumulated in the root zone after the previousirrigation. This process is described in its simplest form by Equation (8.1):
DiCi ¼ DdCd ð8:1Þ
where:Di¼ amount of irrigation water applied
Table 8.1 California Title 22 Regulations for Fully Treated Effluent
Reuse conditions Unrestricted irrigation, including spray and surface irrigation of
food crops consumed raw and high-exposure landscape irrigation
as in parks, playgrounds, and residential yards
Total coliforms Median not to exceed 2.2/100mL, single sample not to exceed
23/100mL in 30 days
Wastewater treatment
requirements
Secondary treatment followed by tertiary treatment consisting of
filtration and disinfections
Source: Ref. 5.
Adverse Effects of Sewage Irrigation 239
Ci¼ salt concentration of irrigation waterDd¼ amount of drainage water leaving the root zoneCc¼ salt concentration of drainage water
Di is equal to crop evaporation DET plus Dd. Where rainfall is significant, it
should be included in the equation. The ratio Dd/Di is the leaching requirement.
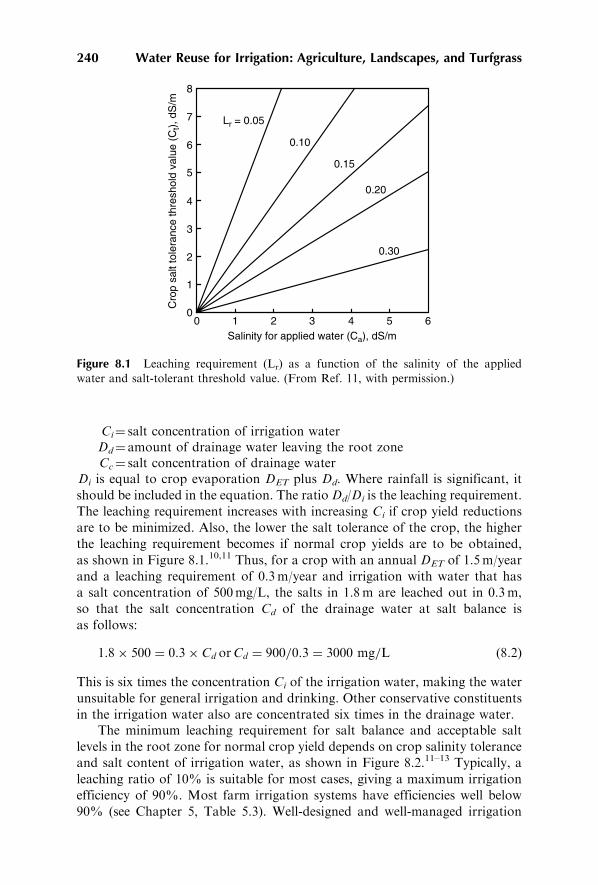
The leaching requirement increases with increasing Ci if crop yield reductions
are to be minimized. Also, the lower the salt tolerance of the crop, the higher
the leaching requirement becomes if normal crop yields are to be obtained,
as shown in Figure 8.1.10,11 Thus, for a crop with an annual DET of 1.5m/year
and a leaching requirement of 0.3m/year and irrigation with water that has
a salt concentration of 500mg/L, the salts in 1.8m are leached out in 0.3m,
so that the salt concentration Cd of the drainage water at salt balance is
as follows:
1:8� 500 ¼ 0:3� Cd orCd ¼ 900=0:3 ¼ 3000 mg=L ð8:2Þ
This is six times the concentration Ci of the irrigation water, making the water
unsuitable for general irrigation and drinking. Other conservative constituents
in the irrigation water also are concentrated six times in the drainage water.The minimum leaching requirement for salt balance and acceptable salt
levels in the root zone for normal crop yield depends on crop salinity tolerance
and salt content of irrigation water, as shown in Figure 8.2.11–13 Typically, a
leaching ratio of 10% is suitable for most cases, giving a maximum irrigation
efficiency of 90%. Most farm irrigation systems have efficiencies well below
90% (see Chapter 5, Table 5.3). Well-designed and well-managed irrigation
Figure 8.1 Leaching requirement (Lr) as a function of the salinity of the applied
water and salt-tolerant threshold value. (From Ref. 11, with permission.)
240 Water Reuse for Irrigation: Agriculture, Landscapes, and Turfgrass

systems may have an efficiency of about 80%. Many surface irrigation systems
have much lower efficiencies, for example, 60% or less.The higher the TDS of the irrigation water, the larger the amounts
and frequencies of leaching need to be. Thus, normal inefficiencies of irri-
gation systems often are more than sufficient for adequate leaching of salts
and other chemicals out of the root zone. This leaching avoids build-up of
salts and other chemicals in the soil and maintains a salt or chemical
balance for the root zone. Eventually, however, these chemicals will show
up in underlying groundwater and from there in surface water via natural
drainage of groundwater into surface water, via discharge from ditch or tile
drains or from pumped drainage wells, or via sewage effluent discharges
in areas where the affected groundwater is first used for the municipal water
supply. A sustained irrigation efficiency of 100%, as advocated by some, is
only possible if distilled water or other water with a TDS content of zero is
used for irrigation.While downward flow of deep percolation water below the root zone is
unsteady and occurs in pulses after each irrigation, the pulses flatten out with
depth so that actual downward water velocities or pore velocities deeper in the
Figure 8.2 Relative salt tolerance ratings of agricultural crops. (From Ref. 13, with
permission.)
Adverse Effects of Sewage Irrigation 241

vadose zone can be estimated as the average deep percolation Darcy fluxdivided by the volumetric water content of the vadose zone. Thus, assuming avolumetric water content of 0.15 in the vadose zone, the 0.3m/year downwardmacroscopic or pore velocity in the vadose zone mentioned previously wouldbe on the order of 0.3/0.15¼ 2m/year. If the groundwater is relatively shallow,for example, at a depth of 3m, it would take the deep percolation then about1.5 years to reach groundwater. If it is deep, such as 100m, it would take thedeep percolation 50 years to reach groundwater.
These numbers apply to old irrigation systems with essentially steady-stateflow. For new irrigation projects where the initial vadose zone is relativelydry at, for example, a volumetric water content of 0.1, and where a deeppercolation rate of 0.3m/year from a new irrigation project would increase thiswater content to 0.3, the fillable porosity would be the difference between thetwo water contents, or 0.2. Assuming again a deep percolation rate of 0.3m/year, the wetting front in the vadose zone would move downward at a rate of0.3/0.2¼ 1.5m per year. Thus, effects of new irrigation systems on underlyinggroundwater would be noticeable after 2 years if the depth to groundwateris rather small—3m in this case—or 67 years if the groundwater is at a depthof 100m.
As the deep-percolation water arrives at the groundwater and the aquiferis unconfined, it will accumulate on top of the aquifer. For an unconfinedaquifer and a fillable porosity of n in the vadose zone above it, the verticalstacking of the deep-percolation water above the water table then will causethe water table to rise a distance of Dd/n, where Dd is the deep-percolationflow. Thus, if Dd is 0.3m/year and n¼ 0.25, the groundwater table would rise1.2m/year, assuming that there are no other additions or reductions ingroundwater due to, for example, artificial or natural recharge, pumpingfrom wells, or lateral flow in the aquifer. This rise has been observed in practicein the southeastern part of the Salt River Valley of Phoenix, Arizona, whichstill has much irrigation. When groundwater pumping for irrigation wasstopped and surface water was used more often for irrigation, groundwaterlevels in the area rose about 0.6m/year, while the TDS and nitrate contents ofthe well water rose 500–1300mg/L and 5–15mg/L, respectively.14 Eventually,where groundwater is pumped for irrigation, the increase in TDS can decreasecrop yields (see Figure 8.2) and restrict the choice of crops to the more salt-tolerant types (see Chapter 5, Table 5.8).
The pore velocity in the vadose zone of 2m/year and the water table riseof 1.2m/year in the previous example are based on year-round irrigation. Formore seasonal irrigation, with only one crop per year and fallowing betweencrops, these values will be less, closer to about 1m/year for the pore velocityin the vadose zone and about 0.6m/year for the rise of the groundwater table.For mixed irrigated agriculture with a combination of seasonal and year-roundirrigation, downward pore velocities in the vadose zone thus may rangebetween 0.6 and 1.5m/year, and groundwater rises may be between 1 and2m/year. Thus, the long-term effects of irrigation on underlying groundwaterare water-quality degradation and rising groundwater levels.
242 Water Reuse for Irrigation: Agriculture, Landscapes, and Turfgrass
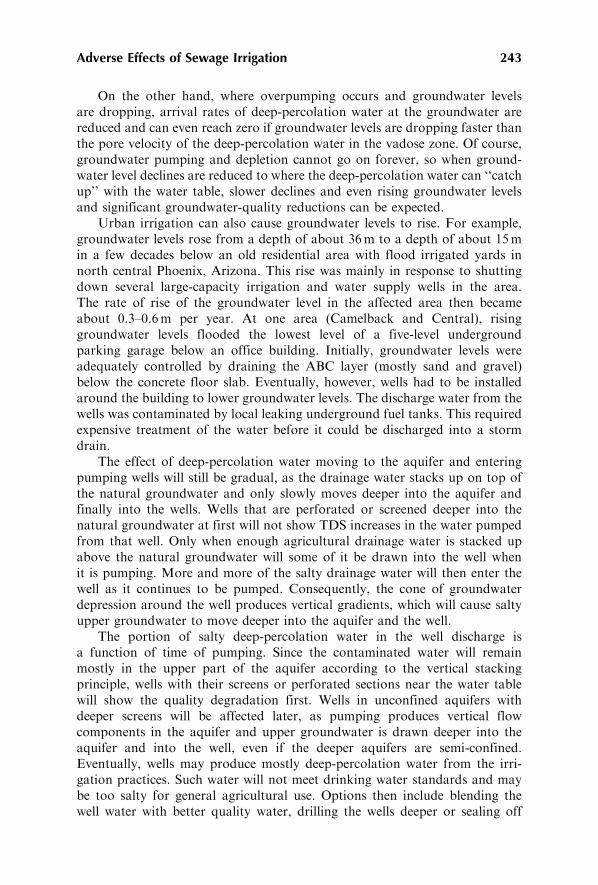
On the other hand, where overpumping occurs and groundwater levelsare dropping, arrival rates of deep-percolation water at the groundwater arereduced and can even reach zero if groundwater levels are dropping faster thanthe pore velocity of the deep-percolation water in the vadose zone. Of course,groundwater pumping and depletion cannot go on forever, so when ground-water level declines are reduced to where the deep-percolation water can ‘‘catchup’’ with the water table, slower declines and even rising groundwater levelsand significant groundwater-quality reductions can be expected.
Urban irrigation can also cause groundwater levels to rise. For example,groundwater levels rose from a depth of about 36m to a depth of about 15min a few decades below an old residential area with flood irrigated yards innorth central Phoenix, Arizona. This rise was mainly in response to shuttingdown several large-capacity irrigation and water supply wells in the area.The rate of rise of the groundwater level in the affected area then becameabout 0.3–0.6m per year. At one area (Camelback and Central), risinggroundwater levels flooded the lowest level of a five-level undergroundparking garage below an office building. Initially, groundwater levels wereadequately controlled by draining the ABC layer (mostly sand and gravel)below the concrete floor slab. Eventually, however, wells had to be installedaround the building to lower groundwater levels. The discharge water from thewells was contaminated by local leaking underground fuel tanks. This requiredexpensive treatment of the water before it could be discharged into a stormdrain.
The effect of deep-percolation water moving to the aquifer and enteringpumping wells will still be gradual, as the drainage water stacks up on top ofthe natural groundwater and only slowly moves deeper into the aquifer andfinally into the wells. Wells that are perforated or screened deeper into thenatural groundwater at first will not show TDS increases in the water pumpedfrom that well. Only when enough agricultural drainage water is stacked upabove the natural groundwater will some of it be drawn into the well whenit is pumping. More and more of the salty drainage water will then enter thewell as it continues to be pumped. Consequently, the cone of groundwaterdepression around the well produces vertical gradients, which will cause saltyupper groundwater to move deeper into the aquifer and the well.
The portion of salty deep-percolation water in the well discharge isa function of time of pumping. Since the contaminated water will remainmostly in the upper part of the aquifer according to the vertical stackingprinciple, wells with their screens or perforated sections near the water tablewill show the quality degradation first. Wells in unconfined aquifers withdeeper screens will be affected later, as pumping produces vertical flowcomponents in the aquifer and upper groundwater is drawn deeper into theaquifer and into the well, even if the deeper aquifers are semi-confined.Eventually, wells may produce mostly deep-percolation water from the irri-gation practices. Such water will not meet drinking water standards and maybe too salty for general agricultural use. Options then include blending thewell water with better quality water, drilling the wells deeper or sealing off
Adverse Effects of Sewage Irrigation 243
upper portions of screens to buy more time before the well water gets saltier,and treatment of the well water with, for example, reverse osmosis which,of course, is expensive and produces a reject brine that may present disposalproblems.
Where deep percolation rates are very small, as with very efficient irrigationsystems, deficit irrigation, or low-water-use landscaping (xeriscapes), evapora-tion of water deeper in the vadose zone may become significant. Deep-percolation rates will then decrease with depth to the point where TDSconcentrations become so high that salts precipitate in the vadose zone andmaybe even in the root zone itself, which would have adverse effects on theplants. Low deep-percolation rates would cause water contents in the soil ofthe vadose zone to be low, which would increase the permeability of the soilto air. Evaporation of water in the vadose zone could then be caused by diurnalbarometric pressure variations that typically occur in desert environments inthe absence of major weather systems moving through. Barometric pressuresthen increase during the night when the air cools down and becomes heavierand decrease during the day as the air warms up again and becomes lighter.This could cause the vadose zone to ‘‘breathe,’’ ‘‘inhaling’’ dry atmospheric airduring the night that causes vadose zone water to evaporate into the soil air,and ‘‘exhaling’’ this damp vadose zone air into the atmosphere during the day.This ‘‘deep’’ evaporation could cause significant amounts of salt to precipitateand, hence, to be stored in the vadose zone, which reduces the salt and waterloads on the underlying groundwater. More research on this phenomenon isnecessary, especially on long-term effects to determine if salts could build up tothe point where they form caliche-like layers that impede downward movementof water and could cause water logging of the upper soil, evaporation from thesoil surface, and formation of salt flats where nothing will grow.
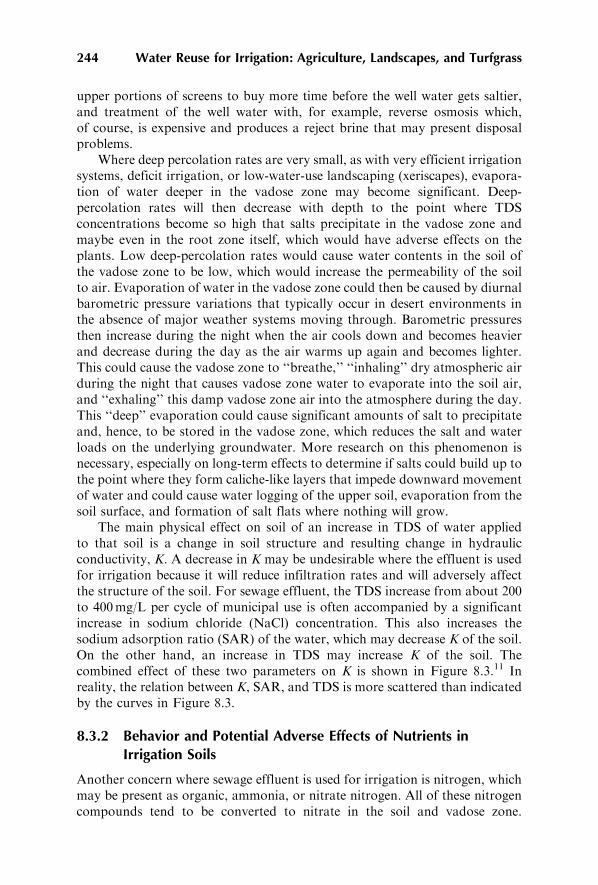
The main physical effect on soil of an increase in TDS of water appliedto that soil is a change in soil structure and resulting change in hydraulicconductivity, K. A decrease in K may be undesirable where the effluent is usedfor irrigation because it will reduce infiltration rates and will adversely affectthe structure of the soil. For sewage effluent, the TDS increase from about 200to 400mg/L per cycle of municipal use is often accompanied by a significantincrease in sodium chloride (NaCl) concentration. This also increases thesodium adsorption ratio (SAR) of the water, which may decrease K of the soil.On the other hand, an increase in TDS may increase K of the soil. Thecombined effect of these two parameters on K is shown in Figure 8.3.11 Inreality, the relation between K, SAR, and TDS is more scattered than indicatedby the curves in Figure 8.3.
8.3.2 Behavior and Potential Adverse Effects of Nutrients inIrrigation Soils
Another concern where sewage effluent is used for irrigation is nitrogen, whichmay be present as organic, ammonia, or nitrate nitrogen. All of these nitrogencompounds tend to be converted to nitrate in the soil and vadose zone.
244 Water Reuse for Irrigation: Agriculture, Landscapes, and Turfgrass

The main losses of nitrogen from the soil system would occur by denitrificationand possibly by the anammox process.15 This is a recently discovered processthat is autotrophic and takes place under anaerobic conditions. The processrequires the presence of approximately equal amounts of nitrate andammonium nitrogen, of which about 90% can be removed, leaving a 10%residue that is mostly in the nitrate form.15 While crop uptake of nitrogenis very significant, it is not enough to prevent nitrates from being leached outof the root zone and move downward with the deep-percolation water tounderlying groundwater.
Nitrogen fertilizer requirements are about 50–500 kg/ha per crop.7,16 Asa rule-of-thumb, half of this nitrogen is absorbed by the crop, one fourth islost by denitrification and returns to the atmosphere as nitrogen gas and oxidesof nitrogen, and one fourth or up to 67 kg/ha is leached out of the root zoneas nitrate in the deep percolation water.17 Assuming 0.3m/year of deep-percolation water and 400 kgN/ha of nitrogen applied as fertilizer, of which100 kgN/ha is leached out of the root zone, this would give a nitrate nitrogenconcentration in the deep percolation water of 33mg/L. This is well abovethe maximum limit of 10mg/L for drinking water.
Conventionally treated secondary sewage effluent (activated sludge) maycontain about 30mg/L total nitrogen, mostly as ammonium.18 If this effluentwas used for irrigation with a total application of 1.8m per year or growingseason, the amount of nitrogen applied with the water would be about540 kg/ha per year or growing season, more than twice the average require-ment. Assuming no luxury uptake of nitrogen by the crop, about one fourthof this nitrogen is leached out as nitrate with the deep percolation water and,assuming also that the irrigation efficiency again is about 80%, would then givea nitrate nitrogen concentration in the drainage water of about 37mg/L.
Figure 8.3 Effect of SAR and salt concentration of soil solution on hydraulicconductivity of Pachappa sandy loam.
Adverse Effects of Sewage Irrigation 245

Thus, irrigation with sewage effluent and no additional application ofnitrogen fertilizer already can cause more nitrate contamination of underlyinggroundwater than irrigation with normal water and the nitrogen applied asfertilizer. Nitrate contamination of groundwater due to irrigation with recycledmunicipal wastewater can be reduced by removing nitrogen in the sewage-treatment plant with nitrification-denitrification or other processes. Also,nitrogen can be removed naturally from water in the underground environ-ment by denitrification, ammonium adsorption, and possibly by the recentlydiscovered anammox process.15 Anammox bacteria are autotrophic andanaerobic, so organic carbon and oxygen are not required and the processcan take place in the aquifer itself.
If sewage effluent is used for irrigation, the nitrogen in the effluent oftenis more than enough to satisfy the nitrogen requirements of the crops, andadditional fertilizer nitrogen should not be given. As a matter of fact, theeffluent may already contain too much nitrogen, which can adversely affectnot only the underlying groundwater, but also the crop itself. Adverse cropeffects due to excess nitrogen include delay of harvest, too much vegetativegrowth and not enough reproductive growth (seeds), impaired quality of crop(reduced sugar contents in beets and cane, reduced starch content in potatoes),reduced yield of marketable fruit, and nitrate toxicity in people and animalsconsuming the crop.16
The nitrogen problem where crops are irrigated with sewage effluentmainly stems from the inability of farmers to properly schedule irrigationswith sewage effluent and to get both the desired amount of water into theground at the desired time from an irrigation standpoint and the desiredamount of nitrogen therein from an agronomic standpoint. Often this meansthat the crops get too much nitrogen at the wrong times in the growing season.Giving the crops too much nitrogen usually produces too much vegetativegrowth (stems and leaves) and not enough reproductive growth (flowers, fruit,and seed). For example, nitrogen applications to sugar beets and sugar caneshould be stopped toward the end of the growing season to get more sugarstored in the roots (sugar beets) and stems (sugar cane), thus increasing thesugar content and also the percentage of the sugar that readily crystallizesinto ‘‘sugar’’ in the refinery.
For fruit crops, the yield of marketable produce can be reduced if extensiveamounts of nitrogen are applied to the crop, especially if the crop is a perenniallike apples, pears, peaches, oranges, etc. Sometimes the total yield (in kg/ha)may not be reduced, but the maturation will be delayed, fruit sizes may bedecreased, or the quality of the fruit (e.g., texture and taste) may be adverselyaffected. Too much nitrogen on potatoes may produce fewer and smallertubers with lower sugar content, probably due to the excess vegetative growthresulting from too much nitrogen fertilizer application. Navel and Valenciaoranges have produced grainy and pulpy fruit with less juice than treesreceiving normal nitrogen applications. Also, overfertilized Valencia orangesshow regreening of the rind, reducing their marketability. Delays in fruitmaturation due to excessive nitrogen application were also observed in apricots
246 Water Reuse for Irrigation: Agriculture, Landscapes, and Turfgrass

and peaches, so that they missed the early markets and the higher prices thatthey command. Excessive vegetative growth also gives production problemslike fruit rot in melons and grapes due to more leaves and shade that increasesmoisture levels inside the plant canopy. Increased lodging of grain crops likewheat, barley, and oats caused by increased vegetative growth due to excessivenitrogen in the soil can create harvesting problems.16
High nitrate levels in food can also produce problems in persons andanimals consuming those foods, as nitrate is reduced to nitrite during digestion.
Phosphates in sewage effluent are essential for plant growth and may notbe toxic even at high concentrations. However, excessive applications ofphosphates may cause deficiencies of mobile copper and zinc in the soil, whichare important micronutrients. In high-pH soils, phosphates precipitate out,mostly as Ca and Mg phosphates. As a rule, phosphate content in recycledurban wastewater is lower than a crop’s needs, and consequently, the additionof phosphate fertilizers is necessary during irrigation with recycled water.
8.3.3 Effects of Disinfection By-Products on Groundwater
Unfortunately, the normal water-quality requirements for irrigation withmunicipal wastewater do not address disinfection by-products, pharmaceuti-cally active chemicals, humic substances, and other potential contaminants(see Chapters 3 and 5). Disinfection by-products may already be present inthe wastewater entering the treatment plant due to chlorination of thedrinking water. By-products can also be formed by chlorination of effluentfrom the wastewater treatment plant, particularly with the high chlorine dosesand long contact times used for Title 22–type tertiary treatment.
Disinfection with ultraviolet (UV) irradiation after granular mediafiltration would give lower disinfection by-product levels in the tertiaryeffluent. Some disinfection by-products, like trihalomethanes and haloaceticacids, have been found to be biodegradable in aquifers near aquifer storageand recovery wells.19 Still, disinfection by-products comprise a whole suiteof halogenated organic compounds with yet-to-be-discovered identities, fatesin the underground environment and health effects. Trihalomethanes caninclude chloroform and bromodichloromethane. The latter is of concernbecause it may increase miscarriages in women.
As with the dissolved salts, concentrations of refractory and nonvolatiledisinfection by-products in the deep-percolation or drainage water wouldalso be about five times higher than those in the effluent used for irrigation,again assuming an irrigation efficiency of 80%. Because of their potentialtoxicity and carcinogenicity, disinfection by-product levels in drinking waterare continually scrutinized, and maximum contaminant levels (MCLs) maybe lowered in the future (see Chapter 2, Table 2.4). For example, the U.S.EPA20 has lowered the drinking water MCL for trihalomethanes from 100 to80 mg/L. This does not bode well for potable use of groundwater affectedby deep-percolation water from effluent-irrigated areas.
Adverse Effects of Sewage Irrigation 247

The challenge for the drinking-water industry of balancing disinfectionby-product formation against microbial control21 also applies to water reuseissues. The choice is between the possibility of immediate acute illness causedby pathogens (diarrhea and worse) and much more serious diseases like cancercaused by chemicals after years of ingestion.
The high nutrient and organic carbon levels in effluent can be expectedto enhance plant growth and bioactivity in the soil. Decaying roots andother plant parts and biomass can then form humic and fulvic acids as stableend-products. These are nonbiodegradable, and they are known disinfectionby-product precursors in water that is to be chlorinated. Thus, when ground-water from below effluent-irrigated areas is pumped and chlorinated forpotable use, a new suite of disinfection by-products can be formed.
8.3.4 Effects of Pharmaceuticals and Other Organic Contaminants
Concern also is rising about pharmaceutically active chemicals that haveentered the sewers with domestic, industrial, pharmaceutical, and hospitalwaste discharges.22
8.3.4.1 Hormones
Sewage effluent usually contains a variety of hormones, which, when theeffluent is used for irrigation, increases the endogenous production of hormones(phyto-hormones) in legumes like alfalfa. These phyto-hormones can thencause fertility problems in sheep and cattle that eat the forage.23,24,29
8.3.4.2 Endocrine disruptors
Other substances are not hormones themselves, but they disrupt the hormone(endocrine) system in the body. These endocrine disruptors (EDCs) can behormones themselves or chemicals that interfere with the hormone systemin the body. EDCs can function as hormones where they mimic and, hence,increase the normal hormone activity, or they may block hormone-bindingsites where they decrease hormonal activity. Endocrine disruption can becaused not only by normal hormones, but also by other chemicals, suchas PCBs and many others. It was indicated25 that possibly more than 70,000chemicals have endocrine disruptive potential, many of which have beendetected in sewage effluent. However, hormones tend to be several thousandtimes more potent than industrial chemicals, pesticides, and metals.26.27
8.3.4.3 Behavior of Pharmaceuticals in Water Reuse Schemes and
Natural Environment
Pharmaceutically active chemicals seem to survive wastewater treatmentand may not adsorb well to soil particles, so they may be rather refractoryin the underground environment. While these chemicals may not be directlytoxic, they can produce adverse health effects by affecting the immune and
248 Water Reuse for Irrigation: Agriculture, Landscapes, and Turfgrass

hormone systems of animals and humans, i.e., they can act as endocrinedisruptors.28
At least 45 chemicals have been identified as potential endocrine-disruptingcontaminants, including industrial contaminants like dioxins and PCBs,insecticides like carbaryl and DDT, and herbicides like 2,4-D and atrazine.29
More research is needed on the occurrence and fate of pharmaceutically activechemicals in the underground environment and about synergistic effects whena whole spectrum of pharmaceutically active chemicals and other contaminantsoccurs and is ingested.
To get some idea of the pharmaceuticals that can be expected nationwidein surface water, water samples from 139 U.S. streams were selected formonitoring with known sewage effluent discharges.30 These samples were thenanalyzed in laboratories with equipment and procedures that could identifyand determine concentrations of 95 different pharmaceuticals, from which 82have been found. Thus, surface water into which sewage effluent is dischargedis likely to contain a large assortment of pharmaceuticals.
Many of these chemicals are not removed by passage through soil, sothat groundwater below losing streams, below land irrigated with effluent oreffluent contaminated water, below septic tanks, and below systems forartificial recharge can contain pharmaceuticals or pharmaceutically activecompounds.31 This will be particularly true for agricultural soils with shallowgroundwater (less than a few m deep, for example) where root activity, tillage,decomposing stems of plants and roots that have been plowed under, wormholes, etc., and spatial variability have created a system of macropores throughwhich water with its dissolved chemicals can move rapidly to greater depthwithout interaction with the soil and the chemical and microbiologicalprocesses that otherwise would adsorb, accumulate, transform, or degradeundesirable chemicals.17,32,33 This so-called preferential flow basically givesthe water and chemicals a short-cut to greater depths, where the water couldjoin groundwater. Thus, groundwater below sewage-irrigated fields can beexpected to contain effluent chemicals and agricultural chemicals.
Concerns are rapidly rising and spreading about residues of pharmaceuticaland personal care products (PPCPs) in sewage, their persistence in sewage-treatment plants and during percolation in soil which puts them into surfacewater and groundwater, and their health effects, which include interferencewith the hormone system, like endocrine disruption and feminization of malefish.27,34 Unknown and unspecified toxic effects can also be expected, as woulddevelopment of antibiotic-resistant bacteria by repeated exposure ofthe pathogens to antibiotic levels in wastewater and contaminated streams.35
Some industrial wastes in sewage effluent like PCBs and other organic wastesmay also have some of these health effects.
The fate of PPCPs in groundwater recharge systems has been studied31
where secondary sewage effluent after filtration through tertiary filters wasput into shallow basins for infiltration and recharge of underlying ground-water. The soils were predominantly alluvial sands and gravels, and thegroundwater table was about 13–15m below the bottom of the infiltration
Adverse Effects of Sewage Irrigation 249

basins. Groundwater-monitoring wells had screened intervals from 23 to 56mdepth and from 14 to 25m depth. One well was screened over its entire depth of56 m in the aquifer. While DOC was reduced from 15mg/L in the effluentto 2mg/L in the aquifer, some pharmaceuticals like caffeine and analgesic/anti-inflammatory drugs such as diclofenac, ibuprofen, ketoprofen, naproxen,and fenoprofen and blood lipid regulators such as gemfibrozil were efficientlyremoved to concentrations near or below detection limits. The antiepilepticscarbamazepine and primidone were not removed during groundwater rechargeunder either anoxic saturated or unsaturated or aerobic unsaturated flowconditions during underground travel times of up to 8 years.
Another application of improving water quality by underground move-ment of water is riverbank filtration, where water in rivers and streams isinduced by groundwater pumping to infiltrate into the banks and bottomsand then to move laterally away from the stream to pumped wells thatare installed a distance away from the stream bank. While improvingthe river water quality, the bank filtration process does not remove allundesirable organic chemicals.36,37
8.3.4.4 Management of Adverse Effects of Pharmaceutical Products
in Irrigation Systems
Residuals of PPCPs in sewage effluent are entering the surface water environ-ment through direct discharge of variously treated sewage effluents intostreams and lakes. PPCPs can then enter groundwater, where the groundwaterlevel is lower than the water level in affected streams or lakes, causing them tolose water to the underground environment. Other pathways to groundwaterare via irrigation or artificial groundwater recharge systems that use sewageeffluent or sewage contaminated water and via septic tank leach fields.Pharmaceuticals used in animal production and present in animal waste couldenter surface water via surface runoff and groundwater via infiltration anddeep percolation from farms and manured fields.
Health effects so far have been detected mainly in aquatic life (fish,amphibians) and animals up the food chain, but not positively in humans,although there are significant indications of potential adverse effects.29 Even ifthe effects were known, eliminating PPCPs may be difficult, and some form ofsource control and treatment may be a first step to minimize their presence andconcentrations in surface water and groundwater.
On the one hand, it may be argued that since the amounts of PPCPsingested with drinking water are so small compared with the medical dosesat which they are prescribed that significant adverse human health effectsmay be of no concern. Then again, there is little information on long-term andsynergistic effects. There may still be biological effects, and some researchers22
stated that PPCPs in water ‘‘should be avoided in principle.’’For aquatic organisms, the exposure is maximum at complete immer-
sion for 24 hours a day. Also, concentrations of the chemicals in organismsand animals increase up the food chain. Thus, there are real concerns about
250 Water Reuse for Irrigation: Agriculture, Landscapes, and Turfgrass
wildlife. PPCPs typically occur at ng/l levels, which seem completely
insignificant considering that 1 ng/L is equivalent to 1 second in about
31,000 years. On the other hand, 1 ng/L of a compound with a molecular
weight of 300 still contains 2� 1012 molecules per liter, which for endocrine
disruptors could still bind to a lot of hormone receptors.Public opinion, as fostered through the media, must also be considered.
Catchy headlines with words like ‘‘ecological disaster,’’ ‘‘drugs in drinking
water,’’ or ‘‘AIDS-like symptoms’’ can easily stir up serious public concerns,
to which scientists may be unable to respond adequately in the absence
of adequate and reliable data. Insufficient information breeds concern, and
concern leads to fear.Historically, the United States has pursued a ‘‘straightforward and simple
policy that no risk can be tolerated in the nation’s food supply’’ and ‘‘that all
food additives be proved safe before marketing and explicitly prohibits any
food additive found to induce cancer in test animals’’,38 and, by implication,
also in drinking water. Despite public objections on the grounds that this
inhibited freedom of choice, this policy was rigorously enforced until the
late 1970s, when saccharine was discovered to cause cancer in rats. However,
plans for taking saccharine off the market caused a serious public outcry
against the federal government dictating what people could and could not
eat. In response, the policy shifted to one of informing the public about risks
and letting the people decide for themselves what they want to eat and drink.
Thus, an informed public making its own decisions was the new policy, an
acknowledgment that there is no such thing as a risk-free society.This also led to more studies of carcinogens naturally occurring in food and
of the risks associated with recreational activities and sports, risks in common
human activities and environmental effects, occupational risks, and various
cancer risks to show that life as a whole is not risk-free.38 The matter of choice
also is very important. Often people are willing to accept higher risks in eating
habits, sports, recreational and other activities which they chose to do than
in the quality of the food they buy or of the water that comes out of the tap,
over which they have no control.31,38.
The fear about carcinogens naturally occurring in food and drink or
added artificially with food processing and in polluted water was some-
what attenuated by some studies,39 which showed that chemicals caused
cancer in rodent bioassays not because they were carcinogenic, but because
they were administered in such high doses that they caused cell damage in
the test animals. Subsequent cell division to heal the damaged tissue
then could produce mutations that caused malignant tumors. Thus, the
linear response theory to extrapolate positive responses from high doses
in the bioassays to low doses that are more realistic in real life is
flawed because it does not recognize threshold concentrations below which
positive responses do not occur.40 About half the chemicals found
carcinogenic in such tests in actuality may not have been carcinogenic,
but rather produced cancer because of the high doses administered to the
Adverse Effects of Sewage Irrigation 251

test animals,39 thus confirming Paracelsus’ conclusion that it is the dose thatmakes the poison.
For hormonally active compounds, however, dose-response relationsmay not be linear and may even be odd-shaped like an inverted ‘‘U’’.29 Thismakes extrapolation to different doses and exposures very problematic.Rodent bioassays also do not recognize genetic effects, as some chemicalscaused cancer in mice but not in rats.41 Thus, if rodent bioassay results cannotbe transferred to different rodent species, how can they be transferred tohumans? However, this may not be true for hormones, which may functionbasically the same in all mammals.29
Large systems such as the ecosystems we live in are inherently chaotic, eventhough they may appear to be in equilibrium. Therefore any technologicalfix of one variable will change all the other variables in a totally unpredictablemanner. It is, therefore, inadvisable to make large-scale changes to correctpollution without numerous small-scale studies. This requires long-term data-base collection. Solutions based on small databases and extrapolated modelsare, therefore, not recommended. What is needed is ecological ‘‘commonsense,’’ e.g., if the fish are dying in the rivers used for drinking water, actionmust be taken immediately. If minor or localized disturbances are seenin wildlife ecology, the best course of action would be long-term datacollection.
The true significance of PPCPs in the aquatic environment and in watersupplies is still a big question. Adverse effects on aquatic life and micro-organisms observed so far are serious enough to warrant more research,including effects on humans. Only if these effects are better understood canthe public be sufficiently informed to make its own decisions. Because PPCPsplay such an important role in the well-being of people and animals, someadverse effects on aquatic organisms living in affected water and on peopleand animals drinking that water may have to be accepted, just as side effectsof medical drugs are accepted. The question then is, what is acceptable andwhat can be done about it?
Ideally, dose-response relationships are developed on which regulatorscan base appropriate maximum contaminant levels. Hormone-disruptingchemicals, however, may not follow classical dose-response relations.29
Developing more biodegradable PCPPs is another avenue toward reducingtheir harmful impact. Phasing out a compound is, of course, an action of lastresort. However, if there are serious enough concerns about a certain product,action may have to be taken before there is absolute scientific proof of harm.This is where eco-toxicology and eco-epidemiology become important.
Lessons can also be obtained from the accepted and established prac-tice of potable use of municipal wastewater after it has had the usualin-plant treatments followed by rapid infiltration for recharge of ground-water and soil-aquifer-treatment (SAT) and to break the dreaded toilet-to-tap connection of potable water reuse and make it indirect.42,43 While somepharmaceuticals and other organic wastes seem to survive SAT via rechargeand irrigation, so far two major health effect studies in California have
252 Water Reuse for Irrigation: Agriculture, Landscapes, and Turfgrass

failed to show any adverse health effects in people drinking the water afterSAT.44,45 To protect the public health, California has set an upper limit of1mg/L for the total organic carbon (TOC) content of the water afterrecharge and SAT that is due to the sewage effluent. This is achieved byplacing recovery wells at least 150m from the irrigation or infiltrationsystem to allow adequate underground detention times (at least 6 months)and mixing with native groundwater so that the latter comprises at least50% of the water pumped from the well to ensure a sewage TOC in thewell water of less than 1mg/L. Another advantage of letting the sewageeffluent move underground after recharge or irrigation before pumping itup for reuse (including potable) is that it makes water reuse more accept-able in countries that have a religious taboo against the use of ‘‘unclean’’water.46,47
In view of all the experiences obtained with SAT and the rules developedfor potable reuse of sewage effluent after SAT, irrigation with sewage effluentdoes not seem to present significant or unacceptable risks to potable useof local groundwater that has received drainage water from effluent-irrigatedareas above it and where there is sufficient blending with native groundwaterbefore extraction from the aquifer.
The role of scientists in all this was already defined almost 400 yearsago by Francis Bacon,48 who wrote: ‘‘And we do also declare naturaldivinations (forecasting by natural observation) of diseases, plagues, swarmsof hurtful creatures, scarcity, tempests, earthquakes, great inundations,comets, temperature of the years, and diverse other things; and we givecounsel thereupon, what the people shall do for the prevention and remedyof them.’’ Of course the list of ‘‘diverse other things’’ has greatly expandedover the years, and now definitely includes PPCPs. However, informationabout PPCPs in general and endocrine disruptors in particular is ‘‘limited,with sparse data, few answers, great uncertainties and a definite need forfurther research’’.49 Indeed, much more research needs to be done beforescientists can give, in Bacon’s words, counsel thereupon and what the peopleshall do.
Meanwhile, irrigation with sewage effluent may be an acceptable practiceif done properly and with the right precautions to protect human healthand the environment and to ensure sustainability of the practice. Ultimately,sewage irrigation may well be done because rather than a good solution, it maybe the least undesirable solution to a wastewater problem.
8.4 SALT AND GROUNDWATER WATER-TABLE MANAGEMENTFOR SUSTAINABLE IRRIGATION
Although sewage chemicals like nitrate, pesticides, pharmaceuticals, and otherindustrial chemicals can cause problems when the effluent is used for irrigation,the most insidious and serious contaminants in sewage effluent or any otherirrigation water may well be the salts dissolved in that water, as expressed by
Adverse Effects of Sewage Irrigation 253

TDS. These salts become concentrated in the drainage water that moves fromthe root zone to the underlying groundwater after most of the irrigation wateris returned to the atmosphere via evapotraspiration, leaving the salts behind inthe soil and groundwater. This increases the TDS of the groundwater andcauses groundwater levels to rise until they eventually can damage under-ground pipes, basements, cemeteries, landfills, old trees, etc. Continually risinggroundwater levels may eventually waterlog the surface soil from which thewater directly evaporates. This leaves behind a salt crust where nothing willgrow anymore.
Inadequate management of salt and rises in groundwater below irrigatedareas have forced local people to leave and have caused the demise of oldcivilizations like Mesopotamia and possibly the Hohokams in Arizona, thathad an irrigated agriculture that was abandoned in the fifteenth century,possibly because of high groundwater levels and salt accumulation in the uppersoil. Waterlogging and salinization of surface soil are still a threat to manyirrigated areas in the world.50 An example of the latter is the roughly150� 300 km Phoenix–Tucson region with intensively irrigated areas and arapidly expanding urban population, which now is about 4 million. The areaalso has both surface water and groundwater resources for water supplies andlittle or no export of water and salts.
8.4.1 Salt Loadings
The main renewable water resources, i.e., surface water, for south-centralArizona are the Salt River system (about 1000 million m3/year with a TDS ofabout 500mg/L) and the Central Arizona Project Aqueduct (about 1500million m3/year of Colorado River water with a TDS of about 650mg/L).Groundwater in this area is essentially a nonrenewable resource, becausenatural recharge in a dry climate is very small, on the order of a few mm peryear, and there is essentially no ‘‘new’’ groundwater being formed.43,51 Almostall of the recharge in the Phoenix–Tucson area is deep-percolation water fromirrigated areas, which is a return flow and does not represent ‘‘new’’ water.Groundwater pumping for irrigation in the Phoenix, Tucson, and Pinal ActiveManagement Areas is about 1100 million m3/year with an estimated averageTDS of about 1000mg/L52. This represents a total salt load in delivered surfacewater and groundwater of about 2.6 million tons per year.53 For the presentpopulation of about 4 million people in the area, this amounts to 0.65 ton or650 kg per person per year or about 1.8 kg per person per day. This is muchmore than the amount of salt ingested with food and drink and excreted againinto the sewers or, for that matter, the salt added by other sources like watersofteners. Eventually, these salts end up in the deep-percolation water in thevadose zone. If groundwater pumping and resulting groundwater level declinesthen are reduced to where this deep-percolation water can ‘‘catch up’’ with thewater table, rising groundwater levels and significant groundwater qualityreductions can be expected. The amount of salt leaving south-central Arizonaprobably is very small. There may be some salty groundwater leaving the area
254 Water Reuse for Irrigation: Agriculture, Landscapes, and Turfgrass
at the west side, but no surface water. Thus, south central Arizona is an area ofmajor salt imports with little or no exports.
The calculated increases in groundwater TDS, nitrate levels, and ground-water levels themselves agree with observed values in a study conducted by theSalt River Project in the southeastern part of the Salt River Valley wheregroundwater pumping was greatly reduced and irrigation was mostly donewith surface water starting in the late 1970s and continuing throughout the1980s.14 For example, nitrate levels in groundwater pumped from the aquiferbelow the affected area increased from a range of 2–7mg/L as nitrogen to arange of 10–20mg/L. TDS increased from about 500mg/L to about 1000mg/Lfor some wells, and from 500 to 1800 and from 700 to 1500mg/L for others,while groundwater levels rose about 0.6m/year. The TDS values are signifi-cantly lower than the TDS contents of the deep-percolation water, which forefficient irrigation systems would be about 2500mg/L. Also, nitrate levelswere lower than expected in the deep-percolation water. This is because thewells are perforated or screened for a significant depth interval, whereas thedeep percolation water accumulates at the top of the aquifer.
Thus, the well water consists of a mixture of salty deep percolation waterfrom the upper part of the aquifer and much less salty natural groundwaterfrom deeper in the aquifer. Simple calculations can be made to predict the TDSand nitrate increases of the well water as a function of time after the arrival ofdeep percolation water, for example, by calculating the TDS of the well wateras a mixture of natural groundwater overlain by a layer of high TDS from thescreen lengths in each and the corresponding transmissivities of each. If thesituation is more complicated, like well screens only in the deeper portion ofthe aquifer and/or presence of a middle fine-grained unit or other layers oflow permeability, modeling techniques can be used to predict TDS increasesin well water as a function of time of pumping.
As discussed previously, the vadose zone may breathe, inhaling dryatmospheric air when barometric pressures are increasing and exhaling moistsoil air when barometric pressures are decreasing. The resulting ‘‘deep’’evaporation could cause significant amounts of salt to be stored in the vadosezone, which reduces the salt load on the underlying groundwater.
8.4.2 Salt Tolerance of Plants
Increasing TDS contents of well water, or, for that matter, of any water, areundesirable because for health and aesthetic reasons they should be below500mg/L for potable water. TDS increases are also undesirable because theyshorten the useful life of pipes, water heaters, etc., and make water treatmentmore expensive for industrial uses where high water qualities, including ultra-pure water, are needed.
TDS increases are also undesirable for urban and agricultural irrigation ofplants and crops (see Chapter 5, § 5.5.1). As a rule, water with a TDS content ofless than 500mg/L can be used to irrigate any plants, including salt-sensitiveplants (See Chapter 5, Table 5.6). Between 500 and 2000mg/L TDS, there can
Adverse Effects of Sewage Irrigation 255

be slight restrictions on its uses, and above 2000mg/L there can be moderate tosevere restrictions like growing salt-tolerant crops only and adequate leachingof salts out of the root zone.11,13 For agricultural purposes, salt contents ofirrigation water and water in soils and aquifers are often measured as electricalconductivity, EC, expressed in dS/m. For most natural waters 1 dS/m isequivalent to a TDS content of about 640mg/L.
The basic relationships between the EC of irrigation water and relativecrop yields are shown in Figure 8.2. Typically, such relations show no decreasein crop yield with increases in the salt content of the irrigation water, asexpressed by ECw, as long as ECw is small. Then, as ECw of the irrigation wateris increased, a threshold value is reached where crop yields start to decreaselinearly with further increases in ECw. This threshold value is about 0.7 dS/m(450mg/L) for salt-sensitive crops, 1.8 dS/m (1150mg/L) for moderately salt-sensitive crops, 4.0 dS/m (2600mg/L) for moderately salt-tolerant crops, and6.5 dS/m (4200mg/L) for salt-tolerant crops. Examples of crops in thesecategories are shown in Table 5.8 (Chapter 5).
The lines in Figure 8.2 show that if the ECw of the irrigation water increasesbeyond the threshold value, farmers have to accept a reduction in crop yieldor switch to a more salt-tolerant crop. Considerable research is being done toincrease the salt tolerance of crops.13,54
8.4.3 Management of Salty Water
The first reaction to a decreasing quality of well water often is to shut the welldown and use other sources of water, if available. However, where ground-water is not pumped at adequate rates, water tables will then continue to risedue to continued arrival of deep-percolation water from the irrigated areasuntil they become so high that they flood basements, damage undergroundpipelines, come too close to landfills or cemeteries, kill trees, reduce crop yields,and eventually waterlog the surface soil so that water can evaporate directlyfrom the soil, leaving the salts behind and creating salt flats.
Failure to control groundwater levels in irrigated areas and resultingsalinization of the soil has caused the demise of old civilizations and is stillcausing irrigated land to go out of production at alarming rates.50 In additionto developed and developing countries, there now are also deterioratingcountries where salts and groundwater levels are not adequately controlled.Where there are rises of salty groundwater, groundwater must eventually bepumped again to keep groundwater levels at a safe depth. For agriculturalareas where higher groundwater levels can be tolerated than in urban areas,water tables can also be controlled by tile or ditch drainage.
Great care must be taken that the poor-quality salty drainage water thatcomes out of these wells and drainage systems is discharged into the surfaceenvironment in an ecologically responsible manner. Options include dischargeinto oceans or big rivers, where dilution is the solution to pollution, or intodedicated ‘‘salt’’ lakes for accumulation and storage of salts in perpetuity.Where the salty water needs to be transported over long distances to proper
256 Water Reuse for Irrigation: Agriculture, Landscapes, and Turfgrass

disposal areas, concentrating the salts into smaller volumes of water may benecessary to reduce the cost of pipelines, aqueducts, or other conveyancesystems and to reduce the volume of water that leaves the area. Ideally, thesalts are concentrated with appropriate treatment technologies to help defraythe cost of net disposal.
One way to concentrate the salts into smaller water volumes while makingeconomic use of the desalted water is membrane filtration. The desalted watercould then be used for potable or industrial purposes. As a matter of fact,mildly brackish groundwater could be an important reserve water resource inperiods of drought since desalting this water is relatively inexpensive comparedto desalting much saltier water like seawater.
Concentration of salts into smaller water volumes can also be achievedwith sequential irrigation of increasingly salt-tolerant crops where the deep-percolation water from one crop is used to irrigate a more salt-tolerant crop,etc., starting with salt-sensitive crops and ending with halophytes.55 This canincrease the salt concentrations of the drainage water to seawater levels (about30,000mg/L) and in volumes that are a small fraction of the original irriga-tion water volumes, as illustrated in Table 8.2. Depending on local conditions,sequential irrigation to halophytes may not be needed, and the sequencemay be stopped if the salt content of the deep-percolation water has becomehigh enough to achieve sustainable disposal at acceptable costs. The wells forpumping salty deep-percolation water from the aquifer in sequential irrigationprojects should be rather shallow so that they pump primarily deep-percolationwater from the top of the aquifer and a minimum of deeper native and lesssalty groundwater. Also, sequential irrigation is best carried out by growingincreasingly salt-tolerant crops in relatively large blocs so that there is notmuch lateral flow in the aquifer that could interfere with proper control of thedeep-percolation water from the different crops.
A third option for concentrating salts into smaller volumes is via evapora-tion ponds.53 For the Salt River Valley, evaporation rates of free water surfacesare about 1.8m/year. Thus, if flows of drainage water are significant, large landareas will be required for such ponds. The ponds may also becomeenvironmental hazards. For example, if the irrigation amount is 1.5m/yearand the irrigation efficiency is 75%, evaporation ponds with a surface area ofabout 20% of the irrigated area would be required if all the deep percolationwater must be evaporated. This will eventually increase salt concentrationsin the ponds to values well in excess of those for seawater, as happened in theSalton Sea in California with about 45,000mg/L and the Dead Sea betweenJordan and Israel with about 340,000mg/L. However, complete evaporationmay not be necessary if the main purpose of the pond is to concentrate thesalts into more manageable smaller volumes of water that can then be moreeconomically exported to an ocean or designated inland salt lake. In that case,pond areas will be less.
Another possibility for concentrating the salts into smaller volumes ofwater by evaporation is to use the salty well water for power plant cooling. Forexample, the 3810MW nuclear power plant west of Phoenix is cooled with
Adverse Effects of Sewage Irrigation 257
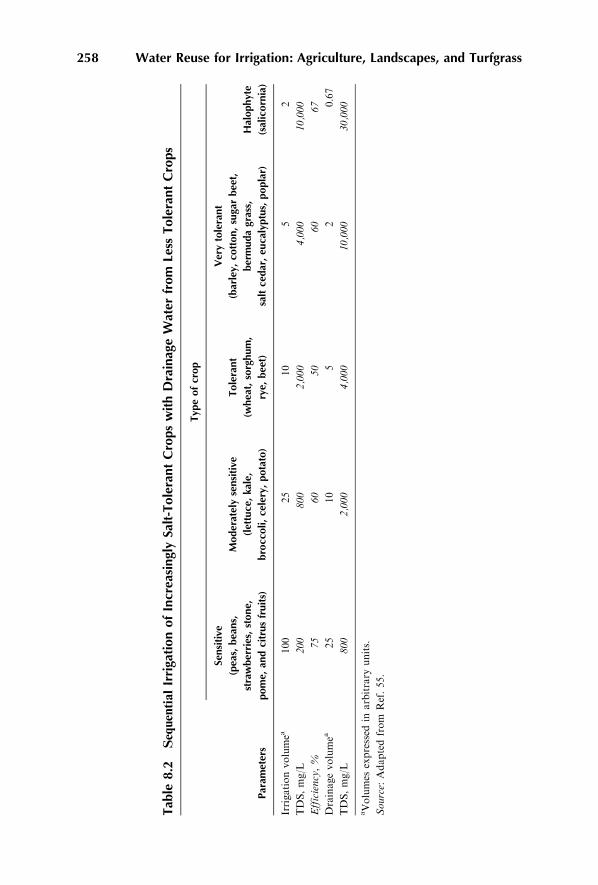
Tab
le8
.2Sequential
Irri
gati
on
of
Incr
easi
ngl
ySa
lt-T
ole
ran
tC
rop
sw
ith
Dra
inag
eW
ater
fro
mLe
ssT
ole
ran
tC
rop
s
Par
amet
ers
Typ
eo
fcr
op
Sen
siti
ve
(pea
s,b
ean
s,
stra
wb
erri
es,
sto
ne,
po
me,
and
citr
us
fru
its)
Mo
der
atel
yse
nsi
tive
(let
tuce
,ka
le,
bro
cco
li,
cele
ry,
po
tato
)
To
lera
nt
(wh
eat,
sorg
hu
m,
rye,
bee
t)
Ver
yto
lera
nt
(bar
ley,
cott
on
,su
gar
bee
t,
ber
mu
da
gras
s,
salt
ced
ar,
euca
lyp
tus,
po
pla
r)
Hal
op
hyt
e
(sal
ico
rnia
)
Irrigationvolumea
100
25
10
52
TDS,mg/L
200
800
2,000
4,000
10,000
Efficiency,%
75
60
50
60
67
Drainagevolumea
25
10
52
0.67
TDS,mg/L
800
2,000
4,000
10,000
30,000
aVolumes
expressed
inarbitrary
units.
Source :
Adaptedfrom
Ref.55.
258 Water Reuse for Irrigation: Agriculture, Landscapes, and Turfgrass

about 2800 million m3/year of treated sewage effluent. The effluent is recycled15–20 times through the plant and is then discharged into 200 ha of evapora-tion ponds, where it completely evaporates. At an annual evaporation of about1.8m, the evaporation from the ponds is about 3.7 million m3/year. Thus, thesalts in 80 million m3 of effluent are concentrated into 3.7 million m3 of coolingtower outflow, giving a volume reduction of about 95% and a 20-fold increasein salt concentration.
Perhaps the evaporation ponds can be constructed as solar ponds, whichcan be used to generate hot water and/or electricity. For example, in anexperimental solar pond project in El Paso, Texas, the pond was 3m deep witha 1m layer of low-salinity water on top, a 1m layer of medium-salinity waterin the middle, and a 1m layer of high-salinity (brine) water at the bottom.56
This created a density gradient so that sun energy was trapped as heat in thebottom layer, while the lighter top layers prevented thermal convectioncurrents and acted as insulators. The hot brine from the bottom layer waspumped to a heat exchanger, where a working fluid like isobutane or freon wasvaporized, which then went through a turbine to generate power. The workingfluid was condensed in another heat exchanger that was cooled with normalwater, which was recirculated through a cooling tower. The working fluid thenreturned to the brine heat exchanger, where it was preheated by the brinereturn flow from the heat exchanger to the pond before it was vaporized again.The El Paso pond had a surface area of 0.3 ha and generated 60–70 kW. At thisrate, a solar pond system of about 5000 ha or an area of about 7� 7 km couldgenerate about 1000MW of electricity, which is typical of a good-sized powerplant. There was enough heat stored in the hot brine layer to also generatepower at night. The El Paso studies have demonstrated the principles of solarpower generation. Considerable research is still necessary to see how a large-scale system should be designed and managed.
Concentrating the salts into smaller and smaller volumes with revenue-producing techniques will be of special benefit to inland or other areas wheresalts need to be transported over long distances to reach suitable (or leastobjectionable) places for final disposal, such as, an ocean or a dedicated lake.Concentrating the salts into small volumes of water will then minimize thecost of pipelines and other conveyance structures. The ultimate concentrationof salt is, of course, achieved by complete evaporation of the water, so that thesalts crystallize and can be stored in perpetuity in landfills or used com-mercially if beneficial uses can be developed.
8.4.4 Future Aspects for Salinity Management in South-CentralArizona
As the population in south-central Arizona continues to increase and thePhoenix–Tucson corridor expands into a Prescott-Nogales corridor, moreand more water will be needed for municipal water supply and more and moresewage effluent will be produced. If all the main renewable water resources,i.e., the Salt River and Colorado River, were solely used for municipal water
Adverse Effects of Sewage Irrigation 259

supply, the 2500 million m3/year brought in by these rivers could supporta population of about 9 million, assuming a use of 760L/inhab.d (inhabitantper day), which is between the present of 950L/inhab.d for Phoenix and 570L/inhab.d for Tucson.53 At a sewage flow of 380L/inhab.d, the 9 million peoplewould produce 1200 million m3 of effluent per year. At an application rate of1.5m/year, this could irrigate almost 80,000 ha, urban as well as agricultural.The salt content of the effluent would be below 1000mg/L, which is the centerof the range where moderately salt-sensitive plants or crops can be grown (seeFigure 8.2). The effluent could also be used for potable water reuse via reverseosmosis followed by artificial recharge of groundwater, for cooling water forpower plants, and for environmental purposes like restoration of stream flowand riparian habitats. Potable reuse of the effluent could add another 2 or3 million people to the sustainable population. Such reuse would require moremembrane filtration, which produces reject brine that adds to the salt burden.Groundwater will be used where still available and of good quality. However,without incidental recharge from irrigation or without artificial recharge inengineered projects, natural recharge rates in dry climates are so low thatgroundwater basically is a nonrenewable resource.43
As described earlier, the salts in the water used for irrigation are con-centrated in the deep-percolation water that moves from the root zone tounderlying groundwater, where it will increase the salt content of thegroundwater. It will also cause groundwater to rise where there is no seriousoverpumping of groundwater. Eventually, groundwater must then be pumpedto prevent groundwater levels from rising too high. The salty water from thepumped wells then should be reduced in volume so that the salt in this watercan be exported in relatively small amounts of water. Such concentrationof salt into smaller volumes can be achieved with revenue-producing processes,including membrane filtration that also produces drinking water, sequentialirrigation of increasingly salt-tolerant crops, and evaporation ponds that maybe used as solar ponds for power generation. Final disposal of salt to obtainregional salt balances may then be via export to an ocean or storage inperpetuity in inland salt lakes or landfills.
REFERENCES
1. U.S. Clean Water Act, 1972.2. Bouwer, H., Integrated water management for the 21st century: problems and
solutions. Am. Soc. Civ. Engrs, 150 year Jubilee paper, J. Irrig. Drain. Eng., 128, 4,193, 2002.
3. Bouwer, H., Groundwater Hydrology, McGraw-Hill, New York, 1978.4. Lemly, A.D., Subsurface agricultural irrigation drainage: the need for regulation,
Reg. Toxicol. Pharmacol. 17, 157, 1993.5. State of California, Water Recycling Criteria. California Code of Regulations, Title
22, Division 4, Chapter 3. California Department of Health Services, Sacramento,
CA, 2000.
260 Water Reuse for Irrigation: Agriculture, Landscapes, and Turfgrass

6. World Health Organization (WHO), Health Guidelines for the Use of Wastewater inAgriculture and Aquaculture, Report of a WHO Scientific Group, Technical Report
Series 778, World Health Organization, Geneva, Switzerland, 1989.7. Bouwer, H., and Idelovitch, E., Quality requirements for irrigation with sewage
effluent. J. Irrig. Drain. Div., Am. Soc. Civil Engrs., 113, 4, 516, 1987.
8. Pettygrove, S.G., and Asano, T., Irrigation with Reclaimed Municipal Wastewater—A Guidance Manual, Lewis Publishers Inc., Chelsea, 1985.
9. California State Department of Health Services (DHS), NDMA in drinking water,
CSDHS, Sacramento, CA, 1998.10. Hoffman, G.J., and van Genuchten, M.T., Soil properties and efficient water use;
water management for salinity control, in Limitations to Efficient Water Use in CropProduction, Taylor, H.M., Jordon, W., and Sinclair, Y., eds, Am. Soc. Agronomy,
Madison, WI, 73, 1983.11. Tanji, K.K., Agricultural salinity assessment and management, Manual of
Engineering Practice No. 71, Am. Soc. Civil Engrs., Reston, VA, 1990.
12. Maas, E.V., Salt Tolerance of Plants. The Handbook of Plant Science in Agriculture,Christie, B.R., ed., CRC Press, Bora Raton, FL, 1984.
13. Food and Agriculture Organization of the United Nations (FAO), Water quality
for agriculture, FAO Irrigation and Drainage Paper 29, Ayers, R.S., and Westcott,D.W, eds., Rome, 1985.
14. Wolf, K.O., Salt River Project, personal communication, 2002.
15. Van de Graaf, A., et al., Anaerobic oxidation of ammonium is a biologicallymediated process, Appli. Environ. Microbiol., 61, 4, 1256, 1995.
16. Baier, D.C., and Fryer, W.B., Undesirable plant responses with sewage irrigation,J. Irrig, Drain. Div., Proc. Am. Soc. Civil Engrs. 99-IR2, 133,1973.
17. Bouwer, H., Agricultural chemicals and groundwater quality, J. Soil WaterConserv., 45, 184, 1990.
18. Bouwer, H., Lance, J.C., and Riggs, M.S., High-rate land treatment. II. Water
quality and economic aspects of the Flushing Meadows project, J. Water Pollut.Contr. Fed., 46, 5, 844, 1974.
19. Singer, P.C., Pyne, R.D.G., Miller, C.T., and Mojoonnier, C., Examining the
impact of aquifer storage and recovery on DBPs, J. Am. Wat. Works Assoc., Nov.,85, 1993.
20. U.S. Environmental Protection Agency, National Interim Primary Drinking WaterRegulations, EPA 570/9-76-003, Washington, DC, 1976.
21. Ozekin, K. and Westerhoff, P., Bromate formation under cryptosporidium inactiva-tion conditions, Water Quality Int., May/June, 16, 1998.
22. Zullei-Seiber, N., Your daily drugs in drinking water? State of the art for artificial
groundwater recharge, in Third Internat. Symp. on Artificial Recharge of Ground-water, Peters, J.M. and Balkema, A.A., eds., Rotterdam, The Netherlands, 405,1998.
23. Shore, L.S., et al., Induction of phytoestrogen production in Medico sativa leavesby irrigation with sewage water, Environ. Exp. Botany, 35, 363, 1995.
24. Guan, M., and Roddick, J.G., Comparison of the effects of epibrassinolide
and steroidal estrogens on adventitious root growth and early shoot developmentin mung bean cuttings, Physiol. Plant., 73, 246 1998.
25. Bradley, E.G., and Zacharewski, T.R., Exoestrogens: mechanisms of action andstrategies for identification and assessment, Environ. Toxicol. Contam., 17, 49, 1998.
26. Khan, S., and Ongerth, J., Hormonally active agents in domestic wastewatertreatment —a literature review, Report prepared for CGE Australia, 2000.
Adverse Effects of Sewage Irrigation 261

27. Lim, R., et al., Endocrine disrupting compounds in sewage treatment plants (STP)effluent reused in agriculture. Water Recycling Australia—is there a concern?
in Proc. of the First Symp. Water Recycling in Australia 2000, Adelaide, October19–20, Peter J. Dillon, ed., 2000.
28. Goodbred, S.L., Gilliom, R.J., Gross, T.S., Denslow, N.P., Bryant, W.L., and
Schoeb, T.R., Reconnaissance of 17�-estradiol, 11-ketotestosterone, vitellogenin,and gonad histopathology in common carp of United States streams: potential forcontaminant-induced endocrine disruption, U.S. Geol. Survey Open-File Report
96–627, Sacramento, CA, 1997.29. Colborn, T., Vom Saal, F.S., and Soto, A.M., Developmental effects of endocrine
disrupting chemicals in wildlife and humans, Environ. Health Perspect. 101, 378,1993.
30. Kolpin, D.W., Furlong, E., Meyer, M.T., Thurman, E.M., Zautt, S.D., Baiber,L.B., and Buxton, H.T., Pharmaceuticals, hormones, and other organic wastewatercontaminants in U.S. streams, 1999–2000: a national reconnaissance, pp. 1202–1211.
Environ. Sci. Technol., 36, 1202, 2002.31. Drewes, J.E., Heberer, T., Rauch, T., and Reddersen, K., Fate of pharmaceuticals
during ground water recharge, Ground Water Monitoring and Remediation, 23, 64,
2003.32. Bouwer, H., Simple derivation of the retardation equation and application to
preferential flow and macrodispersion, Ground Water J., 29, 1, 41, 1991.
33. Am. Soc. Agr. Engrs., Preferential flow, in Proc. 2nd International Symp, Bosch, D.,ed., Honolulu 2001.
34. McGovern, P., and McDonald, M.S., Endocrine disruptors, Water Environ.Technol., 35, 2003.
35. Henry, C.M., Antibiotic resistance, Chem. Eng. News, 78, 10, 41, 2000.36. Ray, C., Melin, G., and Linsky, R.B., Riverbank filtration, in Proc. International
Riverbank Filtration Conf., Louisville, KY, Nov. 1999, National Water Research
Inst. And USEPA, and Cincinnati Water Works, Kluwer Academic Publishers,Dordrecht, The Netherlands, 2002.
37. Melin, G., in Proc. Second International Riverbank Filtration Conf., Cincinnati, OH,
National Water Research Institute, Fountain Valley, CA, 2003.38. Hutt, P.B., Unresolved issues in the conflict between individual freedom and
government control of food safety, Ecotoxic. Environ. Safety, 2, 447, 1987.39. Ames, B.N., and L. Swirsky, G., Too many rodent carcinogens: mitogenesis
increases mutagenesis, Science, 249, 940, 1990.40. Calabrese, E.J., Animal extrapolation—a look inside the toxicologists’ black box,
J. Environ. Sci. Technol., 21, 618, 1987.
41. Lave, L.B., Ennever, F. K., Rosenkranz, H.S., and Omenn, G.S., Informationvalue of the rodent bioassay, Nature, 336, 631, 1988.
42. Crook, J., MacDonald, J.A., and Trussel, R.R., Potable use of reclaimed water,
J. AWWA, August, 40, 1999.43. Bouwer, H., Artificial recharge of groundwater: hydrogeology and engineering,
Hydrogeol. J., 10, 121, 2002.
44. Nellor, M.H., Baird, R.B., and Smith, J.R., Summary of health effects study: finalreport, County Sanitation Districts of Los Angeles County, Whittier, CA, 1984.
45. Sloss, E.M., Geschwind, S.A., McCaffrey, D.F., and Ritz, B.R., Ground-waterRecharge with Reclaimed Water: An Epidemiologic Assessment in Los Angeles
County, 1987–1991, RAND Corp., Santa Monica, CA, 1996.
262 Water Reuse for Irrigation: Agriculture, Landscapes, and Turfgrass
46. Ishaq, A.M., and Khan, A.A., Recharge of aquifers with reclaimed wastewater:a case for Saudi Arabia, Arabian J. Sci. Eng., 22, 16, 133, 1997.
47. Warner, W.S., The influence of religion on wastewater treatment, Water 21, 11–13,2000.
48. Bacon, F., see Encyclopedia Brittanica, Vol. 2. Encyclopedia Brittanica, Inc.
William Benton, Publishers, Chicago, London, Toronto, 1958, for more informa-tion about Francis Bacon.
49. Maczka, C., Pong, S., Policansky, D., and Wedge, R., Evaluating impacts of
hormonally active agents in the environment, Environ. Sci. Technol. News, 136A,2000.
50. Postel, S., Last oasis, Worldwatch Institute, Washington, DC, 1992.51. Bouwer, H., Estimating and enhancing groundwater recharge, in Groundwater
Recharge, M.L. Sharma, ed., Balkema Publishers, Rotterdam, The Netherlands,p. 1–10, 1989.
52. Swieczkowski, D., Arizona Department of Water Resources, personal communica-
tion, December 2001.53. Bouwer, H., Accumulation and management of salts in South Central
Arizona, Technical Appendix P, Central Arizona Salinity Study (CASS)–Phase I
Report, T. Poulson, ed. U.S. Bureau of Reclamation, Phoenix, AZ, andBrown and Caldwell, and 14 municipalities and water companies in Salt RiverValley, 2003.
54. Apse, M.P., Akaron, G.S., Sneeden, W.A., and Blumwald, E., Salt toleranceconferred by over-expression of a vacuolar Naþ/Hþ antiport in Aribidopsis,Science, 285, 31, 1256, 1999.
55. Shannon, M., Cervinka, V., Daniel, D.A., Drainage water reuse, in Management of
Agricultural Drainage Water Quality, Water Reports No. 13, Madromootoo, C.A.,Johnston, W.R., Wallardson, L.S., eds., Food and Agricultural Organization of theUnited Nations, Rome, Italy, 1997, Chapter 4.
56. Xu, H., Salinity Gradient Solar Ponds—A Practical Manual, Vol. 1 (Solar PondDesign & Construction) and Vol. 2 (Solar Pond Operation and Maintenance),Dept. of Industrial and Mechanical Engineering, Univ. of Texas, El Paso, TX, 1993.
Adverse Effects of Sewage Irrigation 263


9Economics of Water Recycling
for Irrigation
Joe Morris, Valentina Lazarova, and Sean Tyrrel
CONTENTS
9.1 General principles ... . . . . . . . . . . . . . . . . . . . . . . . . . . . . . . . . . . . . . . . . . . . . . . . . . . . . . . . . . 266
9.2 Financial analysis ... . . . . . . . . . . . . . . . . . . . . . . . . . . . . . . . . . . . . . . . . . . . . . . . . . . . . . . . . . 266
9.3 Economic analysis... . . . . . . . . . . . . . . . . . . . . . . . . . . . . . . . . . . . . . . . . . . . . . . . . . . . . . . . . . 267
9.4 Benefits of recycled water for irrigation ..... . . . . . . . . . . . . . . . . . . . . . . . . . . . . . 267
9.5 Factors influencing irrigation benefits .. . . . . . . . . . . . . . . . . . . . . . . . . . . . . . . . . . . 268
9.6 Components of recycling systems for irrigation..... . . . . . . . . . . . . . . . . . . . . 269
9.7 Irrigation water supply options .... . . . . . . . . . . . . . . . . . . . . . . . . . . . . . . . . . . . . . . . . 269
9.8 Water-recycling options .. .. . . . . . . . . . . . . . . . . . . . . . . . . . . . . . . . . . . . . . . . . . . . . . . . . . 271
9.9 Costs of water-recycling options ... . . . . . . . . . . . . . . . . . . . . . . . . . . . . . . . . . . . . . . . . 272
9.10 Prices for recycled water ... . . . . . . . . . . . . . . . . . . . . . . . . . . . . . . . . . . . . . . . . . . . . . . . . 275
9.11 Function of water prices... . . . . . . . . . . . . . . . . . . . . . . . . . . . . . . . . . . . . . . . . . . . . . . . . 275
9.12 Criteria for setting prices for recycled water .... . . . . . . . . . . . . . . . . . . . . . . . 277
9.13 Pricing instruments ... . . . . . . . . . . . . . . . . . . . . . . . . . . . . . . . . . . . . . . . . . . . . . . . . . . . . . . 278
9.14 Examples of recycled water prices .. .. . . . . . . . . . . . . . . . . . . . . . . . . . . . . . . . . . . . 279
9.15 Conclusions ... . . . . . . . . . . . . . . . . . . . . . . . . . . . . . . . . . . . . . . . . . . . . . . . . . . . . . . . . . . . . . . . 282
References .... . . . . . . . . . . . . . . . . . . . . . . . . . . . . . . . . . . . . . . . . . . . . . . . . . . . . . . . . . . . . . . . . . . . . . . . 282
1-56670-649-1/05/$0.00+$1.50� 2005 by CRC Press 265

This section considers the financial and economic aspects of wastewaterreuse for irrigation. Following an explanation of the distinction betweenfinancial and economic perspectives, the main benefits and costs of water
reuse for irrigation are discussed, as well as the factors influencing them.The main components of recycling systems are identified together with theoptions for wastewater recovery and supply. The characteristics of the
costs of water-recovery systems and the criteria that might be applied todetermine appropriate water-pricing strategies are disscussed. The overallmessage is that the type and scale of benefits and costs of water recyclingand reuse are very location-specific, such that generalizations are difficult
and can be misleading. Emphasis is given here to matters of principle thatcan be used to guide the economic and financial appraisal of water-recycling projects.
9.1 GENERAL PRINCIPLES
Financial and economic analyses are concerned with the identification, valua-tion, and comparison of costs and benefits with a view to judging whether
a proposed activity is worthwhile or not. In the case of wastewater recyclingfor irrigation, the analyses consider whether a particular wastewater-recoverysolution is absolutely worthwhile in itself, that is, whether the benefits are
greater than the costs. Furthermore, analyses consider whether the activity isrelatively worthwhile compared to other possible solutions, including doingnothing.
9.2 FINANCIAL ANALYSIS
Financial analysis adopts the perspective of the private individual ororganization considering whether or not to engage in a specific activity.It considers estimated revenues and costs accruing to such private parties
based on actual receipts and payments, inclusive of any subsidies receivedand taxes paid. In this respect, financial appraisal makes an assessment ofthe profitability of an activity from the viewpoint of a particular agent.
For example, a private water company is likely to decide in favor of awastewater-recovery project if the revenues from water sales will recoverthe capital and operating costs of the venture by a satisfactory marginwithin an appropriate time frame. It will make the judgment on the basis
of return on investment of this activity compared to some other one,including leaving the money in the bank.
Financial analysis is also concerned with identifying the need for funding,recognizing the patterns of cash flow over the project life, and the need forborrowing. Expensive projects involving large up-front investments with
payback over the longer term are notoriously difficult to finance and ofteninvolve public support in the form of grant, subsidies, or guarantees.
266 Water Reuse for Irrigation: Agriculture, Landscapes, and Turfgrass

9.3 ECONOMIC ANALYSIS
By comparison, economic analysis takes a broader perspective, viewing aparticular activity from the point of view of society as a whole. It appliesthe principle of profitability but from a public-interest viewpoint. Economicanalysis usually begins with a financial-type analysis, but then:
Removes the effect of subsidies and taxes, such as capital grants forinvestment in water treatment works (which are really mechanismsfor transferring money to and from government rather than real costsor benefits)
Modifies estimates of benefits and costs where the existing market priceson which they are based are considered not to represent social values,such as where protection of local markets from external competitionfor agricultural commodities keep prices artificially high
Identifies and places values on hidden, external effects, which areborne by third parties or society as a whole without compensation,such as those associated with increased or reduced environmentalpollution
Adjusts for nonincremental effects by identifying and excluding fromthe benefit assessment, for example, that part of a new investmentin a wastewater-recycling facility treatment works, which displaces anexisting provision rather than adding to it
Allows for consumer surplus, which recognizes, for example, that whenwater prices fall because of enhanced supply, existing (and some new)users derive benefits over and above the new price they actually pay(denoted by the fact that they would have been willing to pay higherprices than they did before)
These and other adjustments are made to produce an economic assess-ment of water-recycling options. Thus, compared to financial assessment, theeconomic analysis extends the boundary of the analysis to include externalimpacts, which have financial consequences for third parties, such as incomeloss to fishermen because of water pollution, and for society as a whole inthe case of damage to valued habitats. Given the nature and context ofinvestment in water recycling for irrigation, it is important that these economicdimensions be considered carefully.
9.4 BENEFITS OF RECYCLED WATER FOR IRRIGATION
As demonstrated in Chapter 1 (Table 1.2), irrigation with recycled wateris associated with numerous benefits, of which the most important foragriculture are:
Increased and/or less variable crop yieldIncreased or less variable quality of cropsOpportunities for new crop and livestock systems and products
Economics of Water Recycling for Irrigation 267

The benefits of water recycling for irrigated agriculture are thus the enhance-ment or maintenance of these types of benefits, assuming of course that recycledwater is fit for the purpose intended. For example, a case study1 from Indiademonstrated that the yields of vegetables and fish are significantly increasedas a result of wastewater irrigation. These irrigation benefits will vary accord-ing to context. Thus, the financial benefits to users of recycled water dependvery much on the overall financial value of water used for the purpose ofirrigation.
9.5 FACTORS INFLUENCING IRRIGATION BENEFITS
Generally, irrigation benefits and the value of water are highest where theavailable natural water supply, in terms of quantity, reliability, and quality,acts as a major constraint on crop production and associated yields andquality. Benefits from irrigation can be high where cropping is not feasibleat all in the absence of irrigation, as in many semi-arid areas during the dryseason. However, under these circumstances, irrigation depths applied (mm)are often high and financial benefits per unit of water applied ($/m3) are oftenrelatively low. This is often the case for cereals (including rice) and grass/foragecrops, unless these crops receive high levels of subsidy. It is true that suchcrops are commonly irrigated in tropical climates, but usually in situationswhere water is relatively plentiful or relatively cheap to deliver to the field.In many cases, however, water users do not pay the full cost of water servicessuch that, although irrigation may be financially attractive to them, theeconomic (as defined earlier) value of irrigation is sometimes questionable.
Where irrigation is supplementary to rainfall, as it is in many temperateclimates such as northern Europe, application depths are relatively lowand returns per unit of water are often relatively high. Financial benefits areparticularly high for produce where quality assurance more than yield is thekey determinant of value, such as in the case of potatoes and fresh vegetables.Such high potential benefits (sometimes exceeding US$ 2/m3) can justifyinvestment in expensive irrigation water-supply systems, including the use ofpotable water. It is noted, however, that the water-quality requirements forsuch fresh produce are often much more stringent than for crops for processingor animal feed; the World Health Organization’s guidelines2 for the useof wastewater in agriculture are an example of this. In comparison withhigh-value produce, the irrigation of other crops such as cereals, grass, andsugar beet adds limited benefits to supplemental irrigation and will not justifyhigh-cost water-supply solutions. The reality is sometimes distorted bysubsidies given to these crops (for example, under the European CommonAgricultural Policy) and through public sector subsidies for water supply,which do not require full cost recovery from users. Once again it is importantto take an economic perspective.
The key point here as far as the economics of water recycling for irriga-tion is concerned is that benefits depend on the value of water used inirrigation. From a financial viewpoint, this depends on the incentives available
268 Water Reuse for Irrigation: Agriculture, Landscapes, and Turfgrass

to farmers to add value through irrigation, inclusive of any taxes and subsidies.From an economic viewpoint, it is important, however, that the effects of thelatter are stripped away to get a better estimate of the real value of water usedin the irrigation sector, absolutely and relative to values of water use elsewhere.
This last point is also important. Recycled water delivered to irrigatorscould take the pressure off water resources elsewhere or release water forother uses. However, this does not in itself increase the value of water beyondthat of use in the irrigation sector because redirection of existing water fromirrigation to other uses could be carried out in the absence of recycling, ifthis was deemed more valuable. On a general point, recycled water shouldbe valued in terms of the use to which it is put, rather than higher value usesthat might be relieved of pressure.
9.6 COMPONENTS OF RECYCLING SYSTEMS FOR IRRIGATION
Figure 9.1 shows the options for water supply for agricultural irrigation and thevarious ways in which water treatment can be applied to deliver water ofsuitable quality. The components of this scheme are shown in Table 9.1.
9.7 IRRIGATION WATER SUPPLY OPTIONS
The conventional water-supply options for irrigation are to abstract waterfrom surface or groundwater sources (i and m, respectively, in Figure 9.1) and
Figure 9.1 Water-recycling components for irrigated agriculture (see Table 9.1 forsymbols).
Economics of Water Recycling for Irrigation 269
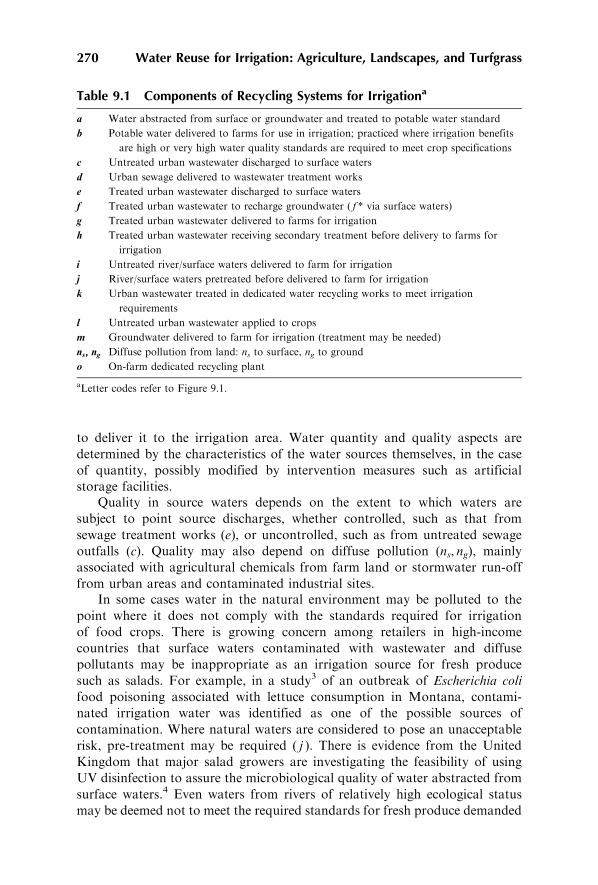
to deliver it to the irrigation area. Water quantity and quality aspects are
determined by the characteristics of the water sources themselves, in the case
of quantity, possibly modified by intervention measures such as artificial
storage facilities.Quality in source waters depends on the extent to which waters are
subject to point source discharges, whether controlled, such as that from
sewage treatment works (e), or uncontrolled, such as from untreated sewage
outfalls (c). Quality may also depend on diffuse pollution (ns, ng), mainly
associated with agricultural chemicals from farm land or stormwater run-off
from urban areas and contaminated industrial sites.In some cases water in the natural environment may be polluted to the
point where it does not comply with the standards required for irrigation
of food crops. There is growing concern among retailers in high-income
countries that surface waters contaminated with wastewater and diffuse
pollutants may be inappropriate as an irrigation source for fresh produce
such as salads. For example, in a study3 of an outbreak of Escherichia coli
food poisoning associated with lettuce consumption in Montana, contami-
nated irrigation water was identified as one of the possible sources of
contamination. Where natural waters are considered to pose an unacceptable
risk, pre-treatment may be required ( j ). There is evidence from the United
Kingdom that major salad growers are investigating the feasibility of using
UV disinfection to assure the microbiological quality of water abstracted from
surface waters.4 Even waters from rivers of relatively high ecological status
may be deemed not to meet the required standards for fresh produce demanded
Table 9.1 Components of Recycling Systems for Irrigationa
a Water abstracted from surface or groundwater and treated to potable water standard
b Potable water delivered to farms for use in irrigation; practiced where irrigation benefits
are high or very high water quality standards are required to meet crop specifications
c Untreated urban wastewater discharged to surface waters
d Urban sewage delivered to wastewater treatment works
e Treated urban wastewater discharged to surface waters
f Treated urban wastewater to recharge groundwater ( f * via surface waters)
g Treated urban wastewater delivered to farms for irrigation
h Treated urban wastewater receiving secondary treatment before delivery to farms for
irrigation
i Untreated river/surface waters delivered to farm for irrigation
j River/surface waters pretreated before delivered to farm for irrigation
k Urban wastewater treated in dedicated water recycling works to meet irrigation
requirements
l Untreated urban wastewater applied to crops
m Groundwater delivered to farm for irrigation (treatment may be needed)
ns, ng Diffuse pollution from land: ns to surface, ng to ground
o On-farm dedicated recycling plant
aLetter codes refer to Figure 9.1.
270 Water Reuse for Irrigation: Agriculture, Landscapes, and Turfgrass

by the food industry. This, together with issues of reliability of water supply,has encouraged some growers of salad crops in the United Kingdom to usepotable water supplies at water charges of US$ 1/m3 or more. A recent surveysuggests that 5% of the irrigated salad area in the United Kingdom receiveswater from the public main supply.4
In some parts of the developing world, there are examples of direct useof poor-quality, partially treated effluent and, more significantly, irrigationwith highly polluted rural and urban waters that receive untreated wastewaterdischarges (c). For example, in many urban centers in Africa, peri-urbanagriculture is flourishing. Farmers who abstract water from watercourses withurban catchments are practicing indirect reuse of urban wastewater. This wateris often highly polluted from direct discharge of sewage and runoff fromsettlements with inadequate sanitation. Surveys have shown that the micro-biological contamination of water used for irrigation may exceed by ordersof magnitude the WHO guidelines for unrestricted irrigation.2 The highdemand for fresh produce and lack of regulation of production practices meanthat this practice is likely to continue unchecked in many poor communities,discouraging improved wastewater treatment.
The foregoing circumstances describe the context for the financial andeconomic appraisal of water recycling for irrigation. The control or ‘‘counter-factual’’ against which recycling must be assessed is the use of untreated waterfrom surface or groundwater (i and m). Thus, the assessment must determinethe extra benefits and costs associated with recycling option over and abovethose options using fresh water. Generally, water recycling does not increasewater supply. There is no increment in water as such. Rather it changes itscondition and makes it fit for purpose. The key issue is whether the value ofthe uses to which the recycled water is put will recover the extra costs involvedin cleaning it up.
9.8 WATER-RECYCLING OPTIONS
The main wastewater-recycling options for irrigation are associated with thefollowing treatment schemes:
1. Treatment to a standard suited for return to either the waterenvironment or for use as irrigation water (d through e, f, or g inFigure 9.1)
2. Treatment to a standard suited for irrigation where this is higher thanthat for return to the water environment (g, where Qualityg>Qualitye,or h, or j)
3. Designated treatment of raw source water for irrigation (k)
The critical determinants are, therefore, the quality of the source and receivingwaters and the quality of water required for irrigation. If the quality demandedby irrigation is higher than that required in the river system, then some formof treatment for irrigation will be required beyond that which would be neededto permit discharge into the river and water environment.
Economics of Water Recycling for Irrigation 271

Thus, the quality standards for irrigation water are critical. These werereviewed in earlier chapters in terms of health (Chapter 3) and agronomicimpact (Chapters 2 and 5). Broadly, the standards required reflect the type,purpose, and, for the most part, the value of the crops produced. Table 9.2classifies crops by type, value, and water-quality standards. Generally, higher-value crops tend to require higher water quality standards, except where lackof regulation in some countries allows otherwise. By implication, high-valuecrops are more likely to be able to carry the higher costs associated withmeeting higher water quality standards. So, the greater the sensitivity of themarket price of a commodity to its own quality aspects, the greater will bethe justification for expenditure on water recycling for irrigation. Freshproduce delivered to quality-oriented markets offers the greatest scope forinvestment in water-recycling facilities, and industrial crops the least.
More precisely, as mentioned above, it is the value of water of a givenquality, expressed in $/m3, that captures the benefit of irrigation. This willreflect application rates (m3/ha) and the added value from irrigation afterdeducting additional costs associated with crop production (but excludingirrigation costs). It is not simply a matter of extra crop value, but of marginafter deducting crop expenses. Some high-value crops are particularlyexpensive to grow and deliver to market, especially in terms of laborcosts. They also tend to exhibit bigger variation in commodity prices thanlower-value crops and are therefore more risky. These factors need to beconsidered.
9.9 COSTS OF WATER-RECYCLING OPTIONS
The definition and valuation of the costs of a recycling installation depend onthe purpose of the analysis—whether, for example, the purpose is to determine
Table 9.2 Classification of Irrigated Crops by Type, Value, and Water-
Quality Requirements
Category Type
Unit value
of crops,
$/t equivalent
Water-quality
standards and
likely cost of
meeting these
A Industrial nonfood crops, such as timber, textile, and
energy crops
Low Low
B Processed food crops, such as sugar beet, oil seeds,
protein crops, and cereals
Unprocessed nonfood crops associated with public
contact, such as flowers
Medium Medium
C Fresh food crops or those associated with moderate
processing (excluding heating), such as fruits and
vegetables
High High
272 Water Reuse for Irrigation: Agriculture, Landscapes, and Turfgrass

overall financial feasibility, to determine charges to water users, to determinethe need for borrowing to finance the project, or whether the purpose is toassess the wider economic performance of the investment, including the valueof any environmental impact. From the outset it is important to be clear on thepurpose of the cost estimation. It is conventional to distinguish the followingcosts: initial capital costs, annual operating costs, annual fixed costs, and totalaverage annual costs.
Initial capital costs include the cost of constructing the wastewatertreatment and delivery system. These will vary according to the characteris-tics shown in Figure 9.1. They include the cost of land, design, supervision, andworks including earthworks, civil engineering (canals, pipes, and buildings),electricity supply, treatment and pumping installations, control gear, workshopand office equipment, communications, and vehicles. In some cases grants maybe available to reduce capital costs for the investor.
Capital items provide services over the life of the project, although some,such as pump equipment will require replacement at regular intervals. Thesereplacement costs need to be identified over the project life, where the latteris taken to be the economic life of the major investment items such as thecivil and mechanical engineering works, often 20–30 years for civil worksand 10–15 years for mechanical equipment.
Annual operating costs include the costs of repairs and maintenance, laborand management, fuel and energy, licenses or charges for water supply orabstraction, and sludge or bio-solid waste disposal. There may also be annualcharges for interest payment on loans, as well as subsidies and taxes, whichaffect annual costs.
Operating costs by definition vary in total according to the throughputof the plant, although they may be reasonably constant per unit of output(expressed in $/m3). Major operating costs are likely to be energy for waterlifting, repairs to treatment equipment, and labor.
It is usual to express capital investment costs as an annual equivalent fixedcost. This is derived by calculating an amortization cost for each capital itemaccording to Equation 9.1:
A ¼ P 1
�
X
n¼1
n¼20
ð1=ð1þ rÞnÞ
!
ð9:1Þ
where:
A¼ the annual amortization payment (which includes both depreciationand charges for interest on capital)
P¼ the capital investmentr¼ the annual rate of interest as a decimal paid on borrowed fundsn¼ the life of the particular capital item (20 in the example)
Aggregating these items provides an estimate of average annual fixed costs($/year). It is probably best to assume that capital items are depreciated andtherefore have zero remaining value (see Table 9.3).
Economics of Water Recycling for Irrigation 273

By definition, fixed costs are fixed in the short term, within which the
basic infrastructure and management regime of the treatment plant cannot
be changed. Thus, amortization costs are unavoidable in the short term: they
have to be paid even if the plant is not used. There may be some
other unavoidable costs that are not directly linked to the degree of use.
These include the cost of routine site maintenance, licenses, inspection,
security, and insurance.Having derived an estimate of fixed cost per year for a given treatment
plant, these can be expressed per unit of output of treated water in $/m3. For
a given plant size, fixed costs ($/m3) will be lowest when the plant is operating
at full capacity.Total average annual costs are the sum of annual fixed and total annual
operating costs. Water services are generally characterized by relatively high
capital investment costs, which means that fixed costs account for a relatively
high proportion of total average costs ($/m3). This is an important feature.
It means that generally investments of this kind usually have a relatively
economic long life (20 years or so) over which capital costs need to be
recovered. They are relatively inflexible in their cost structure in that a large
proportion of cost is unavoidable and they need relatively long-term invest-
ment funding. For these reasons, without guaranteed demand for treated
water or assistance with funding, such investments may be regarded as risky
for many private investors.The structure of costs does mean, however, that once a treatment plant
has been constructed, a large part of the costs are ‘‘sunk’’ and nonrecoverable
whether or not a treatment plant continues to operate. In the short termthis might justify operation of existing plant charges, which at least recover
operating costs, even though they fail to recover full average total costs ($/m3).
However, failure to recover full costs in the longer term, in the absence of
subsidies to make good the deficit, will lead to plant closure.Table 9.3 contains a simple example of the derivation of an average
cost ($/m3) of treated water. Depending on treatment level, plant size,
Table 9.3 Example of a Costing Method for a Water-Treatment Project
Parameter
Capital
costs ($’000)
Life
(years)
Amortization
factor at 10%
Annual
costsa ($’000)
Reservoir and civil engineering 5000 20 0.1175 587.5
Treatment equipment 1800 10 0.1627 292.9
Subtotal 880.4
Operation and maintenance 500
Total annual cost 1380.4
Water output, million m3/year 4.0
Average costa, $/m3 0.35
aConstant 2004 values.
274 Water Reuse for Irrigation: Agriculture, Landscapes, and Turfgrass

and equipment, typical wastewater treatment costs6 are in the range of0.05–0.6 $/m3.
9.10 PRICES FOR RECYCLED WATER
Setting prices for water services is a critical issue with implications for waterusers, water service providers, and, given the characteristics of water as anessential ingredient of human and natural systems, for environmental qualityand public welfare. The public good aspects of water require that decisionsabout investments in water-resource management and charging for waterservices usually incorporate a much broad range of economic, environmental,and social considerations. These will, however, be very context specific,for example, drawing distinctions between water to support rural develop-ment through irrigation in semi-arid areas and water supply for amenity usein relatively prosperous urban communities. The context will determine thenature of benefits, the distribution of these benefits, and the ability to pay forwater on the part of users.
For the most part, the scope for investment in water recovery and reusetechnologies will be greater where demand for water exceeds available freshwater supplies, where recycling and reuse can provide water fit for thepurpose, and where it is cost-effective to do so. This implies that benefitsexceed costs, absolutely and relative to other options for water supply. Insituations of water deficit, water can only be put to new uses by reducing thatgiven to existing uses. As mentioned earlier, this opportunity cost of waterat the margin of existing use determines the value of recycled water, as shownby the extra value of production generated by the last, say, thousand m3
applied in agriculture. This value sets the limit for the price to be paid toacquire water of a given quality and the costs to be incurred in its supply.
9.11 FUNCTION OF WATER PRICES
For water services that are exchanged between buyers and sellers, price denotestwo things. First, it shows a willingness to pay on the part of the buyer, andhence a measure of benefit derived in use relative to spending an equal amounton some other good or service. Second, it shows a willingness to supply onthe part of the service provider and an indication that the price receivedis sufficient to cover all (or at least a sufficient part) of the costs involvedin making the water service available.
Thus, the upper bound for water prices that irrigators will pay is thevalue of water of a given quality and reliability of supply in irrigation.This is determined by the incremental benefit of irrigation compared to rain-fed cropping (or amenity services such as gardens and sports grounds). Thiswill be the major determinant of willingness to pay where there is no alternativesupply of irrigation water. In situations where recycled water substitutesfor either abstracted water or potable water, the cost to the user of recycledwater must be less than or equal to that of existing supplies, unless of course
Economics of Water Recycling for Irrigation 275

additional quantities of the latter are no longer available. This assumes thatrecycled water and water from other sources are perfectly substitutable. Wherethere are quality differences, these will be reflected in price differentials.For example, where treated recycled water has a higher quality and/or a morereliable supply than river water, it can command a higher price. Of course,where users can freely abstract water from open-access surface and groundsources, they may face relatively low (but nevertheless positive) supply costs.Where these resources are under pressure, increased abstractions are likelyto negatively affect water qualities and quantities for other users and forthe water environment. Although water recycling can take pressure off thesenatural sources, this is not a substitute for addressing the failure to managenatural sources properly, including definition of water rights. Indeed, suchmarket failures are likely to make water-recycling projects appear relativelyexpensive, when in fact the costs of uncontrolled abstraction are high, veryreal, but not readily apparent.
A similar and common situation arises where existing managed potablewater supplies are heavily subsidized by municipal or regional authorities.Water prices are commonly set at levels below full cost recovery in many partsof the world, often for political reasons, even though the world’s poorestpeople usually do not have access to this subsidized water. Subsidized pricesnot only tend to discourage wise use of water among those who often couldafford to pay more, but may also reduce the incentive for investment in watertreatment and reuse.
Where recycled water is provided for nonpotable uses, especially irrigation,it is often offered at a lower price than potable water to encourage its use. Thisprice discounting, combined with underpricing of potable water, has meantthat few recycling projects attain financial sustainability with full cost recovery.For example, a recent survey of 79 projects7 found that only 5 in the UnitedStates and 7 elsewhere recovered full costs. For the other U.S. projects,operating revenues covered between 0 and 80% of the full cost, implying a highlevel of subsidy.
Of course, following the earlier discussion, it does not mean that failure torecover costs directly from users implies that reuse schemes are uneconomic:the costs of water-reuse schemes may be justified in terms of broad economic,social, and environmental objectives where the overall target is wise use ofavailable water supplies in support of local, regional, or national developmentobjectives. For example, the wider contribution of water-reuse schemes toregional development may exceed the direct benefits accruing to individualusers and their ability to pay for the full cost of a scheme. Here water reuseis serving important strategic objectives. Nevertheless, it is important that fullcosts are identified, that subsidies if they are provided are transparent andjustified against objectives, and that the implications of providing water tousers at less than full costs are understood and deemed appropriate to thosewho fund the subsidies.
For these reasons it is important that water recycling for irrigationis regarded in the context of an overall water resource management strategy.
276 Water Reuse for Irrigation: Agriculture, Landscapes, and Turfgrass

This involves segmenting the market for water according to different uses, withwater quality and security of supply defined accordingly and recycled watertargeted at specific uses where benefits exceed costs. For a large waterservice provider, there may in practice be a degree of cross-subsidy, wheredifferent willingness to pay between potable and ‘‘grey’’ water markets canbe exploited, where revenue from potable water users may be used to fundlower-quality grey water systems as a preferred option to investment in moreexpensive potable water projects.
9.12 CRITERIA FOR SETTING PRICES FOR RECYCLED WATER
Pricing decisions vary according to circumstances, as discussed above. Muchdepends on whether prices are set by a commercial organization with a viewto obtaining a return on investment or, in the case of public investment,whether the purpose is to achieve nonprofit objectives such as economicdevelopment or wise water use.
Where the investment is private, pricing will be set to recover full costsand provide a satisfactory rate of return on investment. The private operatorwill predict market demand and willingness to pay for water quality andsecurity of supply and the sensitivity of demand to changes in prices in eachsegment of the market where the latter might be distinguished in terms ofwater quality or geographical zone. Given the potential for sole, monopolisticwater suppliers to exploit customers in noncontested markets, prices may besubject to external regulation.
Where the supply agency is a not-for-profit organization, water pricingwill reflect the objectives to be achieved. These could include cost recovery(part or all), revenue raising beyond cost recovery, wise and efficient useof water, or management objectives such as assistance to a particular usergroup, regional development, or environmental protection. Thus, actual pricescould vary according to the objectives concerned.
Overall, however, the ceiling for price setting will be the willingness andability of users to pay. Where development objectives are important, usersare relatively poor, or where water supply provides benefits beyond usersthemselves, there may be a case for subsidies. Here user charges can be setto ensure proper operation and maintenance of the scheme at its designspecification. All or part of capital investment costs might be funded throughthe public purse and written off as a development cost in the same waythat investments are made in public infrastructure such as roads. In someinstances, part of the cost of recycled water supply might be recovered throughother taxes on water users, such as through controlled prices for industrialcrops such as cotton or sugar cane or government land development or incometaxes.
In situations where water is short in supply and the benefits of irrigationare high, users will express a strong willingness to pay for water. They may,in economic terminology, demonstrate price inelasticity of demand wherebywater consumption is not very sensitive to change in prices (at existing price
Economics of Water Recycling for Irrigation 277