Our Gendered Identities. Gendered Identities Sex Gender identity. Gender (or gender role)
Upload
stella-clarkCategory
view
212download
0
Women on the Edge:Gendered Political Economy Past and Present
Dr. Sunghee ChoiDr. Marie FrancoisCalifornia State University Channel Islands

Overview of women and the American economy
Some Definitions and Snapshots
How we got here
Why are women more economically insecure?
What to do about it

Some Definitions
Economic security = having enough money to cover the basics (rent, food, child care, health care, transportation, taxes), and enough to develop savings and assets
Self-sufficiency standard income needed for family of specific size living in
particular county to meet minimal basic needs includes daily costs – housing, food, child care, out-
of-pocket medical expenses, transportation
Federal poverty level developed in 1960s, still used to determine eligibility for public
programs fails to take into account housing and transportation costs,
geography, and increasing child care costs

Snapshots in 2008
California USA
20% of working families suffer economic hardship – earnings don’t meet needs
full-time working women’s median income fell at nearly 2x rate of working men
Median monthly income of economically insecure families = $1,735($1,000 short of basic needs)
women’s median income: $36,451 in 2007 fell to $35,745 in 2008
Data from www.cepr.net and www.wowonline.org

“Poverty” vs. “Self-Sufficiency” 2008 measures
Family of 4 — whether in high cost market like San Francisco or more affordable like Baton Rouge —federal poverty level $22,050 annual household earnings
Ventura County, Self-Sufficiency Standard:-- family of 2 parents, 2 kids needed $49,154 to $70,589 annual earnings depending on children’s ages (preschoolers the most expensive) -- family of 1 parent, 3 children, $54,554 to $92,979
SSS data for California by county at InsightCCED.org
The federal poverty line is set too low to accurately measure hardship

Ventura County
10.2% females at less than 100% of poverty level (males 7.8%) in 2008
2x as many women ages 18-64 (19%) uninsured than men (9%) in 2007
Poverty rate greatest for women who are not high school grads (19.5%) compared to women with bachelor’s degrees (2.9%)
Overall unemployment rising:August 2008 7.0%August 2009 11.2% 44,000 people

How’d we get here?Economic, political, and ideological structures are built, and can be rebuilt

History of gendered economics
Enlightenment and Liberalism Broke down community-based traditions of work and well-
being, brought cult of (male) individual work of women in family invisible, ignored working women Citizens (i.e. voters), and in theory workers, only male
Ideology of “breadwinners” as male, yet: 5% married, 41% single women in workforce 1890 61% married, 69% single women in workforce 1995
Women effectively barred from lucrative work More reproductive responsibility Fewer educational opportunities By 1940, 70% firms had sex restrictions

Policies are human constructions, let’s make good ones
Late 1800s - Progressive women put welfare on national agenda – public programs to “offset regularly occurring events outside control of individuals”*
1910 - 1st minimum wage law – aimed at women & children
1920 - women won vote, but still 2nd class economic citizens
Social Security, Medicare, AFDC (now TANF), etc. – result of policy choices within specific contexts
1963 Equal Pay Act – did not eradicate discrimination, wage gap has grown
*Nelson, “Origins of the Two-Channel Welfare State,” p. 126

Why are women more economically insecure?
Economic Restructuring and Globalization
Occupational Sex Segregation Gender Stereotyping and Discrimination Welfare Reform and Gender Implications Child Care Dilemma Retirement and Elderly Women

Economic Restructuring and Globalization
Increasing Job Insecurity Deepening Dual Labor Market Growing Income Inequality
Results: Increasing number of women in low wage, temporary, contract and contingent employment, mostly in service industry.

Occupational Sex Segregation
Positive Changes during 1961-2001 Women engineers (1% to 10%) Women Physicians (6% to 29.3%) Women College Professors (19 5% to
43.3%) Younger, highly educated, white, and
full-time female workers benefitted most from positive change.
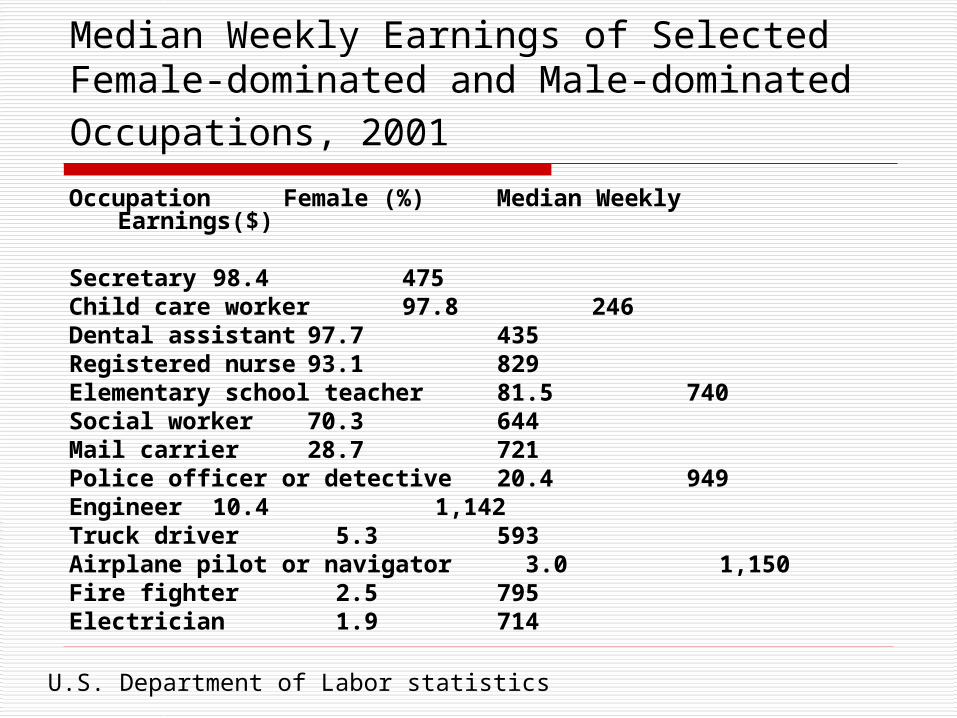
Median Weekly Earnings of Selected Female-dominated and Male-dominated Occupations, 2001 Occupation Female (%) Median
Weekly Earnings($)
Secretary 98.4 475Child care worker 97.8 246Dental assistant 97.7 435Registered nurse 93.1 829Elementary school teacher 81.5 740Social worker 70.3 644Mail carrier 28.7 721Police officer or detective 20.4 949Engineer 10.4 1,142Truck driver 5.3 593Airplane pilot or navigator 3.0 1,150Fire fighter 2.5 795Electrician 1.9 714
U.S. Department of Labor statistics

Why do we care about occupational sex segregation?
It limits women’s employment opportunities. It reinforces gender stereotypes and sexist
ideology of devaluing women’s work. Female-dominated jobs are less prestigious
and pay less than male-dominated jobs. Women with lower education and minority
women are more likely to be in sex-typical jobs.

Gender Stereotyping and Discrimination
Narrowing, but persistent Gender Wage Gap Whites: 75.7%; African Americans: 85.7%;
Hispanic Americans: 91.1% (2001) Gender earning gap for a comparable education
level persists. Motherhood Penalty
A wage penalty of 7% per child Higher penalty for married women with children
than unmarried women with children
The Lilly Ledbetter Fair Pay Act (2009)
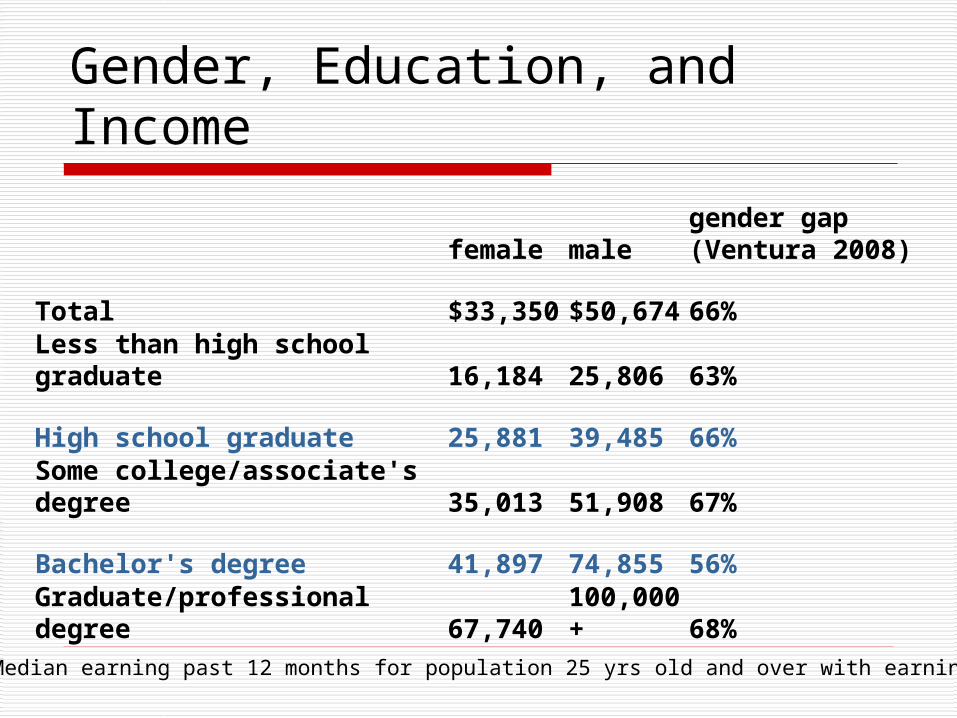
Gender, Education, and Income
female malegender gap (Ventura 2008)
Total $33,350 $50,674 66%
Less than high school graduate 16,184 25,806 63%
High school graduate 25,881 39,485 66%Some college/associate's degree 35,013 51,908 67%
Bachelor's degree 41,897 74,855 56%
Graduate/professional degree 67,740 100,000+ 68%
Median earning past 12 months for population 25 yrs old and over with earnings

Welfare Reform and Gender Implication
“Great Risk Shift” (Hacker) The work-first model does not work for majority
of welfare recipients, due to limited education and family needs (child care).
After leaving welfare, most move into low-wage jobs.
The work-first model doesn’t work for immigrant and minority women either.
Marriage is not the solution. Successful Programs: California Community
Colleges and CARE

Child Care Dilemma The Family and Medical Family Leave Act
(1993) Men are less likely to leave work More costly for women’s job security and
wage No official government policy mandating
paid parental leave Little government childcare subsidy for
low income families Little support from corporations and
businesses -- local best practices?

Retirement and Gender Implication
Structural Legacies: lower earnings, fewer job benefits, employment interruptions
Longevity -- women outlive men Higher poverty rate among elderly women
living alone, particularly minority elderly women over 85.
By 2020, most poor elderly will be women.

What can we do to make changes?Collective Action Works!
Civil rights movement included welfare rights 1960 – 745,000 families on AFDC 1972 – 3 million families on AFDC*
“Made in L.A.” Garment workers successful boycott of Forever 21
South Korean female textile workers catalysts for transition to democracy
Living Wage Campaign – CAUSE
*Piven and Cloward, “Poor People’s Movements”

Education and Empowerment support better policies, such as . . .
TANF reauthorization 2010 – keep access to postsecondary education for recipients
Paycheck Fairness Act pending in U.S. Senate AND California AB 793 State Lilly Ledbetter Fair Wage Act of 2009
California AB 119 prohibits gender discrimination in individual health insurance and health plan rates
Support development of new poverty measures
THANK YOU