
WA2 *TR -7- 04O · wa2 *tr -7- 04o 1,2 afosr tr final report characterization and measurement of...
168
WA2 *TR - 7- 04O 1,2 AFOSR TR FINAL REPORT CHARACTERIZATION AND MEASUREMENT OF DEFECTS IN THE VICINITY OF FASTENER HOLES BY NONDESTRUCTIVE INSPECTION PAUL F. PACKI4AN R.M. STOCKTON J.M. LARSEN 'DEPARTMENT OF MATERIALS SCIENCES AND METALLURGICAL ENGINEERING VANDERBILT UNIVERSITY NASHVILLE,, TN. 37235 This. Research was Sponsored by the AIR FORCE OFFICE OF SCIEN4TIFIC RESEARCH C Through Contract Number F44620-73-C-0073 September 1975 f I DEPARTMENTVANDERBlLT-UNIVER~ . lT3 -,DEARTENTOF 'MATERIALSSCIENCE- AND -ENGNEERINGý DISTRIBUTION OF. THI&~DOCUMENT ,IS UNLIMITED) AIR. FORCE; OJMFIC OF SCIEýNTlIF-IC RSEAARCH(AlSO) NOIE' OF. TRANSO=~AL -TODD 2 Ths ic~tce1 ~'~rt ~S ben eviwedand-is
Transcript of WA2 *TR -7- 04O · wa2 *tr -7- 04o 1,2 afosr tr final report characterization and measurement of...

WA2 *TR - 7- 04O 1,2
AFOSR TR FINAL REPORT
CHARACTERIZATION AND MEASUREMENT OF DEFECTS IN THE VICINITY
OF FASTENER HOLES BY NONDESTRUCTIVE INSPECTION
PAUL F. PACKI4ANR.M. STOCKTON
J.M. LARSEN
'DEPARTMENT OF MATERIALS SCIENCES AND METALLURGICAL ENGINEERINGVANDERBILT UNIVERSITYNASHVILLE,, TN. 37235
This. Research was Sponsored by the
AIR FORCE OFFICE OF SCIEN4TIFIC RESEARCH CThrough Contract Number F44620-73-C-0073
September 1975
f I DEPARTMENTVANDERBlLT-UNIVER~ .lT3
-,DEARTENTOF 'MATERIALSSCIENCE- AND -ENGNEERINGý
DISTRIBUTION OF. THI&~DOCUMENT ,IS UNLIMITED)
AIR. FORCE; OJMFIC OF SCIEýNTlIF-IC RSEAARCH(AlSO)NOIE' OF. TRANSO=~AL -TODD2 Ths ic~tce1 ~'~rt ~S ben eviwedand-is
/5 AF6SRR-
•HARACTERIZATION AND MEASUREMENT OFDEFECTS IN THE VICINITYS OF FASTENER 10"-S BY ONDESTRUCTIVE INSPECTION-
/~ ~ PAL F.PCKMANj
-r ý %TOCKTON
J.�� LRSEN
DEPARTMENT OF MATERIALS SCIENCES AND METALLURGICAL ENGINEERING
VANDERBILT UNIVERSITYNASHVILLE, TN. 37235
This Research Was Sponsored By The
AIR FORCE. OFFICE OF SCIENTIFIC RESEARCH
Through Contract N F44627-73-C-/ 73
rl.fa
DISTRIBUTION OF THIS DOCUMENT IS UNLIMITED
A' _ _ _ _ _ _ _ _ _ _ _ _ _ _
UNCLASSI1VIED - .
SECURITY CILASSIFICATIOII ')r T141S rA(Gt (Ibho 1)nta :.ee
REPORT DOCUMENTATION PAGE B EATFORE uc~cN
1 jPOR1 NU%%8ER 2OV. G A,ýCESSIOM NO 3. RECIPIt.NT'S CATALOG NUMI4LR
4. TITLE (and Subtitle) 5. TYPE OF REPORT A PERIOD COVERED
CHARACTERIZATION AND MEASURDI1ENT OF DEFECTS IN FINALTHE'VICINITY OF FASTENER HOLES BY NONDESTRUCTIVEINSPECTION G. PERcORMING ORG. REPORT NUMBeF.
7. AUTiJOR1i) S. CONTRACT OR GRANT NUMOER(.9)
P FPACRMAN ',R M STOCKTON -F44620-73-C-0073 .J M LARSEN
9. PER;FORMING ON1GANIZAtION NAME .AN.7pR E SS 10. PROGRAM ELEMENT, PRO.;ECT. TASK
VANDERBILT UNIVERSITY AREA & WORK UNIT NUMBERS
P 0 BOX 3245, STATION B .§81-307NASHVILLE, TENNESSEE 37235 6782-05F
11. CONTROLLING OVViCL NAME AND AT)CRESS 12. REPOR- DATE
AIR FORCE OFFICE OF SCIENTIFIC RESEARCHI/NA -Sept 1975BUILDING 41`0 13. NUMBER or FPAGES
14. MONITORING AGENCY AME & AOORESf ditffere'nt 'fromn Controlling Office) 15. SECUJRITY CLASS. (of this report)
UN4CLASSIFIED'150. DECL ASS! A CATION~ COWNGRA:ANG
SCH~EDULE
76 t)YTNiO4iuTION STATEMENT (of this Report)
Lpproved for public release; distribution unlimited.
7. ISTRIBUTION STATEMENT (of the abstract entered in Block 20. 11 different from Report)
18. SUJPPLEMAENTARY NOTES
19. KEY WORDS (Continue on revorae side It noce3sary and Identify by block number)DEFECT DEETECTION41 FATIGUE CRACKSNONDESTRUCTIVE INSPECTIONULTRASONICSEDDY CURRENTSBOLT HOLES
advacednonestuctve nspctin tstig ad sgna prcesingtechniques that.
d e f e t s a s o c i t e d i t h a s t n e r o l e s T h e p r o g a m c n d et e c t io n o fa l e
stde desgne _o pnetgt hsýjhtllria n ehnclarallelit~
SECURITY CLASSIFICATION OF THIS PAGE(I$17tn Pita Entered)
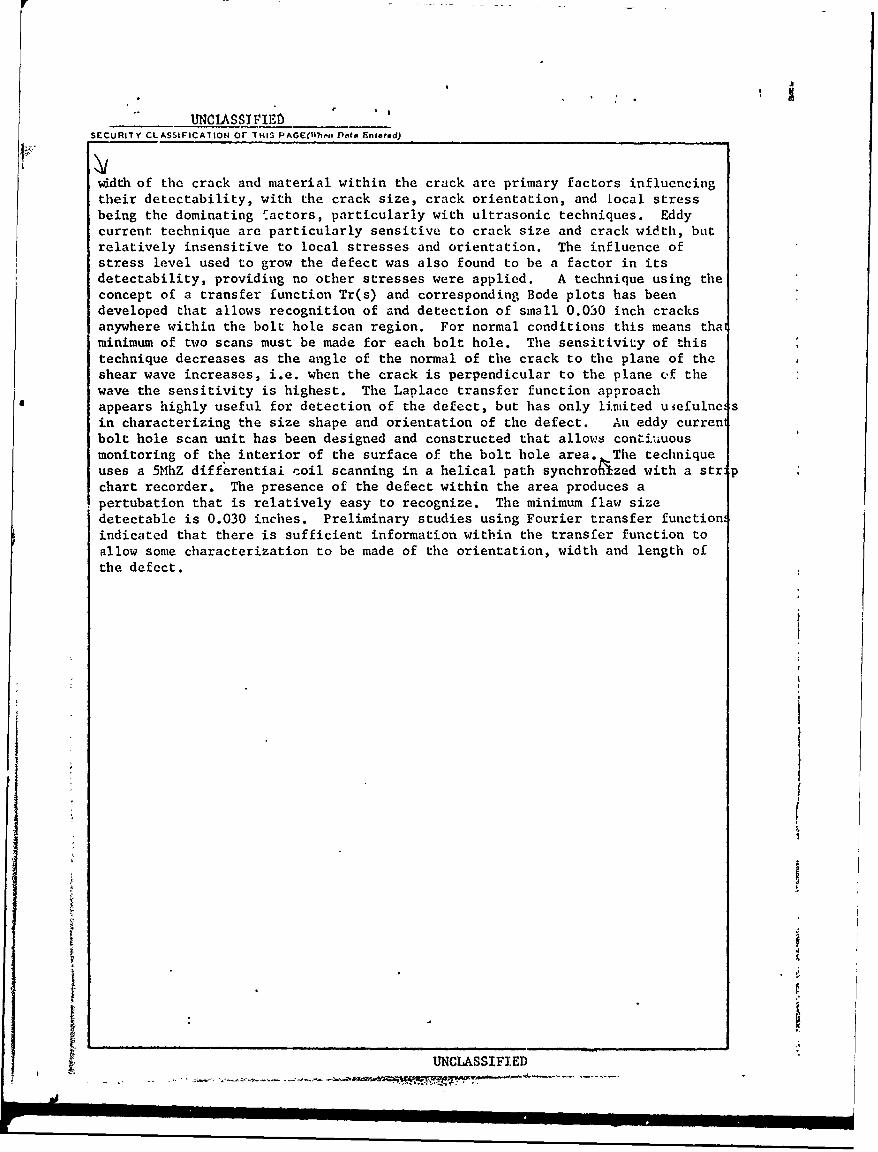
width of the crack and material within the crack are primary factors influencingtheir detectability, with the crack size, crack orientation, and local stressbeing the dominating 'actors, particularly with ultrasonic techniques. Eddycurrent technique are particularly sensitive to crack size and crack width, butrelatively insensitive to local stresses and orientation. The influence ofstress level used to grow the defect was also found to be a factor in itsdetectability, providing no other stresses were applied. A technique using theconcept of a transfer function Tr(s) and corresponding Bode plots has beendeveloped that allows recognition of and detection of small 0.030 inch cracksanywhere within the bolt hole scan region. For normal conditions this means thalminimum of two scans must be made for each bolt hole. The sensitivity of thistechnique decreases as the angle of the normal of the crack to the plane of theshear wave increases, i.e. when the crack is perpendicular to the plane (f thewave the sensitivity is highest. The Laplace transfer function approachappears highly useful for detection of the defect, but has only limited uiefulne sin characterizing the size shape and orientation of the defect. An eddy currenibolt hole scan unit has been designed and constructed that allows continuousmonitoring of the interior of the surface of the bolt hole area. The techniqueuses a 5MhZ differentiai coil scanning in a helical path synchrohzed with a str pchart recorder. The presence of the defect within the area produces apertubation that is relatively easy to recognize. The minimum flaw sizedetectable is 0.030 inches. Preliminary studies using Fourier transfer function!indicated that there is sufficient information within the transfer function toallow some characterization to be made of the orientation, width and length ofthe defect.
I
- NCASIFE
ACKNOWLEDGEMENTS
The authors wish to acknowledge the support and assistance
of the faculty and staff of the Department of Materials
Sciences and Metallurgy of Vanderbilt University during the
conduct of this research program. We also wish to extend our
appreciation to the Computer Center of Vanderbilt University
for their assistance and patience.
Finally the authors wish to extend their thanks to Mr.
William Waiker, AFOSF for his continued financial support
and patience and encouragement in this program, and to Dr.
Pommerantz formerly of AFOSR for his interest and encourageiaent.
Nashville, TennesseeSeptember 1975
ilk ii~i

ABSTRACT
This report describes the work conducted under a program
deE.igned to develop advanced nondestructive inspection testing
and signal processing techniques that can be used to improve
the capability and reproducibility of detection of defects
associated with fastener holes. The program consisted of
parallel studies designed to investigate those metallurgical
and mechanical characteristics associated with flaws in the
vicinity of straight shank fastener holes that would influence
their detectability. Two NDI procedures were used; shear
wave ultrasonics and eddy current. The results show that crack
size, local stresses, width of the crack and material within
the crack are the primary factors influencing their detectability,
with the crack size,crack orientation and local stresses
being the dominating factors, particularly with ultrasonic
techniques. Eddy current techniques are particularly sensitive
to crack size, and crack width, but relatively insensitive to
local stresses and orientation. The influence of stress level
used to grow the defect was also found to be a factor in its
detectability, providing no other stresses were applied.
A technique using the concept of a transfer function
Tg(s) and corresponding Bode plots has been developed that
allows recognition of and detection of small 0.030 inch cracks
anywhere within the bolt hole scan region. For normal conditions
this means that a minimum of two scans must be made for each
bolt hole. The sensitivity of this technique decreases
as the angle of the normal of the crack to the plane of the
iv
shear wave increaseswith-cracks perpendicular to the plane, of
the wave, the sensitivity is highest. The Laplace transfer
function approach appears highly useful for detection of the
occurance of the defect, but has only limited usefulness in
characterizing the size: shape and orientation of the defect.
An eddy current bolt hole scan unit has been designed and
constructed that allows continuous monitoring of the interior
of the surface of the bolt hole area. The technique usesI
a 5 mhz differential coil scanning in a helical path synchronized
with a strip chart recorder. The presence of the defect within
the area produces a pertubation that is relatively easily
recognizable. The minimum flaw size detectable is 0.030.
Preliminary studies using Fourier transfer functions indicated
that thece is sufficient information within the transfer function
to allow some characterization to be made of the orientation,
width and length of the defect
V
CONTENTS
SECTION PAGE
ACKNOWLEDGEMENTS ............................... iiiABSTRACT ........................................ iv
I INTRODUCTION ......... .......................... 1II PROGRAM OBJECTIVES ..................... ........ 4III TEST SPECIMENS .......................... ....... 6
Part Through Cracks in Flat Plates ........... 6Part Through Cracks Eminating From FastenerHoles .......................................... 6EDM Notches .................................... 8Plates with Fastener and Defect ................ 9Fastener Hole .....
IV ULTRASONICS ...................................... 15Introduction .............. ... *......... 15Comparison of Signals Reflected From Cracksand EDM Notches ....... 16Effect of Fatigue Stress Ratio ................. 22Effect of Crack Closure ........................ 24Effect of Load Cycling ......................... 34Effect of Hold Time ....... .*.... ............. 41Effect of Corrosion ... ................... 46
V INDICIA ANALYSIS ............................... 48Introduction ...... ..................... 48Geometric Concept of Indiciun ................ 49Transducer Characteristics Influencing IndiciaAnalysis ...... ... 0 ...... *00.09 - 9* .... * .. .....Closed Form Solution for Indicia ............... 61Effect of Defect Orientation in Bolt Hole ...... 70
VI TRANSFER FUNCTION ANALYSIS ..................... 74Introduction ...................... ......... 74Impulse Analysis ..... *.....lot.................. 83Impulse Analysis of Indicium ................... 83
VII EDDY CURRENT BOLT HOLE PROBE ................... 92Fundamental Eddy Current Concepts .............. 92Helical Scan Bolt Hole Probe Design ............ 101Specimen Configuration ................ . o...... 106Eddy Current Results ........................... 108Direct Correlation of Signal Height ............ 120Transfer Analysis of Eddy Current Signals .. 125
VIII SUMMARY .... ....... 9 ......... 9 ... ..... 9 ..... o... 134IX REFERENCES ........ t o9 .. ..99 . .. # ..9. ,. ..... 138X TABLES ................ o.............9. *... ...... 140
vi
LIST OF FIGURES
FIGURE NUMBER PAGE
I. Scher.-tic Showing Part Through Fatigue Crack inAluminum Plate ...... ............... .......................... 7
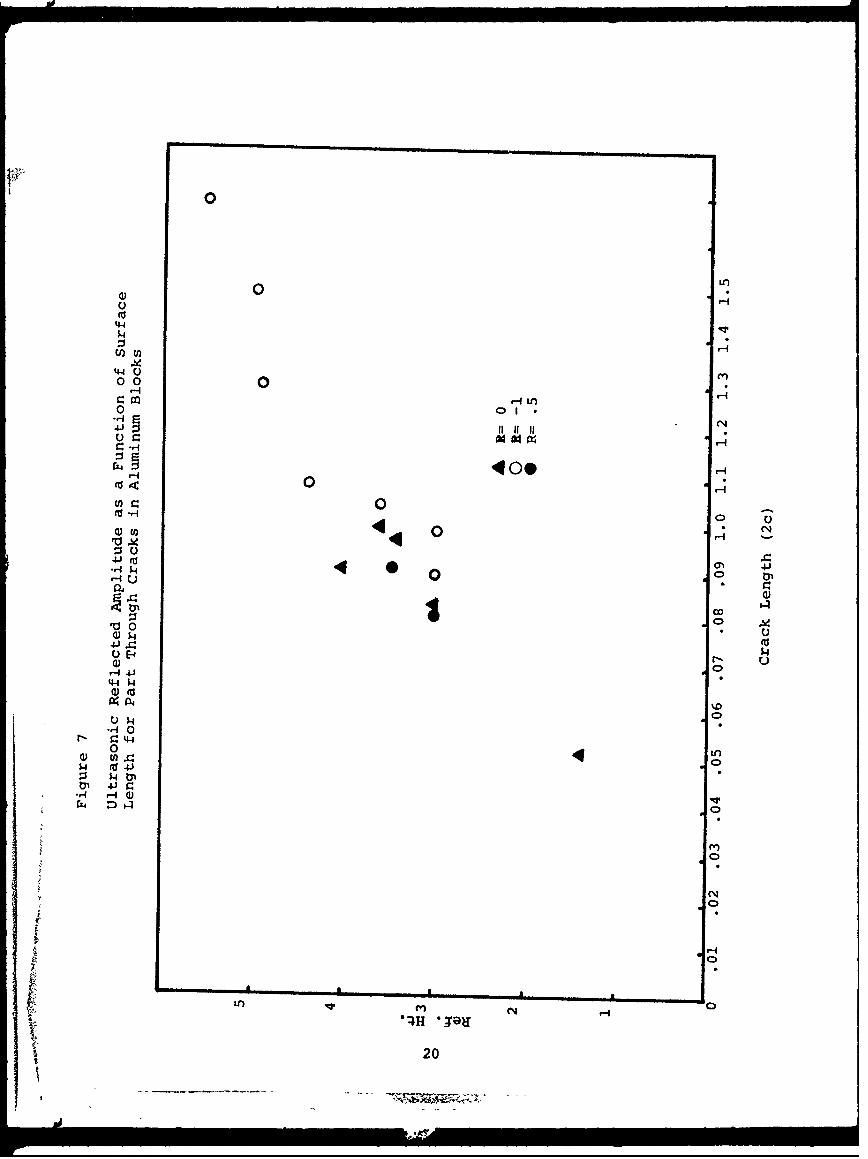
2. Typical Defects Associated with Fastener Holes .............. 103. Fastener Arrays ...................................................... .114. Fastener Arrays KC 130 (Reference 5) ....................... 125. Tapered Shank Fasteners ...................................... . 146. Typical Shear Wave Ultrasonic Setup for Defect Detection .... 177. Ultrastnic Reflected Amplitude as a Function of Surface
Length lor Part Through Cracks in Aluminum Blocks ......... 2084 Ultrasonic Ref'lected Amplitude as a Function of Crack
-.:nl7.h, (After Yee(9)) ............ .......... ................ 219. 72:ttýx>-)nic R, flected Signal Intensity for Fatigue Cracks
,,, at Differing Fatigue Stress Ratios, R ................. 2310. ;z-amatic Illustrating Crack Closure (After Elber(10)) ....... 2611. ~Effect of Stress Ratio (R) on Closure Stress ................ 2712. Effect of External Applied Stress on Ultrasonic Reflected
Signal for Part Through Cracks ............... 0........... 29Effect of External Stress on Ultrasonic Signal forTitanium Specimens ........................................ 30
14. ;ffect of External Stress on Ultrasonic Signals from CracksGrowing out of Fastener Holes ................... 31
15. Effect of External Stress on Reflected Signals from EDMNotches in Aluminum ........ .. . .... .. ...... ..... ........ 32
16. Effect of External Stress on Reflected Signals from FatigueCracks Growing Out of Fastener Holes in 7075-T6 ............. 33
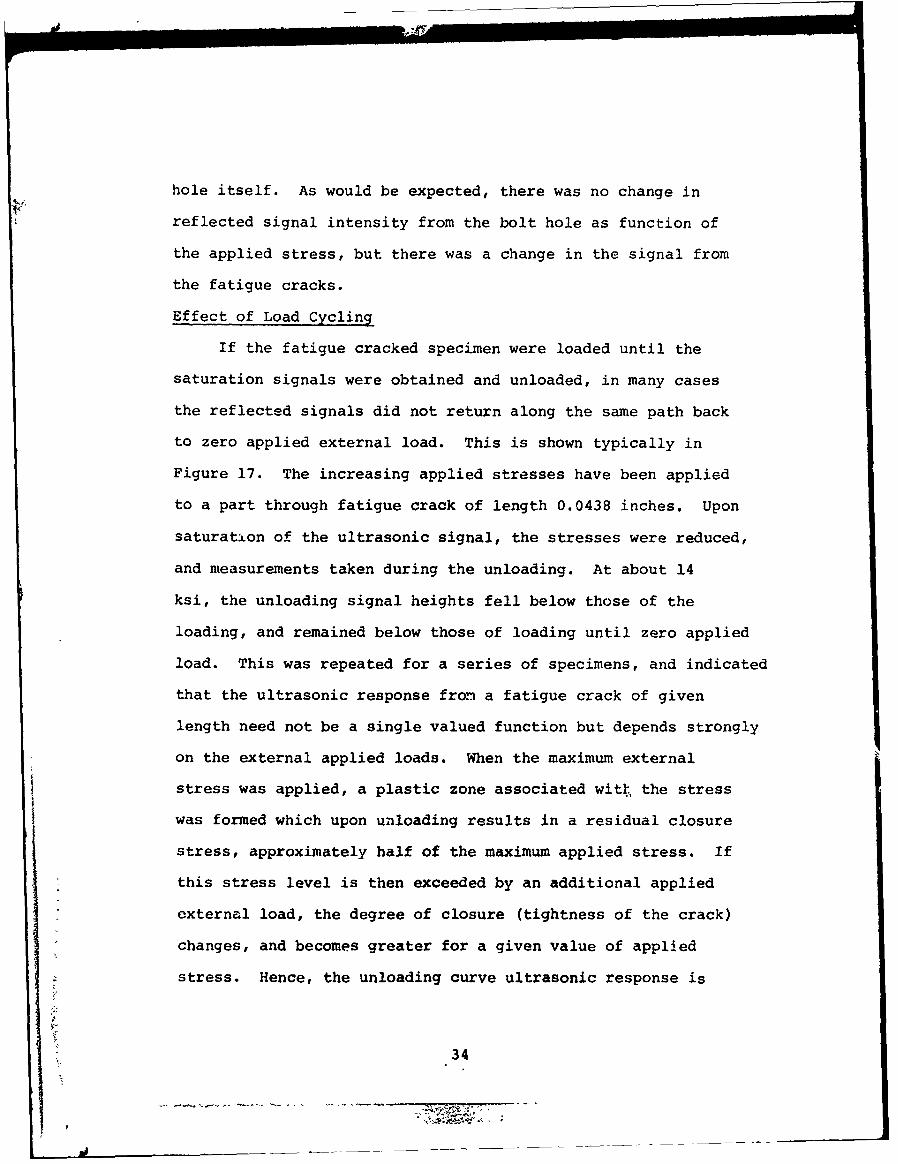
17. Effect of Loading and Unloading on Ultrasonic Signals fromPart Through Cracks in Aluminum 7075-T6 .............. 35
18. Effect of Low External Stresses on Ultrasonic Signals fromPart Through Crack .......................................... 38
19. Effect of Compressive Stresses on Ultrasonic Signals fromPart Through Cracks in Aluminum 7075-T9 ................... 39
20. Theoretical Curves for Percent Reflection and TransmittanceAcross Air Gap in Aluminum and Steel ........................ 40
21. Schematic Showing Effect of Tension-Compression Cycle onUltrasonic Signal ................................ ................. 42
22. Effect of Hold Time After UnlozAing on Ultrasonic Signals FromPart Through Cracks .................................... 43
23. Effect of Hold Time at Applied Load on Reflected UltrasonicSignals in rart Through Cracks 45
24. Qgwo* D•rh Measurements of Large Defects in Welded Structures.50
25. Shear Wave Ultrasonic Scan of Bolt Hole for IndiciaMeasurements ............................................. 51
26. A Scan Showing Multiple Reflections From Shear Wave in FlatPlate Containing a Defect ....................... . ... 53Io o e eo'o e - o e o oo o o l o o
I:
LIST OF FIGURES (Continued)
27. Shear Wave Indicia for Bolt Hole in 0.5 InchPlate Without Defects .................... ....................... 55
28. Indicia Scan From Shear Wave Investigation ofBolt Hole Containing Defect in ImmediateVicinity of Plate ......................................... 55
29. Indicia Scan From Shear Wave Investigation of0.5 inch Diameter Hole With 0.030 Inch Defectin Lower Surface of Plate ........... ................... 56
30. Effect of Transducer Frequency on IndiciumMeasurement of Defect in Vicinity of Bolt Hole.Defect is 0.035 inches Located on Bottom Surface of Plate.. 59
31. Influence of Gating on Indicium of Bolt Hole Containing0.035 inch Defect on Bottom of Plate ...................... 60
32. Calculated Half Angle Beam Divergence for 2.5, 5, and 10 MhzTransducers Evaluated in the Program ....................... 62
33. Effect of Probe Pressure Pattern Angle on Indicia ofSphere ............... ..... . .. . . .. . .. . ........... 64
34. Experimental Form of Indicia for Equivalent Scan ofFigure 33 .......... #.. . 0 . . 65
35. Effect of Transducer Position on Scan on Indicia ofBolt Hole Containing 0.030 inch Defect ....... o ... 67
36. Effect of Gating on Indicia of Defect and Bolt Hole ... e... 6837. Indicia of Bolt Hole Containing Two Defects 1800
Apart. Defects are 0.025 inches Long and 0.040 ............ 6938. Effect of Orientation of Defect to Direction of
Transducer Scan on Indicia ...... 7239. Plot of Percent of Distance Across Indicia of Defect
Indication as a Function of Angle of Orientation of DefectWith Respect to Transducer Scan ........................... 73
40. Dirac Impulse Function Whose Laplace Transform is Unity .... 7741. Response Function for First Order Differential Equation .... 7842. Transfer Function for Second Order Differential Equation,
Variable is the Dek"ping Ratio .......... . ............... 8043. Bode Plot for Single Pole Transfer Function ............... 8144. Bode Plot for Second Order Transfer Function ............... 8245. Bode Plot of Transfer Function for Bolt Hole Without
Defects .. . . . . . . .......... 8546. a. Bode Plot for Transfer Function for Bolt Hole
Containing Small Defect .,.* , ..... ...... ... ............. . 89b. Bode Plots for Transfer Function for Bolt HoleContaining Small Defects as a Function of the Positionof the Transducer Scan. .... . ... .. ... . .............. . . 90c. Bode Plots frr Transfer Function for Bolt HoleInterference FFastener Containing Defect in Vicinityof Fastener Hole With Fastener Still in Place .............. 91
47. Schematic Showing, Generation of Eddy Currents .... n... 9348. a. Impedance as a Function of ........ 97
b. Impedance as a Function of Permeability andConductivity ..... 97c. Impedance as a Function of Crack Length.....o.......... 97
49. Current Density (Jx) as a Function of Reduced SurfaceDepth of Penetrant (21)...,.... ......................... . 99
viii
i
LIST OF FIGURES (Continued)
50. Helical Scan Eddy Current Unit ............................ 10251. Close up of Eddy Current Probe Entering Bolt Hole ......... 10452. Detail of Typical Test Block (Steel) and Schematic
Showing EDM Notch Configurations .......................... 10753. Eddy Current Scan, BB- ............................. . .... 10954. Eddy Current Scan, BB-2 ... ... ....... . ............ ......... 11055. Eddy Current Scan, BB-3 . . 9. .. . e. ..... ............ . ... . i156. Eddy Current Scan, AL81 ..... o... .... ....................... 11257. Eddy Current Scan, AL82 . ................. o ... ............... 11358. Eddy Current Scan, AL83 ............ o ..... ..... .......... 11459. Eddy Current Scan, ................ 0.0.9..... 00.. 11560. Signal Profile of Eddy Current Signals From Straight
Shank Hole with EDM Slot 0.037 inches Deep.....e.......... 11761. Signal Profile of Eddy Current Signals From Varying
Depth EDM Slot ............................ 11862. Signal Profile of Eddy Current Signals From
Internal Defecte..ft.......... .... ..... ........... . 60. 0 11963. Eddy Current Scan Showing Plate Interface............... 12164. Plot of Maximum Peak Voltage as Function of Percent
Depth With Bolt Hole.......................... ....... 12165. Signal Amplitude vs Flaw Depth, Maximum Peak-to-Peak
Height for Mild Steel..oo ................................ 12366. Transfer Function vs Frequency for EDM Slot .............. 12867. Transfer Function vs Frequency for Fatigue Crack ... ck.... 12968. Power Spectrum for Narrow Pulse and Broad Pulse...s........ 13169. Transfer Function for Square Pulseq........................ 13270. Power Specturm for Eddy Cu:rent Signal of Defect .......... 133
ix
,p..-
TABLES
PAGE NOI. Tabulated Values of Dimensions of Part Through
Cracks in Flat Plates 140
II. B-1 Test Specimens, Ti 6AI-4V, D6AC Steel 142
III. Part Through Fatigue Cracks Near Bolt Holes 145
IV. EDM Notches 146
V. EDM Steel Ultrasonic Reflections 149
VI. Fatigue Steel Ultrasonic Reflections 150
VII. PTC Cracks in Aluminum 151
VIII. Effect of 5% Saltwater Corrosion on UltrasonicSignals (Aluminum) 152
IX. Effect of Signal Level on Rejects by Eddy Currentvs Visual Identification 153
X. Constant Depth and Width 154
XI. Varying Depth Near Surface Flaws 155
t
'VX
SECTION I
INTRODUCTION
Fatigue cracks are known to develop in fastener holes
of structural members of aircraft during the operational
lifetime of that aircraft. A great number of these fatigue
cracks initiate in holes that are associated with highly stressed
joints, containing straight shank fasteners, rivets, taperlok
or other patented systems. Even though a great deal of care
is usually involved in the design and fabrication of these joints,
service history examination and IRAN* procedures have shown that
cracks may develop prior to the design lifetime of the aircraft
and may necessitate significant curtailment of mission, or
decrease in operational characteristics.
Typical examples of this are: (1) the loss in payload and
operational lifetime due to the premature formation of fatigue
cracks in the top wing surface fastener holes, (2) premature
failure of a wing carry,.thru-box during cold proof testing;
originating at a fastener hole crack (supposedly stress corrosion
induced) and (3) cracking of aluminum splice plates observed
in accelerated fatigue tests. Current NDT and fracture mechanics
programs initiated on the B-l, F-14 and F-15, F-16 have been
designed to take positive action designed to minimize unexpected
failure of critical structural members due to the presence of
such cracks under fasteners. (1)I The fracture mechanics-nondestructive inspection design
* process uses the concept of the stress intensity factor Ki to
determine the design lifetime of a part containing a small flaw.
The initial design requirements are such that the combina-
gIRAN-Inspect And Rep4ir as Necessai• 1
rC

tion of mission load spectrum (during the lifetime of the
component), initial flaw sizes and material subcritical crack
growth potential (da/dN) do not permit the initial crack
assumed in the design to grow to a size sufficient to cause
failure. This presumes that all flaws larger than the initially
assumed small flawfcan be reliably and efficiently found,
located, identified and removed from the part prior to actual
use.(2)
It should be recognized that one of the major problems
associated with the detection of small cracks is the detection
of fatigue cracks eminating from fastener holes, For the routine
inspection of unfilled holes several techniques have been
developed and can be used depending upon the acceptance limits
required for the inspection.
These include:
1. X-ray analysis. Used where larger cracks can
be tclerated or if accessability is difficult.(3
2. Penetrants. Used w en disassembly and subsequent
etch inspection techniques are possible. ( 4)
3. Optical examination. Used when small cracks
must be detected but requiresextensive time and cost.
4. Ultrasonics. Can detect small cracks and are
used extensively, but difficult to interpret.
5. Eddy current. Used with bolt hole probes, with
high sensitivity can detect small cracks.
However, increased requirements of high performance aircraft
and newer critical requirements on large cargo aircraft require
2
itx the reliable detection of cracks as small as 0.030 in the
smallest dimension. This will require a relatively unusual
NDT effort and probably cannot be obtaint using the standard
NDT techniques without a major revision of the techniques
for interpretation and analysis of the output signals.
It seems rather ineffective from a cost effective point
of view to spend a great deal of time on extremely sophisticated
techniques of NDT that have been proposed. It appears extremely
unlikely that exotic NDT techniques will find major on-line
use for detection of cracks under installed fasteners no
matter how successful they may be in the laboratory. Since
the problem is directed toward a field inspection problem,
techniques such as laser holography, acoustic imagery , liquid
heat crystals, etc. cannot be considered viable techniques
at this time.
Present inspection techniques require either the removal
of the fastener for inspection, or depend on the size of the
crack being sufficiant to extend beyond the head of the
fastener so that it may be detected visually.
3
SECTION II
PROGRAM OBJECTIVES
The overall objective of this program was to develop
techniques that would be able to relidnly detect and characterize
small defects in the vicinity of fastener holes, and to develop
methods for detecting small cracks with the fastener still in
place. The specific objectives were:
* Extension of shear wave ultrasonic indicium analysis
and mathematical analysis of signals associated with fastener
holes containing small defects, and to characterize those
parameters that can influence the detectability of small
defects in the vicinity of the fastener hole.
*To determine reliable methods for analysis of signals
associated with eddy current bolt hole probe examination of
fastener holes to determine if small defects could be reliably
detected and characterized.
*To develop fast Fourier analysis signals associated
with eddy current helical bolt hole probe scans.
This program included an experimental assessment necessary
for understanding the factors that influence the ultrasonic and
eddy current techniques ability to find small flaws. The
overall program was accomplished in three phases as follows:
Phase I, Ultrasonics
The scope of the ultrasonic technique for characterization
of defects was examined. This included comparison of signals
from fatigue cracks, EDM notches, as well as a study of the
4
'8
factors influencing the amplitude of the signal from fatigue
cracks, on part through cracks and cracks growing out of
fastener holes.
Phase II, Indicia Studies
The scope of this phase was to evaluate the applicability of
the ultrasonic indicia, (a measure of the totality of the
reflected ultrasonic energy) as to its ability to detect and
characterize small cracks in the vicinity of the fastener
hole. In particular the impulse analysis technique was used
to determine if and when a defect was present in the vicinity
of the fastener hole.
Phase III, Eddy Current Studies
This portion of the program concentrated on improving and
examining the signals from a unique eddy current scan unit.
Signals associated with EDM notches, fatigue cracks, corrosion
cracks and other defects associated with the fastener hole with
the fastener removed were examined in this portion of the study.
The end aims of Phases I and III were to be the development
of computer software and analysis technique for implementation
on existing Air Force equipment.
5
SECTION III
TEST SPECIMENS
Four types of specimens were used.
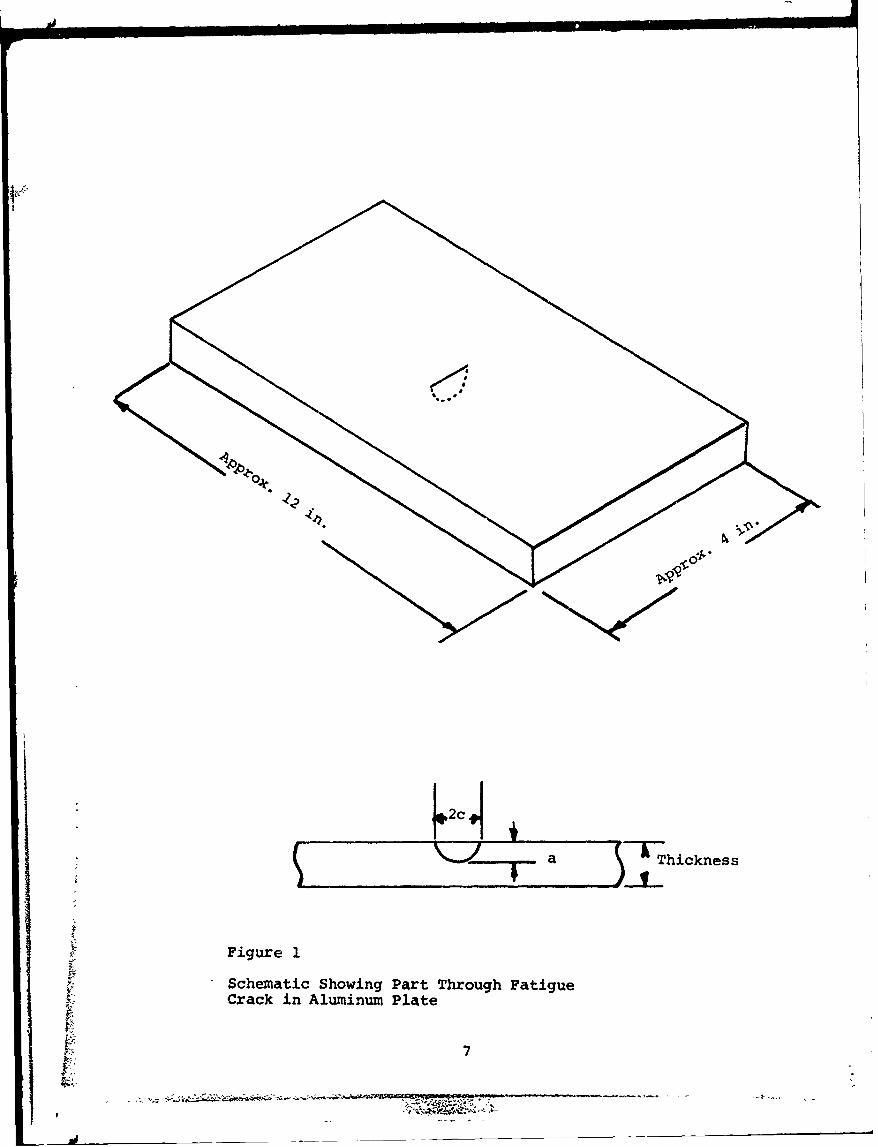
Part Thru Cracks in Flat Plates
These specimens were made of 7075-T6 Aluminum, Ti6Al-4V
and D6AC steel.
The 7075-T65 Aluminum specimens are shown in Figure 1 and
tabulated in Table I. They consist of a fatigue cracked, part
thru crack, initiated on one side of the plate from a small
microweld solidification spot and grown in three point bending
by tension-tension fatigue. After the crack had grown to
a sufficient size, beyond the weld solidification zone, the
central area was polished to remove the crater of the weld spot.
Cracks of different length were produced by monitoring the
growth with a small microscope of approximately 50X. The
test frequency was approximately 10 cps. Crack lengths ranging
from 0.015 to 0.4 inches were produced.
Some specimens made of Ti6Al-4V and D6AC steel used in
the B-I inspection program and fatigued in a Amsler high stress
fatigue machine were also evaluated in this program. These were
provided by AFML & R.I. In these specimens, the initial
solidification initiation spot was machined off with a multiple
point milling machine. All these specimens had a 0.0005 etch
prior to inspection. After fatigue these were subject to some
24 hours of stress corrosion with a mild 5% salt solution.
Part Thru Cracks Eminating From Fastener Holes
The specimens were initially prepared in a manner similar
to that described above. The crack was grown to a predetermined
6
0J
.2cII \/~.~aThickness
Figure 1
Schematic Showing Part Through Fatigue
Crack in Aluminum Plate
7
I. _ _.. . .. ... . .. ,_,i_ _i_ _I_ I
length, then the fastener hole location selected, the hole
drilled and reamed. A few additional fatigue cycles were
put on the specimen to grow the crack for a short additional
distance. The specimen configurations were both part through,
semicircular)and thru thickness cracks. Several attempts to
grow completely internal cracks by fatigue crack initiation in
the interior of the hole were made, but the crack almost always
grew in a longitudinal direction considerably faster than in
the depth direction and attempts were abandoned. Table III
lists typical specimen configurations and sizes for this series.
EDM Notches
A considerable amount of test evaluation was carried out
on defects produced by electrical discharge machine (EDM)
notches. The use of notches as test specimens was desirable
because of the degree of control available over notch size, width
and location. However, typical ultrasonic response curves
showed that reflections from EDM slots were considerably
higher than those found from fatigue cracks.
EDM slots were cut into flaw plates to produce small
surface type flaws, as well as cut into predrilled and reamed
holes to produce defects in the vicinity of fastener holes.
Three types of defects associated with fastener holes were
produced. These are (1) through thickness constant depth defect
(2) through thickness variable depth defect and (3) part through
defect, either emerging on one face or completely internal.
Typical specimens are listed in Table IV.
Plates With Fastener and Defect
A limited number of specimens were fabricated with defects
8

in place and the fastener installed. These were selected from
previous drilled and examined plates and the straight shank
fastener installed following recommended procedure. In several
cases, faying surface sealant Mil S-8802 was installed per
recommended practice.
Fastener Hole Defect Configurations
Typical defect configurations associated with highly
stressed regions of fastener holes are shown in Figure 2. (4)
There are several common locations for defects associated
with the fastener hole. These are:
Part through corner crack eminating from the top or
bottom of the fastener hole, either under the head or under the
nut.
Completely internal defect in a part through configura-
tion where there is no evidence of the defect on the top or
bottom surface. Typical starter defects for this configuration
are at the corners of countersunk holes or small scratches
or burrs within the fastener hole.
Through thickness defect where the defect has propagated
completely through the depth of the plate.
Faying surface cracks that are located in the thickness
direction, and lie parallel to the thickness direction. These
may not intersect the bolt hole. The primary material used
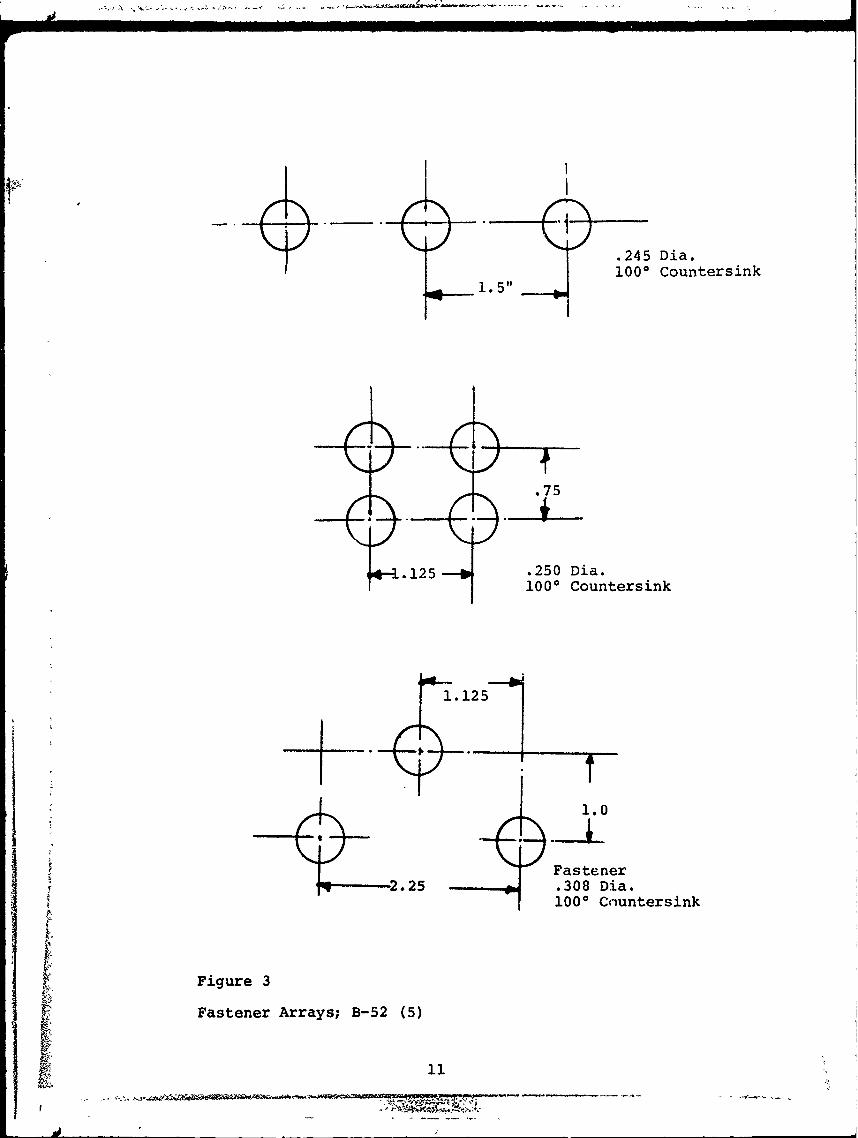
is either 7075-T6511 or 2024-T3 Aluminum plate ranging betweenI 0.25 to 0.65 inches thick. Figure 3 shows simple straight
and staggered fastener arrays associated with the B-52? (5)aircraft, while FVjure 4 shows typical arrays associated
with the KC-130. Fasteners are of the straight shank type with
9
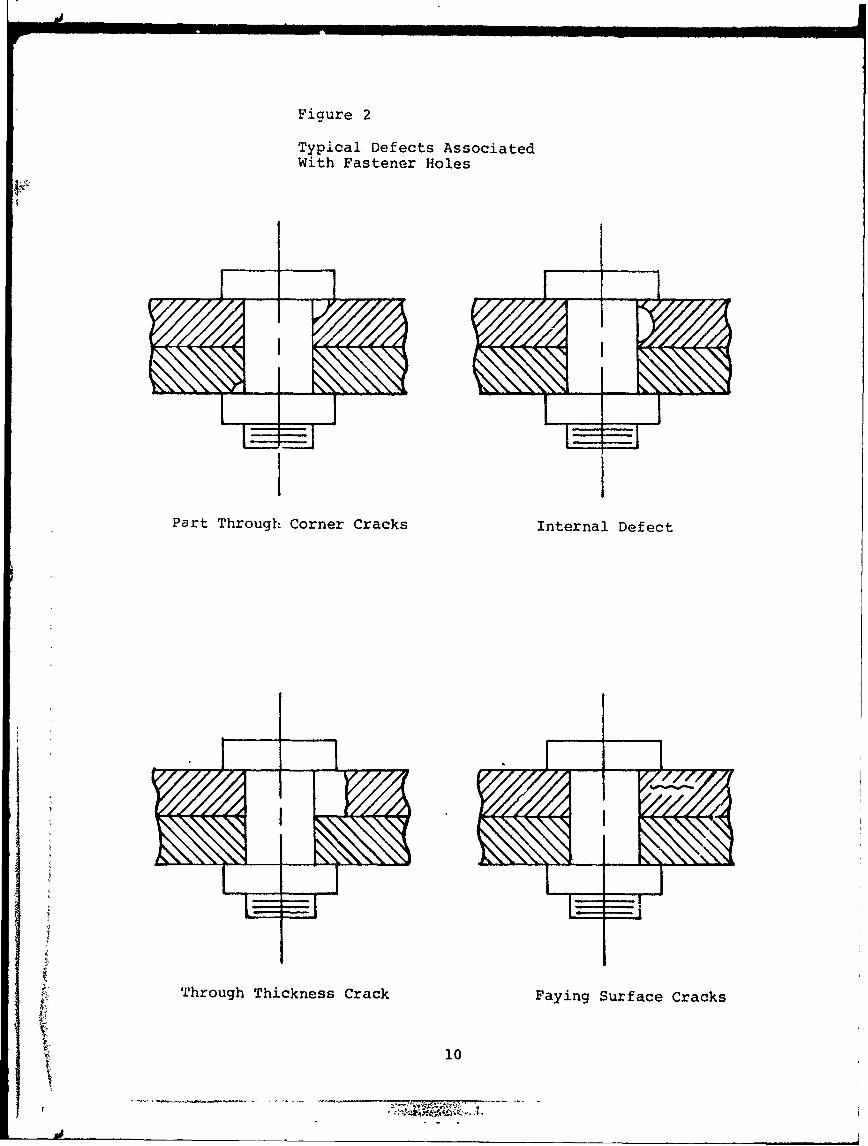
Figure 2
Typical Defects AssociatedWith Fastener Holes
FI
Part Through Corner Cracks Internal Defect
9 Through Thickness Crack Faying Surface Cracks
k10
° *
:A:flS&4
.245 Dia.
1000 Countersink1. 5"
.75
4--1. 12 5 -. 250 Dia.1000 Countersink
1.125
.i1.0
Fastener2.25 .308 Dia.
1000 Countersink
6Figure 3
Fastener Arrays; B-52 (5)
M11
__:- - - - -- - - - -

So o 15.62
00
MOUNTIIGNITNGSEIMNGDD URETBLTHL
SUBSTATOATCRDDACRRN
[BOLT HOLE
BOLT-HOLE PROBE
PART INTERFACE FESET 02
SCANNINGDEPTHINCREMENTS TF ______
SUBSTRATE SAMPLES
13.81 o o3
SCAN AT 0.062 INCH FROM EACH END OF HOLE AND ATEACH 0. 125 INCH DEPTH INCREMENT BETWEEN THESE.
Figure 4
Fastener Arrays KC 130 (Reference 5)
12
O - --
either protruding or flush heads. The diameters of the actual
fasteners range from 0.25 to 0.675. For simplicity all lab-
oratory specimens were produced with a straight shank with a
diameter of 0.50 inches. Typical finishing for military
fasteners consist of a faying surface sealant of MIL S-8802
and epoxy polymide primer with a top coat of polyurethane
enamel. The total thickness of the finish is about 0.002
inches. In laboratory specimens this was produced by a single
polyurethane enamel coating without the primer finish. The
purpose of the prime is to prepare the surface for adherance
of the enamel and it was felt that durability of the enamel
finish would not be a problem in this low useage environment.
In the initial portion of the program only straight shank
fasteners were used containing both part thru and internal defects.
Tapered shank fasteners were examined for comparison and
are shown in Figure 5.. These consist of D6AC steel tapered
holes with titanium tapered fasteners. These specimens had
drilled holes and tapered bores ranging from nominal 0.24 to
0.675 inches in diameter.
¶ 13
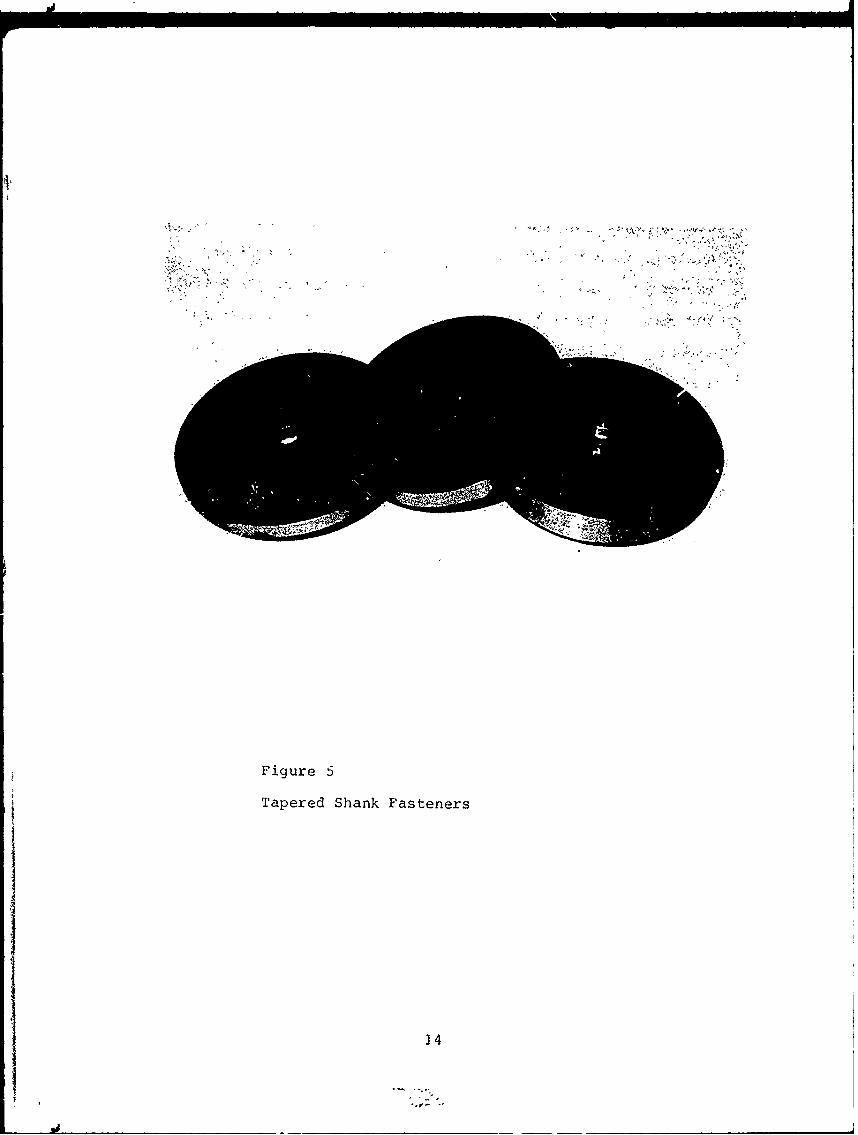
Figure 5
Tapered Shank Fasteners
34
SECTION IV
ULTRASONICS
Introduction
The use of ultrasonics for the detection of defects in(7)
structures is well documented. In many applications for
detection of unaccessable defects, the use of lucite conversion
shoes to introduce shear waves into the material has been in
vogue for some time. However, the major thrust of detection
techniques for ultrasonics is such that once a method has been
developed that will satisfy the requirement, little characteriza-
tion is performed. In most cases the test specimen used to
setup the ultrasonic proedure is either a flat bottom hole
calibration or a standard, identical to that required in the
actual test. Once the process has been developed to detect
the crack, no further study is conducted.
Because of the directness of the application, little
coordinated work has been conducted on characterizing those
"factors that influence the detection and reliability of crack
like defects, particularly those associated with fastener
holes.
The ultrasonic configuration used in this series of
experiments was a standard 450 plastic shoe that was used to
convert the normal wave into a shear wave. The unit used was
a Sperry UI714 with d fast tranzigate operating in typical A
scan. In all cases the amplitudes reported are scale height
readings on the UM 714 Scope. When the signal heights are
such that they exceed 4 inches, a sensitivity setting change
I
was used to reduce the signal to within the scope reading.
In these cases a prior calibration curve was constructed
using a series of EDM notches that related the scale readings
at any densitivity to some magnitude of amplitude height
readings on the UM 714 Scope.
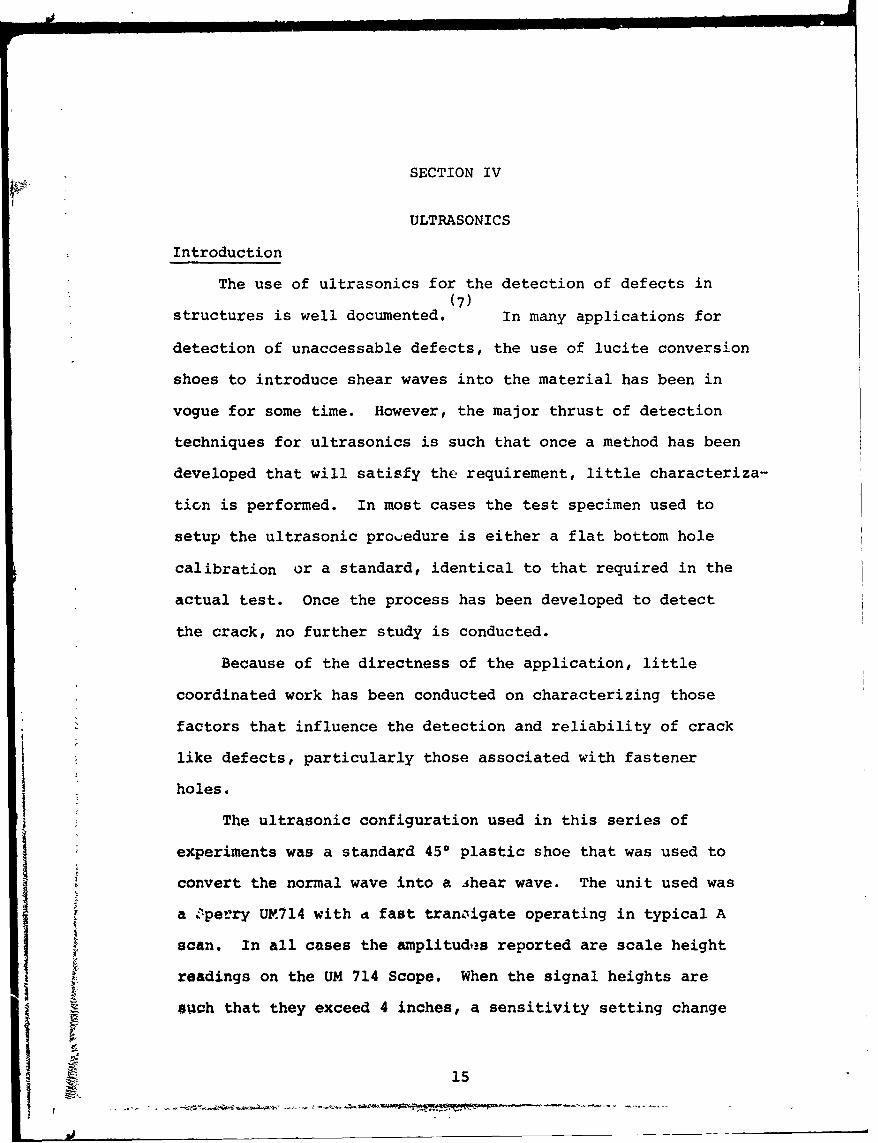
Figure 6 shows a typical shear wave ultrasonic setup. The
transducer is mounted in a 450 shoe with sufficient oil contact
between the transducer and shoe, and between the shoe and the
surface of the specimen. The motion of the shoe is such that
the magnitude of the defect is the largest value it can assume
for a given configuration. If the specimen were examined
from the other face, or from the opposite side, that value
of reflection would be maximized too.
The ultrasonic interaction between the defect growing out
of the fastener hole and the shear wave produced the reflection
that is eventually received at the transducer and recorded as
a crack. It becomes important to examine each of the variables
that can influence the degree of reflection possible from the
defect to determine which factors are significant and which
can be ignored.
Comparison of Signals Reflected from Cracks and EDM Notches
Shear wave reflections from several EDM notches in steel
and aluminum are given in Table V, as a function of the estimated
crack length for a through thickness crack. It ..an be seen
that in general the higher the amplitude of the reflection, the
larger the defect indication. Assuming that the size of the
16
r-.-
U)~
Q)
4-)4
U .IJ
(zU
S440
.41
U4)
0)
. -I4-0
0 "•,•.•. -• :..:.."..
"$4 > 41
r3 4 E 0)
)Q
~r- 441
(d (
reflected indication must be at least twice the general inter-
ference signal, it can be seen that defects, EDM notches, less
than 0.030 inches cannot be reliably found when the transducer
indicia is focused on the top of the plate, and can be detected
to approximately 0.023 inches when located on the bottom of the plate.
Similar results were found for the aluminum specimens, i.e.
the larger defects could be detected at the bottom of the plate
due to the shorter ultrasonic path needed for the primary reflection.
If one considers the presence of a defect at the center of the bolt
hole, the approximate sensitivity is a defect on the order of 0.025
inches for signal to noise ratios of 2:1.
It should be noted that the AVG diagram(S) essentially predicts
this behavior, i.e. a longer ultrasonic path would result
in a smaller ultrasonic cross section, i.e. smaller signal
reflections.
The signal response from selected fatigue cracks of
varying length and depth are shown in Table VI. In this series,
the depth and length are kept essentially in the same ratio, i.e.
a = c. It should be noted that for this series, the crack length
for reasonable flaw detection is approximately 0.035 inches. However,
cracks of lengths less than 0.052 inches do not give signals consis-
tantly above the signal noise values. It should also be noted
that the ultrasonic response is only remotely connected to the
length or depth of the crack. The signal response from cracks
0.015 inches in radial length is within the scatter of defects
of 0.030 inches. In most cases the signal variations are due
significantly to the orientation of the defect with respect to
the location of the transducer.J _ 18
This has been found too for simple part through cracks
fatigued into plates. Table VII lists a series of part through
fatigue cracks in alr:.ainum with crack lengths ranging from 0.0438
inches to 0.3224 inches in surface length. The crack depth is
approximately half of this value. It can be seen that for
selected specimens there is a correlation between maximum signals
reflected and the defect length, or defect area, assuming the
depth to width ratio is approximately constant. However,
it was found that the reflected intensity varies irregularily
with the length.
in all cases the value of the ultrasonic indications when
the defect was examined from the reverse side, i.e. shorter
path length, were slightly higher than those with the single
reflection path width. Hence, smaller defects would be detectable
on the lower surface than on the upper surface if signal
height readings are used as the primary sensitivity device.
If all specimens containing part through cracks are compared
together and the signal height plotted as a function of the
flaw zize, one quickly sees that there does not appear to be
any correlation between signal height and flaw size. The raw
data shows no correlation between ultrasonic responses and
surface crack lengths. This is similar to results obtained
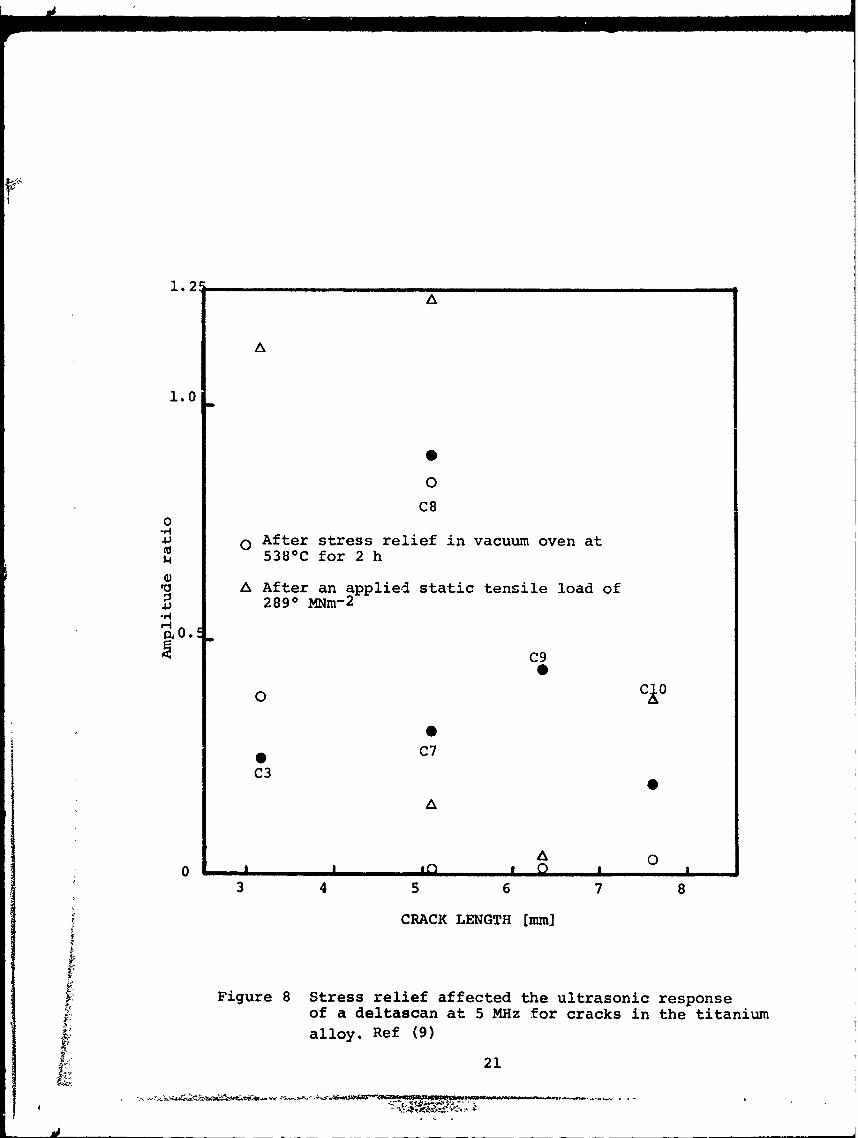
by Yee et all for Titanium specimens.(9 ) In Figure 7 all
the responses from part through Aluminum specimens are plotted
as a function of size. In Figure 8 Yee's data is replotted and
both show the same general scatter.
19
7-M4 0113 ,17
ri HAS
00 0
.H
4J@
r24 4H
_3 u
qj 0Q) ý4"40 C
UE-4 ý
u
0) t
UN k-4 00 44L
N) 04
01 4
0
200
1.2
AA
1.0
0
C80.- iq4J o After stress relief in vacuum oven at$4 538 0 C for 2 hw A After an applied static tensile load of4 2890 MNm- 2
0o.C9
o CIO
• C7
C3
0
o I,* 0 a
3 4 5 7 8
CRACK LENGTH [mm]
Figure 8 Stress relief affected the ultrasonic responseof a deltascan at 5 MHz for cracks in the titaniumalloy. Ref (9)
21
I4
It is obvious that there are several parameters that
significantly influence the flaw signal intensity, and if these
can be separated, the signals would show a much greater degree
of correlation.
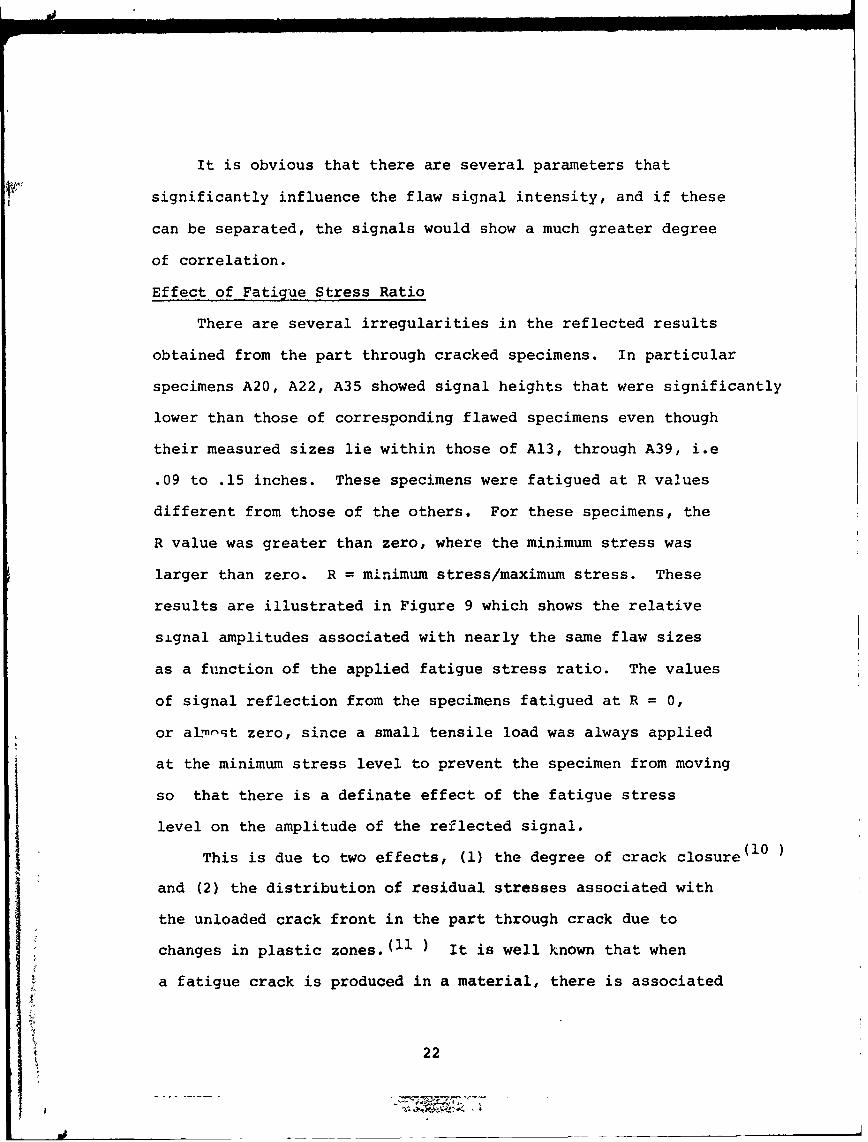
Effect of Fatigue Stress Ratio
There are several irregularities in the reflected results
obtained from the part through cracked specimens. In particular
specimens A20, A22, A35 showed signal heights that were significantly
lower than those of corresponding flawed specimens even though
their measured sizes lie within those of A13, through A39, i.e
.09 to .15 inches. These specimens were fatigued at R values
different from those of the others. For these specimens, the
R value was greater than zero, where the minimum stress was
larger than zero. R = minimum stress/maximum stress. These
results are illustrated in Figure 9 which shows the relative
signal amplitudes associated with nearly the same flaw sizes
as a function of the applied fatigue stress ratio. The values
of signal reflection from the specimens fatigued at R = 0,
or almost zero, since a small tensile load was always applied
at the minimum stress level to prevent the specimen from moving
so that there is a definate effect of the fatigue stress
level on the amplitude of the reflected signal.
This is due to two effects, (1) the degree of crack closure (1 0
and (2) the distribution of residual stresses associated with
the unloaded crack front in the part through crack due to
changes in plastic zones.(11) It is well known that when
a fatigue crack is produced in a material, there is associated
22
J-4-r-~
C.)N
0) CN
('1
('arz4~
4-14414-
(D co H-4.1 Q) 0 Ln
H 4Jit ý
H
.1-4 .1.4C(J)4J
4J01
$~4
04-4
$44
4J 0
Hý4
44%
-40TOH It'UbTg POe;09T;e9
23
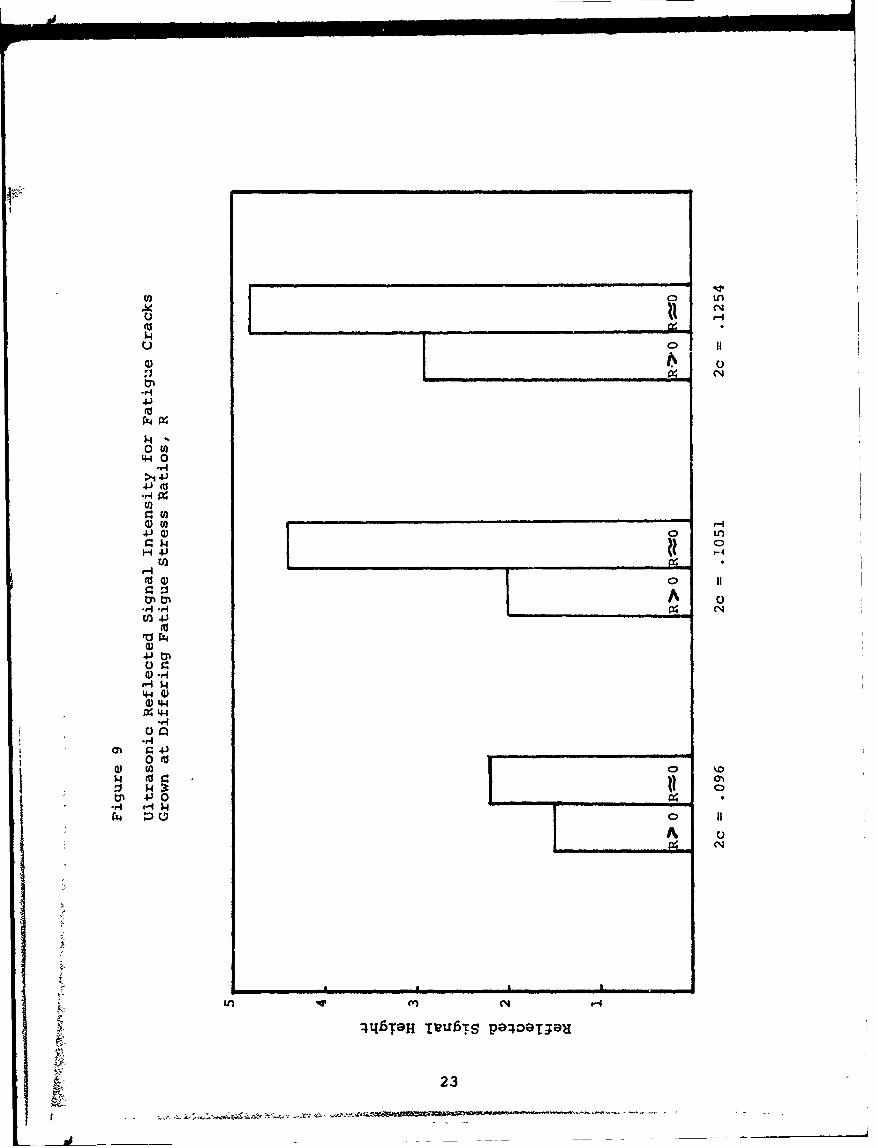
with the propagation of the crack, a plastic wake which
represents the previous load cycling history of plastically
deformed material associated with the plastic zones of the crack
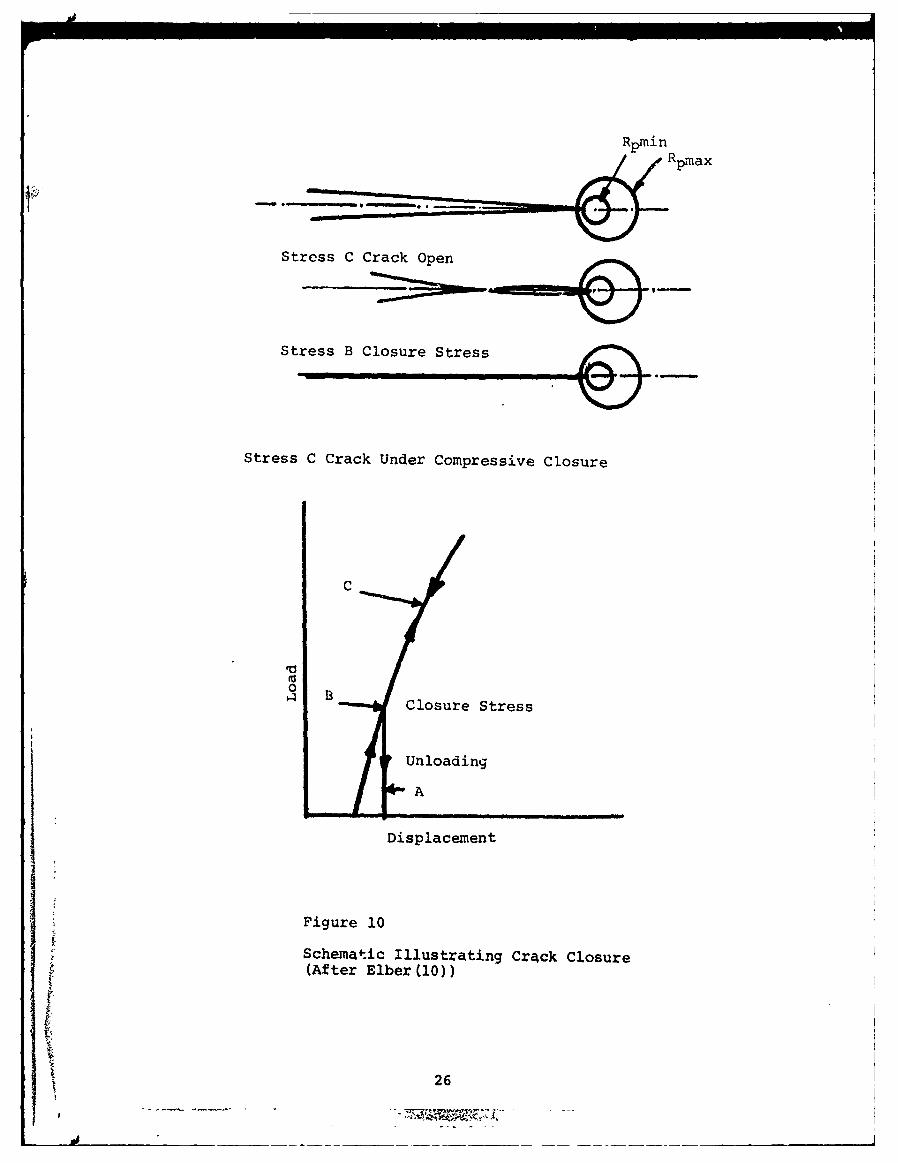
in prior crack front positions. Figure 10 illustrates this
effect. This prior plastically deformed region results in a
plastic enclave within the larger elastic material surrounding it.
Thus, when the material is unloaded, there exists a residual
stress pattern that tends to force the surfaces of the crack
front together. Elber(I0) refers to this as crack closure,
where physical touching of the faces of the crack can be
expected for positive applied stress levels. Thus, under
zero external applied stresses, one would expect that a position
of the crack were closed and ultrasonic energy would be able
to pass through the crack interface and not be reflected
back toward the receiver. The degree of closure is a function
of the stress ratio used to produce the fatigue crack, and
hence, there is a greater degree of closure for the specimens
fatigued at R values greater than zero than there is for
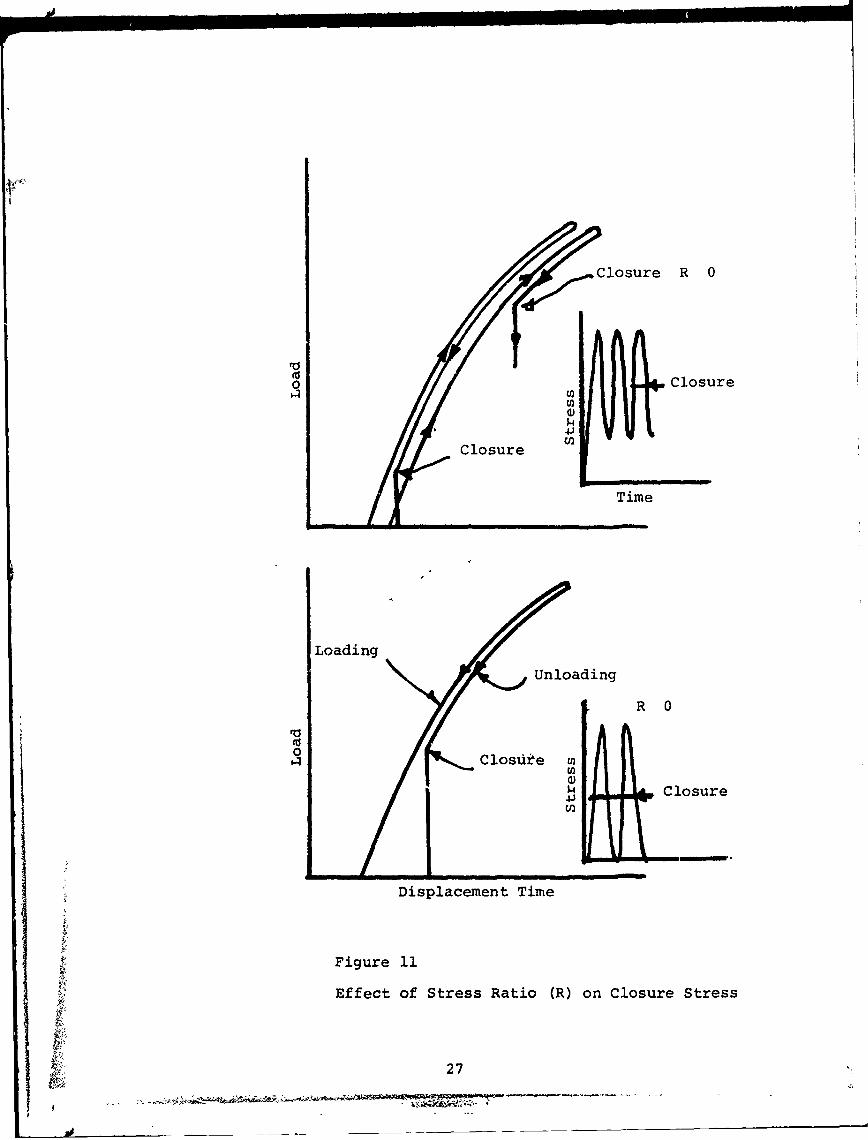
specimens fatigued at R=0. This is shown in Figure 11, where
the two different R values have been sketched with the same
maximum fatigue stress level. Hence, the difference in
ultrasonic signals are due to differences in closure associated
with the fatigue crack stress cycling.
Effect of Crack Closure
To evaluate the effect of crack tightness on the reflected
signal intensity, a series of speciemns were examined under
applied loads while on the testing machine. The objective
24
J4
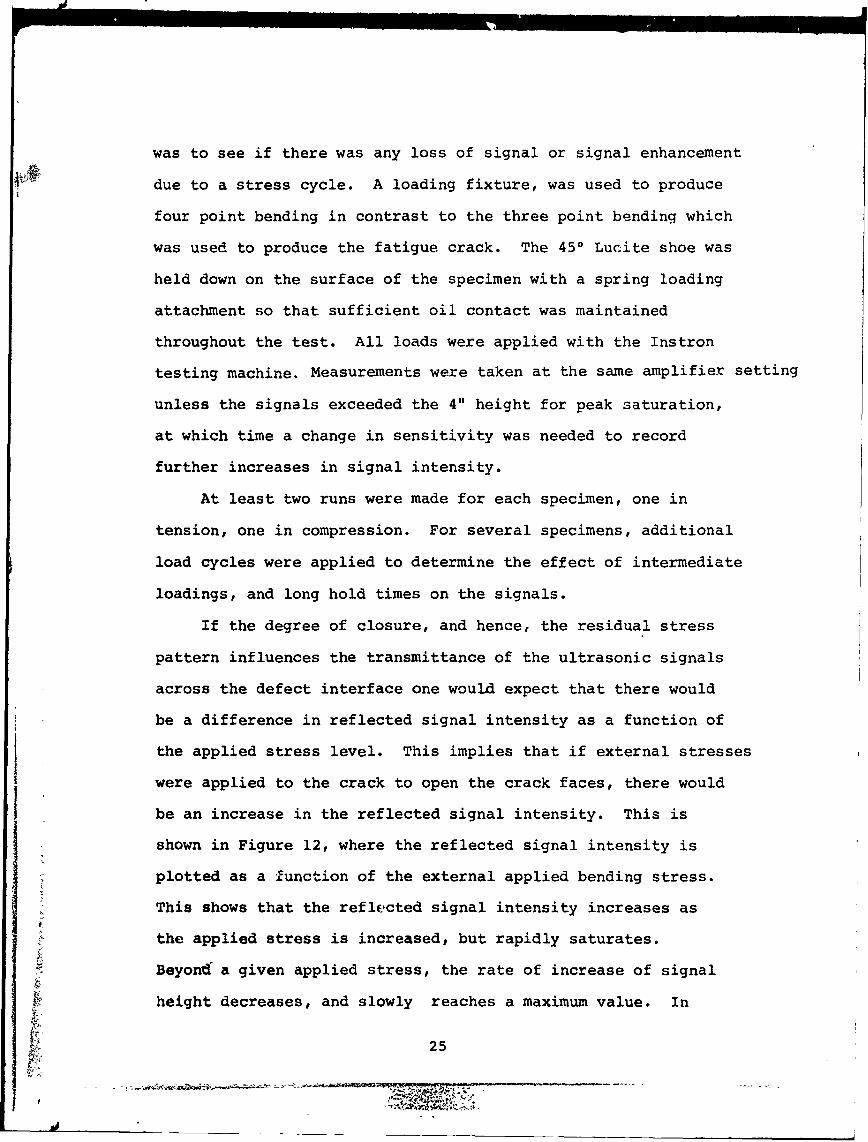
was to see if there was any loss of signal or signal enhancement
due to a stress cycle. A loading fixture, was used to produce
four point bending in contrast to the three point bending which
was used to produce the fatigue crack. The 450 Lucite shoe was
held down on the surface of the specimen with a spring loading
attachment so that sufficient oil contact was maintained
throughout the test. All loads were applied with the Instron
testing machine. Measurements were taken at the same amplifier setting
unless the signals exceeded the 4 " height for peak saturation,
at which time a change in sensitivity was needed to record
further increases in signal intensity.
At least two runs were made for each specimen, one in
tension, one in compression. For several specimens, additional
load cycles were applied to determine the effect of intermediate
loadings, and long hold times on the signals.
If the degree of closure, and hence, the residual stress
pattern influences the transmittance of the ultrasonic signals
across the defect interface one would expect that there would
be a difference in reflected signal intensity as a function of
the applied stress level. This implies that if external stresses
were applied to the crack to open the crack faces, there would
be an increase in the reflected signal intensity. This is
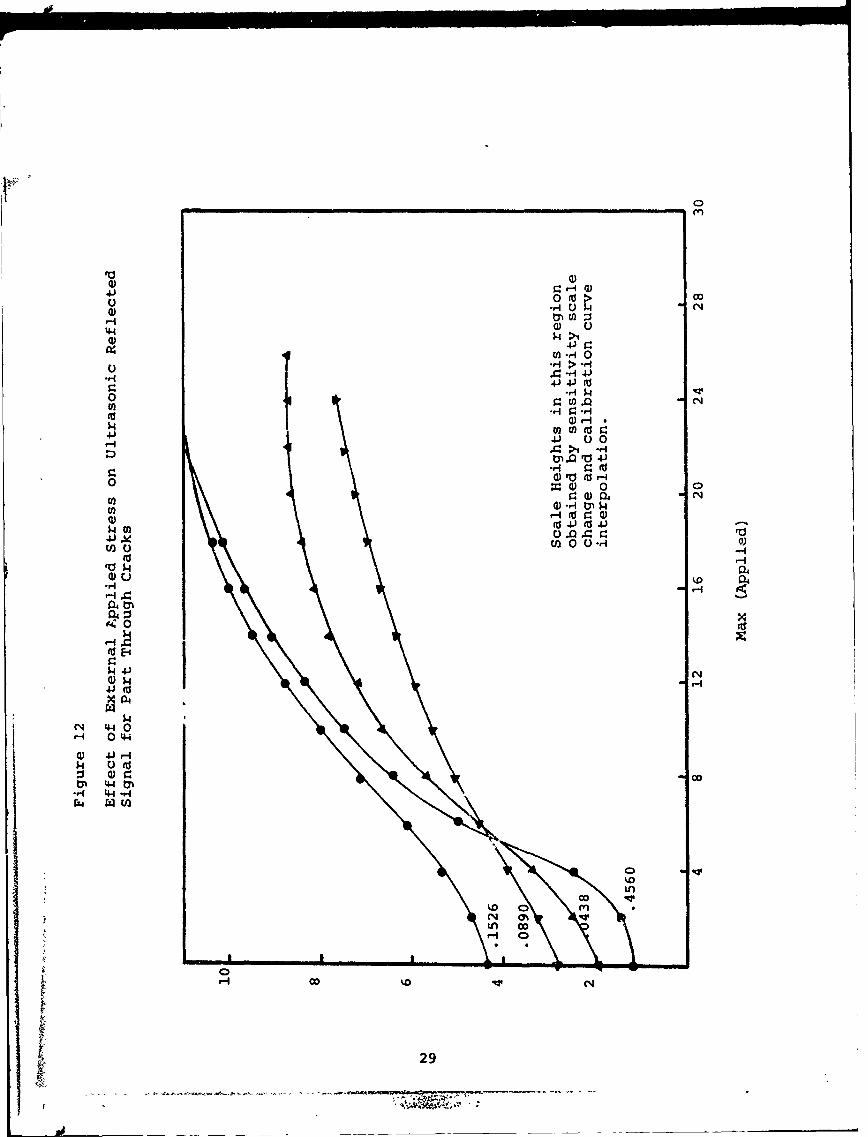
shown in Figure 12, where the reflected signal intensity is
j• plotted as a function of the external applied bending stress.
This shows that the reflected signal intensity increases as
the applied stress is increased, but rapidly saturates.
Beyond a given applied stress, the rate of increase of signal
height decreases, and slowly reaches a maximum value. In
25
Rpmin
•; --.. _•'•Ramax
Stress C Crack Open
Stress B Closure Stress
Stress C Crack Under Compressive Closure
C
0 BClosure Stress
Unloading
A
Displacement
Figure 10
Schematic Illustrating Crack Closure(After Elber (10))
2
• 26
Closure R 0
Closure
STime
Loading
SUnloading
R 0
0
U)
CClosure
TDisplacement Time
S~Figure 11
Effect of Stress Ratio (R) on Closure Stress
27)
all cases the saturation stress level is approximately 18ksi.
Of particular interest is the reflected signal-applied stress
curves for the cracks of length 0.1526 and 0.1560 inches long.
For the low stress levels, the .. 1560 inch crack gives a signal
height significantly below tha-. for the 0.1526 inch crack. The
magnitude of this reflected signal rapidly increases until at
approximately 12 ksi the signal heights are almost identical.
This implies that the residual stress-closure stress on the
0.1560 inch crack were greater than those on the 0.1526 inch
crack, and when the stresses are removed, the reflected signals
are almost identical.
Hence, one may conclude that the external stress state
exerts a significant influence on the reflected signal intensity,
and hence the detectability.
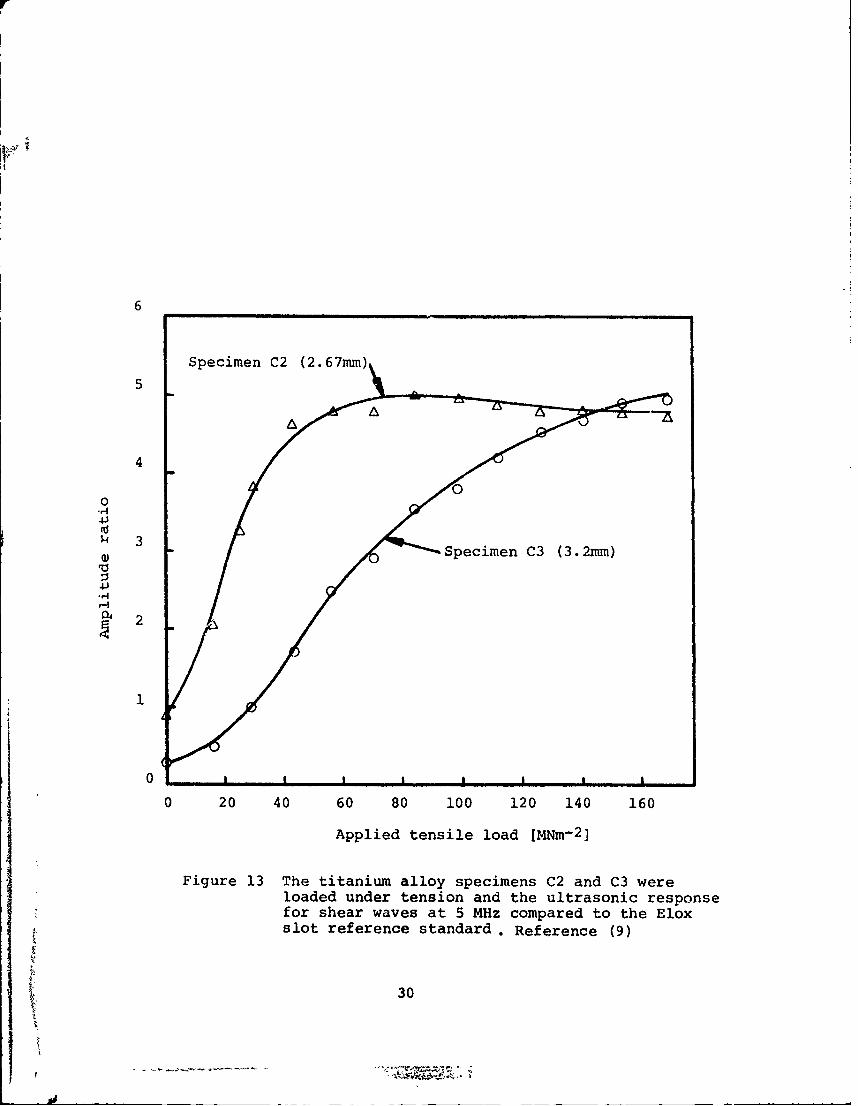
Figure 13 shows similar data obtained by Yee, for Titanium
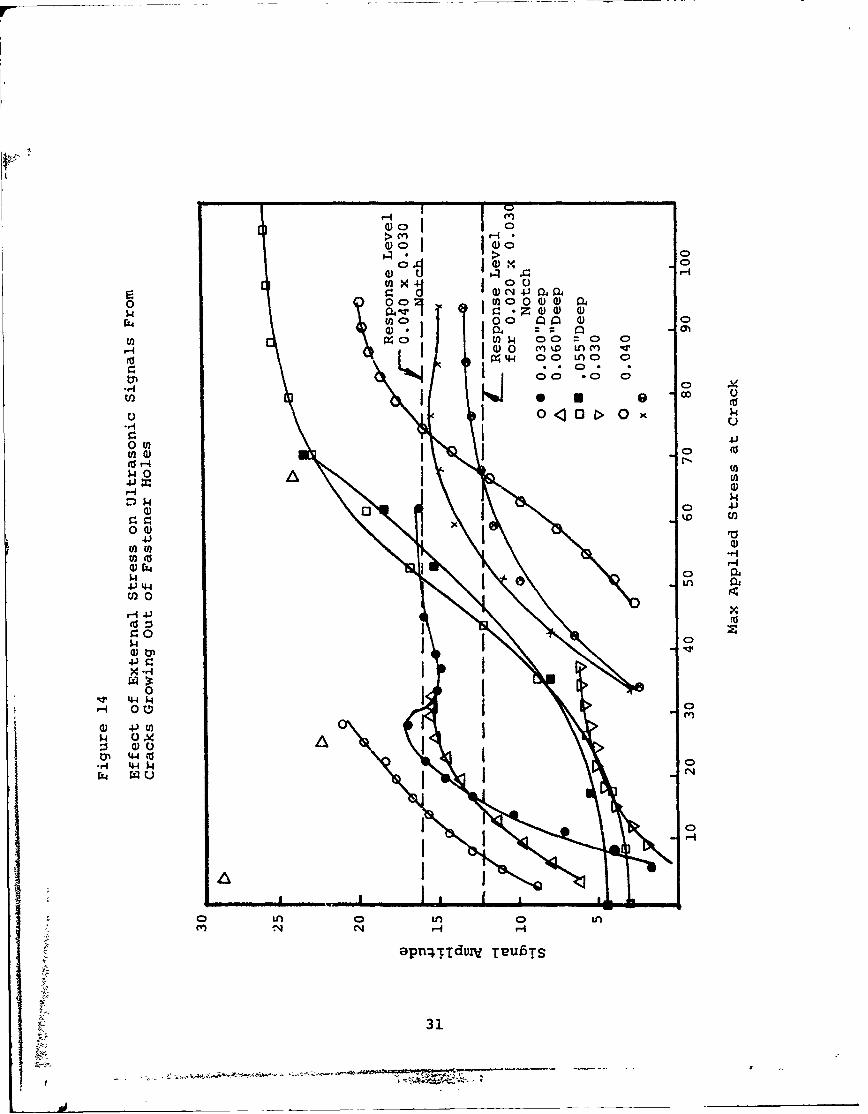
6AI-4V, and Figure 14 shows similar data found by Priche.tt,
Ratz and Woodmansee for 2024 Aluminum. (9'6)
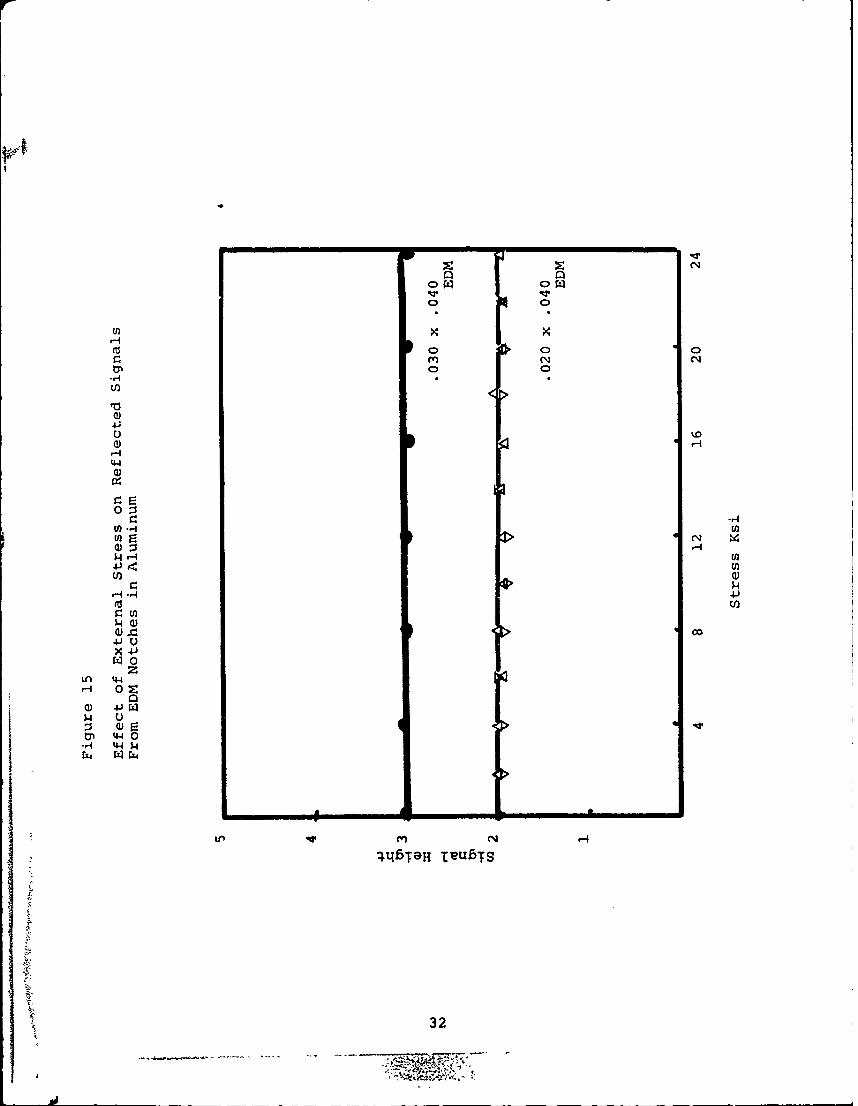
Figure 15 shows the influence of external applied stress on
signals reflected from EDM slots in Aluminum as a function of
applied stress. In this case there is essentially no influence
of the external stress level.
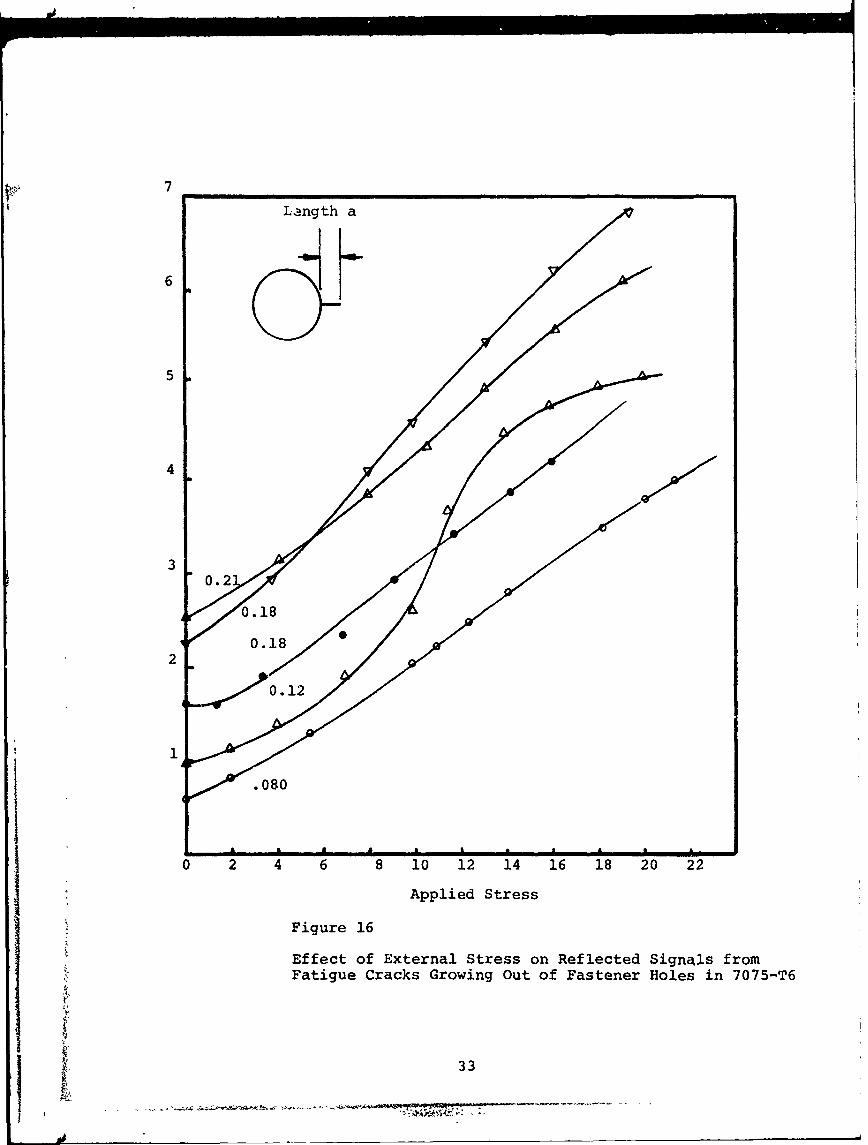
Figure 16 shows the effect of external applied stress on
the reflected signal intensity for fatigue cracks in the
vicinity of the fastener holes. These are 0.5 inch fastener holes
with part through cracks eminating from one side. The maximum
value of reflected peak height is plotted which is the signal
associated with the small secondary peak aside from the major
peak. The major peak is obviously the reflection from the bolt
28
J;
to
U *r414N
.4 >1
ul- .1
.H 4-14J (d
Q) N-
H4J 4-) 0.>' -
010 d 4-
:4 4 00r. a) r4
(d0 U4J AS 4J
UU 4 41
aQc)
0.
(d E-4
r.4
CN 4-40H- 0 44
4) 4I-)I-H
..-4 44-r4,
0
in'.0 0
tn oHi 0
H coN
29
6
Specimen C2 (2.67mm)
5
4
0
0 20 40 60 80 100 120 140 160
Applied tensile load [M•m- 2 ]
Figure 13 The titaniu alloy specimens C2 and C3 were03 loaded under tension and the ultrasonic response
for shear waves at 5 MHz compared to the EloxSslot reference standard Reference (9)
3
0( 0
rz4 NO 00 1 0 ) Q
0~0 0(DQ 0 0
I~.400 LA 0 )C
W4W1 00 =0 0)II) 0 . nm-
C)
Owgl0 ý4-
0 t0
w- 0)
4J4
wo I 0 LU)U 0)
r. 0
$4 CDI
0
1 4 -U)5
44 M
0LA 0 LA 0 LAC'4 H
apn4-rTdUnI TSS
a -~ 31
o~0*
0i 0
4-;
'-4'4-)
41-M)-HU
co
H xd
.4J
XrA 4-4
LP4 C1 -
32
7J
Length a
6
5
4
3
0.180.18 /
2D~0.12
.080
0 2 4 6 8 10 12 14 16 18 20 22
Applied Stress
Figure 16
Effect of External Stress on Reflected Signals fromFatigue Cracks Growing Out of Fastener Holes in 7075-T6
•'. 33
hole itself. As would be expected, there was no change in
reflected signal intensity from the bolt hole as function of
the applied stress, but there was a change in the signal from
the fatigue cracks.
Effect of Load Cycling
If the fatigue cracked specimen were loaded until the
saturation signals were obtained and unloaded, in many cases
the reflected signals did not return along the same path back
to zero applied external load. This is shown typically in
Figure 17. The increasing applied stresses have been applied
to a part through fatigue crack of length 0.0438 inches, Upon
saturation of the ultrasonic signal, the stresses were reduced,
and measurements taken during the unloading. At about 14
ksi, the unloading signal heights fell below those of the
loading, and remained below those of loading until zero applied
load. This was repeated for a series of specimens, and indicated
that the ultrasonic response from a fatigue crack of given
length need not be a single valued function but depends strongly
on the external applied loads. When the maximum external
stress was applied, a plastic zone associated witt, the stress
was formed which upon unloading results in a residual closure
stress, approximately half of the maximum applied stress. If
this stress level is then exceeded by an additional applied
external load, the degree of closure (tightness of the crack)
changes, and becomes greater for a given value of applied
stress. Hence, the unloading curve ultrasonic response is
34
!.
(N
0
U)
00
41*r-4
tooON
ra1
0u)t
00
a)a
N04
r- 44 0
.00I 00
Ol 44.
r4 44(0O
M V
below that of the loading curve if the maximum applied stress
level is exceeded. If however, additional stress cycles are
applied that do not produce a saturation of the ultrasonic
signal, indicating that the crack is completely open, then the
hysterysis loop does not occur, and the loading and unloading
signals are essentially on top of each other. This is seen in
Figure 18 where the same speciemn has been loaded initially to
26ksi, but for the second cycle only loaded to lOksi. The
curve now lies essentially on top of the original unloading
curve.
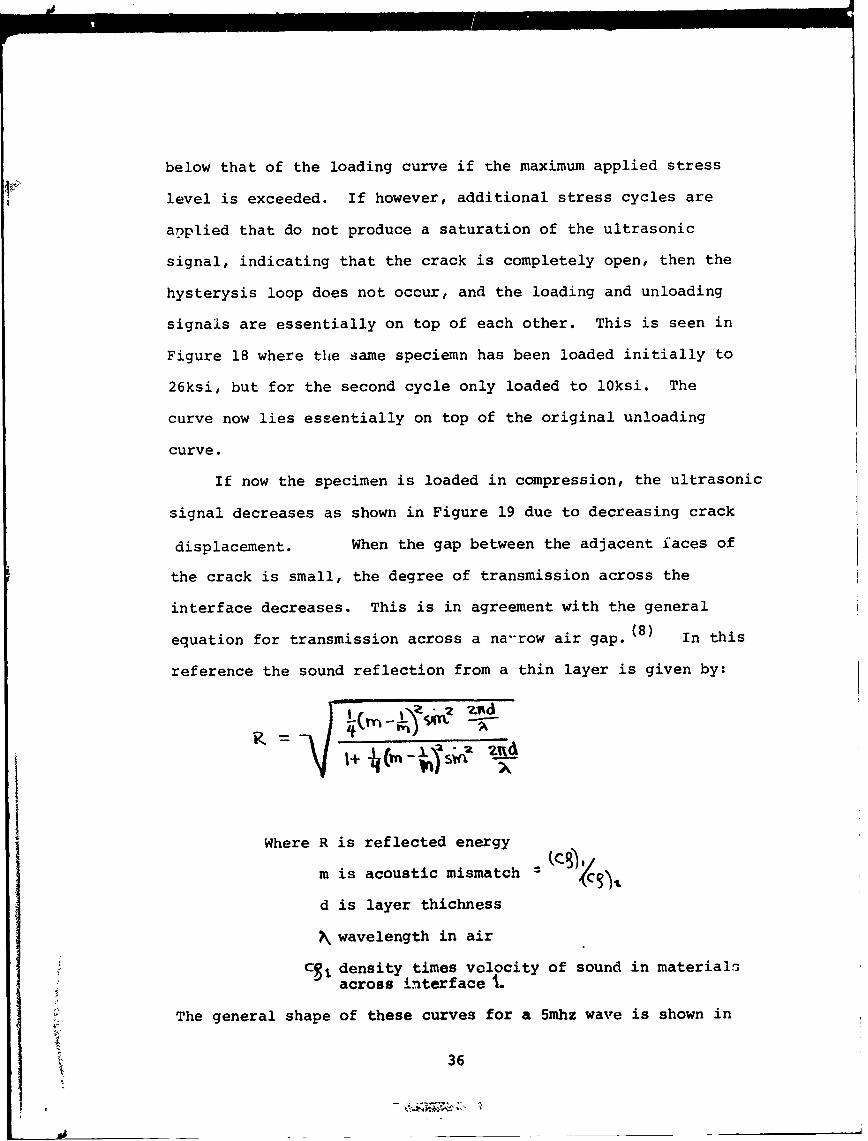
If now the specimen is loaded in compression, the ultrasonic
signal decreases as shown in Figure 19 due to decreasing crack
displacement. When the gap between the adjacent faces of
the crack is small, the degree of transmission across the
interface decreases. This is in agreement with the general
equation for transmission across a na-row air gap. (8) In this
reference the sound reflection from a thin layer is given by:
IIWhere R is reflected energy
m is acoustic mismatch
d is layer thichness
Swavelength in air
CS, density times volocity of sound in materialsacross interface i.
The general shape of these curves for a 5mhz wave is shown in
36
3d
Figure 20. This indicates that for 5mhz wave in Aluminum-air-
Aluminum one would expect complete reflection from the gap
when the gap distance exceeds 10-5mm. This implies that for
crack displacements greater than 0.008 inches one would expect
complete reflection. Examination of Figures 12, 13, and 14
clearly shows that this is not the case. Hence, one can conclude
that considerable sound transmission is occuring across the
gap in the fatigue crack due to intermittant contact between
adjacent protions of the fatigue crack.
This %tours because of the topography of the fatigue crack.
In each application of load, there occurs a corresponding amount
of subcritical crack growth. There is therefore, a one to one
correspondance between the applied stress excursion and the
amount of crack propagation.(12) This produces fatigue crack
striations which are microscopic marking indicating the inter-
mittant propagation of the fatigue crack front. The topography
of the surface produces intermittant areas of contact. When these
areas of contact are under a compression loading, local deformation
increases the area of contact, and the gap be'-.,een the surfaces
decreases, both effects increasing the transmission of the
ultrasonic energy across the interface. Thus, when a compressive
load is applied the reflected signal decreases as shown in
Figure 19.
When the part is further compressed, the signal decreases
considerably, being approximately 25% of the original value
at 20 ksi compression. However, when the compressive load
is removed, the return to the zero load also produces a
hysteresis effect. When the load is removed to zero, the
r 37
ii
N C14
o H>1in H
N C)4
(4.3 ' --- 0
Q) H n0M o N) C.)$
(11 ) I- > 0 dt. -C) C. p 0V 00 .~
Nd Cý N 0 H 4
00N E-4 4.)
W) ri CV4i .4..) H
H A 0
0)4J
oco
*dl 44-4-
ItI
it-4
C/I
01.
41.
0"0
4.)4
tJl X 0
U toI
*.4 :3oia 0)
0 - 14)
1v- 4 04.
tv-
44 0
S440
-4019H TVUBTS
39
17 - -
411
4J,HH
4-4
4-) a)E-4-
E-1
4-'u
r-4 w44 Q)Q) 41
ý44
0 U-1( 44 r-I 0
>404
00 04
rz) E-D U
4-4
00
UOT409T;O 20 UOTSSJWISUlJ, %
0 0 o(40)o0. OD
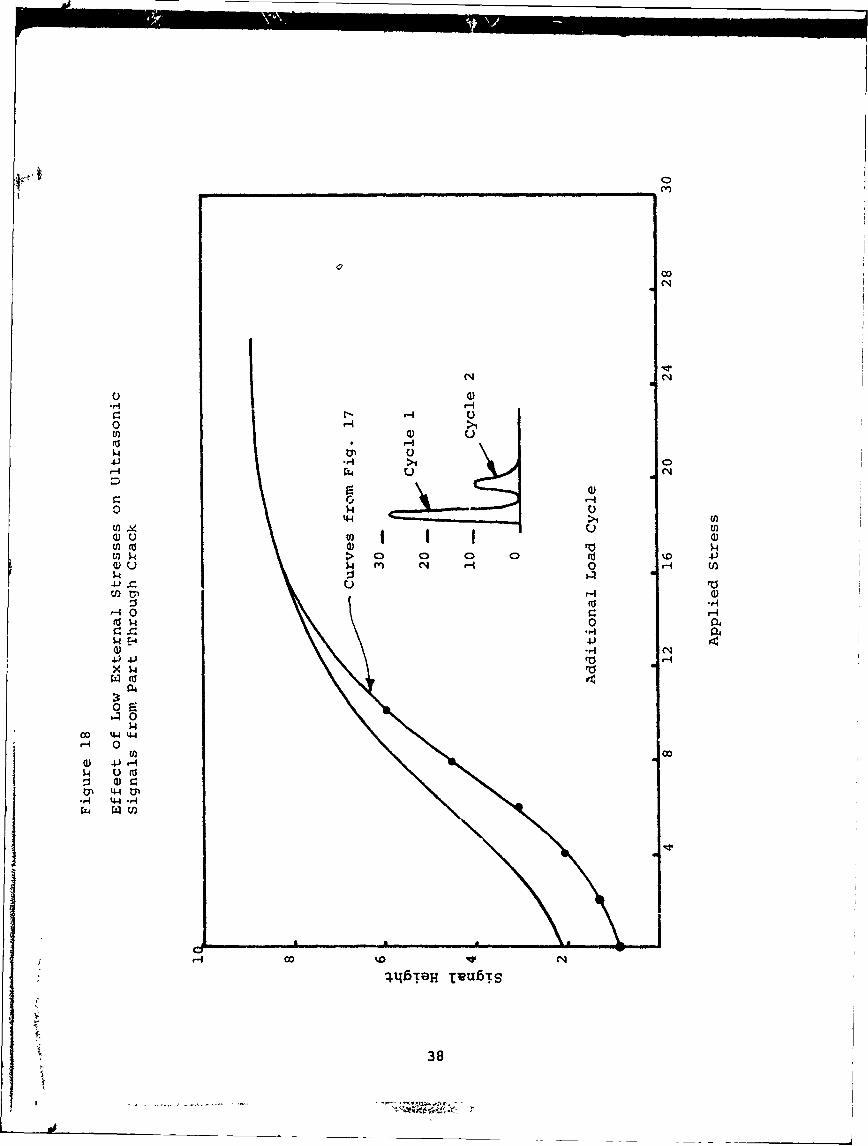
ultrasonic signal is greater than would have been if the compression
load had not been applied. This appears due to the fact that
when the compression was removed, the original areas in contact
were flattened, and upon removal of the load, now produce an
increase in the air gap, resulting in more complete reflection.
Figure-21shows a schematic of the series of events that might
be expected to occur upon tension and compression loading of
a fatigue crack and the changes in ultrasonic signals.
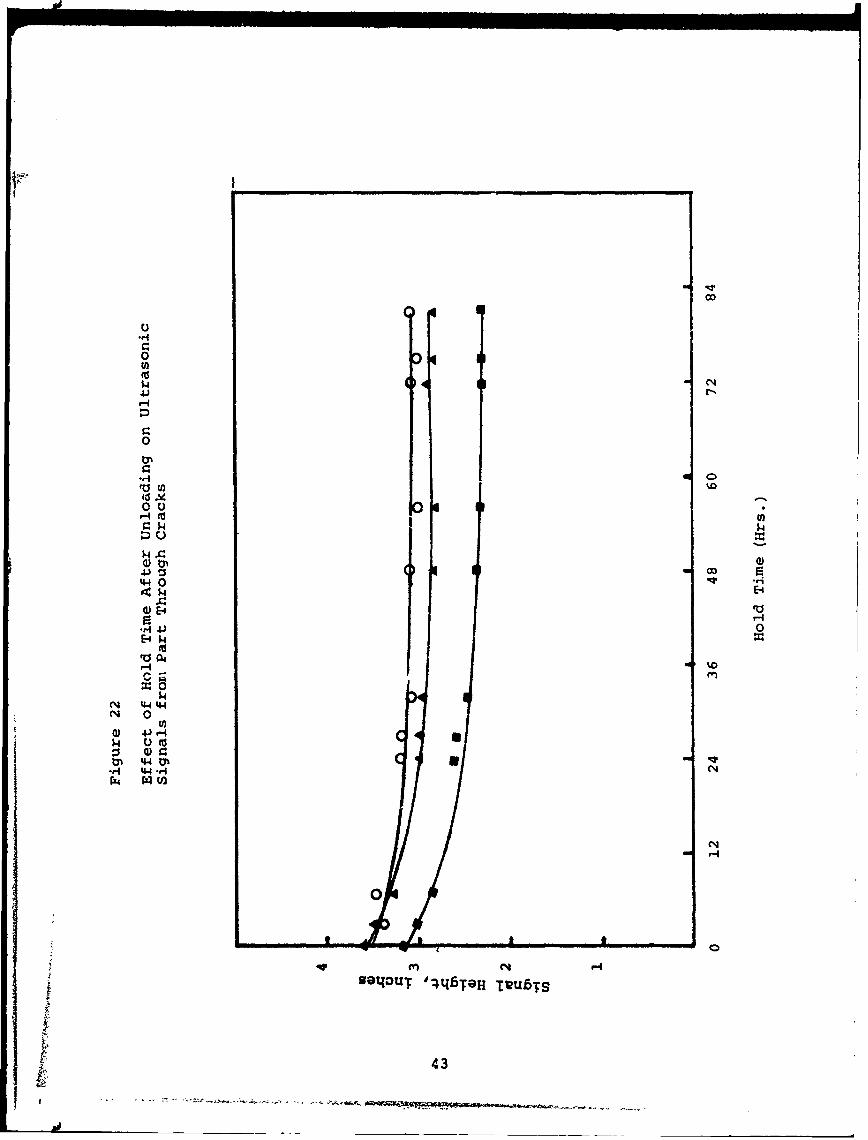
Effect of Hold Time
A series of experiments designed to study the influence
of hold time on the ultrasonic response was also conducted.
The specimens were initially loaded in tension to saturation
of the ultrasonic signal. After that time they were unloaded
and examined at periods for up to four days by thi nozmal
shear wave technique at no load. Figure 22 shows the effect
obtained. The signals appear to show a moderate decrease in
intensity after the first 12 hours, after which the lost in
signal strength is considerably less. Specimen A48 showed
a much largei drop in signal intensity for the first 24 hours
after which no significant loss in strength was seen.
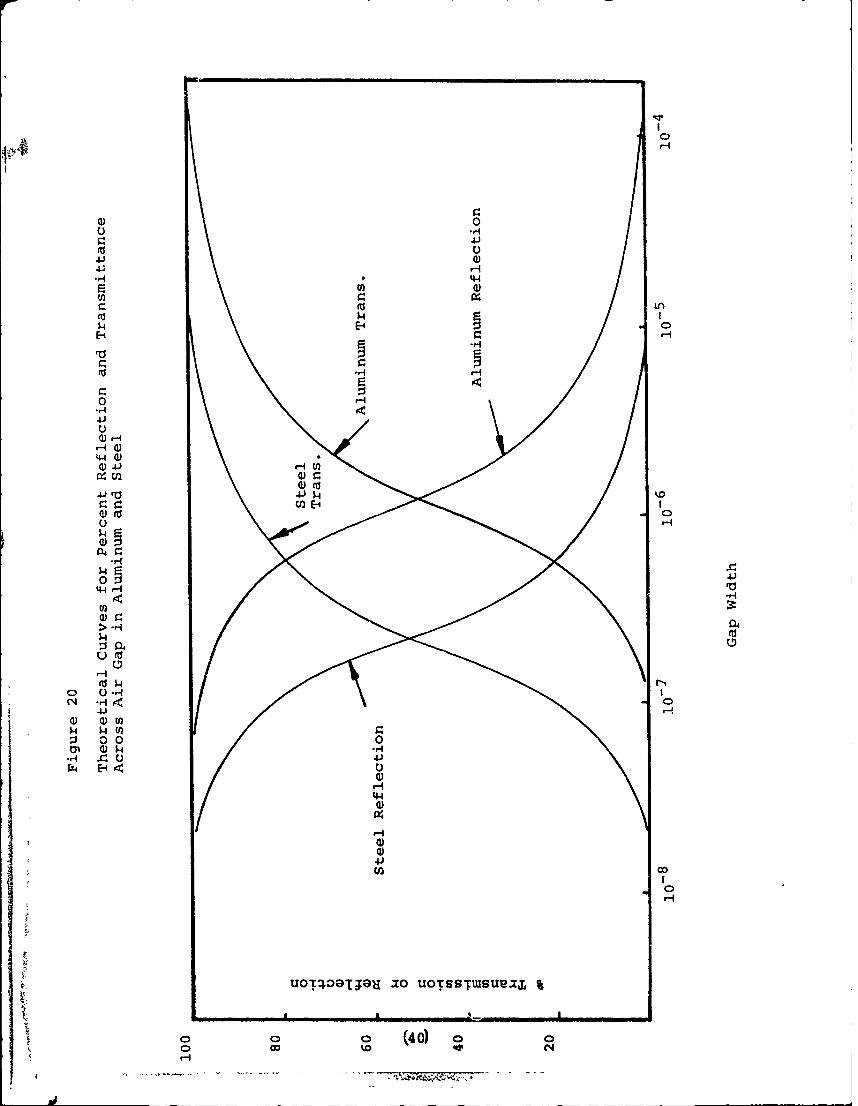
It appears that this may be associated with a "tightening"
of the crack due to gradual loss of the residual stresses
associated wzLh the crack tip plastic zone. There is associated
with the loaded crack a degree of closure due to its having
been formed by fatigue cycling. This closure results in a
touching of some adjacent portions of the crack face, particu-
larly at the free surfaces of the specimen, i.e. the semi.
major axis positions. As the crack stress field relaxes, this
41
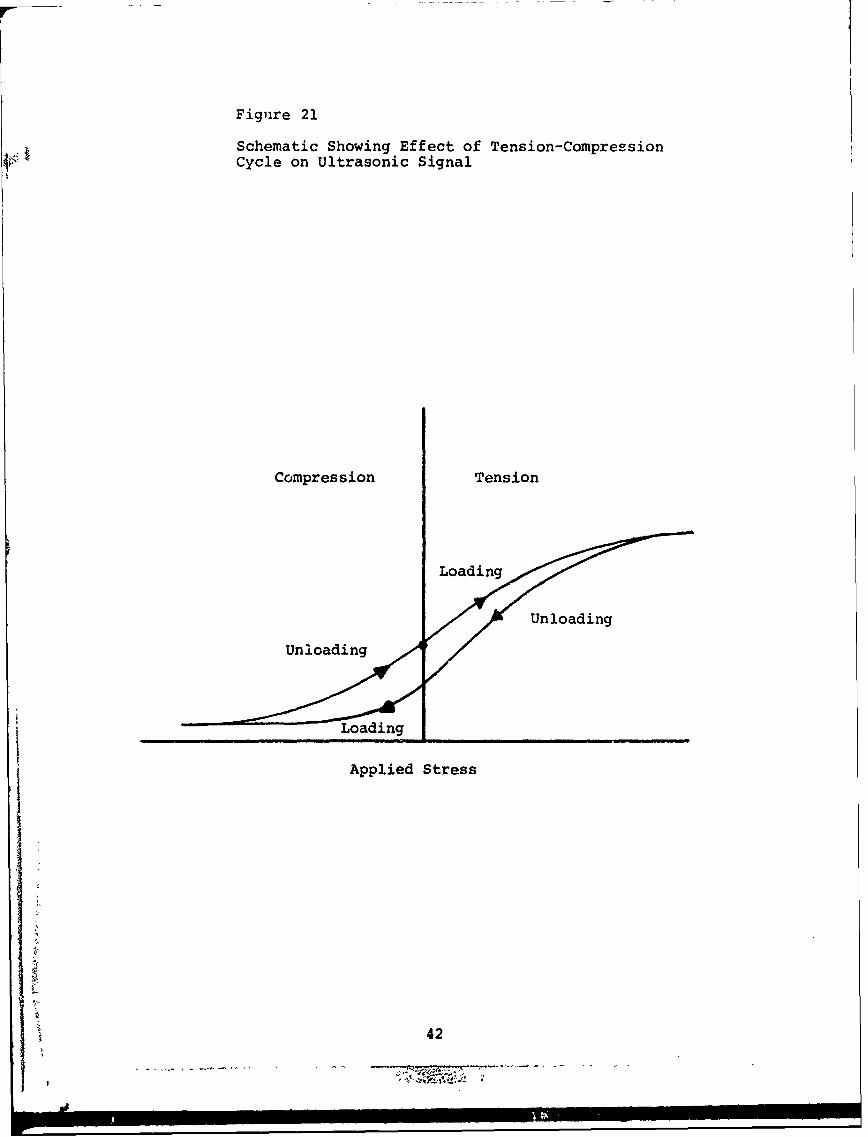
Figure 21
Schematic Showing Effect of Tension-Compression
Cycle on Ultrasonic Signal
Compression Tension
Loain _____Loading_______
Applied Stress
42
too
U{
.,4
0
0 0
H ,-.4
0
01z00
4 00, 4 . ,4
:4J
E ~r-
.- 4q 4) 0
H
14 4(
N 0
4J43
results in a "tighter crack". This is in contrast to fatigue
experiments conducted by others which indicates that sufficient
hold time effectively reduce the degree of closure on the specimen.(13)
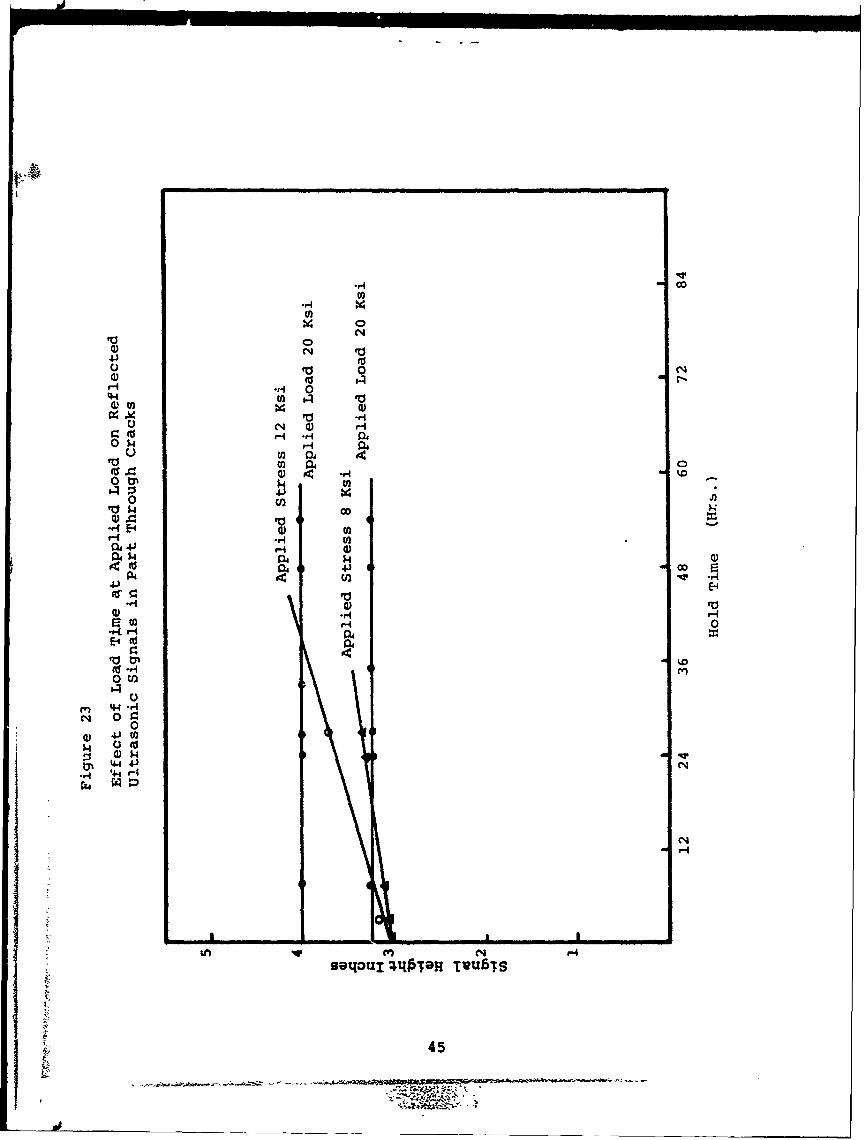
The influence of hold time at the applied stress level is
shown in Figure 23 . Here the specimens have been loaded
to a given stress level and the reflected signal intensity
measured as a function of the time at load. At the time the
loads were measured, and relaxation load loss was made up by
adjusting the position of the crosshead by hand so that the
load reading remained the same independent of the degree of
relaxation of the specimen.
For specimens that were loaded to loading stresses less
than those required to cause saturation of the applied signals,
the load relaxation and subsequent change in deflection of the
specimen needed to compensate for relaxation caused the
ultrasonic signals to increase slowly but continually during
the test period. These increases appeared to be due to a
creep relaxation of the tightness of the crack faces resulting
in an increased reflection from the interface. The degree
of relaxation, as was expected, increased with increasing
applied stress, and hence, there was a greater increase in
signal reflection for the more highly loaded cracked specimens.
For specimens loaded to within the saturation level of
stress, i.e. 20 ksi, increased time and loading crosshead
compensation did not result in an increase in the reflected
signal. The crack faces appear to be as reflective as they are
going to be due to the initial opening of the crack by the
applied stress and further time at stress serves no purpose
44
jd_ _ _ _ _ _ _ _ _ _
41-
0
U 0)
0 $4 H4 0u. U) 04
To w 0
0 Nt0i
Hr E-4 0014 H 0
04~ 404
o .I2
*r4E 0 )-0 W)
044 H-0N 041 a4 1
00H1 0
0V 14) 4.4
0145
4.~4JC
with regard to increases in the reflected signals.
Effect of Corrosion
The effect of corrosion on the ultrasonic detection of
fatigue cracks was investigated as well as the influence of
corrosion on the detection of EDM notches. Several fatigue
part through cracks were subjected to 24, 48 and 72 hour
exposion to a 5% NaCl salt solution, and three others were
subjected to a salt spray of NaCl for several days. The salt
spray and dipping in the salt solution resulted in a relatively
severe surface pitting and corrosion.
Ultrasonic inspection of the fatigue cracks was conducted
in the normal manner using a 5 mhz transducer with a 450
Lucite shoe. The maximum value of the signal reflection was used.
Table VIII shows the results of the corrosion. It was
found that the corrosion had no effect on the signals received
from the EDM notches, This agrees with the results found by
Boeing( 6 ) where there were no significant effects of corrosion
on the reflected signal, as shown. This indicates that the
corrosive effect significantly opens the surface of the fatigue
crack to prccuce high reflection.
A similar series of fatigue cracked specimens containing
both the bolt hole and fatigue crack were corroded in the same
salt. solutions. The specimens were examined by 450 shear
wave ultrasonics. This indicated that significant improvements
in the ultrasonic signals are obtained when the surface of
the fatigue crack is subjected to mild corrosive environments.
Several specimens containing fatigue cracks eminating from
the bolt holes indicated that unless the specimen was cleaned
46
sufficiently, there remained sufficient material within the
crack that would reduce the ultrasonic signals.
4
•k• 4 7
I•4~
SECTION V
INDICIA ANALYSIS
Introduction
When the size of the defec ,nder investigation by ultra-
sound is larger than the diameter of the transducer, such
as a long delamination within a weld, measurements of the length
of the defect are relatively simple and straightforward. The
position of the transducer at which the initial defect signal
is received is noted, and the transducer moved along the
direction for which the greatest length of the defect is
indicated. The position at which the signal reflection drops
is also noted, and the difference between the two positions of
the transducer are noted and measured. This is the approximate(8)
length of the defect. Krautkramer recommends using the
position of the transducer for which the ultrasonic response
is 50% of the peak response, but this amounts to only a small
correction for large flaws.
Giacomo, Crisci and Goldspiel( 1 4 ) describe an ultrasonic
method for measuring the crack depth in large structural weld-
ments of high strength steels and titanium. They use the motion
of the transducer, essentially perpendicular to the plane of
the defect as a measure. To perform a crack size measurement,
the transducer is moved slowly until the reflected signal
reaches a lower threshold level, passes through a maximum
when impinging fully on the flaw, and diminishes when passing
over the crack plane. The crack size-transducer-geometry
is then used to estimate the size of the flaw. The basic
48

equation is given by:
Where the geometric parameters are given in Figure 24.
Typical results are shown in Figure 24. In almost all cases
the technique underestimates the size of the flaw due to (1)
tightness of the crack, (2) crack branching and (3) multiple
reflections from the surface of the crack.(14) The influence
of crack tightness, stress level and roughness cn the measure
of the crack length has been discussed in a previous section.
Considerable Soviet work exists on measurement of defects
in welds by ultrasonic techniques. Gurvich and Ermolov(15)
have published a treatise on ultrasonic flaw detection in welded
joints, and numerous other Soviet scientists have contributed
to the understanding of the factors influencing weld defect
detection by ultrasonics. Gurvich and Ermolov introduced
the concept of a scattering "indicatrix", or "indicium" as a
measure of the size and configuration of imbed( defects.
The indicia is a normalized function describing the total
field of an ultrasonic wave reflected toward the probe.
Geometric Concept of Indicium
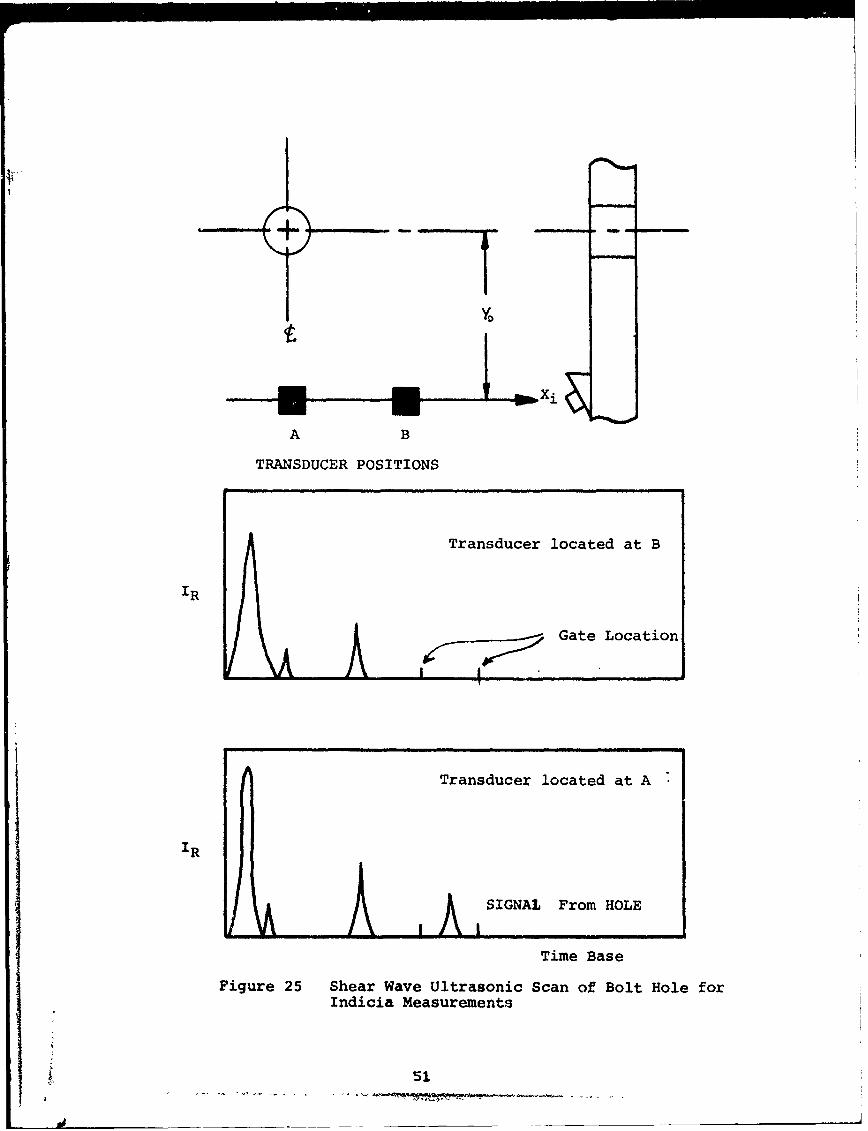
Consider the ultrasonic setup pictured in Figure 25. Here
the bolt hole is in the process of being scanned by a transducer
with a shoe converting the normal wave tc shear mode. The
transducer is positioned so that it is at the correct distance
t/cosT to obtain a reflection associated with the hole after
49
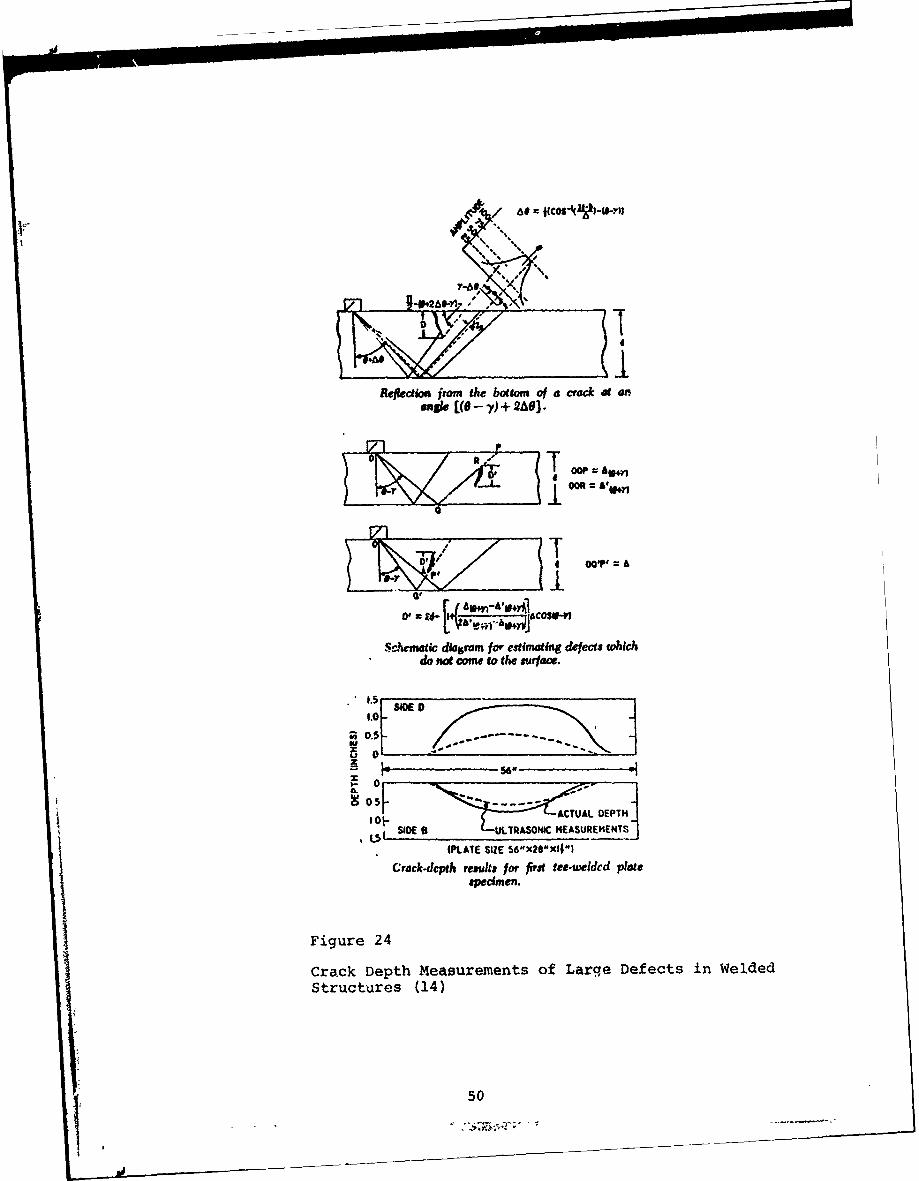
imedion irom the bottom of a crack at adngl, [((- y) + 2Ae].
R- ..
OOP &~r OXiOR AI+Y
0' /I" -'֥ ..
Oo Z1 III- 00)' = : 4'2o,, ,. iacoser.'
ivacmatic diagram for estimating defects whichdo noa come to the urface.
I.0 - ~-0 .5-
-- 56 -- s--.. ..IU
0-C
0.j-
-o- ACTUAL DEPTH
SI• DE B ULTRASONIC HEASUREFENTS
IPLATE SIZE 56"X28"XtIPI
Crack-depth results for first tee-welded platespecimen.
Figure 24
Crack Depth Measurements of Large Defects in WeldedStructures (14)
50
A B
TRANSDUCER POSITIONS
Transducer located at B
IR
Gate Location
Transducer
located
at A
ASIGNAL From HOLE
Time Base
Figure 25 Shear Wave Ultrasonic Scan of Bolt Hole forIndicia Measurements
J 5

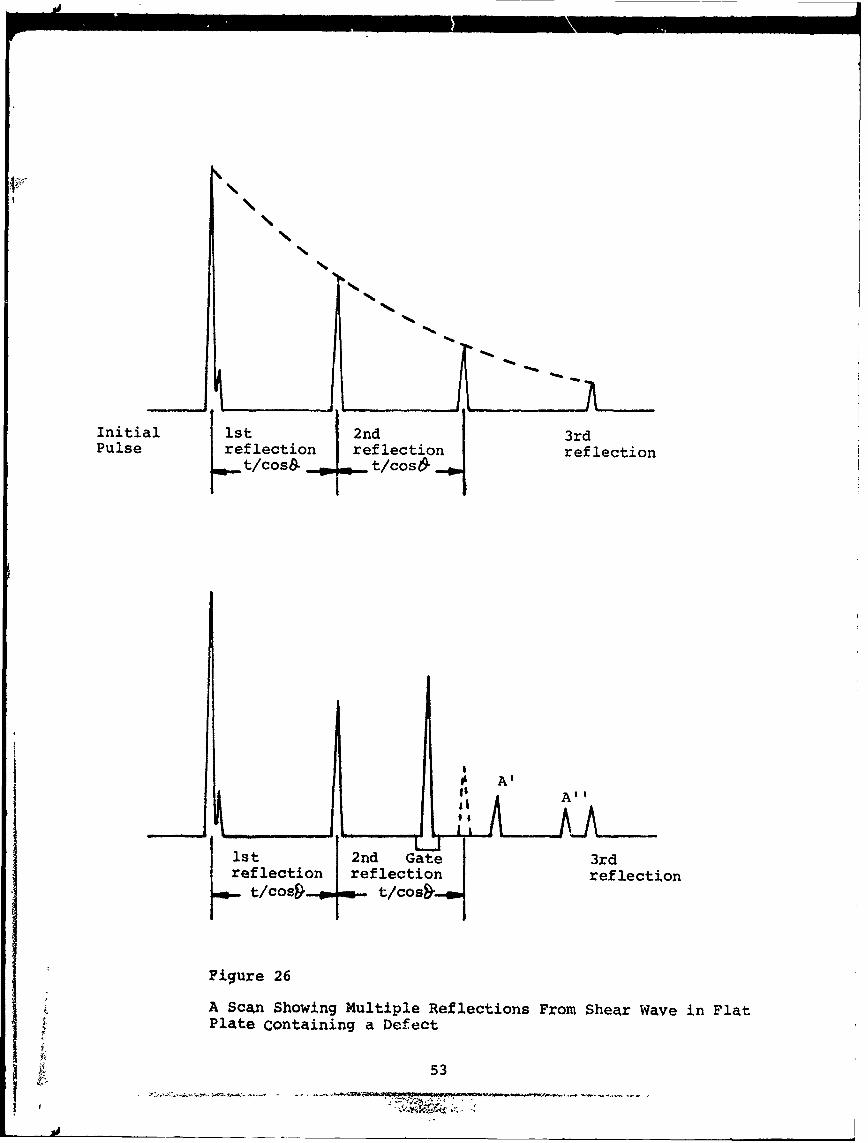
reflection from the lower surface of the plate. There would
be a second reflection located at 2t/cos• , which is associated
with the second reflection from the top surface of the plate.
These two reflections are shown in Figure 26. There are add-
itional reflections associated with higher order interactions
of the beam with the top and bottom surface of the plate, but
these need not enter into the discussion.
When the transducer is located directly in front of the hole,
there is an additional reflection due to the hole with partial
or complete supression of the second reflection. This is shown
as the lower half of Figure 26. Here the hole reflection signal
is shown located between the first and second reflections
resulting from the position of the transducer and bolt hole.
(If the distance from the transducer to the bolt hole were
different, the reflection from the bolt hole may appear in a
different position) Thus, it is important to understand the
particular geometry of bolt hole-transducer reflections to
be able to identify and locate the particular signal associated
with the bolt hole. There appear to be several other reflections
such as A' and A'' which can also be associated with the bolt
hole. For the sake of simplicity, however, only the first
reflection from the bolt hole is used in this analysis. However,
it should be recognized that in some indicia studies reflections
other than the first may be used.
If the dc signal from the defect is gated and plotted as
a function of the position of the transducer and indicia of the
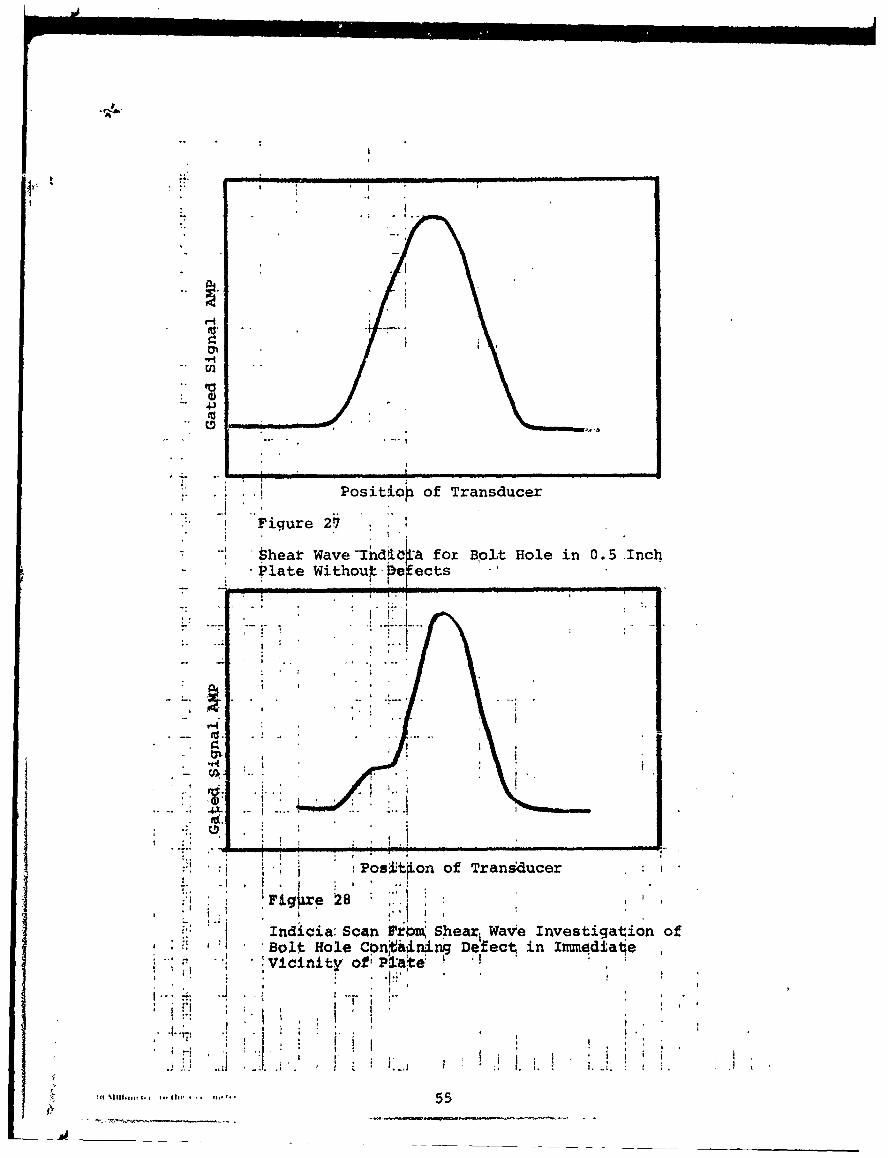
bolt hole is developed as shown in Figure 27 for a good hole.
This indicia represents all of the reflections associated with
52
J
Nb
I___•
Initial ist 2nd 3rdPulse reflection |reflection |reflection
_t/cos& t/cos6
WAN.-
0' At#its AlIst 2nd Gate 3rd
reflection reflection reflectiont/coSsý t/cos&
Figure 26
A Scan Showing Multiple Reflections From Shear Wave in FlatPlate Containing a Defect
53
9 4i
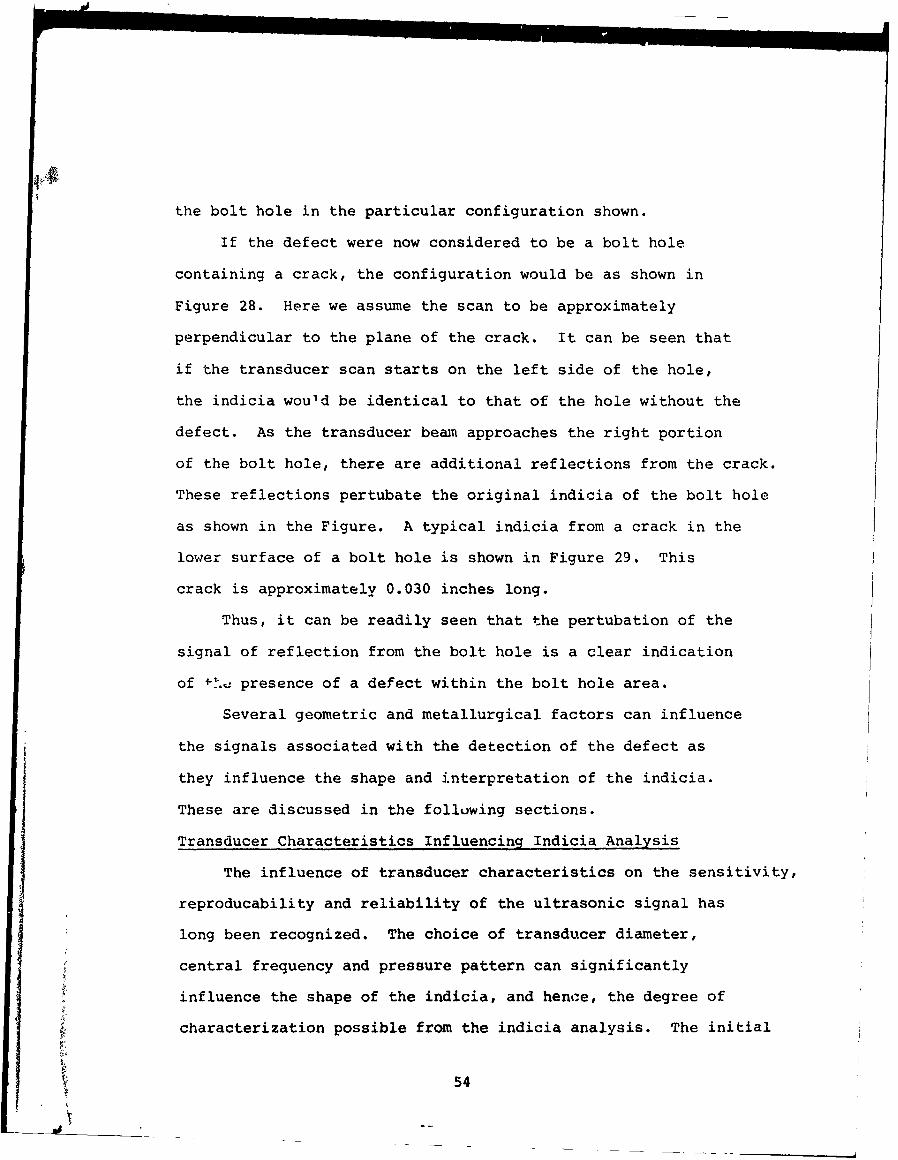
the bolt hole in the particular configuration shown.
If the defect were now considered to be a bolt hole
containing a crack, the configuration would be as shown in
Figure 28. Here we assume the scan to be approximately
perpendicular to the plane of the crack. It can be seen that
if the transducer scan starts on the left side of the hole,
the indicia would be identical to that of the hole without the
defect. As the transducer beam approaches the right portion
of the bolt hole, there are additional reflections from the crack.
These reflections pertubate the original indicia of the bolt hole
as shown in the Figure. A typical indicia from a crack in the
lower surface of a bolt hole is shown in Figure 29, This
crack is approximately 0.030 inches long.
Thus, it can be readily seen that the pertubation of the
signal of reflection from the bolt hole is a clear indication
of +-'.. presence of a defect within the bolt hole area.
Several geometric and metallurgical factors can influence
the signals associated with the detection of the defect as
they influence the shape and interpretation of the indicia.
j These are discussed in the following sections.
Transducer Characteristics Influencing Indicia Analysis
The influence of transducer characteristics on the sensitivity,
ifreproducability and reliability of the ultrasonic signal haslong been recognized. The choice of transducer diameter,ii central frequency and pressure pattern can significantly
V influence the shape of the indicia, and hence, the degree of
characterization possible from the indicia analysis. The initial
54
1IAl
J -I I ' I
* w
* .
!, * I i,. , ! Posituo of Transducer
-.. Figure 27
w1ea ave ±fluiL-LQ for Bol t Hole in 0. 5 Inchplate Without-brects
S i nShear Wav-nd~' Fri* Bplaat Investgai on 0.ofnc
'i y o
:' :I,,, OS o of Transducer i
÷. -1 . Of -'
I-- *' * I
•- "; ' " ' e ri55

Figure 29
Indicia Scan From Shear Wave Investigation of4 0.5 Inch Diameter Hole With 0.030 Inch Defect
In Lower Surface of Plate
~rt '~;IIM
w ilt,,
'
I t-
poito of Trndue
56 ih
choice of transducers was made based on the ability of the shear
wave configuration to find small part through cracks as discussed
in the previous sections.
Two methods of evaluating transducer characteristics
are available; (1) frequency spectrum analysis, and (2)
sound beam profile. Because the indiciam analysis is essentially
a position analysis us opposed to a frequency analysis, it
was felt that the exact frequency characteristics of the par-
ticular transducers)while of interest,would not be necessary
in this program. It is questionable whether frequency content
of the ultrasonic transducer obtained by continious wave
analysis is accurate for a pulse pattern.
Transducer frequency and diameter influence the sound
beam patterns because the diameter and central frequency
relate to the location of the end of the near field of the
transducer. The near field is the area where interference
effect due to interaction of edge effect and the plane wave
of the sound pressure pulse. (8) Beyond the near field distance,
wcll into the far field, the pressure pattern is relftively
continuous. For a circular transducer whose wavelength is
small compared to the diameter of the transducer, the location
of the near field end is given by: (8)
Where Y is the location along the axis of propagation of
the end of the near field
A is the wavelength of the ultrasonics =V/f
V is sound velocity
f is frequency
57
Al

Thus, the location of the gated reflection for the indicium
should be beyond the near field, If the gated reflection were
still within the near field, the presence of a small reflection
or no reflection in the indiciuxn need not be indicative of the
shape of the reflecting flaw but would be a characteristic
of the transducer pressure pattern.
Figure 30 shows the effect of transducer frequency on
single transducer shear wave detection of the crack associated
with a bolt hole. It can be seen thak the 2.25Mhz transducer
gives the lowest peak to peak indicium, while the 5 and 10- M..A
units giv:e approximately the same signal from the crack. All
three signals were adjusted so that the maximum reflection
from the hole were approximately the same. It is important to
recognize that particularly noisy signals can be produced by
a slight change in the positioning of the gate. For example
Figure 31 shows another crack eminating from a hole on the
lower surface with a straight shank but with the gate narrowed
down to only produce a signal within an extremely small
portion of the reflected space. The indication of the crack is
present, but is extremely noisy.
The divergence of the transducer beam also influences the
shape of the indicia. This can be significant if the divergence
of the beam is such that small defects within the beam pressure
pattern do not receive sufficient ultrasonic energy to produceif strong reflections. If thlý divergence of the beam is such that
the sound pressure pattern is broadly dispersed, this will occur.
A measure of the angle of divergence of the pressure pattern
is givenby
58
-w_A!
*1-i ., Typical A Scan
' I,
"--. Defect
I *i
Sr - , .- ..
i ., .% ±1HI.Li
I
4
"., .Transducer Position
Zf ei'- of, ý~ ue xgrnyo nii
Iesira A .p efc n VAiCinity 'of Bolt Hole
befe6 DI -"T 5ocihed n Bottor4 Pug4cq -q Plzte._ .. . . .59
II .
I , I * :'"
i '
_ _ _ _ _ . -. .-
1 '
443
04-J
00
o 4-o-N•
4J
0
4-
E-46
010
$4LC
0rX
60 ~
a) a).-
sino = 1.2)D
V Where sinLo is the half angle of divergence of
the pressure probe measured along the probe axis
>is the wavelength = V/f with V the sound velocity,
f the frequency
D is the diameter of the transducer
The calculated half angle divergences for 10, 5 and 2.5
Mhz transducers of 0.25 and .375 inch diameter are shown in
Figure 32. Also shown is a schematic illustrating the polar
divergence of the sound pattern. For this program six transducers
were evaluated.
It would be most effective to chose the transducer with
the smallest beam diameter. This would supposedly produce
the most sensitive indicia. However, the angle
of divergence only considers the pattern and not the magnitude
of the pressure pattern. To obtain a good reflection from the
defect one must not only have a good pressure pattern, but
must also have sufficient magnitude of acoustic pressure at
the point in question. Since the magnitude of the acoustic
pressure depends upon the ratio of the area of the transducer
to wave length, a larger area of transducer would give a higher
j acoustic pressure. Hence, it was decided to select the 5 MHz,
.375 inch diameter transducer for the balance of the indicia
studies. Additional studies have also been conducted with
other transducers.
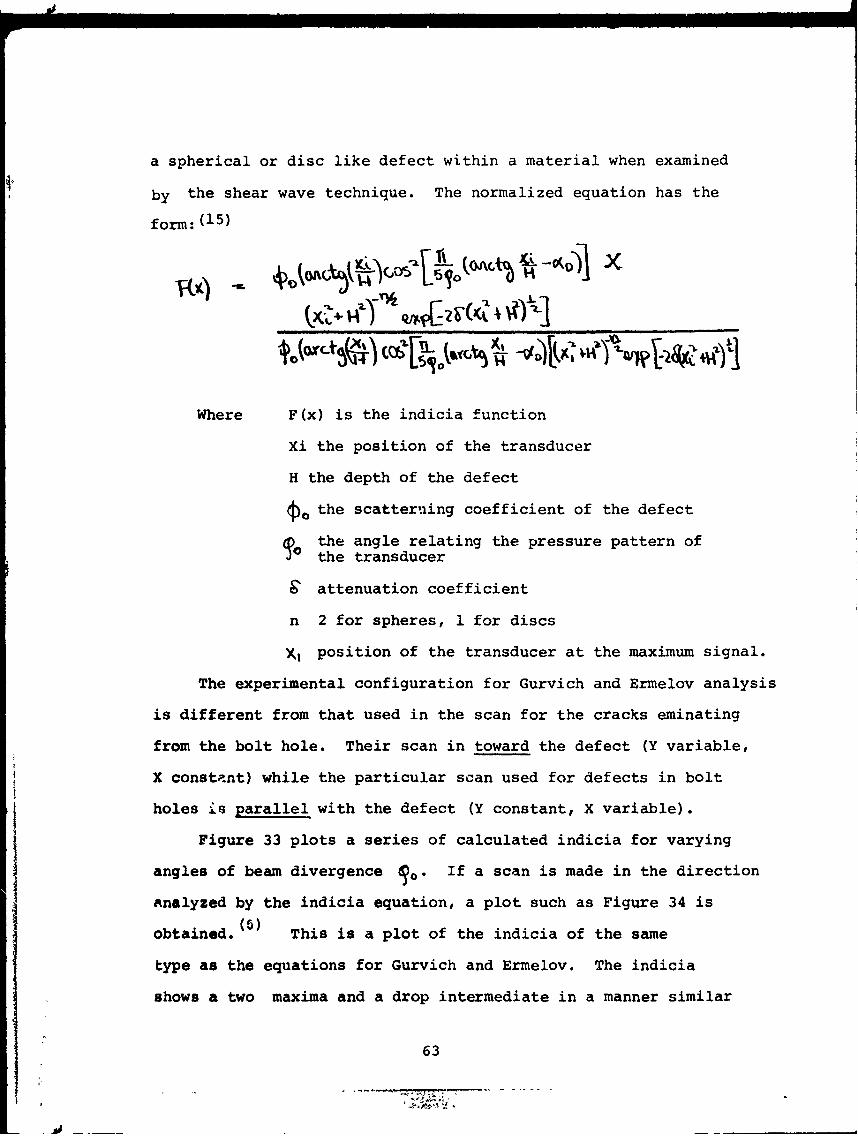
Closed Form Solution for Indicia
Gurvich and Ermolov have calculated the normalized shape
of the indicia that would be expected for reflection from
61
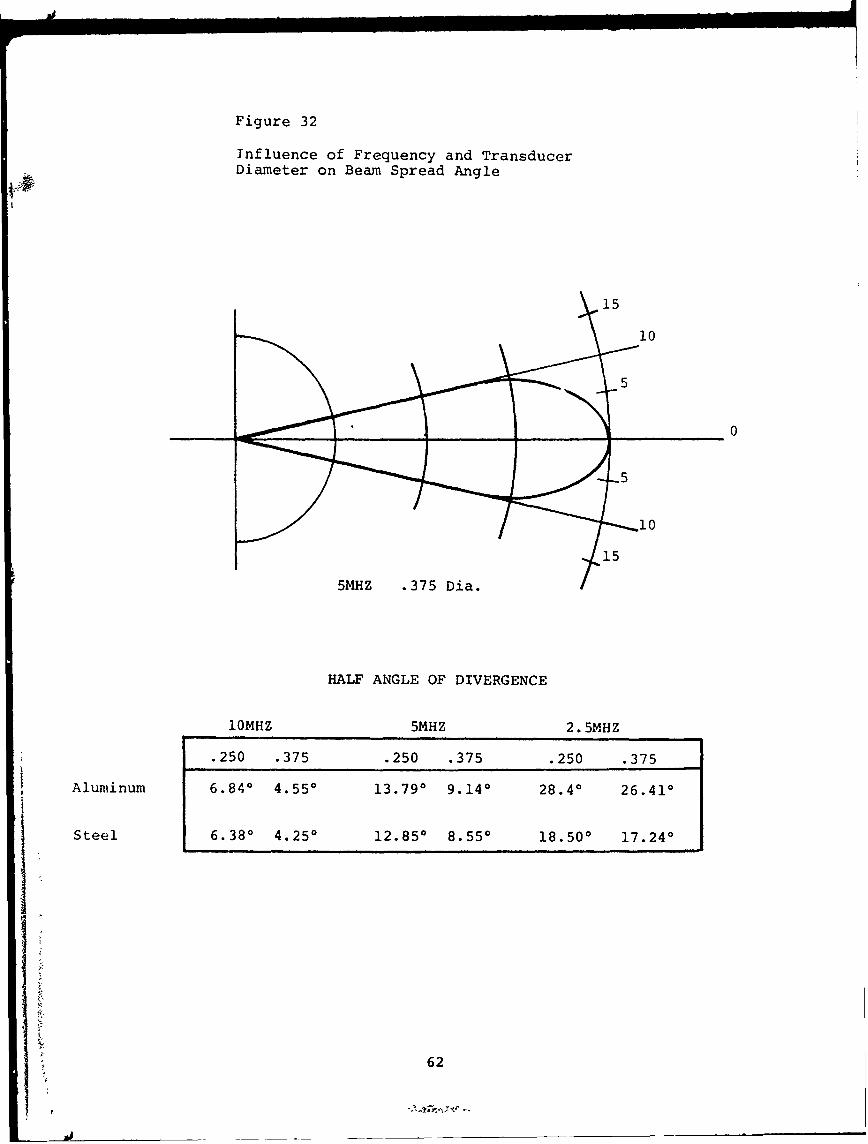
Figure 32
Influence of Frequency and TransducerDiameter on Beam Spread Angle
•15 i
.5
5MHZ .375 Dia.• • i
HALF ANGLE OF DIVERGENCE
10MHZ 5MHZ 2.5MHZ
.250 .375 .250 .375 .250 .375
Aluminum 6.840 4.550 13.790 9.140 28.40 26.410
Steel 6.380 4.250 12.850 8.550 18.500 17.240
62
ti
a spherical or disc like defect within a material when examined
by the shear wave technique. The normalized equation has the
form:(15)
Where F(x) is the indicia function
Xi the position of the transducer
H the depth of the defect
do the scatterning coefficient of the defect
the angle relating the pressure pattern ofthe transducer
Sattenuation coefficient
n 2 for spheres, 1 for discs
x, position of the transducer at the maximum signal.
The experimental configuration for Gurvich and Ermelov analysis
is different from that used in the scan for the cracks eminating
from the bolt hole. Their scan in toward the defect (Y variable,
X constant) while the particular scan used for defects in bolt
holes is parallel with the defect (Y constant, X variable).
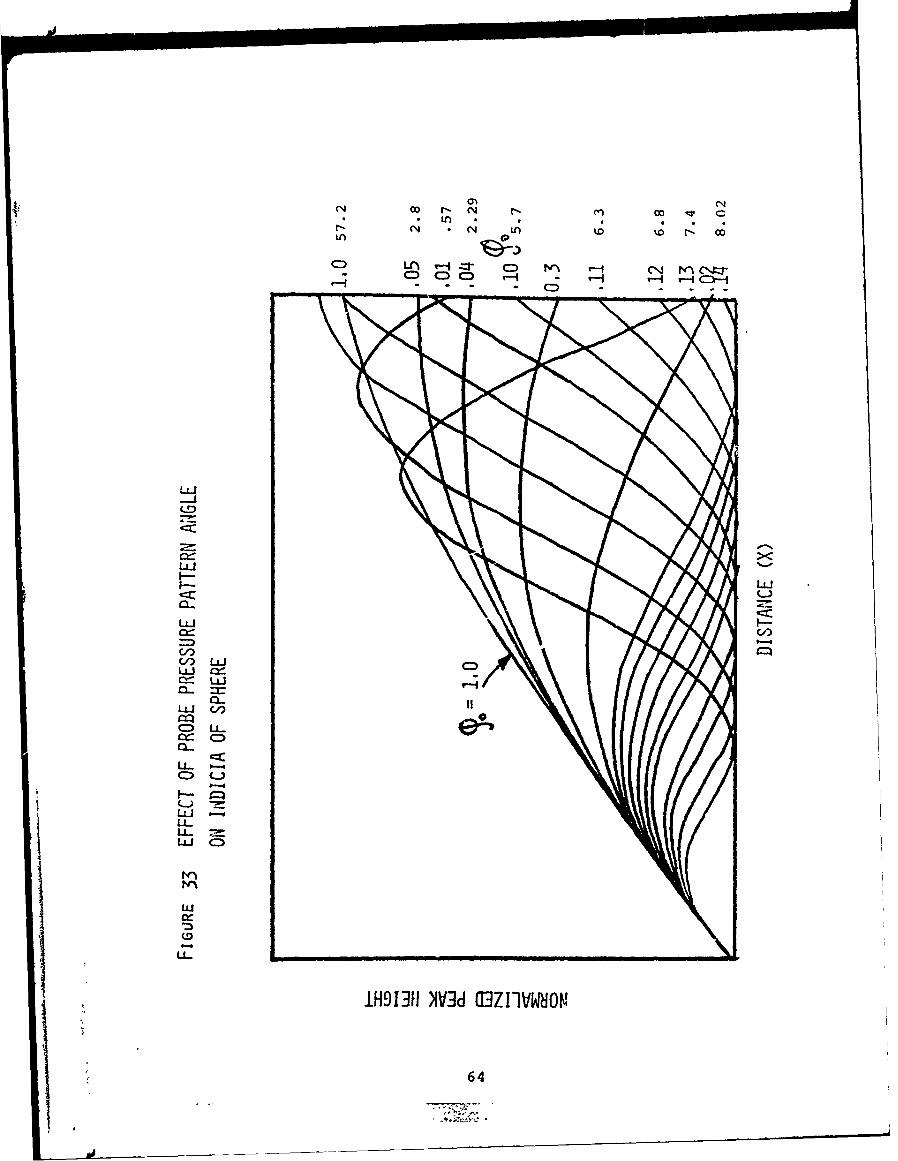
Figure 33 plots a series of calculated indicia for varying
angles of beam divergence 10. If a scan is made in the direction
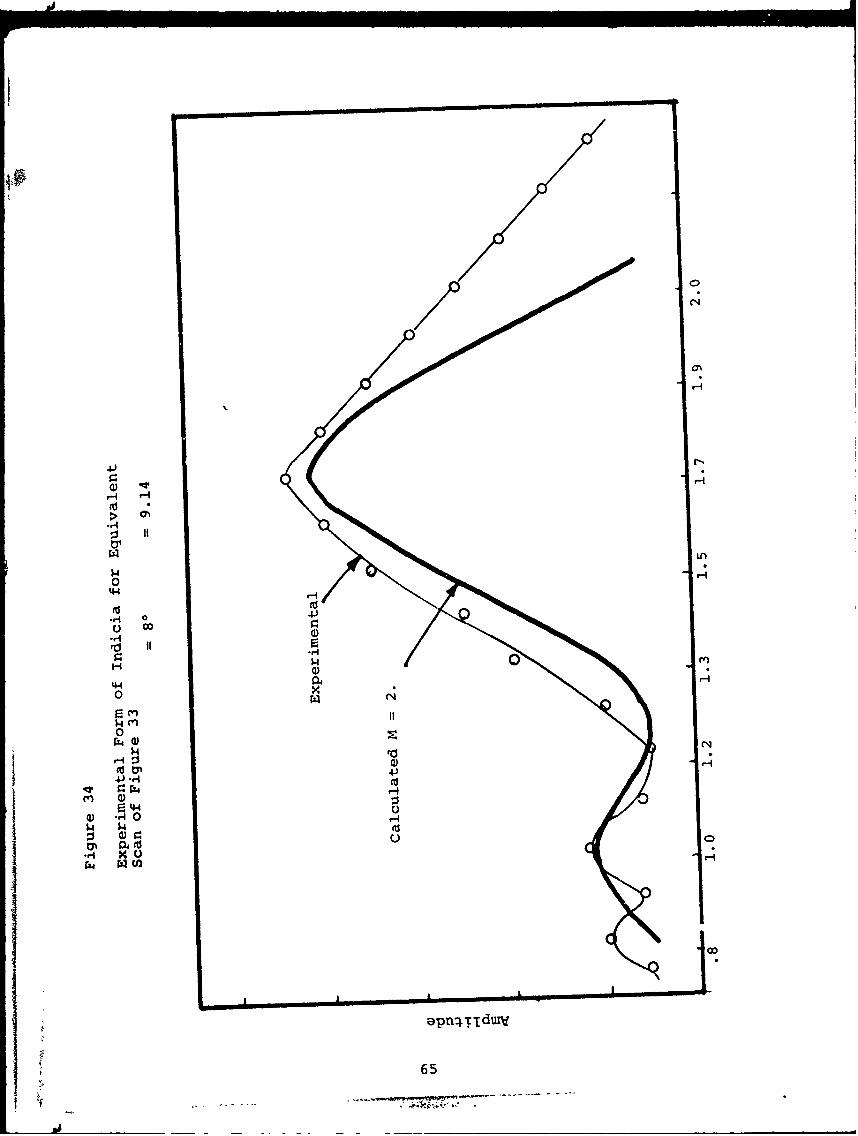
analyzed by the indicia equation, a plot such as Figure 34 is
obtained. This is a plot of the indicia of the same
type as the equations for Gurvich and Ermelov. The indicia
shows a two maxima and a drop intermediate in a manner similar
63
C) ~ .n C) trn* J
LUI
LUJ
COL
LUJ
LU LCJ C
LLJ =~
LU -
Ul-
U- %
U-
1H91311 )IV~d UJZIVWON,
64
0N
O'
4.)
0 4J*
44 0
0
4-4
.f44
4 $4 * H
00
ap-H-di
1.465
If.,
to Figure 33, however, the form of the curve is not identical
to that of the calculations since they are for a sphere or disc,
and the reflector in this case is a circular cutout. The fit
would not be expected to be too good, but follows the same
general pattern as expected.
If a series of traverses aze now made with the Y value
constant and the transducer moving in an X direction, the series
of gated signals would appear as shown in Figure 35. Here there
are two sets of peaks, one of which corresponds to the bolt
hole the other of which corresponds to the defect signal. In
each case the location of the centerline of the bolt hole
appears strongly, but the intervening reflection from the glancing
sides of the bolt hole reflect away from the reciever, and
are not contained within the indicia. This can be considered
to be a form of "focusing" in which the relative reflections
associated with the defect and bolt hole can be tuned in such
a manner as to magnify the presence of the defect.
If the system is defocused by positioning the gate that the
reflections from a majority of the bolt hole are outside the
gated region, while the reflections associated with the defect
are within the gated region, a sequence such as shown in Figure
36 results. The series indicates that the indications of the
crack presence can be greatly exaggerated by the local combination
of focusing and gating.
When two defects are present on both sides of the bolt
hole one would expect the Indicia to be trimodel, with the
major lobe indication of the bolt hole flanked by two side
patterns. This is illustrated in Figure 37, where two defects,
66

4-)
0)M
0
-4)
0 -0
044
0
4 03
0.,4 r4-) 0-,4
a)f
'00
E-1
rn0
0 Q)01 4
U.) 44
67)
7=711.
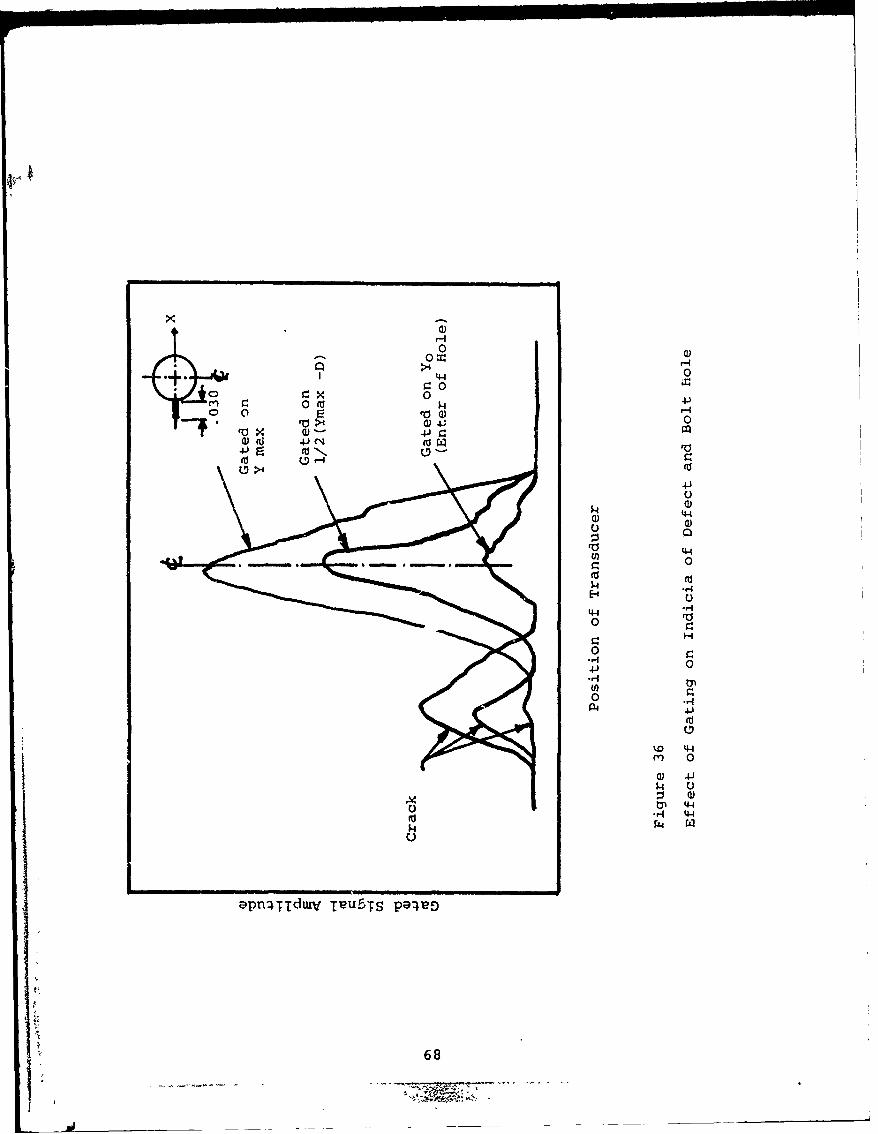
4-)
9 00 l4 x
413Ua)
Q))
to 4-4U) 0
44 Cu
U)U
0
.14-)
4Y) 0
$4.
rq0 441
k FY4 W
C-)
;Dpn*TTdtiMV T'eU5TS P94PD
68
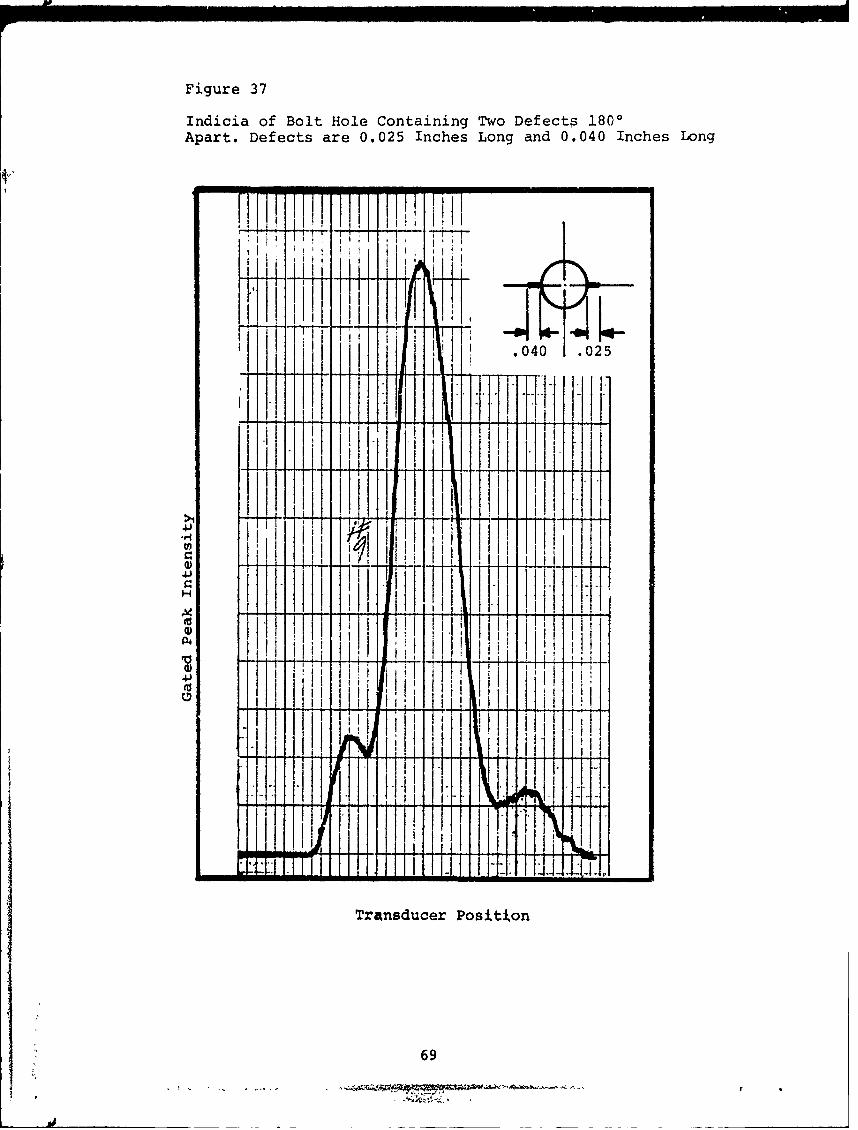
Figure 37
Indicia of Bolt Hole Containing Two Defects 1800
Apart. Defects are 0.025 Inches Long and 0.040 Inches Long
I I 040 .025
>1
4.)
4.)
00
Transducer Posi~tion
69
Ji-
-
one 0.040 inches (left) and one 0.025 inch('s (right) are
growing out of the fastener hole. The identification of the
presence of both defects is easily seen for this configuration.
Effect of Defect Orientation in Bolt Holes
If the transducer scan direction is not parallel to the
orientation of the crack, the indications of the defect within
the bolt hole are obviously not as clear as shown. The pertubation
of the bolt hole indicia does not occur as a bimodel indicium
within the bolt hole scan, but occurs as a st~condary peak or
bump on the rising or falling face of the original indicia. This
is shown in Figure 38, where three different scans have been
made at 90*, 450 and at 200 to the orientation of the crack.
The position of the defect along the bolt hole indicia is
shown.
A simple proportion can be made relating the percent of
the distance along the bolt hole indicia to the orientation
angle of the normal to the crack. Hence, if the location of
the pertubation on the bolt hole indicia is midway between
that of the bolt hole maximum indicial point and the lowest
point of the scan, one may relate this to a 450 angle between
the defect and probe axis. This proportion is shown in Figure 39.
It can be seen that the experimental results agree with this
simple proportion analysis.
One closing point should be made. The point at which the
defect would be the most difficult to identify by the indicia
would be when it is located perpendicular to the sound beam.
Here the beam would encounter the smallest cross section of the
70
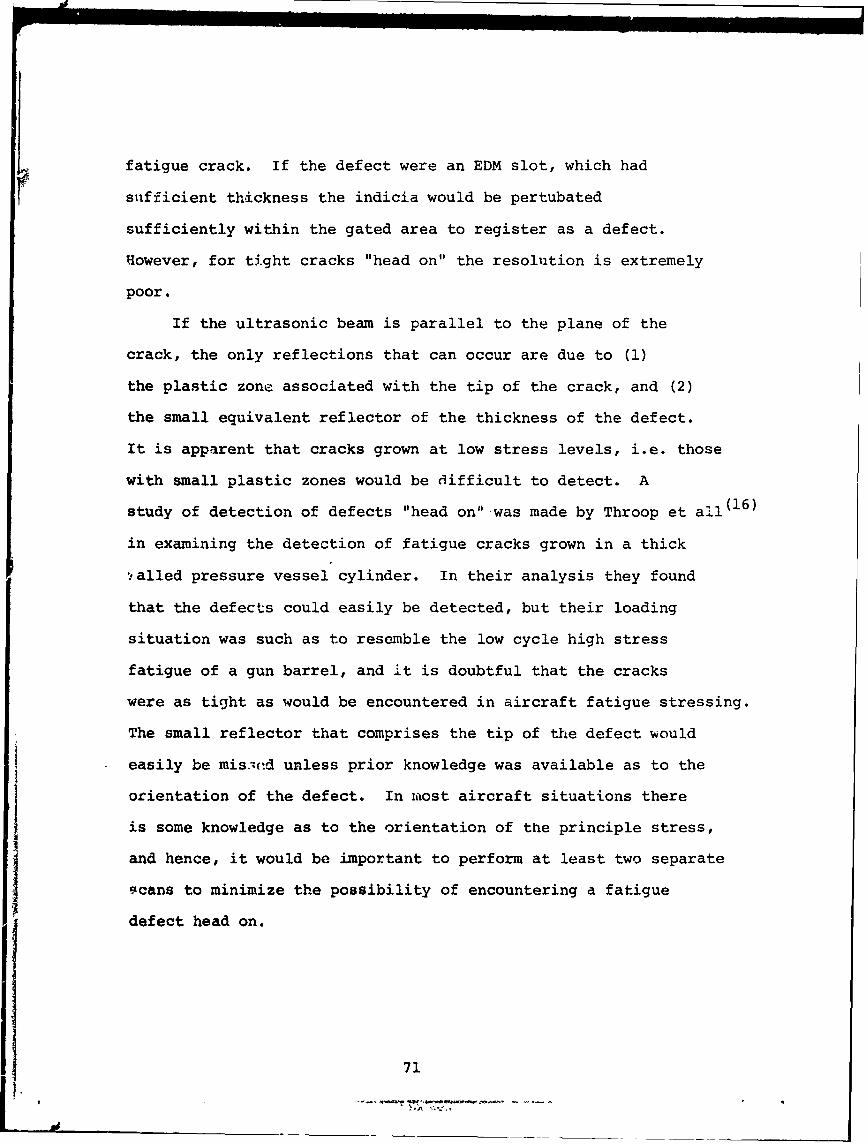
fatigue crack. If the defect were an EDM slot, which had
sufficient thickness the indicia would be pertubated
sufficiently within the gated area to register as a defect.
However, for tight cracks "head on" the resolution is extremely
poor.
If the ultrasonic beam is parallel to the plane of the
crack, the only reflections that can occur are due to (1)
the plastic zone associated with the tip of the crack, and (2)
the small equivalent reflector of the thickness of the defect.
It is apparent that cracks grown at low stress levels, i.e. those
with small plastic zones would be difficult to detect. A
study of detection of defects "head on" was made by Throop et all( 1 6 )
in examining the detection of fatigue cracks grown in a thick
S•alled pressure vessel cylinder. In their analysis they found
that the defects could easily be detected, but their loading
situation was such as to resemble the low cycle high stress
fatigue of a gun barrel, and it is doubtful that the cracks
were as tight as would be encountered in aircraft fatigue stressing.
The small reflector that comprises the tip of the defect would
easily be mis.4ed unless prior knowledge was available as to the
orientation of the defect. In most aircraft situations there
is some knowledge as to the orientation of the principle stress,
and hence, it would be important to perform at least two separate
scans to minimize the possibility of encountering a fatigue
defect head on.
71
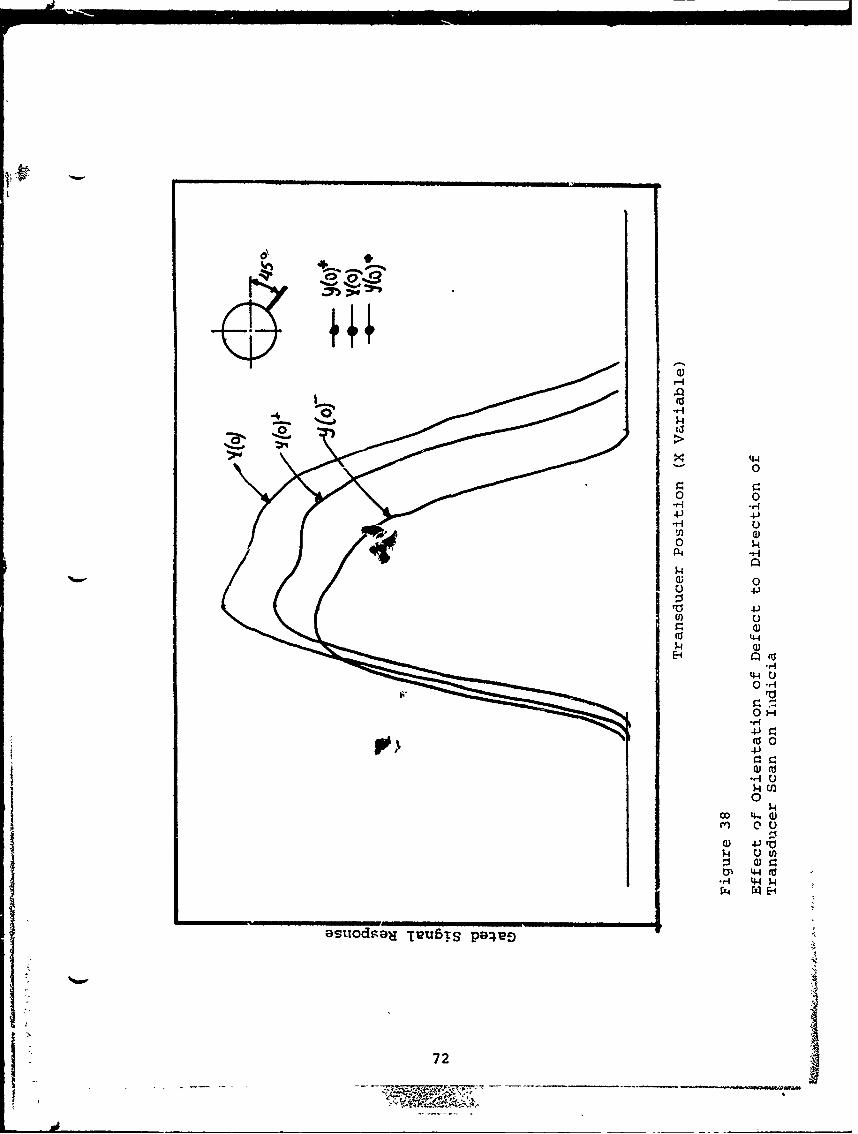
4s.4
CII
.........................
0
0 041-) 4-)
UQ)
4-I
Q)E-1-
o .-4
0OH-44.J
4-I
dý UH m)0
ý4r
t~l 4-4 (U-4q 4-4 M
72
4JQ4 0
44
0 (0
-H 4H
ro 0 r. o0.M 0 (n 0
MU W1 *4.0.0 4 z)0 -,- 00 0
H440 4.< o aIn0W. ,-- 04
cn (34
H 0IV., •4
V)4-0 0 04 00 oH 0 44
f 0 4-).0- N.. (Dcrcl
O$4 0)
m $4 .:J 4 za) 0 (d4.)
r- r4 0)C7) Ad 4
0% O4 00 I* en4
0lo 04 0oa ;0 0 0 49T0 10
73
SECTION VI
TRANSFER FUNCTION ANALYSIS
Introduction
If the pertubation of the indicia by the presence of the
defect is small, as would be with cracks on the order of 0.020
inches eminating from the bolt hole, the identification of the
presence of the defect by direct examination of the indicia
becomes difficult. When there is roughness within the hole,
or the exact position of the gating is such as to produce
noisy signals, the random variations of the reflected signals,
and the noise within the indicia may hide the larger pertubation
that is the crack indication.
In the use of an indicia technique, it would be impractical
for an x-y plotter to be present in the field to draw the
indicia and have it examined visually for verification of the
presence of the defect. For this purpose it was decided that
some form of pattern recognition technique should be used to
enable on-line, real-time interpretation of digitized indicia
information to be made. Hence, recognition of the presence
of the defect could be made without recourse to visual
examination of the indicia.
It was suggested that we exam.ne Fourier analysis techniques,
as well as transfer function and Bode techniques to see if
these would produce sufficient characterization of the defect
as distinct from the bolt hole. In this section, the impulse
74
I4
analysis techniques used for signal recognition are discussed
and presented.
Impulse Analysis
Impulse analysis may be considered as an "input-response`
method where the response of a system to some forcing function
is measured. It is usually desired to deduce from such a
a test the most likely form of the system transfer function,
Tr(s). (17)
Let I(t) be the process input function, with the input
defined as a pulse where at t = 0, I(t) = 0, and let 0(t)
be the process output function. Then
Tr(s) = 0(s)/I(s) = L.[0(t)]/L[I(t)]
Where the transfer function is defined as "The ratio of the
Laplace transform of the output function O's) = Laplace 0(t)
to the Laplace transform of the Imput function I(s) = Laplace
I(t)". The Laplace transform is defined as;
Ljf(t)] = f(s) = f(t) exp(-st)dt
Where s is a complex variable defined by s = T +jW,-withj -
The Laplace transform is a linear transformation between
functions defined in the t domain and functions defined in the
s domain. Knowledge of the form of the transfer function implies
knowledge of the processes differential equation, and therefore,
of the process mechanism. For example, the driving differential
equation for a first order process may be:
75
...............
T dy(t)/dt + y(t) = Kx(t)
Whose transfer function is given by:
Tr(s) = K/Ts + 1
Since the Laplace transform of this equation is:
(Ts + 1) Y (s) = Kx(s)
If the impulse equations I(t) is a dirac impulse function, as
shown in Figure 40, the Laplace transform of the input function
is L(d(t)) = 1, since the Laplace transform of a unit impulse
is always unity. The response function of the first order de
is given by: (17)
X0)= AKXO(t) =A exp - t/T which is
graphically shown in Figure 41. This equation can be rearranged
and plotted on semilog coordinates as:t
AKin CO0(t)] = in (_T-- - T
Thus, one may see that the impulse response of a first order
differential equation is a straight line. In a like manner,
the differential equation for a second order process has aitransfer function of the form
Tr(s) =K
T 2 s 2 + 2Tts + 1
and the response can be overdamped, critically damped or under-I damped for different cases of the damping ratio A being greater
76
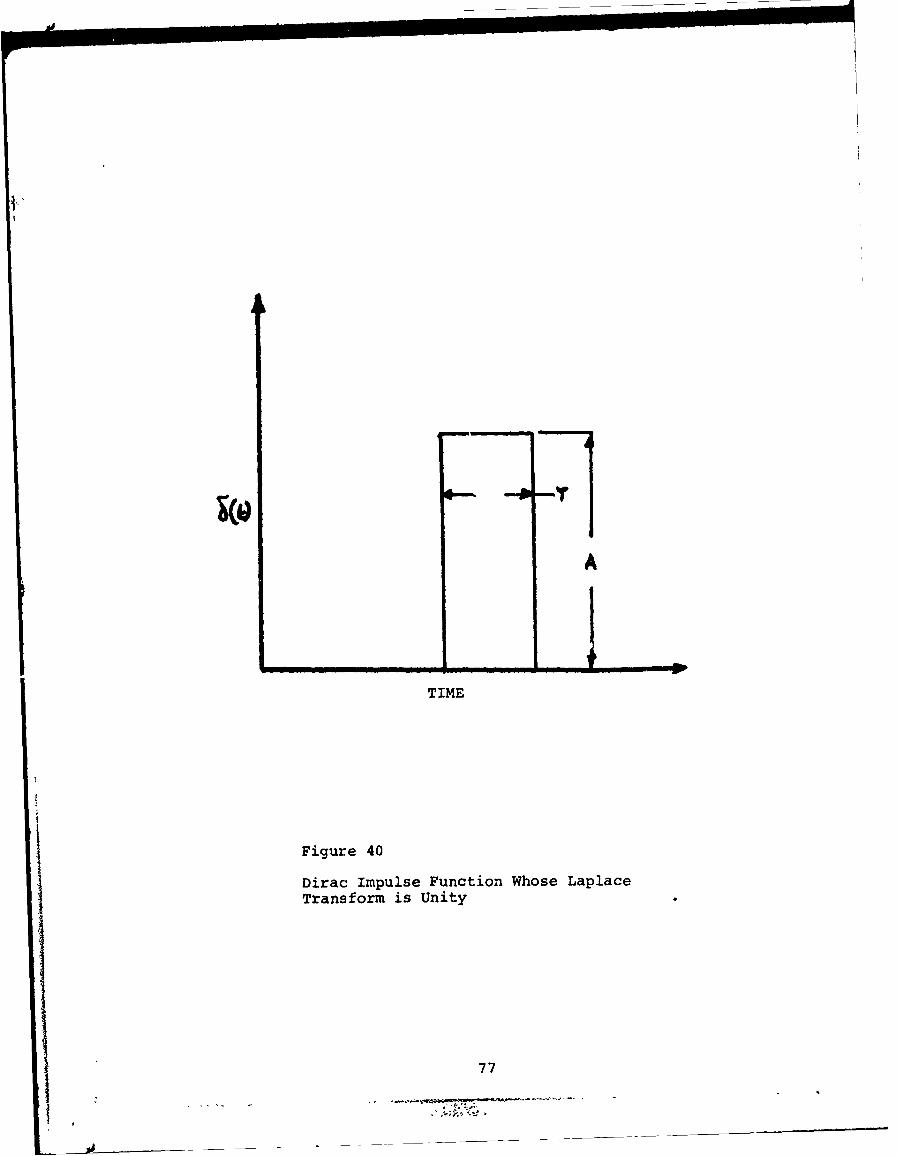
TI
A
TIME
Figure 40
Dirac Impulse Function Whose LaplaceTransform is Unity
77
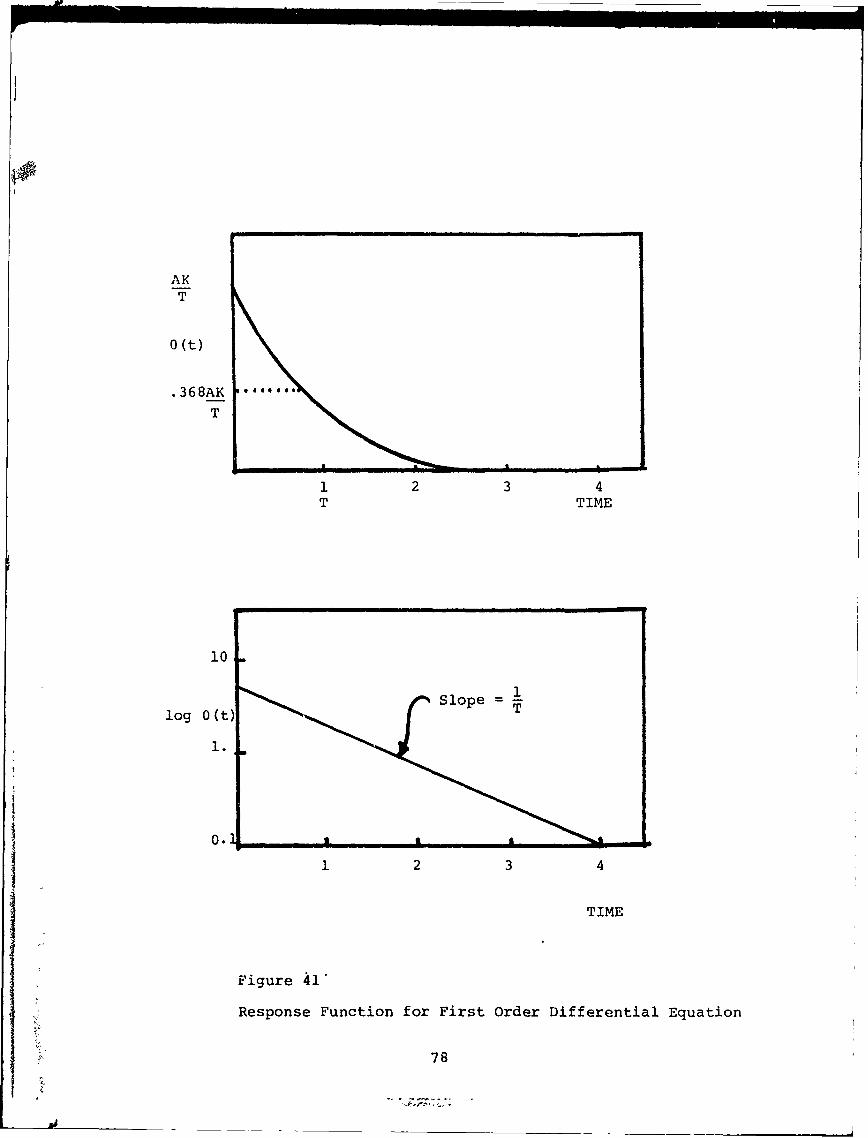
AKT
0 (t)
.368AK
T
1 2 3 4T TIME
10
Slope=log 0 (t)
1.
0.
1 2 3 4
TIME
Figure 41'
Response Function for First Order Differential Equation
78
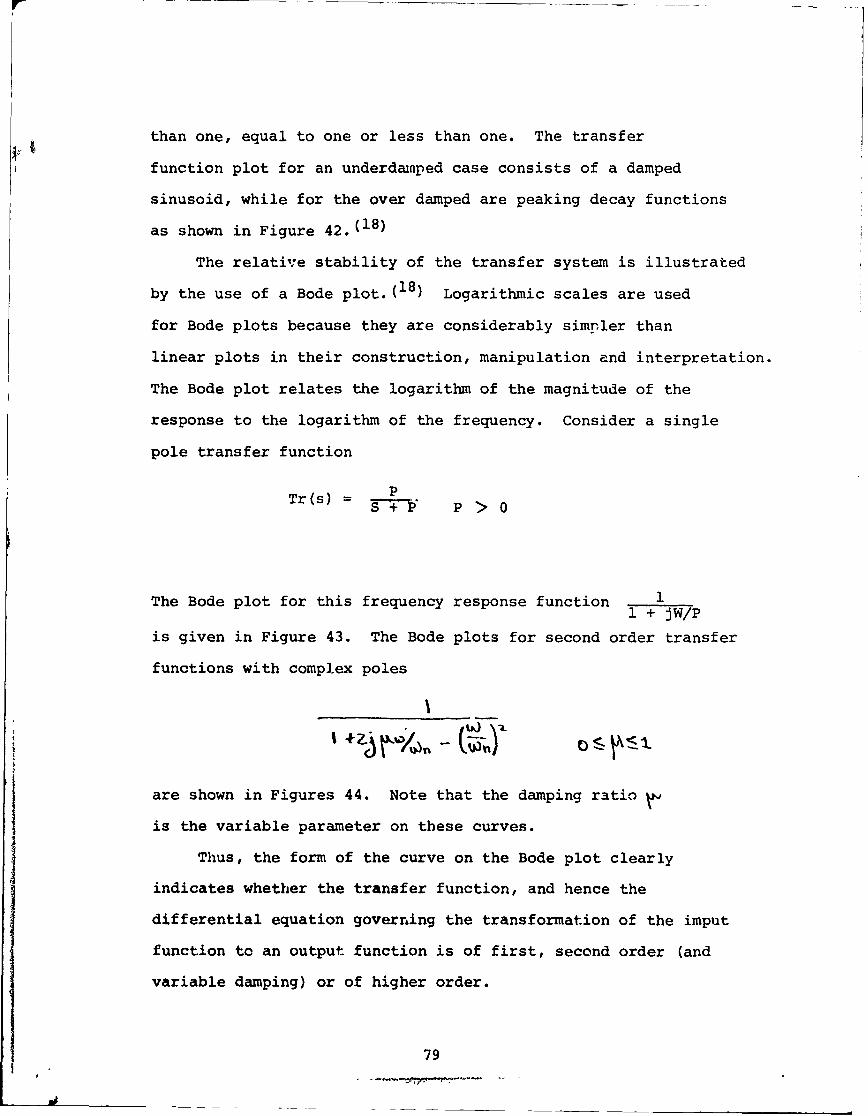
than one, equal to one or less than one. The transfer
function plot for an underdainped case consists of a damped
sinusoid, while for the over damped are peaking decay functions
as shown in Figure 42.(18)
The relative stability of the transfer system is illustrated
by the use of a Bode plot. (18) Logarithmic scales are used
for Bode plots because they are considerably simpler than
linear plots in their construction, manipulation and interpretation.
The Bode plot relates the logarithm of the magnitude of the
response to the logarithm of the frequency. Consider a single
pole transfer function
p
Tr(s) = S P > 0
The Bode plot for this frequency response function 11 + JW/P
is given in Figure 43. The Bode plots for second order transfer
functions with complex poles
are shown in Figures 44. Note that the damping ratio
is the variable parameter on these curves.
Thus, the form of the curve on the Bode plot clearly
indicates whether the transfer function, and hence the
differential equation governing the transformation of the imput
function to an output function is of first, second order (and
variable damping) or of higher order.
79
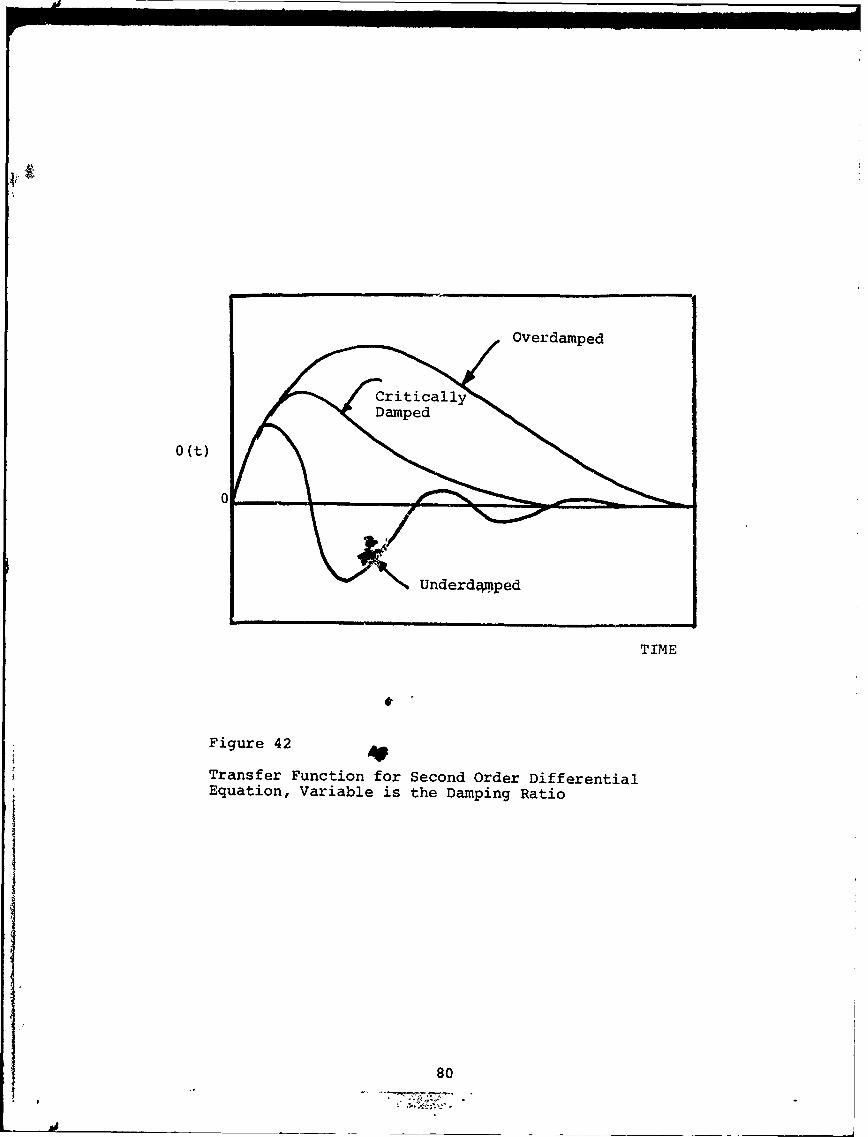
Overdamped
0(t)
SUnderd•.ped
TIME
Figure 42
Transfer Function for Second Order DifferentialEquation, Variable is the Damping Ratio
80
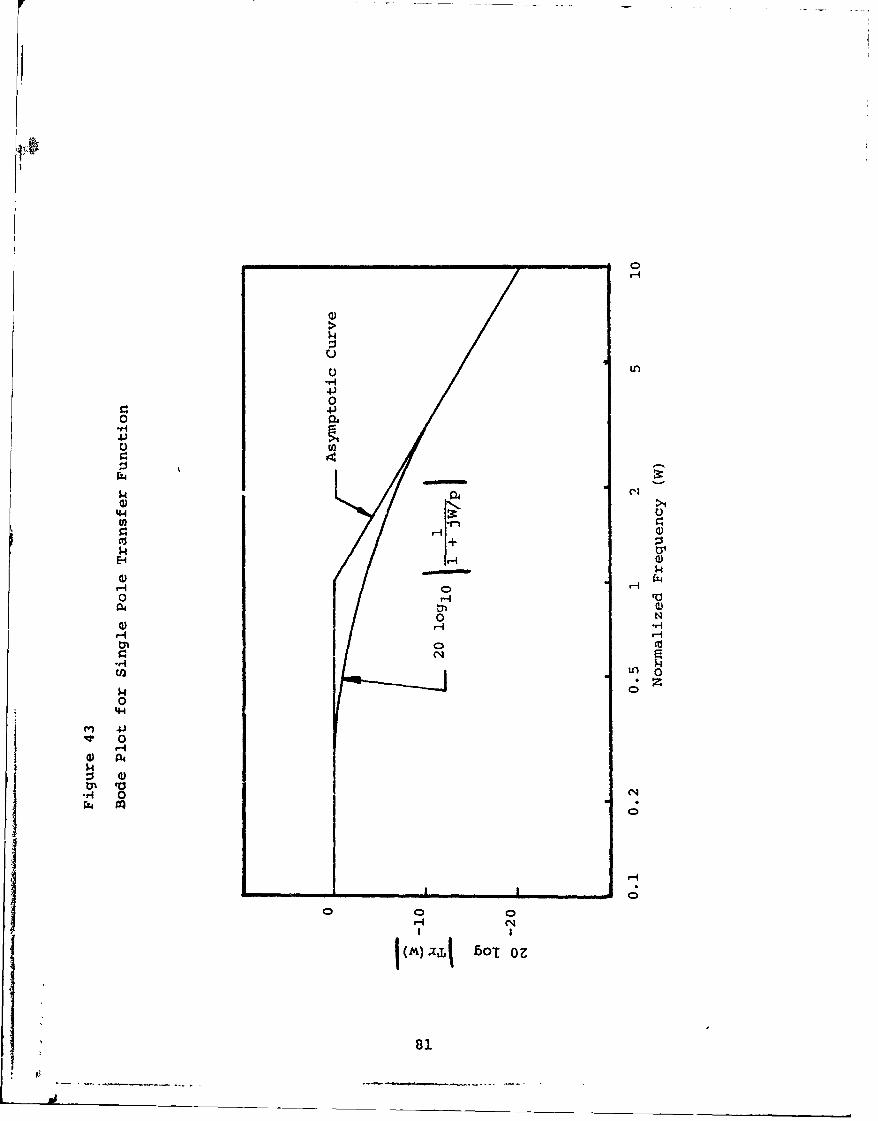
0u
4.)0
0 0
54)
O ('2 >1
tI~ 1+E-1
0 HaoILH00
0) HH H
0044'
0
$4-
0))
No o
08
Li('
10.
LO
0
0) C14 :344I
CO
0)
0) 0
'0 ri
U) HQ) m IClD LA Ei
o4-4
0
*ri 0 C%4
(N H H 4
I(M).tad Bo'ioz
82

In most analysis techniques using this type of transfer
function approach, the form of the forcing function is known,
and the problem is to determine the form of the response. In
this manner the Bode plot finds many uses primarily in feedback
and control system analysis.(19) However, for our purposes we
will use this analysis as a method of characterizing the ultrasonic
response indicium for the identification of the presence
of a defect.
Impulse Analysis of the Indicium
In the previous section, the impulse functions were all
time like, one must then reevaluate the indicium to be a
"pseudo" timelike impulse. To do this one simply transforms the
space like pulse of ultrasonic gated amplitude vs position of
the transducer into a curve of gated amplitude vs time. This is
not totally unreasonable since one could consider the linear
velocity of a transducer and plot the amplitude of the
reflection as a function of time for a slowly moving constant
speed transducer scan.
The impulse indicia is now considered to the the OUTPUT
function. For simplification the INPUT function is considered to
be the Unit impulse.
Consider the scan indicium output of the x-y recorder system
to be a pulse in time rather than a pulse in space. This is
accomplished by a simple exchange of x coordinate to time
coordinate. The space pulse can now be transformed to a Laplace
time like pulse. The transfer function for the Laplace
transform is given by:
I
'I83
The magnitudes of A.B.C.D. are given by:
T ta
0
0
Where I(t) is the input pulse and 0(t) the output pulse of the
x-y recorder.
Typical Bode plots of the transfer function for the clean
hole output with Dirac inputs are given in Figure 45. The
figure shows the Bode plot for a clean hole. One can see that
there is a first order iifferential equation that governs
the transform of the Dirac pulse into the symmetrical outputI function. The Bode plot shows a horizontal lina which then
slopen negatively toward the x axis. This is typical of a plot
for a first order differential equation governing the transfer
process. The point for the change in slope is related to
84
J_ _ _ _ _ _ _ _
#44
0
.e4
144
.1-Ij04
02r'aT
4.4
0x
100
$40
000T

the characteristic or natural frequency of the transfer system.
In contrast Figure 46ashows the Bode plot for a transfer
function that was obtained from a hole containing a crack.
The Bode plot for a bolt hole containing a defect shows a
pertubation at the higher frequencies that indicates
higher order transfer processes are occurring. This means that
the simple first order imput-response function that converts
the unit impulse Dirac function into the indicium for the
clean hole is pertubated. The pertubation in this case indicates
that there is a defect present. The logical assumption would be
that the size of the indicia pertubation, i.e. the size of the
defect, would influence the form of the Bode plot in a
simple manner. This is not the case as is seen in Figure 46b.
Here a series of indicia typical of that shown in Figure 35,
with different positions of the transducer scan are plotted.
It can be seen that all of the indicia transform into a Bode
plot and indicate that there is a defect present. However,
there is no consistant shift in the shape of the Bode plot.
The transfer function concept, and the Bode representatio:.
is a form of autocorrelation, -i that the difference between the
theoretical input function and the experimental output function
is examined over the total time span for the impulse. A
single small pertubation on the output function will cause a
shift in the form of the Bode plot, indicating that the input
and output functions are not identical. This would be extremely
useful if the input function were nnt a theoretically derived
Dirac unit impulse, but consisted of an indicia of a good
bolt hole without the presence of the defect. In this latter
86
p~MWI -- .-U.
case, the Bode plot would indicate that there was a difference
between the overall indicia for a good hole and that of a
hole containing a defect.
This is particularly useful in scans of bolt hole with
defects with the fastener still in place. In this case the
input function is the left hand side of the bolt hole (presumably
without a defect) and the output function is the right hand
side of the bolt hole (presumable ccntaining a defect). The
side for which the defect is present is immaterial, since the
transfer function divided the indicia of one side of the scan by
the transfer function of the indicia of the other side.
If there was a difference, the Bode plot would deviate from
unity. This is illustrated in Figure 46c, where an interference
fastener containing a 0.035 inch defect has been scanned,
and the Bode plot made of the transform of the :eft side
divided by the right side. The presence of the defect is
seen in this case by the shape of the Bode plot in a manner
similar to Figure 46a, and b but not as pronounced.
The major advantage of the transfer function analysis is
that minor pertubations w:.thin the indicia are smoothed out,
i.e. high frequency noise that is random in nature due to random
reflections within the interference fit of the bolt hole and
surrounding material are "averaged" by the Laplace intergal transform.
Only the pertubation that is not random in nature, i.e. the
defectis identified. If the "typical" clean interference
fastener is used, the system is essentially self standardizing,
since it uses each particular bolt hole as its own standard
rather than relying on an external calibration as would be with
87
-4
other simple amplitude methods.
It,therefore, appears that the indicia, when combined with
the transfer function impulse technique, :)rovides a rapid-self
standardizing technique for identification of defects within
the area of the bolt hole.
r8
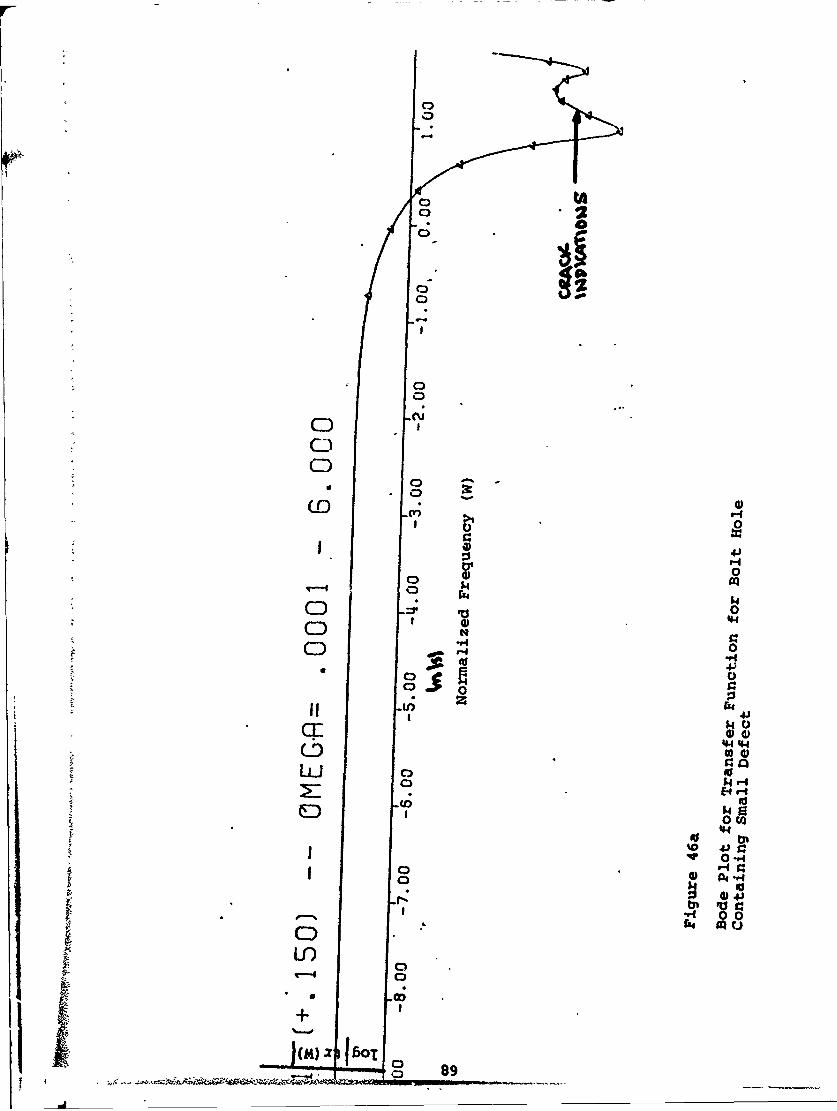
1,4
* 0
i ""
0
"r84
CD 0
CD 4
C-))
CD 0
0,
"I 0 0
E, 4,.-
CD .o
ED%D 41
S0
C) 4 )
+:II U)
"4 0
Lr)
(M ) l -T T D-"89
J, I
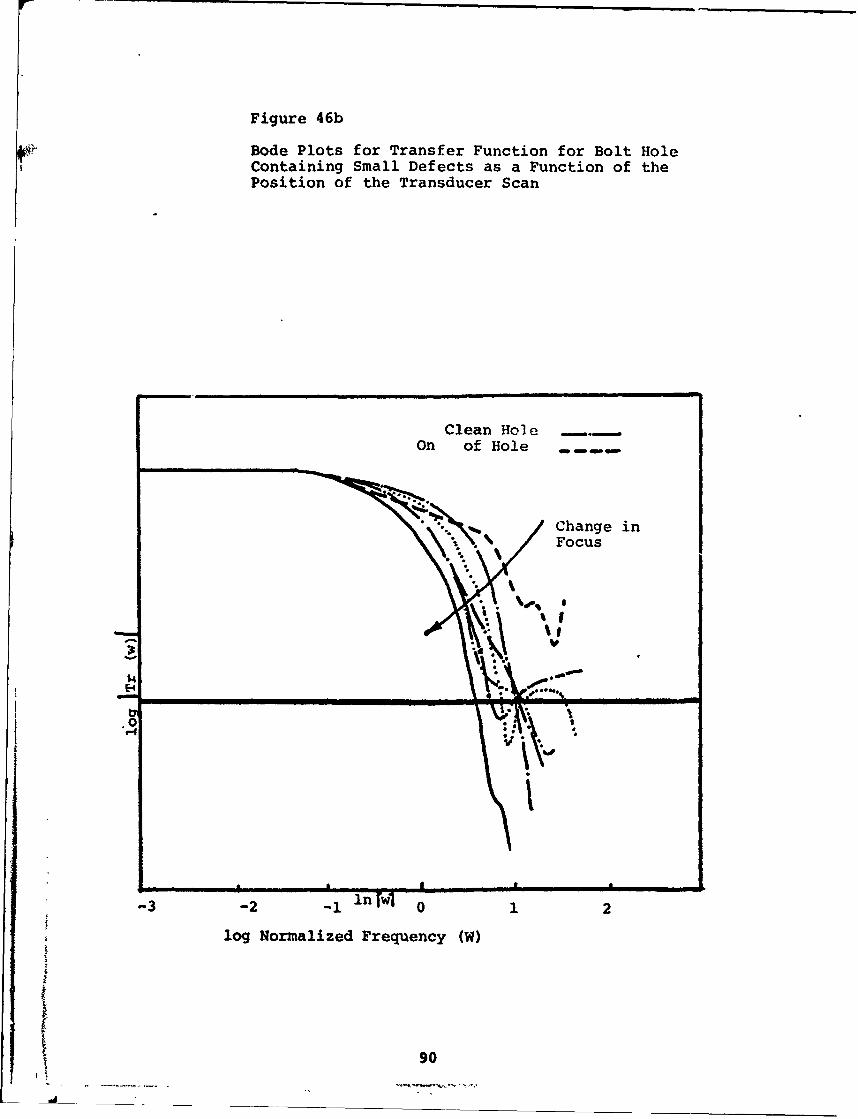
Figure 46b
Bode Plots for Transfer Function for Bolt HoleContaining Small Defects as a Function of thePosition of the Transducer Scan
Clean HoleOn of Hole
%• Change in
Focus
v
EI.0 %
a I
-3 -2 -1 lnrwl 0 1 2
log Normalized Frequency (W)
90

log (+ 6) W
"-9l -J.
0
:1
r1(DrrCDV C D
.,,,.. 0
rn1
1'•
-M -- A
/ OH
N m"
mm
911
C..
C+ r
~AJ -~ -d
03
VI'
4Lr
o 91
THIS PAGE INTENTIONALLY LEFT BLANK.
SECTION VII
EDDY CURRENT BOLT HOLE PROBE
Fundamental Eddy Current Concepts
Faraday's Law of Induction states that the electromotive
force induced in a circuit is equal to the negative time rate
of change of the magnetic flux through it. When applied to
eddy current testing, the application of a changing magnetic field
on aA electrically conducting material result in a pulsating,
circular cur-ent flow in the conductor; hence the name eddy current. (20)
Lr ts tise resistance to the production of eddy currents in a
'zest material which gives rise to the value of this technique
for use in nondestructive testing. Using the proper analysis
technique , this inspection method can yield information about
flaws, dimensions, hardness, alloy composition, strength,
crystal orientation, foil or wall thickness, plating thickness,
porosity, grain size, hear treatment, and any other property
which is related to magnetic permeability and electrical
conductivity. (21)
The basic equipment needed in order to generate eddy currents
in a specimen is shown in Figure 47. The components are (1)
a source of alternating current, (2) a primary coil which
generates the magnetic field, (3) a secondary coil which continuously
monitors the magnetic field strength, and (4) an instrument
to analyze the signal from the secondary coil.
The source may produce a frequency of electrical pulses,
but more comnonly an alternating current is used. The frequency
should be variable since the depth of penetration, sensitivity,
and resolution are all frequency dependent. The source
92
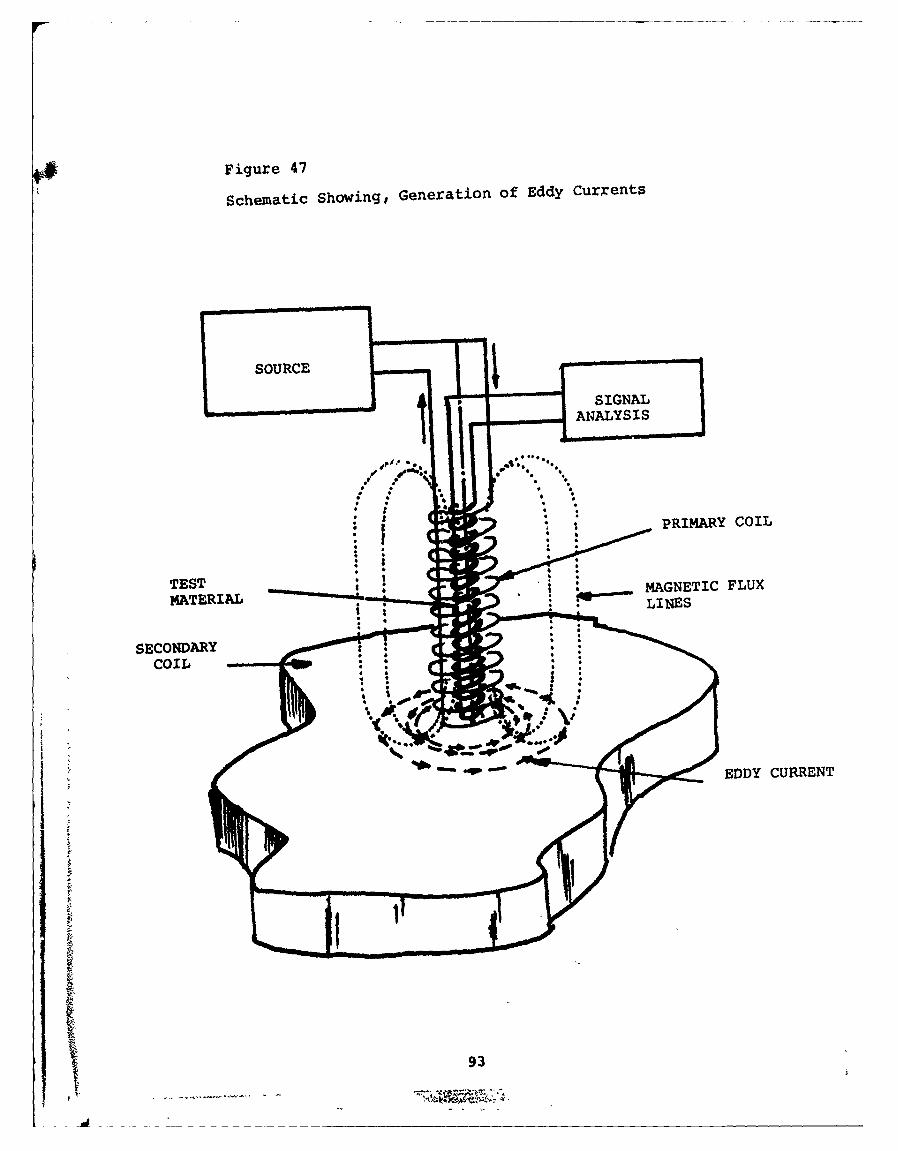
* Figure 47
Schematic Showing, Generation of Eddy Currents
* PRIMARY COIL
TEST LMAGNETIC FLUX
SECON~DARYCOIL
EDDY CURRRENT
93
ioit" i
induces an alternating current in the secondary coil, producing
a magnetic field shown by the flux lines in the diagram. The
secondary coil is generally composed of enameled copper wire
wound on a ferrite core. As shown in the drawing, the changing
magnetic field sulrrounding the primary coil extends into the
surface of the test specimen. The action of this field is to
produce eddy currents which move circularly in the material
immediately beneath the inspection, probe in a direction opposite
to that of the current in the coil. The effect of these currents
is to produce a magnetic field in the test specimen which opposes
the existing field of the primary coil. As a result, the total
field strength of the primary coil is reduced. Thus, any
materi&l property or configuration which tends to change the
density of eddy currents produced also changes the magnetic flux
density, and this change May be monitored to produce an output
voltage representative of the variations encountered in the test
specimen.
Monitoring of the flux density is handled by the
secondary coil. TUis is commonly wound within the primary coil,
and the changing flux of the primary coil produces a current flow
in this monitoring coil. This output current is fed into a unit
for either impedance analysis or impedance plane analysis.
In impedance analysis only the magnitude of the impedance Z = 2
where R is the resistive component and XL is the inductive. The
resistive component evolves as a result of heat lost due to
eddy currents in the test specimen and thus is related to the
material electrical conductivity (22). The inductive reactance
results from the inductance of the coil which is affected by the
94
-.4"
permeability (23 ) of the material. Thus, all material properties
that can be related to changes in these two variables can be
detected with the use of eddy current inspection.
In cases where the number of the various discontinuities
and/or compositional changes exist simultaneously, it may be
necessary to use a more complex signal processing method
of impednace plane analysis - also known as phase analysis.
Here the phase angle of the impedance is also measured and
one may calculate the individual components of impedance.
Usually, however, it is more convenient to graph the data on an
impedance plane. Examples of such curves are shown in Figures
In order to generalize such curves for various coils, they have
been normalized. The normalized inductive reactance is plotted
as the ordinant (wL/wLo = inductive component in the presence
of test specimen/self - inductive reactance), and the normalized
resistance (R/wLo = resistance/self inductive reactance) is
plotted as the abscissa.
Figure 48a is a plot of impedance values as a function of
f/fg where f = frequency of the current in the primary coil
and fg is a frequency which is characteristic of the material
and the configuration of the inspection coil. Most of the
theoretical work done in the field of eddy current testing
has been applied to the feed-through coil. This i3 a coil
used for inspecting rods and tubes, and is designed such that
its inside diameter provided minimum clearance for the
outside die.eter of the cylinder being tested.
There are two general classes of coils,feed through coil
and a probe coil. The feed through coil is generally circumferential
95
-J~~~~~~ .... __ __ ___-___ __ __--._ __ __
in nature and has an open center through which the material
to be inspected passes. This is most commonly used for inspection
of tubes, barstock, or rods. The yrobe coil is a small coil
that is placed on the surface of the part to be tested so that
its axis is perpendicular to the surface. Theoretical
treatment of the field strength has been developed for the feed
through coils, but is not available for the general case of the
probe coil, and must be developed empirically.
The differential encircling coil (for the tube inspection)
should be thought of as part of the instrument. Each inspection
coil is balanced and matched to a specific flaw detector, and
coils are not interchangeable with other flaw detectors
even though they are believed to be of identical design.
For this case, fg = 5060/"rr where d is the diameter of the rod.
Figure 48b shows the variance in impedance as a function
of permeability and conductivity. Impedance changes due to
these two variables will generally be shown to move in directions
oriented perpendicularly to each other on the impedance plane.
The varicus structural conditions capable of being detected
by the eddy current method give rise to still more characteristic
cur es for the composite changes in permeability and conductivity
which identify the flaw type or property. Figure 48c is an
example of the impedance plane curves for various cracks as a
function of f/fg. Thus, tho impedance plane approach to signal
analysis can be used to detect and differentiate among several
defect conditions.
In actual practice it is often necessary to make calibration
blocks from the material to be tested, containing the flaw
96

L/w L0
Figure 48a2.25 Impedance as a Function of f/fg
.8
.6 .25
.4rV 1f/f g
0w 1.0;
Figure 48b
Impedance as a Function .4of Permeability andConductivity n L/{ L
02 .4
1..oo1-
.6Figure 48cImpedance as a Function .4of Crack ilengty .4 L
.2
0.2 0.4
97

types expected to be found in the inspected parts. The
01 practice of eddy current testing is advanced such that theory
can assurately predict behavior only in the most rudimentary
cases.
One of the major shortcomings of the eddy current inspection
is its inability to penetrate significantly within the test
material. Figure 49 shows current density (Jx) as a function of
where x = actual depth and S = depth of penetration which is
defined as the depth at which the current density is reduced
to i/e or 36.8 percent of the surface value.(21) The parameter
varies inversely as a function of the frequency of the primary
coil.
The sensitivity also varies as a function of frequency.
For a nonmagnetic material sensitivity is greatest when the
resistive component of impedance is a max mum. This occurs
when at the knee of the curve pictured in Figure and thus
defines a characteristic value of f/fg for a particular material
and eddy current probe.(23) However, sensitivity may not
dictate the optimum frequency. In many cases it may be possible
to attain a better signal to noise ratio at a less than maxim:a
sensitivity because this signal can easily be amplified to
the desired strength. Therefvre, the selection of a working
frequency for an inspection test should be determined by a trade
off between depth of penetration needed and signal to noise ratio.
Eddy Current Sensitivity
A standard eddy current coil tube inspection procedure
requires detection of flaws whose size is greater than 10% of
wall thickness.(24) By virtue of the inherent design characteristics
of a differential coil, flaws of considerable depth can pass
98
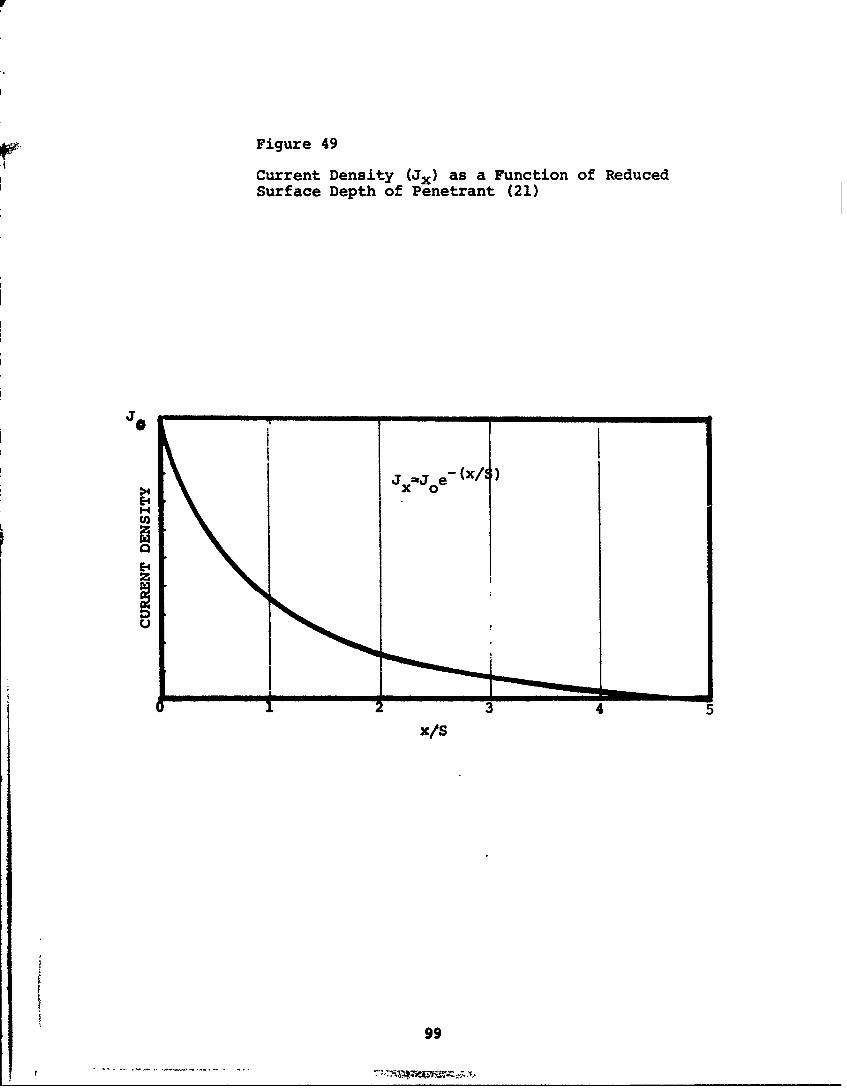
Figure 49
Current Density (Jx) as a Function of ReducedSurface Depth of Penetrant (21)
Jo
j x=Joe(x/
0
U:
x/S
99
through the coil and not be detected. For example, in a tube
Srwhich produces a low noise background, a void 26% of the wall
thickness, the deflection for this defect was only equal to
the average peak-to-peak signal. If the background noise
had been higher the signal would be missed.
The most prevalent problem associated with increasing the
sensitivity of the eddy current system is that the lineat
amplification of signals results in a great number of rejections
that have little bearing on the actual flaws present. For
example, Lloyd( 2 5 ) has determined the ratio of rejections found
by eddy current signals divided bx the number of defects
found by visual/tactile methods as a function of the signal
level as shown in Table IX.
Thus, while the inspection procedure is effective in
finding most of the flaws at the larger size levels, it finds
11 times more "benign" flaws when the signal level is much lower.
Therefore, in establishing the rejection level for defects, it
becomes necessary to set a definite inspection level. This
level is set so that the eddy current technique is at least
as effective as the current level it is planned to replace,
preferably somewhat better. Lloyd concludes that the eddy
current coil inspection of copper tubing does not reject at
reasonable inspection levels local surface flaws, but is more
effective in detecting surface porosity and is not entirely
equiv lent to visual inspection.
Flaws can be defined as any discontinuity that produces
a signal above the noise. The theoretical number of maximum
probability for passing flaws of a certain size is the ratio of
100
the number of signals passed to the length of tube passed.
A plot of the probability of accepting flaws as a function
of the discrimination level shows that the confidence in the
inspection falls off rapidly as the discriminator level is raised
above the noise level. Tube noise is largely responsible for
the ultimate confidence level that might be achieved. Tube
noise is the result of many factors, including a combination
of minute nicks, scratches, dents, and other surface irregularities.
Singularly these might be of little or no consequence, but
when occurring in clusters may often be detected as single
large flaws.
There were many factors to consider in the design of a
unit for fastener hole inspection. The factor of greatest
consideration was the type of information which was sought
concerning the cracks which might emanate from these holes.
Since it was important to precisely describe the crack location
and geometry, it was necessary to use a probe which would
inspect only a small area of the hole bore at any one time.
This was most easily done using a small surface probe which
would rotate against the hole surface, scanning its entire
area. Such devices are commercially available, described
simply as a bolt hole probe. However, a device which would
rotate the probe in the proper manner with an allowable noise
level was not available on the commercial market and it was
necessary to design and fabricate the scanner.
Helical Scan Bolt Hole Probe Design
A helical scan eddy current unit was constructed in the
initial portion of this program. This is shown in Figure 50.
It consists of a constant speed motor driving a slender tube
101
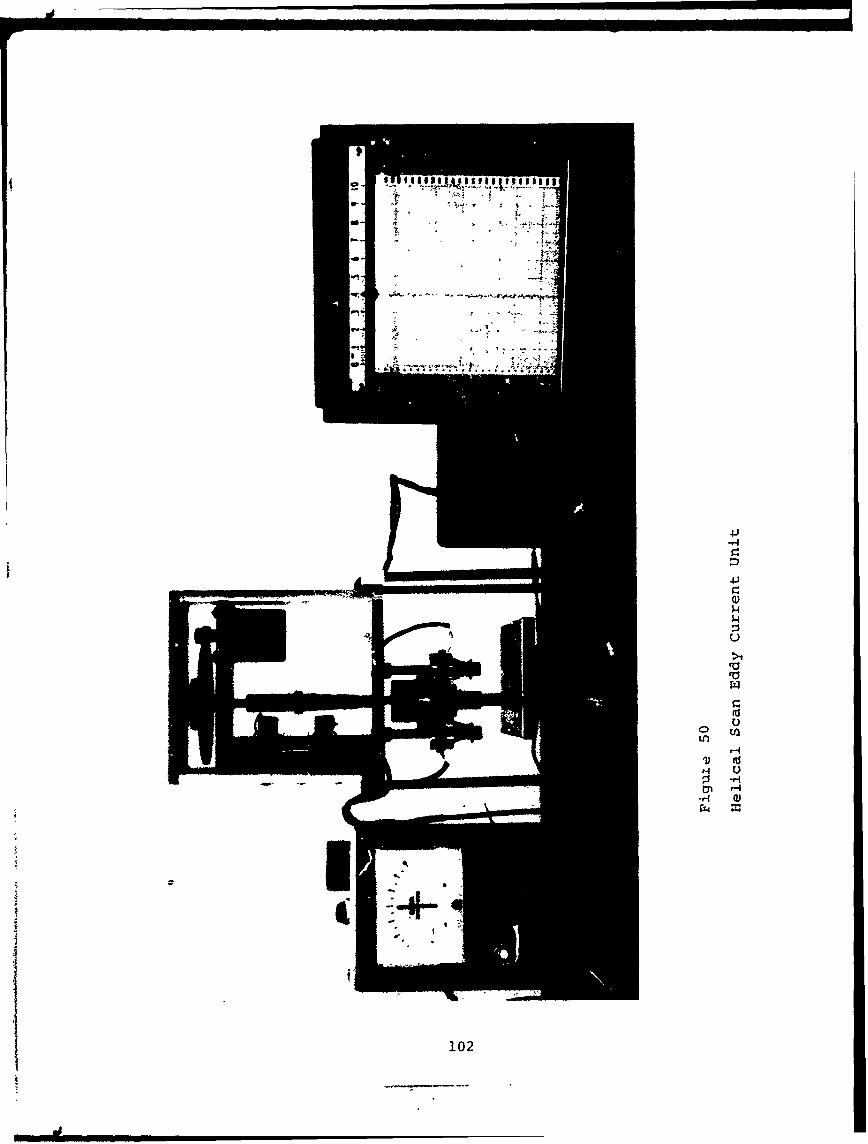
nL
*4
tp -4
1021
mechanism connected to a micrometer. Attached to the anvil of
the micrometer is the eddy current probe assembly. The motor
system drives the eddy current probe at about 10 rpm and advances
0.025 inches per revolution. Thus, the probe scans a helical
path within the bolt hole as it enters and leaves the bolt hole.
Limit switches are used to reverse the scanning direction; these
are adjustable to allow different plate thicknesses to be
scanned.
A close up of the eddy current probe is shown in Figure
51. This consists of the probe coil mounted in a bakelite
split tube and signal pickup coils. The pickup coils and
feeds are mounted on external spring mounts so that positive
signals can be obtained for all positions of the eddy current
probe. The coil is an absolute coil with a ferrite core and
two layers of windings. The total diameter is approximately
0.040 to 0.050 inches. The inductance of the circuit is 4
milihenrys and has a variable capacitor that is used to tune the
the resonance frequency to about 4Mhz.
Typical operation of the unit entails simply setting up
over a selected bolt hole and allowing the unit to scan in both
the inward and outward rotational modes. Proper selection of
coil, external balancing, and damping are essential to obtaining
significant information.
The probe selection was made between two basic types -
an absolute probe and a differential probe. An absolute
probe measures a gross impedance value and changes from the
norm of this value. The differential arrangement requires two
secondary coils, wired in series, but wound in opposite
103

Figure 51
Ciose up of Eddy Current ProbeEntering Bolt Hole
104
directions such that they oppose each other and the voltage output
is zero when the same flux density is monitored in each coil.
The effect is to test one part of a test specimen against
another part under the assumption that any discontinuities
or structural changes are local and thus will be detected by
only one coil at a time resulting in a relative voltage drop
across the two terminals. If a long flaw shoulý. exist in such
a manner that it is scanned simultaneously by the two secondary
coils, the field effects will be equal and a flaw signal will
be output only at each end of the flaw. Due to difficulties
encountered with a differential coil arrangement for a bolt
hole probe, the most common type commercially available was of
the absolute variety. This was quite satisfactory for the
specialized inspection for fatigue cracks emanating from
fastener holes in aircraft structural members.
Since the expected flaws were very precisely defined as
fatigue cracks, it was found desireable to combine the data
availalle from the components of impedance into the single
variable of impedance magnitude. By thus doing, much unnecessary
labor involved in impedance plane analysis was avoided,
with very little apparent loss in detectibility of the flaw.
The specific unit used was the Defectometer Type 2.154
manufactured in Germany by the institute of Dr. Forster and
distributed in the United States by Automation Industries, Inc.,
Danbury, Connecticut. It was designed to operate at the constant
frequency of 4 Mhz. This frequency was satisfactory since it
provided good resolution and sufficient penetration for use
in surface crack inspection. It came equiped with a number of
105
ferrous bolt hole probes, but it was necessary to have some
non ferrous probes built. This was done by the Ideal Specialty
Company of Tulsa, Oklahoma.
As a means of permanently recording the signal output from the
Defectometer a Hewlett Packard 7004B x-y strip chart recorder
was obtained. This unit was capable of following the output
signal with only slight variations due to the rapid nature of
the voltage changes.
Specimen Configuration
Three defect bolt hole configurations were produced.
These are shown schematically in Figure 52 and Tables X, XI,
and XII. They are (1) a constant depth slot, (2) a part through
varying depth slot, and (3) internal varying depth slot.
Table X is specimens with essentially constant depth and widths
varying from 0.007 to 0.015 inches in width. All depths and
widths were measured using a Zeiss metallograph at 100x, and
were checked using the vernier microscope of a Tucon microhardness
tester. Table XI contains some of the part through varying
depth cracks. This series was intended to confine the crack
to the near surface. Table XII is a mixture of varying depth,
through and internal slots.
A detail of a typical test block is shown in Figure 52.
It should be noted that in some holes the condition of the
interior is typical of what would be expected for a hole with
the bolt removed, and contains both horizontal and veritcal cuts
aand scratches in addition to the elox slots. Additional
specimens have been produced using pre-cracked fatigue test
specimens. These are made from 0.5 inch thick aluminum
and steel blocks fatigued in a three point bending unit on
106
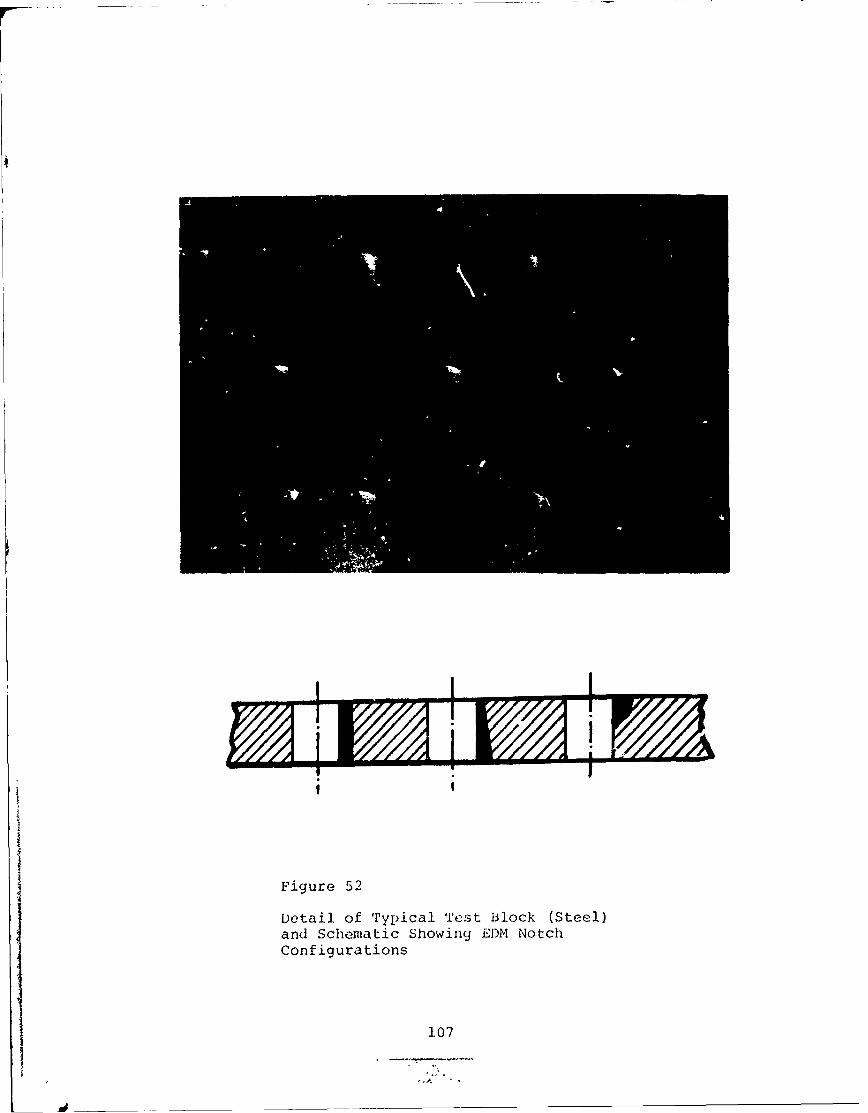
t
Figure 52
Detail of Typical Test Block (Steel)and Schematic Showing EDM NotchConfigurations
107
I
either the MTS or Tinius Olsen. The fatigue cracks are initiated
and grown in tension-tencion fatigue and have an aspect ratio of
approximately a = c. When the fatigue crack is grown to a pre-
determined size, a hole is drilled adjacent to the fatigue crack,
r-sulting in typical crack specimens. Attempts have been made
to fatigue cracks initially placed in drilled holes to produce
cempletely internal cracks, but to date have been singularly
unsuccessful. The major probelm is that the high stress
intensity factors associated with the immediate vicinity of
the hole produce a long shallow crack totally along the depth
of the hole.
A series of scans was produced using the elox specimens
as well as fatigue cracks and scratches within the holes. Each
of these were examined for significant signatures as described in
the next section. In addition, a limited series of specimens
containing crack like defects in interfaces was examined. Here
the crack was produced in one plate surface near the edge and
the defective hole mounted within a"stack" . The eddy current
scan thus had to differentiate between the defect and the interface
as well as a benign defect.
Eddy Current Results
In Figures 53 to 59, recordings for six typical slots
and three typical fatigue cracks are presented. Each of these
show distinct flaw indications .n holes with smooth as well as
rough interior surfaces. The signal was more difficult to
detect with the presence of high noise due to poor machining of
* the hole, but the flaw.indications are easily discernible from
108
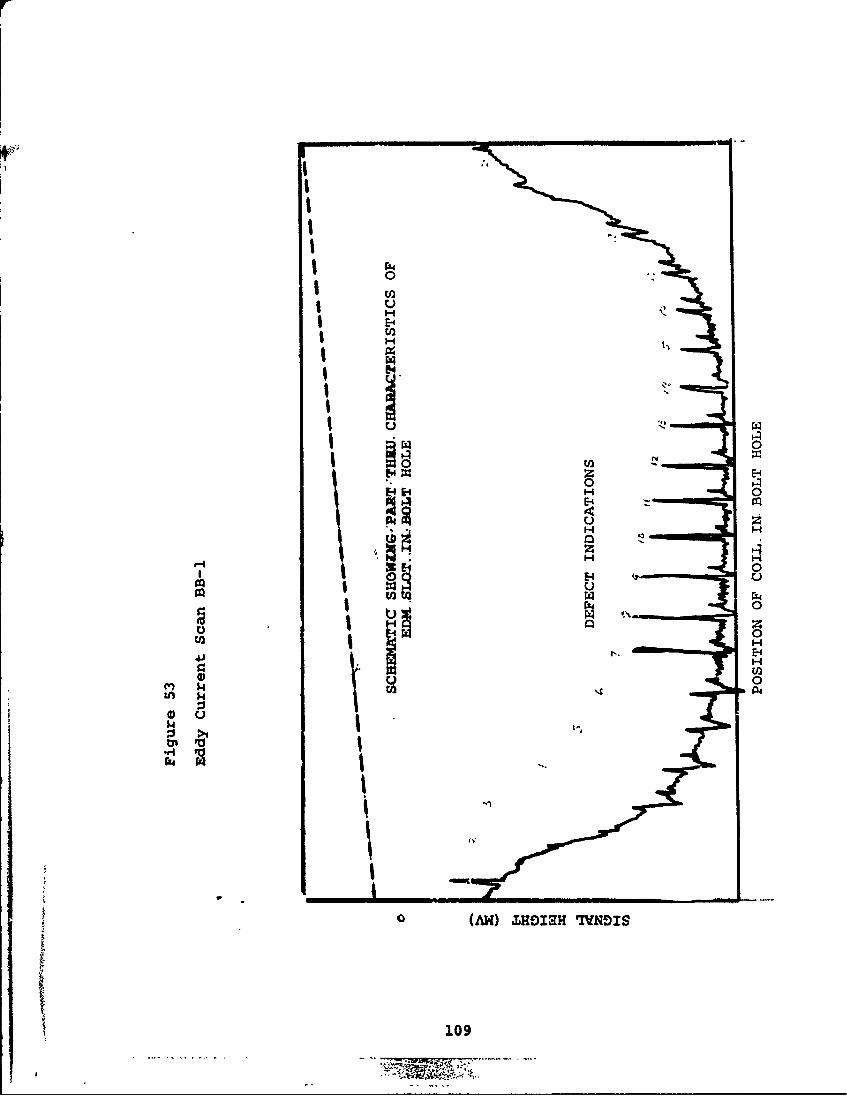
00
E-4
! U)
UU
I 0
SI H
Iz
0
U))S'q H
00
H H
A4 H
1000
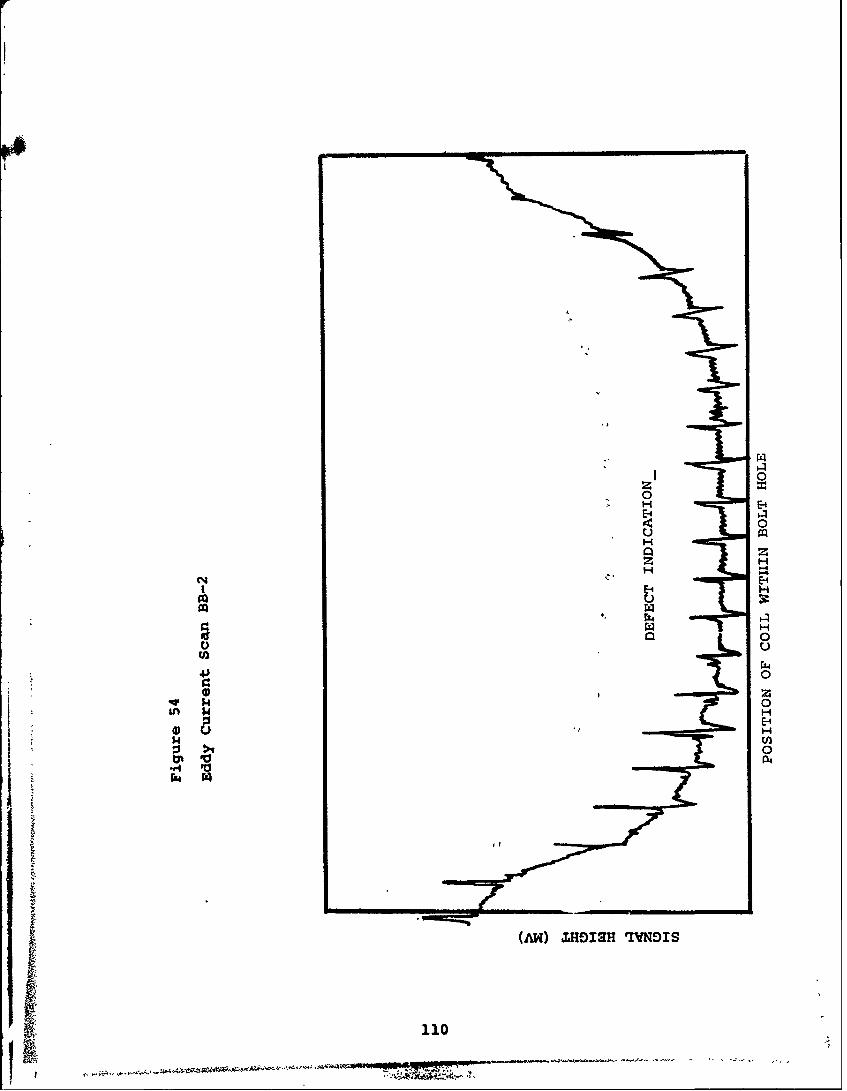
-E-
0
N0
U4
H
0z
0
L H:3 0
040
011I O
( ,• ... •,S- ,' , ...- •' -• '' '''' ,,'• •..,,•••
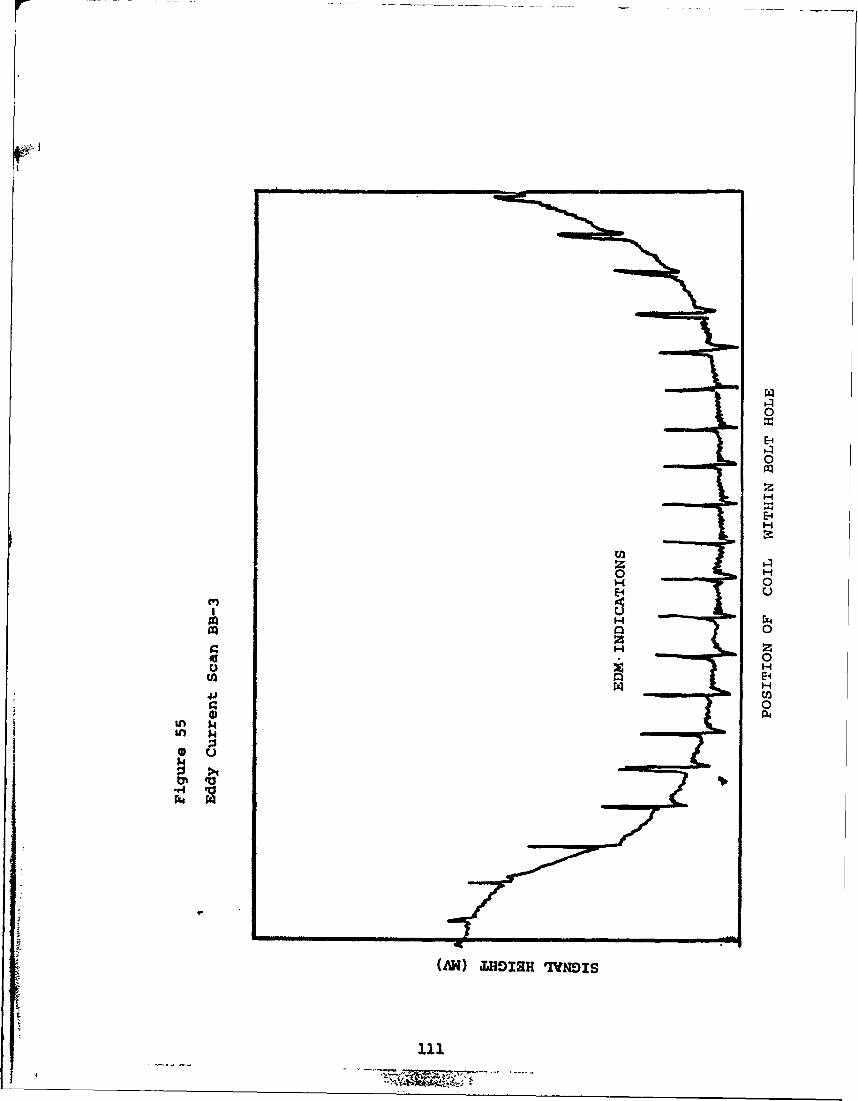
0
H
H
0 HH 0
H
0
H ZYz0
1h4
bN
-A) JIr 1vx
IHIH NL
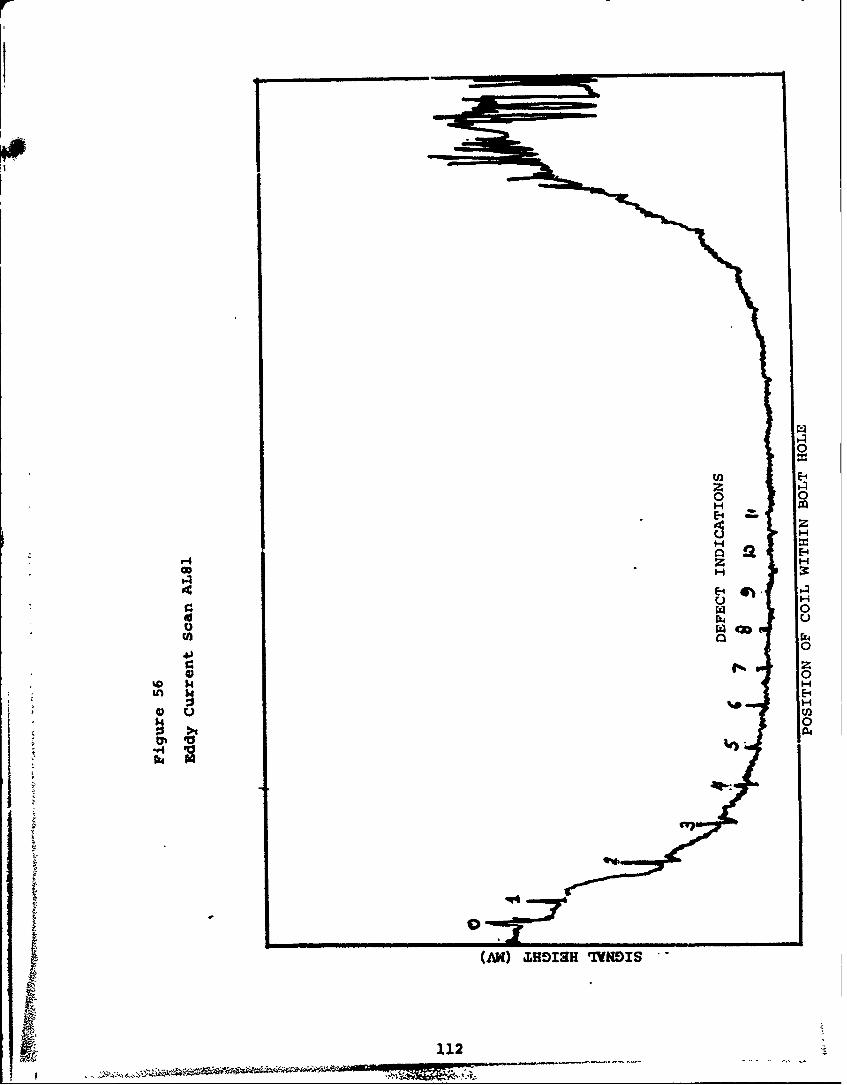
r4 z
'E-4
4) u
0
00
(MK) JIHDIRH W1V*IS -
1.12
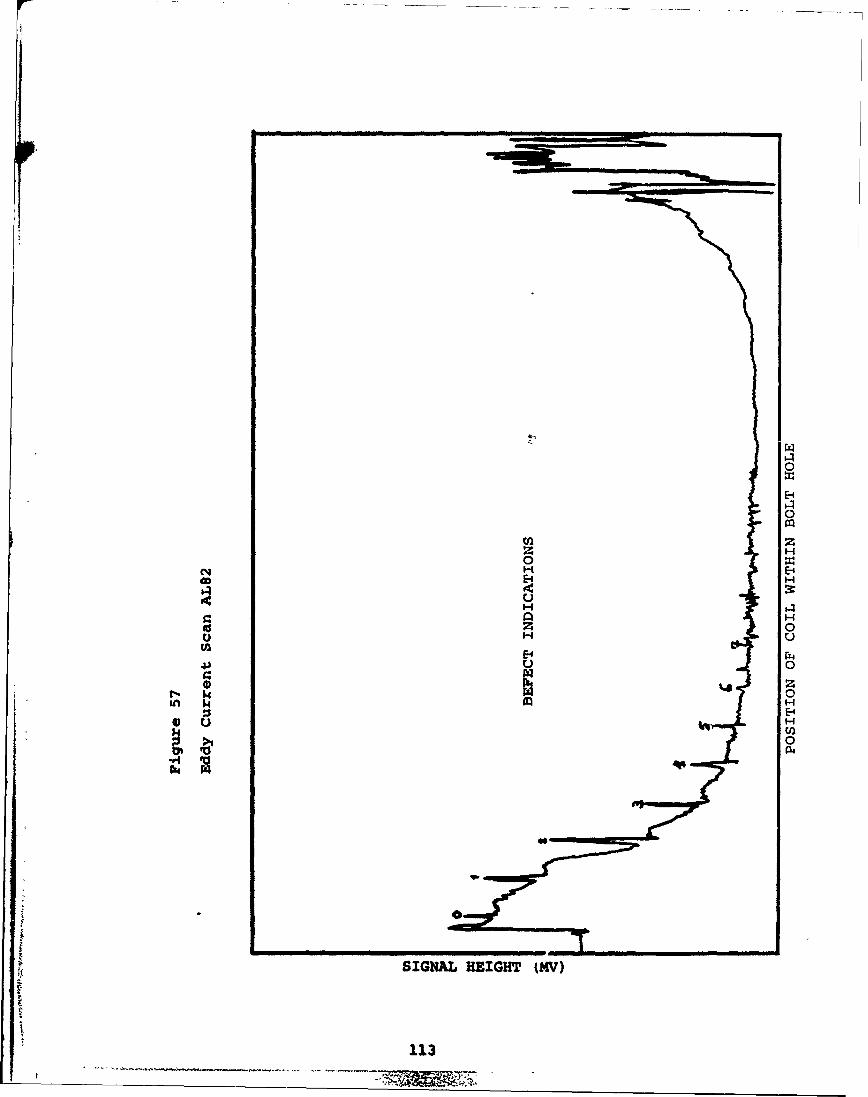
CzQ
z
aa4) z14 H
c%4 E-4
0 H
H
0
Caa
m N n In i I I
0Ul040
SIGNAL HEIGHT (MV)
113
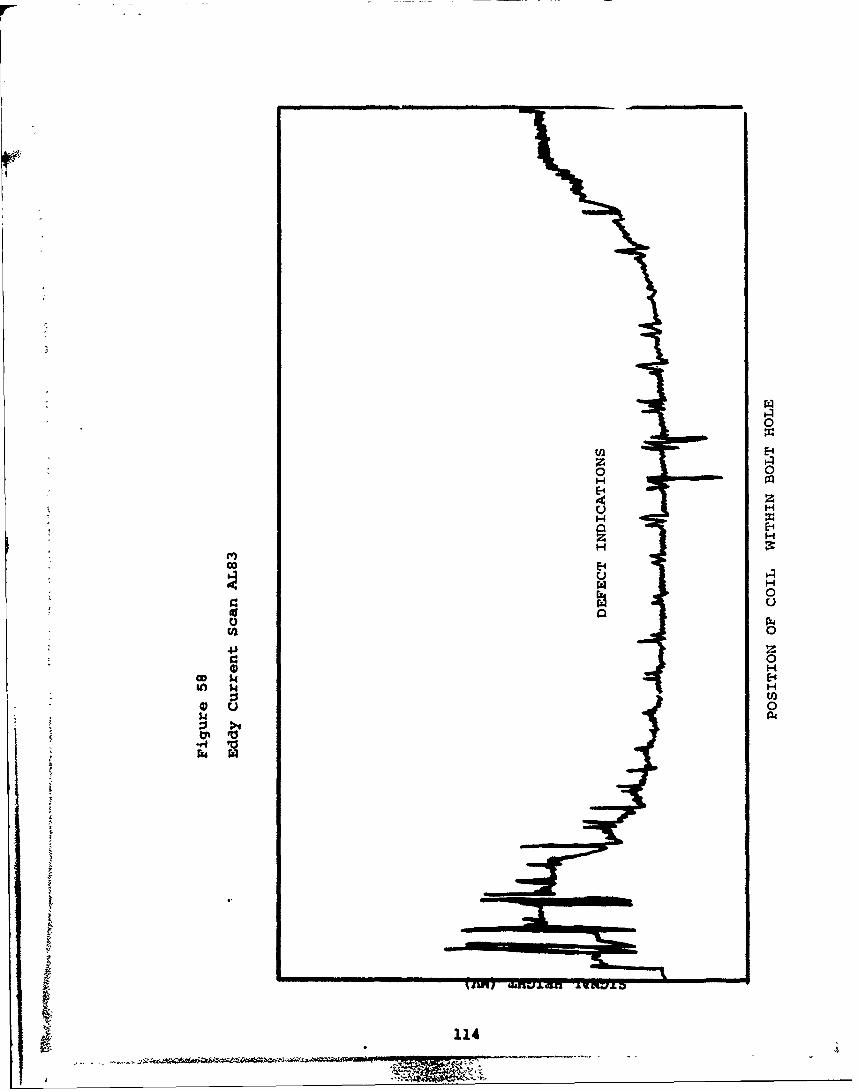
0
E-4o •0H0
41~
0U)VH
• H
SU) 0ý 54
S1114
..
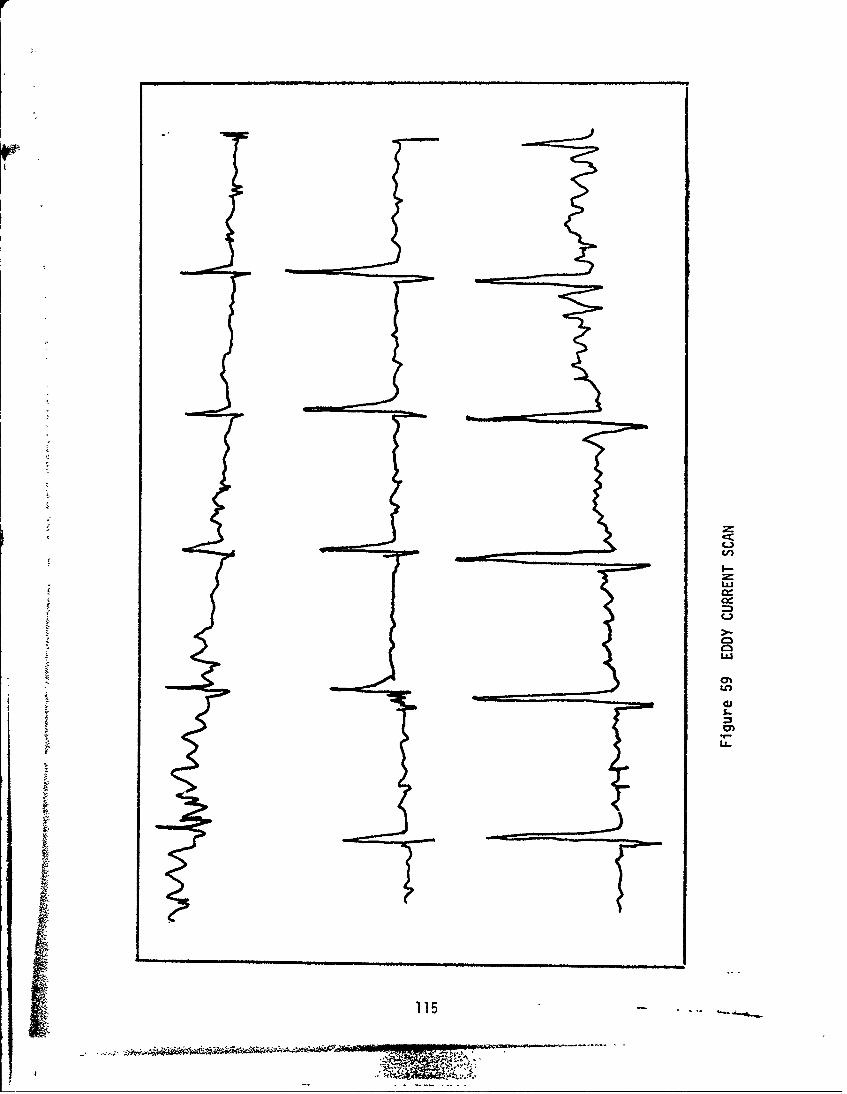
CC,
(ii
IJJ
t 115
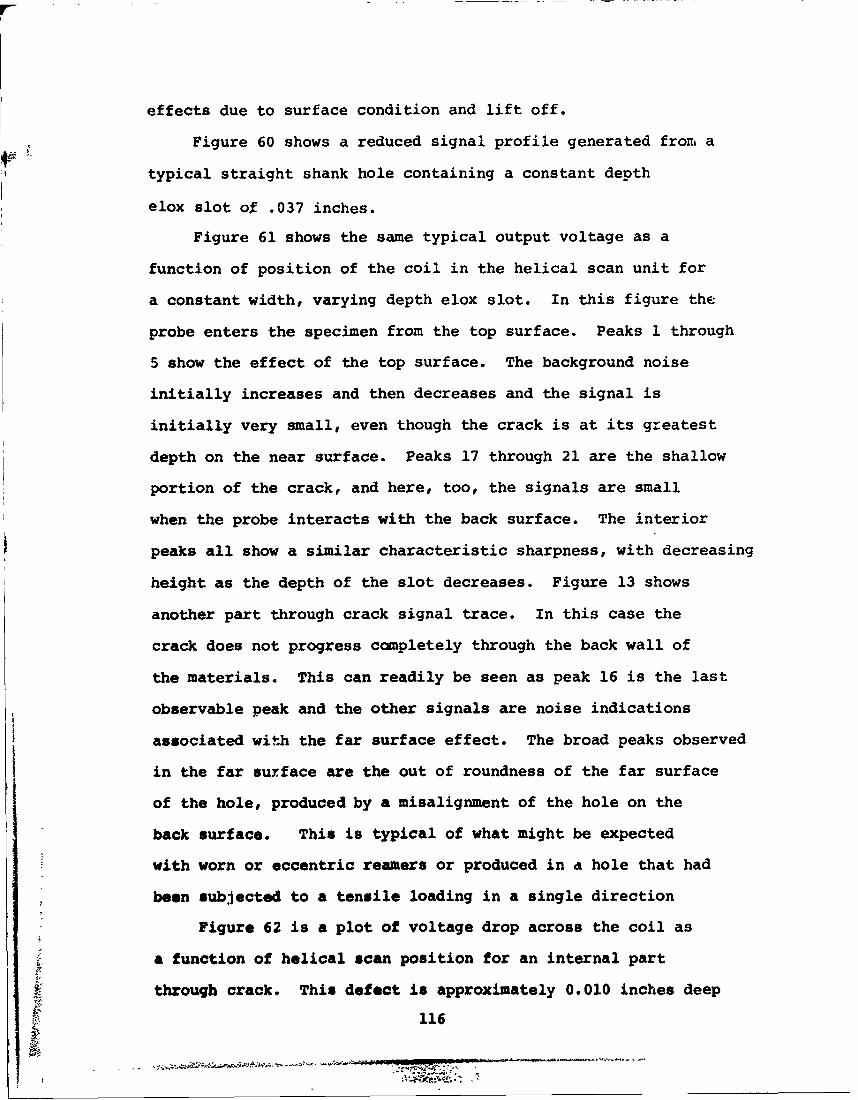
effects due to surface condition and lift off.
Figure 60 shows a reduced signal profile generated front a
typical straight shank hole containing a constant depth
elox slot of .037 inches.
Figure 61 shows the same typical output voltage as a
function of position of the coil in the helical scan unit for
a constant width, varying depth elox slot. In this figure the
probe enters the specimen from the top surface. Peaks 1 through
5 show the effect of the top surface. The background noise
initially increases and then decreases and the signal is
initially very small, even though the crack is at its greatest
depth on the near surface. Peaks 17 through 21 are the shallow
portion of the crack, and here, too, the signals are small
when the probe interacts with the back surface. The interior
peaks all show a similar characteristic sharpness, with decreasing
height as the depth of the slot decreases. Figure 13 shows
another part through crack signal trace. In this case the
crack does not progress completely through the back wall of
the materials. This can readily be seen as peak 16 is the last
observable peak and the other signals are noise indications
associated with the far surface effect. The broad peaks observed
in the far suxface are the out of roundness of the far surface
of the hole, produced by a misalignment of the hole on the
back surface. This is typical of what might be expected
with worn or eccentric reamers or produced in a hole that had
been subjected to a tensile loading in a single direction
Figure 62 is a plot of voltage drop across the coil as
a function of helical scan position for an internal part
through crack. This defect is approximately 0.010 inches deep
Z 116
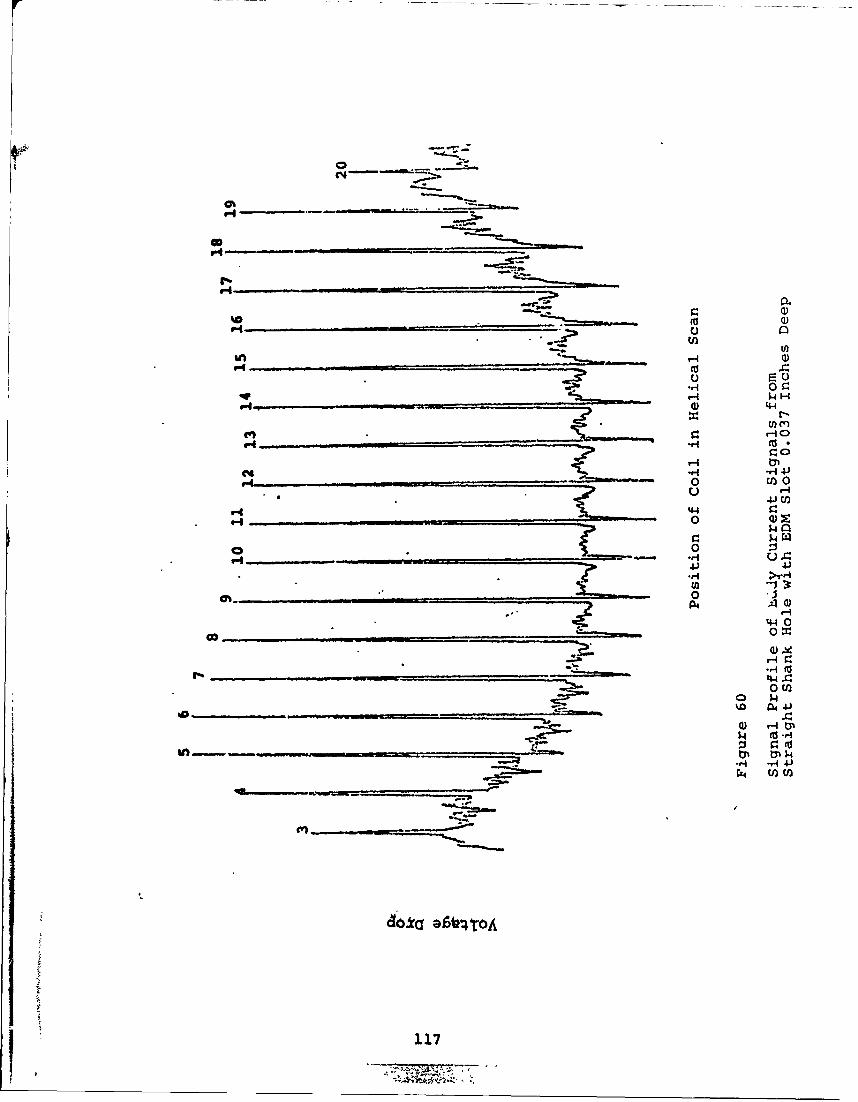
. -.... ... -
r4
.44
6-44-4
U) )H~ 0)-t-4
-r4 -H 4-4
6-4 44-
0
.4JU
.44 0
00
-H04.40
0 U)
N ~4
Sni - -i 4J
W LO U)U
117Iý 7-
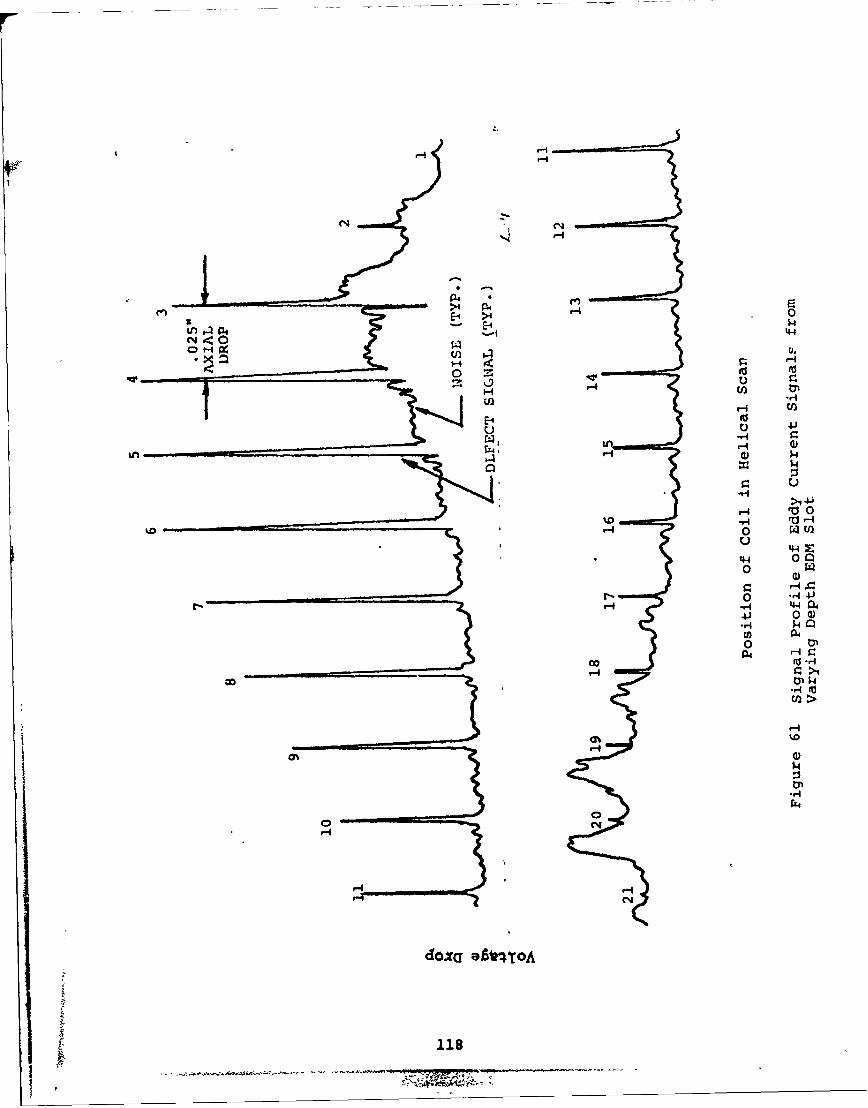
HH
>4 ~E-4 >4H
H 4-4
C) H1
U)U)4-
E-4-H 4 -)
ý,-'-4 r-
--4
V4- 00
0 '44-
44 00)0U) )
o -
U>1
-'-4
rz4
C.4
d~ga 86btIOA
118
77 71M
4J
E44
o NJ U
0
0 uM
ra44
•V 0
00
W 0aa
W, 0)
1.
S114
z 02
.r4
94 0N
I r4M "4
NO 0$4
r4 oo0 4 c
1190
and less than 0.175 inches in length. The acutal length of the
internal defect is not known as the specimen has not been
fractured to measure the geometry on the fracture surfaces.
Examination of the signal reveals that the small, sharp
peaks are indicative of the crack like defect. The larger,
broader peaks are due to out of round of the hole. This is
assumed to be due to improper reaming of the hole. It should
be noted that the out of round persists in the right hand
portion of the scan, while there are no indications of a crack
like defect in this portion.
Figure 63 shows a typical plot for a defect occurring
within the interface of steel plates. On the right there is
a defect 0.047 inches deep, on the left there is an additional
defect in the lower plate 0.030 inches deep. As the scan
passes the interface plate there is an abrupt transition due
to the edge effect of the coil passing near the free surfaces
of the specimen. As the coil centerline passes over the interface,
there is a horizontal line indicative of the plate interface.
The existance of an edge effect in this specimen is peculiar
as the edge effects are normally considered due to the partial
removal of the coil from the material as it enters the air.
The normal edge effect is then due partially to the impedance
and resistance changes of the material being investigated,
i.e., slowly changing from steel to air. However, it appears
that edge effects can be obtained even with extremely thin
air interfaces as shown in the figure.
Direct Correlation of Signal Height
When one examines the signal outputs associated with the
scans within the interior of the bolt hole probe, it is immediately
120
SAMPLL AD-12 ,;;flPLL AC-14slot depth - .033" to .029" slot uepth = .077" to
.047"
PLATE INTERFACL
0
Location of Probe within Dolt Hole
Figure 63
Eddy Current Scan Showing Plate Interface
Figure 64
PLOT t& SIGN:.T. PEAK Hi•I•U:T VS
PERCENT D•SPT11 iN L 1/21N PLATE
.I SPECIMEN AB-14
LO0
S" .03CN
DEPTH
.020
.010
• DEPTH IN HOLZ
121
I/• , • .
apparent that the large spikes correspond to linear defects
within the bolt hole. The simple analysis is to compare the
amplitude of the signals with the depth of the defect at that
particular position within the bolt hole. This was initially
discussed by Padilla and Parks,(27 who showed that quite
accurate correlations between signal height and crack depth
could be used to map the flaw geometry within a bolt hole in
7075 T651 Aluminum specimens.
Figure 64 plots the value of the mean-to-peak values for
the defect indication as a function of the percent (%) depth
within the bolt hole. The solid line is the calculated value
of actual defect depth as obtained by measurements off of the
specimen at the free edge and using the incline of the defect.
It can be seen th.t the eddy current peak accurately measures
the linear change in defect depth for about 70% of the defects
linear length along the interior of the hole. Most noticeable
is the edge effect at the surface of the specimen where the
signal height rapidly decreases as the coil begins to interact
with the free surface. Hence, the signal is rapidly decreased,
even though tae actual depth is about 0.025 inches. Also
significant, is the slight edge effect observed as the depth
o of the defect approaches the interior surface of the bolt hole.
Here the signal peak heights rise above the straight line
portion of the curve.
If all of the data obtained from the linear portions of the
peak-to-peak signals are plotted together, a calibration plot can
be drawn as shown in Figure 65. The equation for the curve is
given by:Y - .16 + 182.8 X
122
in
0
in
a 40 V
P46*u in4
$A 0
.4 a. to C
0n (A(
'4 0% 41
0.
P4 4A N
P,
o ~i 01 0
*0123 .
Where Y is the peak-to-peak amplitude for the eddy current
signal and X is the actual depth of the defect in inches.
The 1 95% confidence limits have also been drawn in
Figure 65. This plots the deviations from the straight line
that would be expected using the mean values of each reading
for depth. Thus, one would expect with a 95% confidence level
that given a peak amplitude of say, 5.0, the actual defect
depth would lie within a range of 0.024 to 0.030 inches in
depth. This requires that the signal height be adjusted by
calibrating with a known depth of defect to obtain a standardized
signal. Otherwise it is apparent that any desired signal peak-
to-peak height could be obtained by changing the gain on the
amplification for the Y coordinate.
Following Saddler( 2 6 ), one can define the minimum
sensitivity or minimum flaw depth that would be expected to be
detected as follows: consider the standard deviation of the
calibration curve of Figure 65, the value of the x intercept
for the lower bound 95% confidence line indicated that there is
1 5% probability of a flaw of 0.0025 inches deep existing
within the specimen without obtaining a recognizable peak-
to-peak signal. This means that a signal height of zero would
be obtained with a defect 0.0025 inches deep at least 5%
of the time. Hence, at a 95% level, a defect of 0.0025
inches deep could exist and not be distinguishable from the
inherent electronic backgrnund noise.
Thus, given a known defect depth, upon which initially
calibrated the system, a reasonable good approximation of the
depth of the defect can be determined using Figure 65. It
r'1ý
124
should be emphasized however, that the calibration curve was
obtained using EDM slots, and not fatigue cracks, and hence, if
the system cannot distinguish between slots and fatigue cracks,
the actual depth measurements can be in considerable error.
Transfer Analysis of Eddy Current Signals
The identification and categorization of the signals
associated with different types of defects when scanned by the
eddy current system are accomplished by a transfer function
analysis of the particular defect signal. When one considers
the integral transform f',p) of a function f(x) to be defined by
the integral. (28)
f(p) = f(x)K(p,x)dx
b
Where K(p,x) is a known function of p and x is called the
kernel of the transform. In this analysis, we use the complex
Fourier transform defined by:
rf(x)eiPXdx . f(p)
The transform sets up a correspondence between the functions
f(x) on the interval 0 x n and sequences of numbers n = 1, 2, 3...n.
Data taken in the time domain, from the peak-to-peak
versus time eddy current scan unit is related to the frequency
domain through the transform equations. This can be accomplished
either by using a frequency analyzer or by direct integration.
In this analysis, the integration was accomplished directly
by digitizing portions of the input function f(x) and performing
the Fourier transform directly on each digitized interval.I Suppose we are given a number Nz(max) sample value of a
125

digitized eddy current signal. The calculation of its Fourier
transform will give the frequency content or power spectrum of
the given signal, or segment of the signal. The sample values
are assumed tv be zero outside of the range 0 to Nz(max)-1. In
this sense the Fourier transform is a finite transform and deals
only with the finite record of the signal.
The calculations for the transform cannot be made for
all frequencies w, but only at some finite set. It is convenient
to choose the set of Nx(max) frequencies given by:
wk = K2lT/Nx(max) K = 0, 1, 2 ... Nx(max)-l
These correspond to values of K given by:
K = ejk21t/Nx K = 0...Nx-l
And the transform,n= NZ max-i
f(p) = Z F(n)e-jK2 /Nx(max)n= 0
In this program analysis we have chosen Nz and Nx to be possibly
different from each other. This precludes the possibility
of performing an inverse discrete Fourier transform which would
be facilitated by making Nz = Nx. However, for the sensitivity
of the system used, it appears reasonable to allow the two
values of sampling arid frequency change to be different from
each other.
After the power spectrum has been obtained for each pulse,
both the input pulse and output pulse (obtained separately)
the two spectrums are divided by each other. Hence, the transfer
function is obtained at each value of wK. This is to facilitate
126
the obtaining of the Fourier transfer function, Hence:
14 Tr(WK) - f(p,wK) OUTPUT/f (p,wK) INPUT
The absolute magnitude of the transfer function is plotted
as a function of the frequency as shown in Figure 66. If
there were no defect present the transfer function would have
a constant magnitude of unity. This means that there is
simply a constant that relates the input function to the output,
i.e. a simple scale change. When the defect is present, since
the magnitude of the input function remains constant (since
it is assumed to be a dummy input) the magnitude of the transfer
represents changes due to changes in the OUTPUT function. The
form of the output function then determines the location of the
high spikes on the Tr(s) vs frequency curve. If there are a
large number of peaks, this implies that the defect width is
large, since the transform for a broad unit pulse would
produce a large number of closely spaced peaks in frequency space.
This is shown in Figure 65 for the transfer function of a wide
EDM slot. If however, the transfer function exhibits only
one or two spikes, this implies that the impulse producing
the curve that is transformed is extremely narrow and tight.
This would obviously be that of a crack, Figure 67.
The influence of the width of the pulse on the number of
spikes in the transform is shown by comparing the power spectrum
of a narrow pulse with that of a broad pulse, as is shown in
Figure 68. The expression for the Fourier Spectrum for a
square pulse of amplitude A and length T gives:
127

C-,
0--4
C;
00
r44
Cc
0
41 cic
L 0 L
% 0
4' ci:444
$4
a) X:144 5
U' '5 ,~iC\CiJ CC
00 002 00*091 OOOoil 00*09 000OhDoI 2~ofliiidw~u WYOAiSNUHI
128
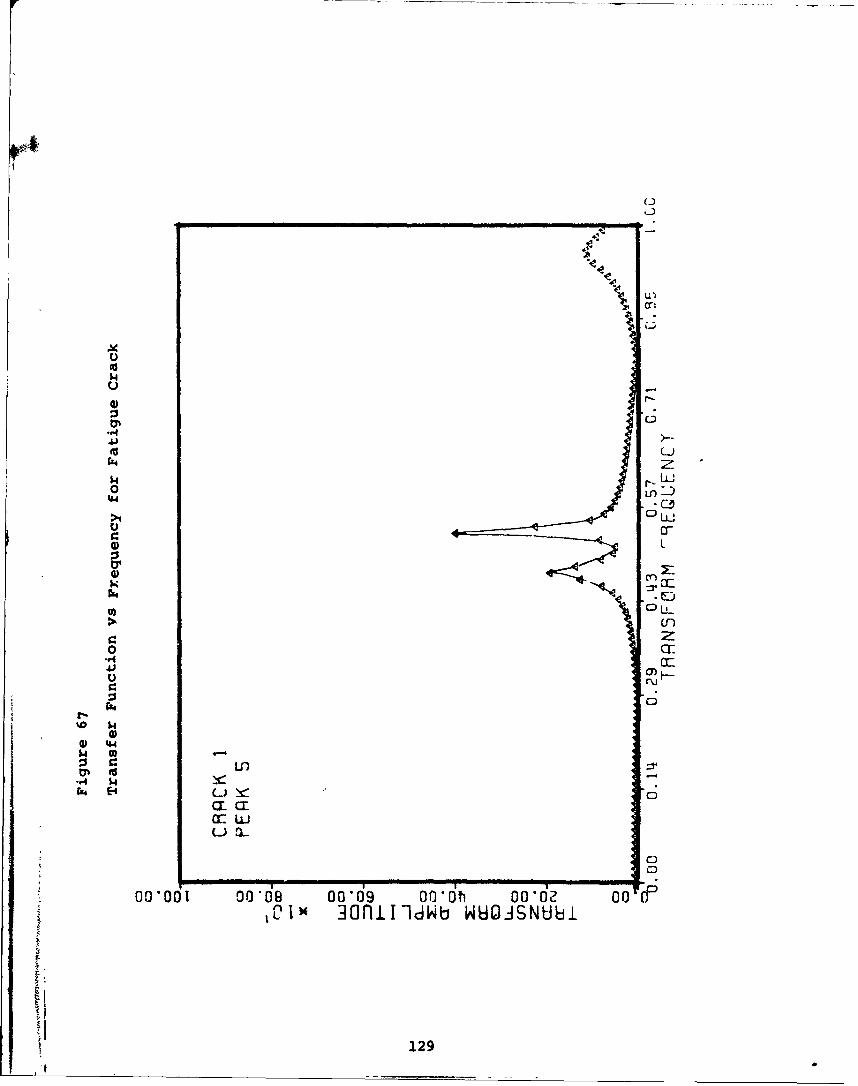
Uto
$4
4)-
.q.4
Ca4 zILl
U ar-L
o) ci:94J
0
4)r
-#4 cc
*e4 M1-
0
00o01 dg8 O00 oo~db oo~d201M~ 3oflii~dw WYOJSNUbi
129
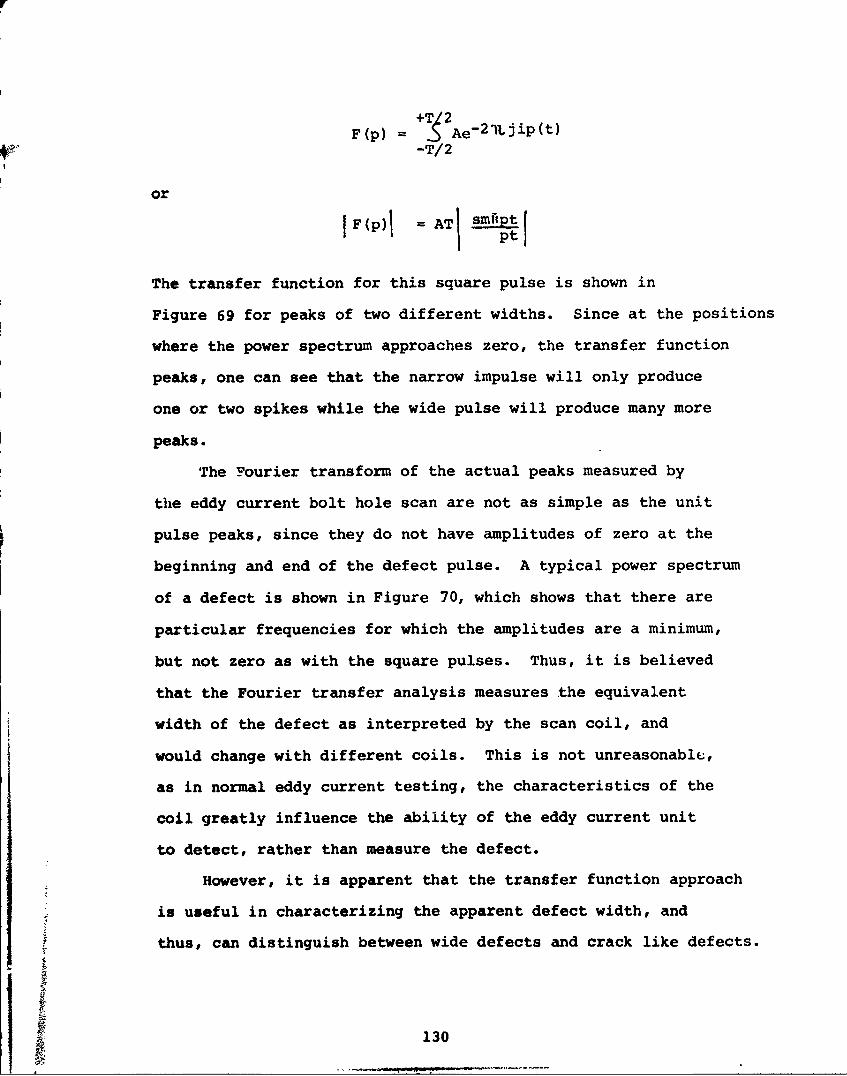
F(p) = Ae-21Ljip(t)-T/2
or
F (p)~ AT~ smript
The transfer function for this square pulse is shown in
Figure 69 for peaks of two different widths. Since at the positions
where the power spectrum approaches zero, the transfer function
peaks, one can see that the narrow impulse will only produce
one or two spikes while the wide pulse will produce many more
peaks.
The Yourier transform of the actual peaks measured by
the eddy current bolt hole scan are not as simple as the unit
pulse peaks, since they do not have amplitudes of zero at the
beginning and end of the defect pulse. A typical power spectrum
of a defect is shown in Figure 70, which shows that there are
particular frequencies for which the amplitudes are a minimum,
but not zero as with the square pulses. Thus, it is believed
that the Fourier transfer analysis measures the equivalent
width of the defect as interpreted by the scan coil, and
would change with different coils. This is not unreasonable,
as in normal eddy current testing, the characteristics of the
coil greatly influence the ability of the eddy current unit
to detect, rather than measure the defect.
However, it is apparent that the transfer function approach
is useful in characterizing the apparent defect width, and
thus, can distinguish between wide defects and crack like defects.
130
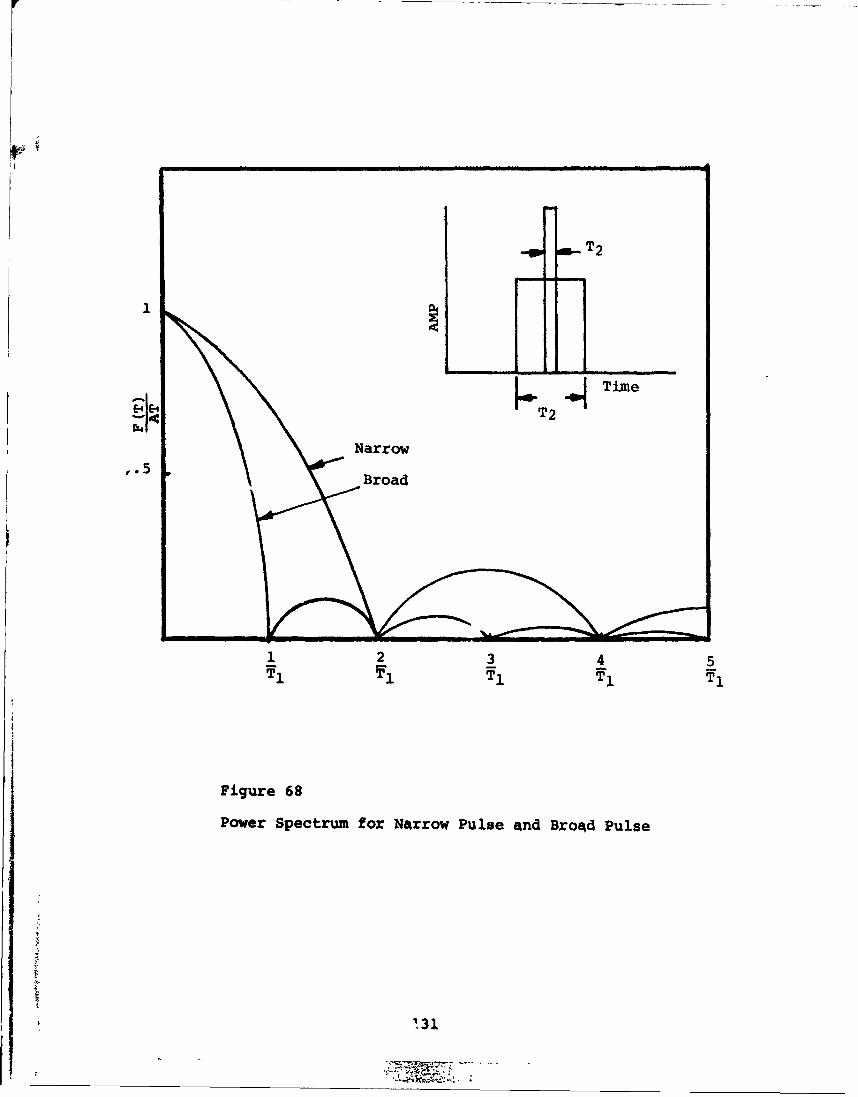
-- •-T2
k ~ Time•I4 T2
Narrow
Broad
1 2 3 4 5
Figure 68
Power Spectrum for Narrow Pulse and BroAd Pulse
'31

]$4T2
w
Figure 69
Transfer Function for Square Pulse
132
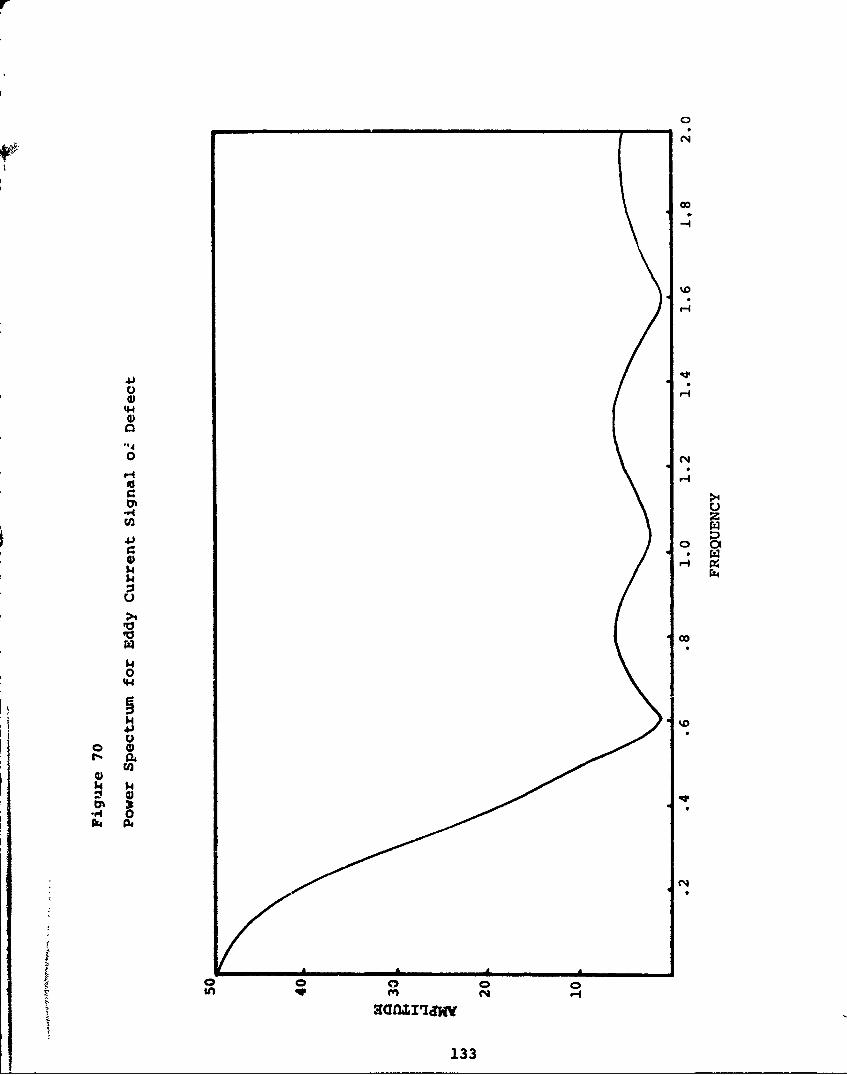
"4-.
0~
H
d 0P44
$40444
*r4
4113H

SECTION VIII
SUMMARY
Summary
The ability of ultrasonics and eddy current bolt hole
probes to locate, measure and characterize the defects associated
with fastener holes has been examined and shown to be of merit.
At the present time it is not possible to reliably determine
the size and shape of the defect, but it is very possible
to determine the presence of the defect when the length
of the defect is 0.030 inches or greater. These are estimates
based on the measurement of fatigue like flaws eminating from
fastener holes, when EDM slots or other artificial flaws are
used, the potential for much smaller defect detection is
increased.
It has been demonstrated that the major factors influencing
the inability of ultrasonics to measure the criticality of the
defect, once the defect has been found, are associated with the
stress field and morphology of the crack, and not the metallurgical
factors for the material. It should be recognized that
metallurgical features become significant in reducing or otherwise
influencing the detectability and characterization only in the
vicinity of welds or diffusion bonded areas where gross
attenuation-grain size changes may occur or where abrupt
metallurgical phase transitions would produce erroneous
reflections.
The factors that influence the measurement of criticality
for ultrasonics are: stress state, prior history, loading
134
.31

sequence, presence of corrosion, presence of foreign material
particularly moisture. It has been shown that measurements of
flaw size from the maximum amplitude reflection can be seriously
in error, as the maximum reflection can increase several fold
by an application of external stress opening the crack.
Corrosion significantly increased the amplitude of the reflected
signals from fatigue cracks, but did not influence the signals
from EDM slots. This would be expected only if the amount of
ultrasonic reflection from a fatigue crack was strongly
influenced by the tightness and surface condition of the crack.
Hence, it is strongly felt that callibration of ultrasonic
response from EDM notches or flat bottom holes, while simple
to perform and relatively easy to repeat, bears little
actual relationship to the actual problem of characterizing
tight defects.
When the presence of the defect is in the vicinity of
a cutout which would be a much stronger reflector for the ultrasonic
energy, such as a crack in the vicinity of the fastener hole,
the identification of the defect becomes even more difficult.
There are two ways that this identification problem can be
solved: first to develop a complex scan unit such as the
tangential scan unit developed by Boeing et all, which scans
the hole with the ultrasonic beam "skimming" tangential to
the larger bolt hole reflector, and second, develop a technique
that identifies the presence of the defect within the greater
refelcted signal of the bolt hole. The second technique was
the one adopted for this program, and has been shown to be
extremely effective in identifying the presence of the defect
135
within the bolt hole area.
4 The successful technique utilized the concept of the
indicium, which is a measure of the total reflected signal
associated with both the bolt hole reflector and the defect
reflector. The indicia has been developed and discussed in
detail for its role in identifying the orientation, size and
position of the defect. It is seen that while the indicia
suffers from the same problem as do all ultrasonic reflection
techniques, i.e.major changes in reflection due to slight
changes in applied stress, it holds promise for more, detailed
characterization of the defect than do single maximum peak
identification techniques. The indicium when combined with the
transfer function concept proves itself to be as sensitive, if
not more sensitive than other bolt hole inspection techniques,
with the added factor Uiat the experimental setup is extremely
simple and almost identical with the standard practice for
inspection of bolt holes.
The transfer function concept utilizes the Laplace or
Fourier transform of the output signal from the indicia,
and when the output transform is divided by a known input
transform (normally an unflawed specimen or a Dirac input)
greatly magnifies the differences in indicium. These differences
are then related to the presence of the defect. It has been
shown that the presence of a 0.030 inch defect within the 0.5
inch diameter bolt hole can be detected with a minimum of
two scans. This defect is of a fatigue type crack. When
EDM slots are used, defects on the order of 0.020" in length can
be detected.
136
. 7-,7
An additional technique exploted in the program was
that of eddy current bolt hole probes. Because of the nature
of the program, a simple unique design for a self calibrating
helical scan unit was constructed as the first portion of
this program. This unit measures the impedance changes
associated with a differential eddy current coil operating
at 4 Mhz within the bolt hole. These changes are recorded on
a x-y strip chart record which then can be used to characterize
the type of defect present. It is shown that EDM slots can use
the maximum peak-to-peak signal height as a measure of the depth
of the EDM slot, but again it is doubtful if such a simple
technique can be applied to fatigue cracks. A parallel study
showed that fatigue cracks in the bolt hole produce significantly
smaller pertubations within the bolt hole scan, but these, too,
can be readily identified as to their presence or absence.
When a simple Fourier analysis is performed on the specific
defect signals, it has been shown that the type of defect
can easily be characterized as to type. Wide defects such as
EDM slots produce significantly different transfer plots
than those of tight fatigue cracks. Thus, once the presence
of the defect has been verified, the type of defect within
the bolt hole can easily be characterized as to type.
137
SECTION IX
REFERENCES
1. Coffin, L., and Tiffany, C.F., AIAA Paper 175-781, 1974.
2. Mil Standard 1530, Aircraft Structural Integrity ProgramS-83444 Damage Tolerance Requirements.
3. Packman, P.F., Pearson, H.S., Young, G., NDT Definitionof Fatigue Cracks, Journal of Materials (1972) p. 666.
4. Betz, C.E., Principles of Penetrants, Magnaflux Corp.
5. Proceedings of the Interdisciplinary Workshop onNondestructive Testing-Materials CharacterizationAFML-TR 74"69.
6. Raatz, C.F., Senske, R.A. and Woodmansee, W.E., Detectionof Cracks Under Installed Fasteners, AFML-TR 74-80.
7. Proceedings-Fourth Scientific Conference on UltrasonicDefectoscopy of Welded Joints, Defectoskopia, NovDec.(1970).
8. Krautkramer, J., and Krautkramer, H., Ultrasonic Testingof Materials, Springer Verlag, N.Y., 1969.
9. Yee, B.G.E., Influence of Stress on Ultrasonic ShearWave Detection of Cracks-To be published.
10. Elber, W., Engineering Fracture Mechanics Vol. 2 (1970,p. 37.
11. Corbley, D.M. and Packman, P.F., The Effect of Singleand Multiple Peak Overloads on Fatigue Crack Propagationin 7075-T6 Aluminum, International Journal of Fracture,Jan. 1973.
12. Hertzberg, R.W. and VanEuw., E.F., Met. TransactionsVol. 4 (1973) 887.
13. Corbley, D.M., Grandt, A. and Starke, E., Paper Presentedat ASTM Conference on Fatigue Load Interaction, Toronto(1974) to be published as STP.
14. Giacomo, G.P., Crisci, J.R. and Goldspiel, S., MaterialsEvaluation, Sept.(1971) p. 189.
15. Gurvich, A.K., Ermolov, I.N., Ultrasonic Flaw Detectionof Joint Welding, Kiev, 1972.
16. Throop, J.F., Crack Resistance in Thick Walled Cylinders,in Symposium on Relevence of Fracture Toughness to theDesign and Reliability of Military Equipment, June 1973.
138
REFERENCES (Continued)
17. Clements, W.C., Schnelle, K.B., Mathematical Modelingof Dynamic Systems with Applications to Non-idealSystems, Rept. 24. EWRE, Vanderbilt, Aug. 1969.
18. DiStefano, J.J., Stubberud, A.R., Williams, I.J.,Theory and Problems of Beedback and Control Systems,McGraw Hil'., 1967.
19. Libby, Materials Evaluation, 14(Dec, 1956) p.12.
20. McClung, G.O., Materials Evaluation 15(Ap. 57) p. 116.
21. Waldelich, D.L., Materials Evaluation, 27(Dec. 1970)p. 262.
22. Libby, H.S. and Cox, C.W., "Broad Band ElectromagneticTesting Methods, P.2" Geco Rept. HW 67639 (1961).
23. Robinson, B.H., Materials Evaluation, Vol. 16 (Jan. 58),
p. 36.
24. Reynolds, P.M., BNF Metals Technology Centre.
25. Lloyd, E.A., An Eddy Current Instrument for SurfaceInspection of Copper Housing Tubes. BNF-Rept. A1565,Sept. 1965.
26. Saddler, S., Sensitivity of Several NDT Methods AFML-TR-70, (1970).
27. Padilla, V.E. and Parks, T.W., Definition of FatigueCrack Geometry by Eddy Current Techniques, McDonellAircraft Rept. 1971 also, ASNT Symposium (1969).
28. Turner, C.J., "Integral Transforms in MathematicalPhysics", Chapman and Hill Lt'd (1971) London.
139

TABLE I
DIMENSIONS OF PART THROUGH CRACKSIN ALUMINUM FLAT PLAmES
Ult. Ref. Signal Height
Spec # Surface Length A RA
A66 .0438 2.0 2.0
A341 .0506 2.4 2.7
A15 .0683 2.9 3.0
A41 .0718 2.5 2.4
A46 .0834 3.0 2.8
A62 .0881 2.5 1.9
A68 .0890 3.) 2.8
A79 .0908 3.4 4.0
A.20(i) .0959 1.5 2.2
A13 .0978 2.1 3.4
A45 .0987 1.4 3.7
A12 .1045 4.2 4.2
A22 0() .1051 2.0 2.8
A30 .1097 4.4 4.8
A50 .1126 4.4 3.8
A58 .1149 4.3 3.2
A35(1) .1254 2.9 2.6
A39 .1345 4.8 2.7
A78 .1526 4.8 2.7
SA55 .1552 4.8 4.2
j A17( 1 ) .1560 1.0 2.8
A74 .1621 4.8 3.8
A64 .1756 5.5(2) 3.6
140
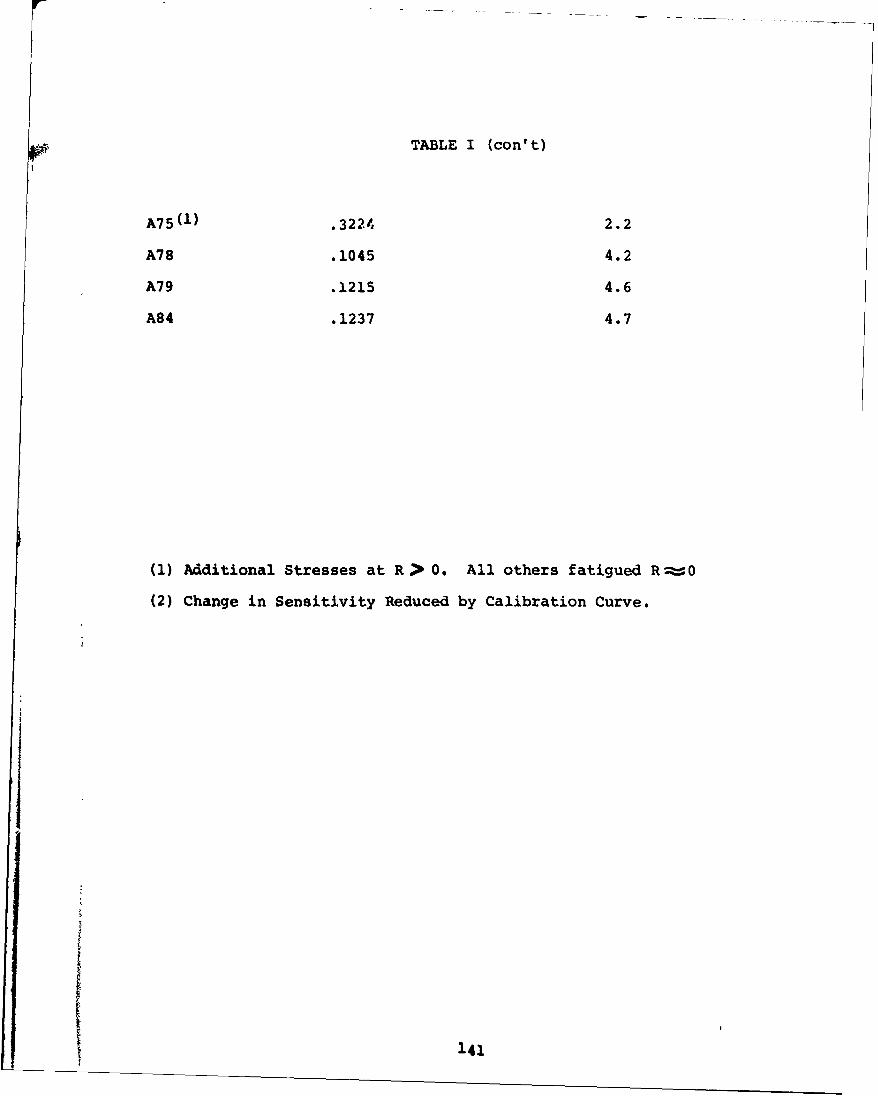
TABLE I (con't)
A75(1) .3224 2.2
A78 .1045 4.2
A79 .1215 4.6
A84 .1237 4.7
(1) Additional Stresses at R > 0. All others fatigued R;0
(2) Change in Sensitivity Reduced by Calibration Curve.
1S~141
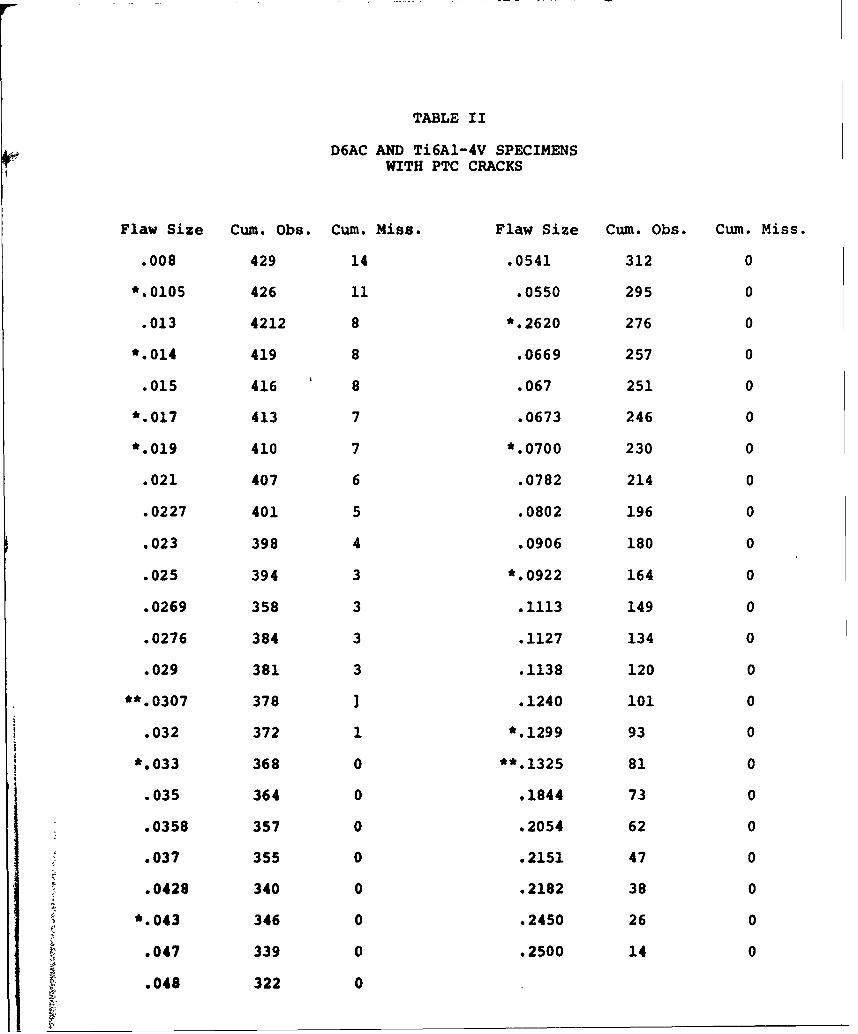
TABLE II
D6AC AND Ti6A1-4V SPECIMENSWITH PTC CRACKS
Flaw Size Cum. Obs. Cum. Miss. Flaw Size Cum. Obs. Cum. Miss.
.008 429 14 .0541 312 0
*.0105 426 11 .0550 295 0
.013 4212 8 *.2620 276 0
*.014 419 8 .0669 257 0
.015 416 8 .067 251 0
*.017 413 7 .0673 246 0
*.019 410 7 *.0700 230 0
.021 407 6 .0782 214 0
.0227 401 5 .0802 196 0
.023 398 4 .0906 180 0
.025 394 3 *.0922 164 0
.0269 358 3 .1113 149 0
.0276 384 3 .1127 134 0
.029 381 3 .1138 120 0
**.0307 378 ] .1240 101 0
.032 372 1 *.1299 93 0
*.033 368 0 **.1325 81 0
.035 364 0 .1844 73 0
.0358 357 0 .2054 62 0
.037 355 0 .2151 47 0
.0428 340 0 .2182 38 0
*.043 346 0 .2450 26 0
.047 339 0 .2500 14 0
.048 322 0
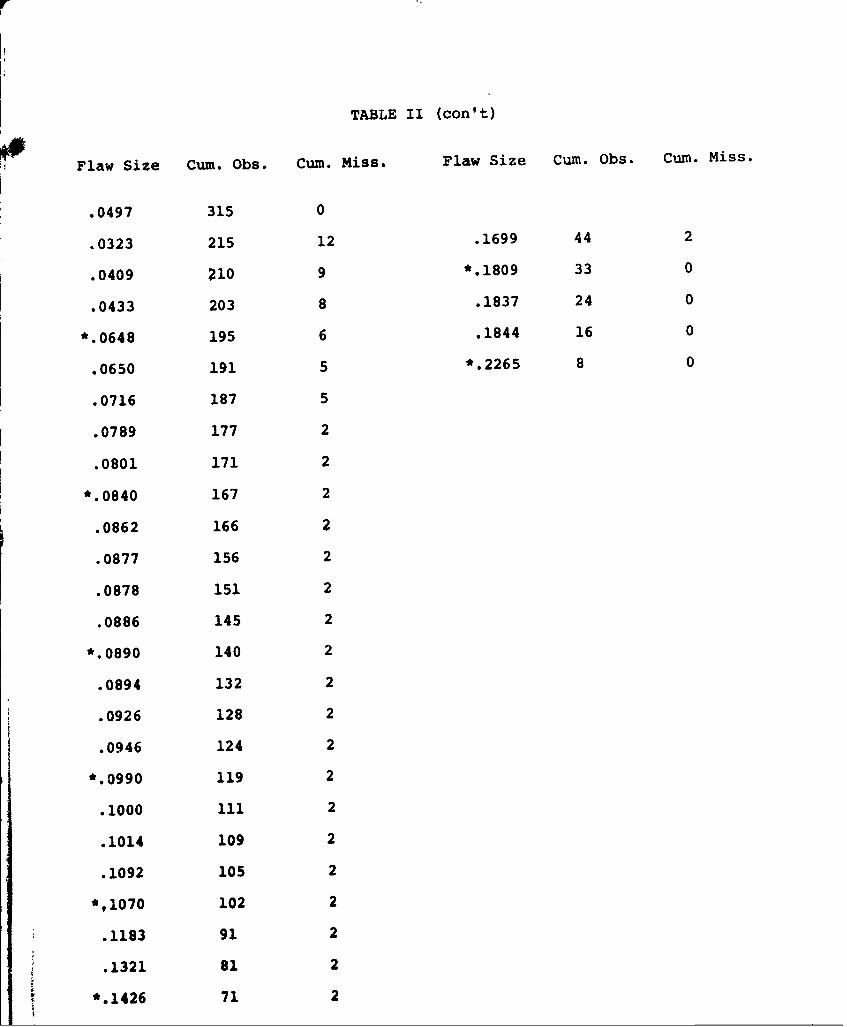
TABLE II (con't)
Flaw Size Cum. Obs. Cum. Miss. Flaw Size Cum. Obs. Cum. Miss.
.0497 315 0
.0323 215 12 .1699 44 2
.0409 210 9 *.1809 33 0
.0433 203 8 .1837 24 0
*.0648 195 6 .1844 16 0
.0650 191 5 *.2265 8 0
.0716 187 5
.0789 177 2
.0801 171 2
*.0840 167 2
.0862 166 2
.0877 156 2
.0878 151 2
.0886 145 2
*.0890 140 2
.0894 132 2
.0926 128 2
.0946 124 2
*.0990 119 2
.1000 111 2
.1014 109 2
.1092 105 2
*,1070 102 2
.1183 91 2
.1321 81 2
*.1426 71 2
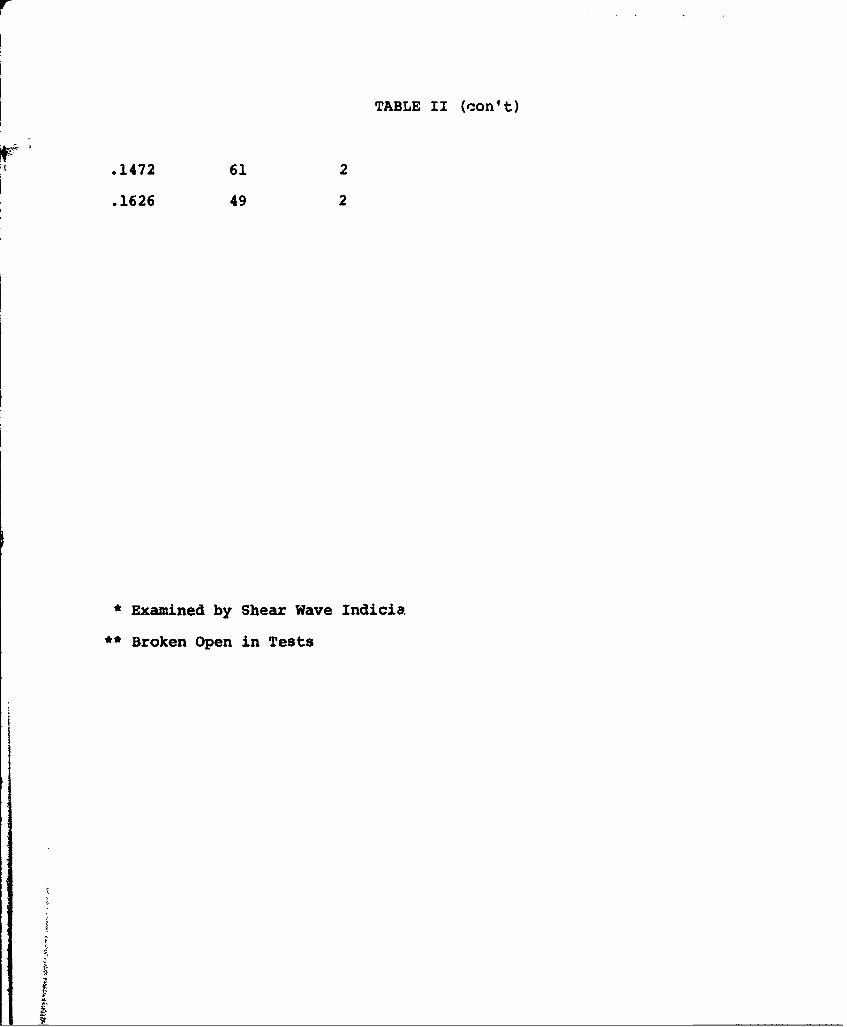
TABLE II (con't)
.1472 61 2
.1626 49 2
* Examined by Shear Wave Indicia
** Broken Open in Tests
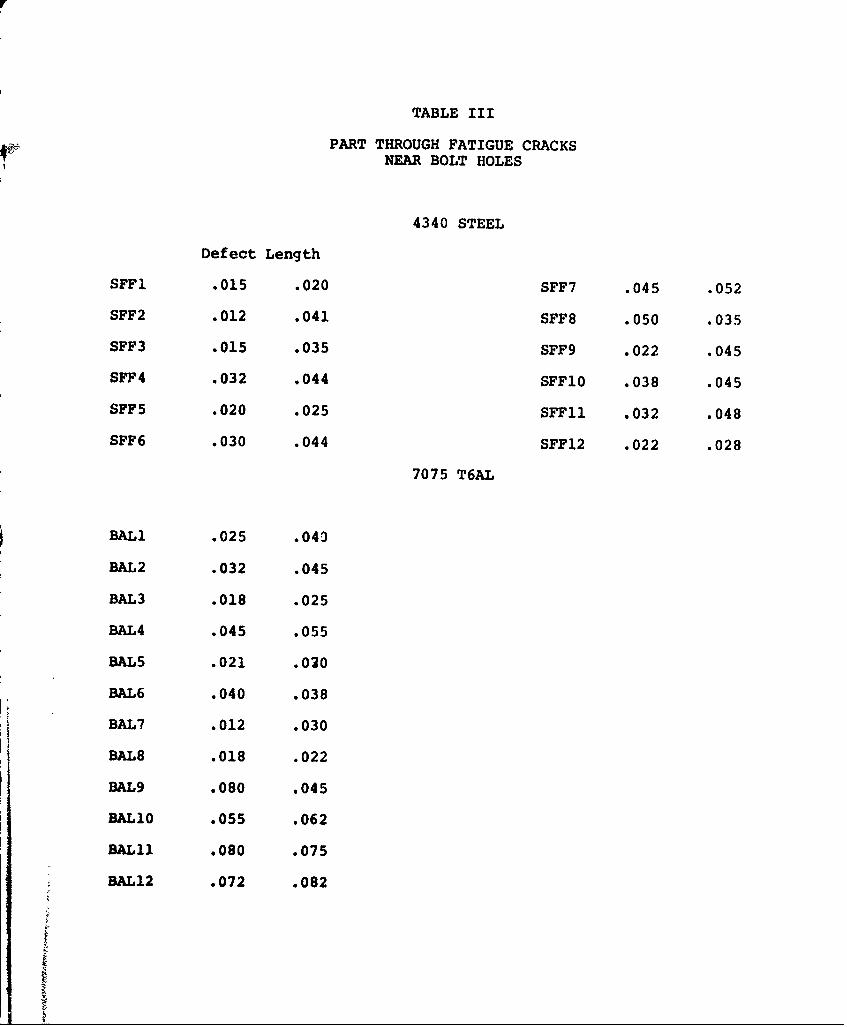
TABLE III
PART THROUGH FATIGUE CRACKSNEAR BOLT HOLES
4340 STEEL
Defect Length
SFF1 .015 .020 SFF7 .045 .052
SFF2 .012 .041 SFF8 .050 .035
SFF3 .015 .035 SFF9 .022 .045
SFF4 .032 .044 SFF10 .038 .045
SFF5 .020 .025 SFF11 .032 .048
SFF6 .030 .044 SFF12 .022 .028
7075 T6AL
BALl .025 .040
BAL2 .032 .045
BAL3 .018 .025
BAL4 .045 .055
BAL5 .021 .070
BAL6 .040 .038
BAL7 .012 .030
BAL8 .018 .022
BAL9 .080 .045
BAL10 .055 .062
BALl1 .080 .075
BAL12 .072 .082
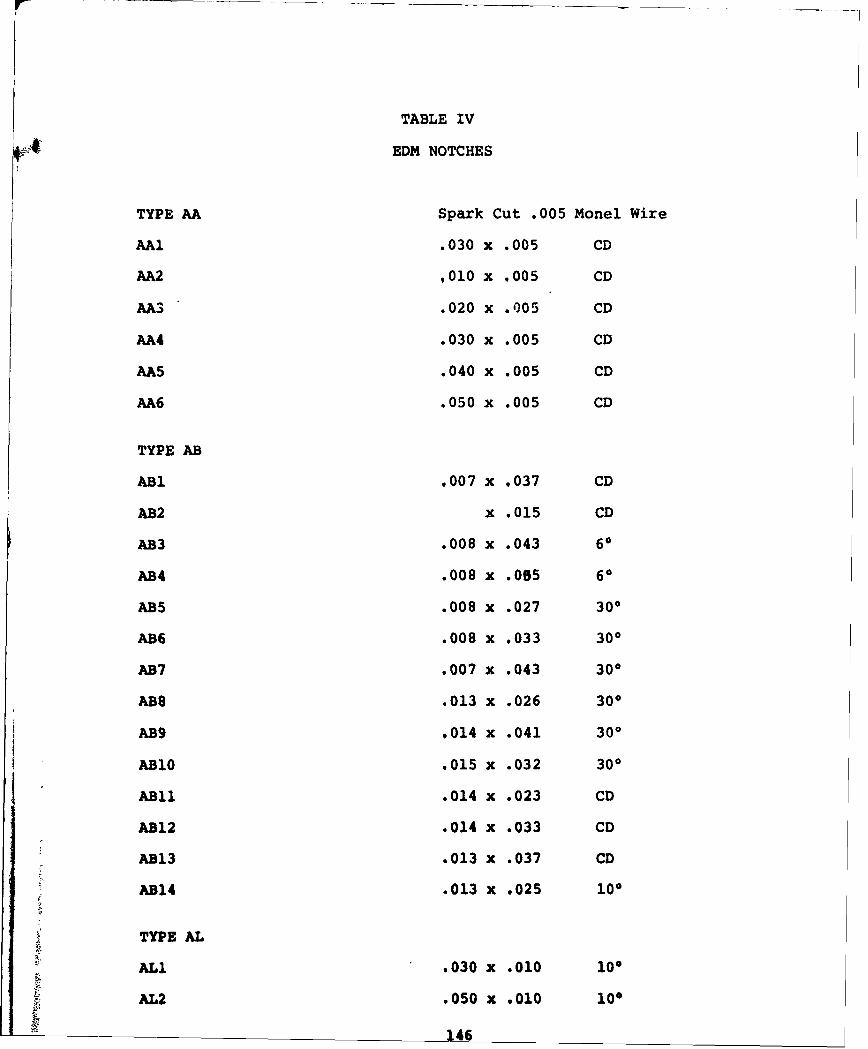
TABLE IV
F+ EDM NOTCHES
TYPE AA Spark Cut .005 Monel Wire
AAi .030 x .005 CD
AA2 .010 x .005 CD
AA3 .020 x .005 CD
AA4 .030 x .005 CD
AA5 .040 x .005 CD
AA6 .050 x .005 CD
TYPE AB
ABI .007 x .037 CD
AB2 x .015 CD
AB3 .008 x .043 60
AB4 .008 x .045 60
AB5 .008 x .027 300
AB6 .008 x .033 300
AB6 .007 x .043 300
AB8 .013 x .026 300
AB9 .014 x .041 300
ABI0 .015 x .032 300
AB10 .014 x .023 CD
AB12 .014 x .033 CD
AB13 .013 x .037 CD
AB14 .013 x .025 100
TYPE AL
ALl .030 x .010 100
AL2 .050 x .010 100
,46

TABLE IV (Continued)
a c wLength Depth Width
AC1 .015 .030 .005
AC2 .020 .030 .005
AC3 .030 .030 .005
AC4 .018 .005 .005
AC5 .030 .005 .005
AC6 .055 .005 .005
AC7 .020 .010 .005
AC8 .031 .010 .005
AC9 .048 .010 .005
AC10 .026 .020 .005
ACI1 .035 .020 .005
AC12 .047 .020 .005
ADI .010 x .008
AD2 .026 x .003
AD3 .034 x
AF1 .007 x .008
AF2 .020 x .008
AF3 .039 x .008
AC13 .063 x .008
AC14 .077 x .010
AC15 .053 x .010
AC16 .039 x .010
AC17 .047 x .010
AC 18 .056 x .010
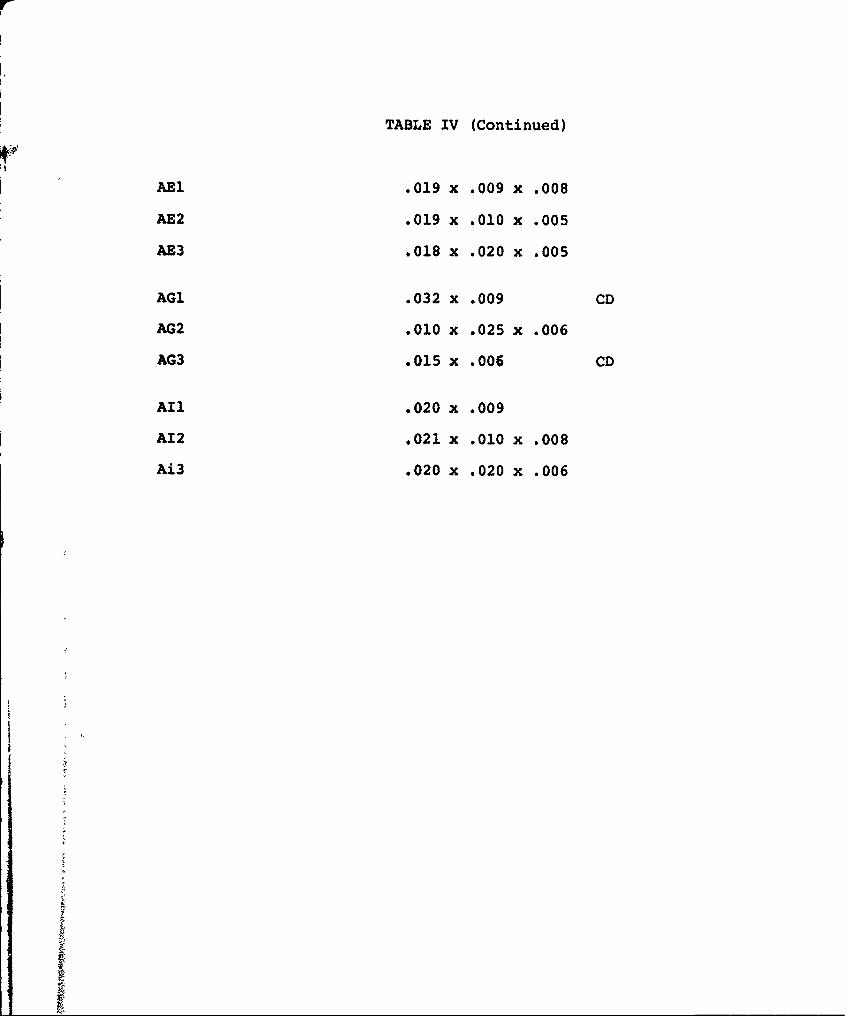
TABLE IV (Continued)
AEl .019 x .009 x .008
AE2 .019 x .010 x .005
AE3 .018 x .020 x .005
AG1 .032 x .009 CD
AG2 .010 x .025 x .006
AG3 .015 x .006 CD
All .020 x .009
A12 .021 x .010 x .008
AD3 .020 x .020 x .006
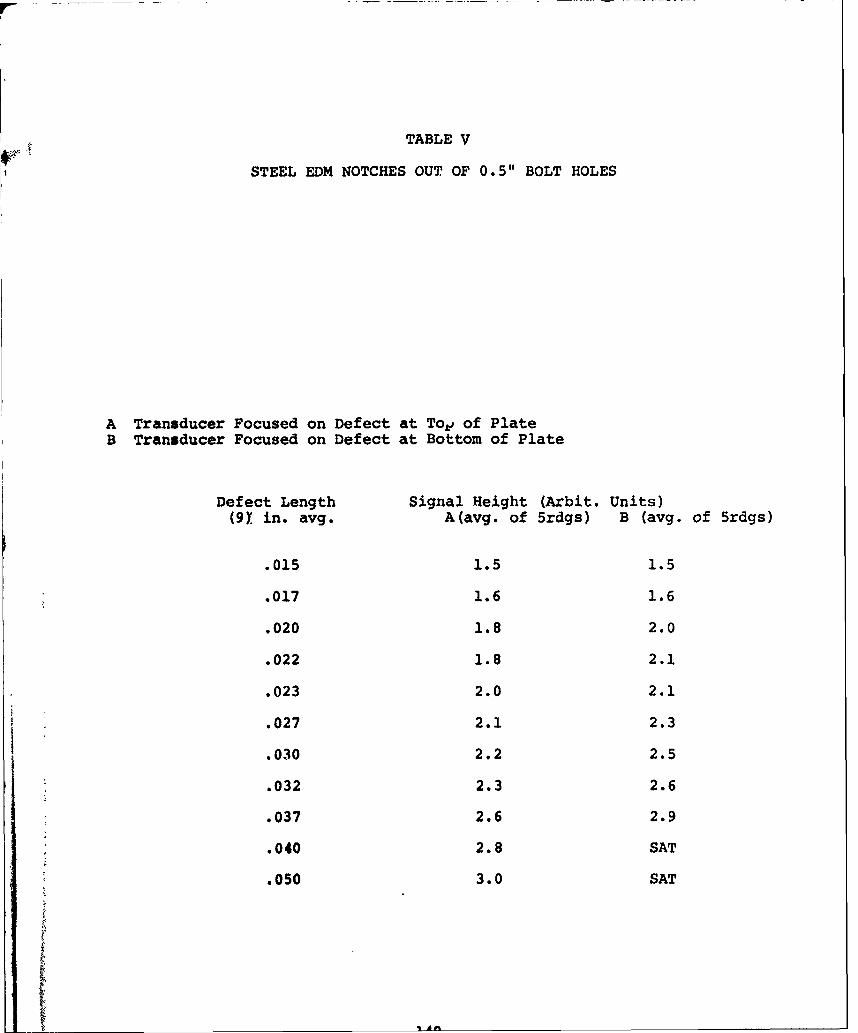
TABLE V
STEEL EDM NOTCHES OUT OF 0.5" BOLT HOLES
A Transducer Focused on Defect at Tog of PlateB Transducer Focused on Defect at Bottom of Plate
Defect Length Signal Height (Arbit. Units)(9Y in. avg. A(avg. of 5rdgs) B (avg. of 5rdgs)
.015 1.5 1.5
.017 1.6 1.6
.020 1.8 2.0
.022 1.8 2.1
.023 2.0 2.1
.027 2.1 2.3
.030 2.2 2.5
.032 2.3 2.6
.037 2.6 2.9
.040 2.8 SAT
.050 3.0 SAT
I Ad%

TABLE Vi
STEEL FATIGUE CRACKS OUT OF 0.5" BOLT HOLE
Maximum at XiSignal Height
Defect Length A Defect Depth C Arbitrary Units(estimated by micrometer) (avg. 5 readings)
.015 .022 1.5
.022 .035 1.6
.032 .040 1.8
.037 .040 2.0
.041 .040 2.3
.044 .042 2.3
.052 .050 2.5
150

TABLE VII
PART-THROUGH FLAWS
SPECIMEN TOP DEPTH BOTTOM DEPTH WIDTH DEPTH LENGTH OF FLAWINTO "LATE INCHES
AB-3 .043 0.00 .008 0.42
AB-4 .055 .0035 .007 0.50
AB-5 .027 .000 .007 0.047
AB-6 .033 .000 .008 0.063
AB-7 0.43 .000 .007 0.078
AB-9 .04.1 .000 .014 0.078
AB-10 .032 .000 .015 0.063
AA-2 .010 .007 .009 0.50
AC-13 .063 .008 .010 0.50
AC-14 .077 .047 .010 0.50
AC-15 .033 .00s .010 0.50J
151
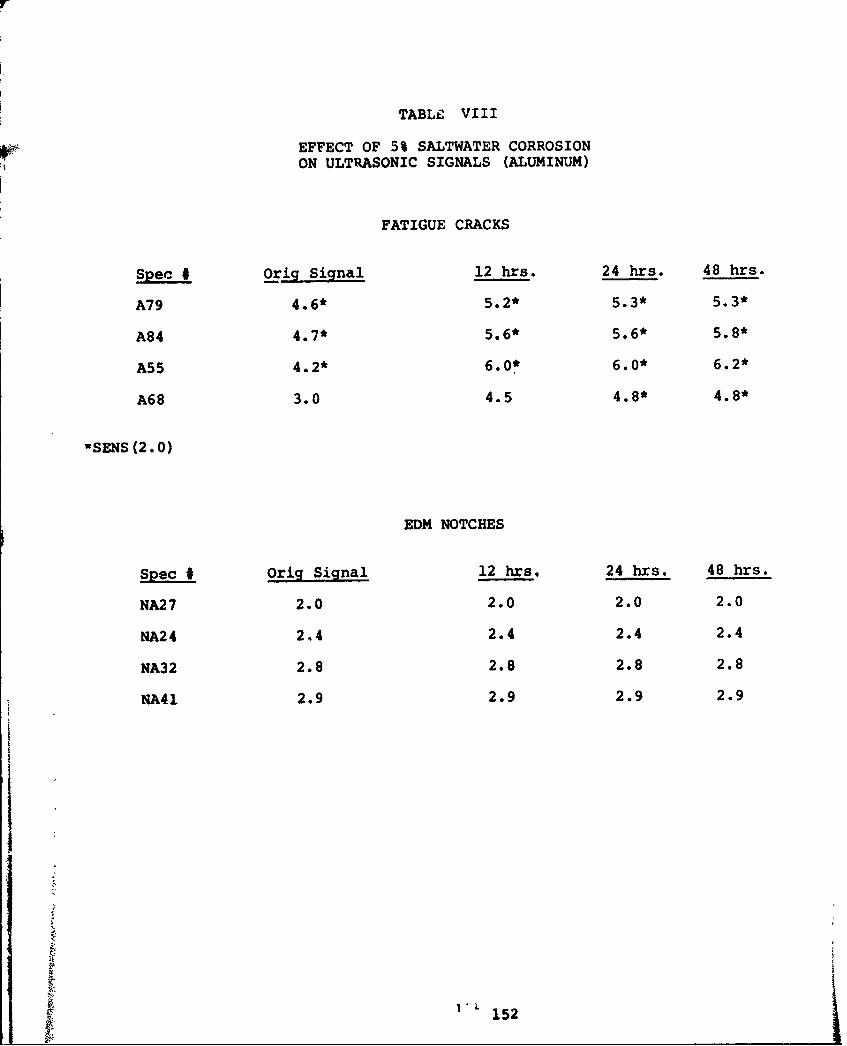
TABLE VIII
EFFECT OF 5% SALTWATER CORROSIONON ULTRASONIC SIGNALS (ALUMINUM)
FATIGUE CRACKS
Spec # Orig Signal 12 hrs. 24 hrs. 48 hrs.
A79 4.6* 5.2* 5.3* 5.3*
A84 4.7* 5.6* 5.6* 5.8*
A55 4.2* 6.0* 6.0* 6.2*
A68 3.0 4.5 4.8* 4.8*
-SENS (2.0)
EDM NOTCHES
Spec * Orig Signal 12 hrs. 24 hrs. 48 hrs.
NA27 2.0 2.0 2.0 2.0
NA24 2,4 2.4 2.4 2.4
NA32 2.8 2.8 2.8 2.8
NA41 2.9 2.9 2.9 2.9
S15L 2
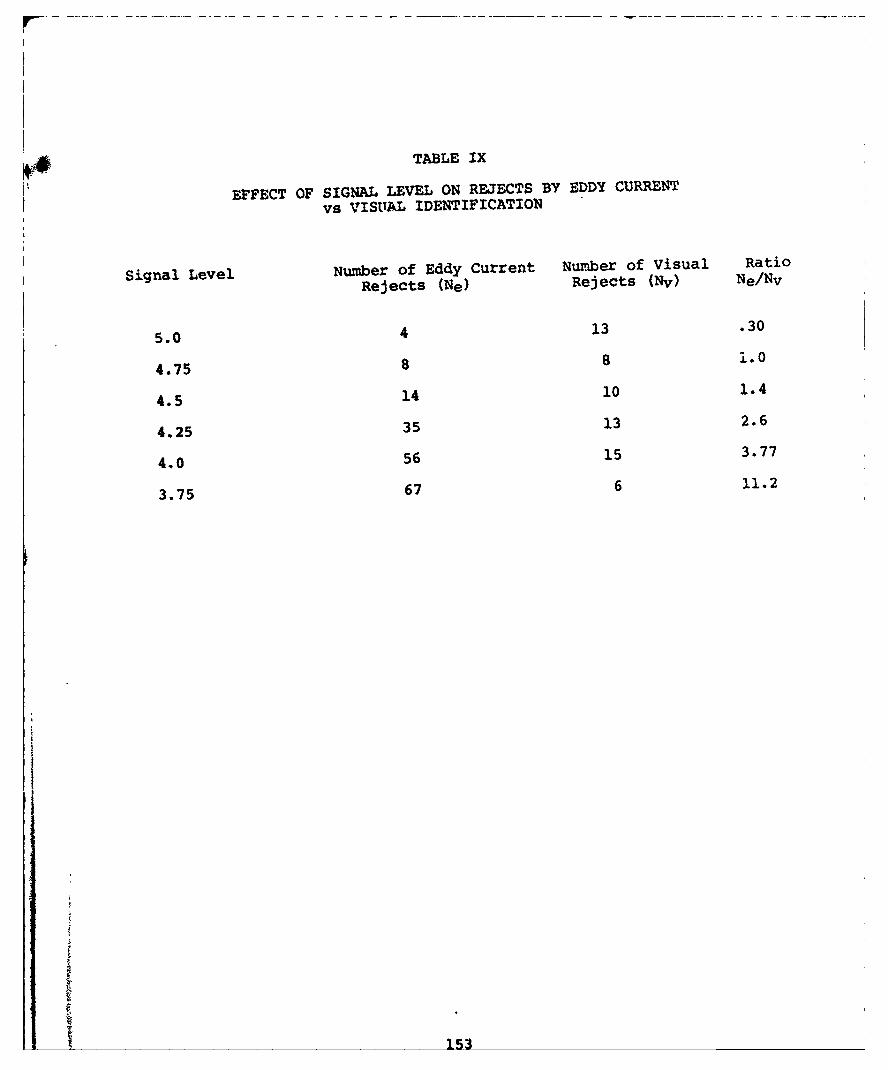
04 TABLE IX
EFFECT OF SIGNAL LEVEL ON REJECTS BY EDDY CURRENTvs VISUAL IDENTIFICATION
Signal Level Number of Eddy Current Number of Visual Ratio
Rejects (Ne) Rejects (Nv) Ne/Nv
5.0 4 13 .30
4.75 8 8 i.0
4.5 14 10 1.4
4.25 35 13 2.6
4.0 56 15 3.77
3.75 67 6 11.2
I153
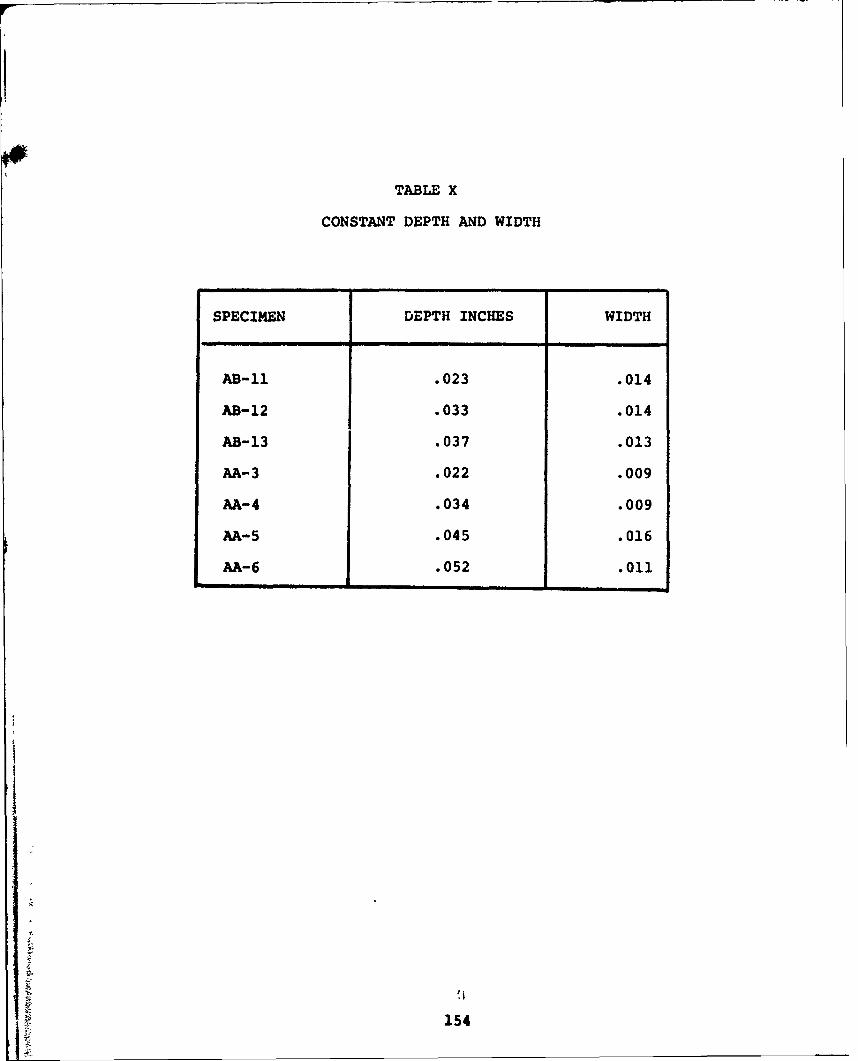
TABLE X
CONSTANT DEPTH AND WIDTH
SPECIMEN DEPTH INCHES WIDTH
AB-I1 .023 .014
AB-12 .033 .014
AB-13 .037 .013
AA-3 .022 .009
AA-4 .034 .009
AA-5 .045 .016
AA-6 .052 .011
154
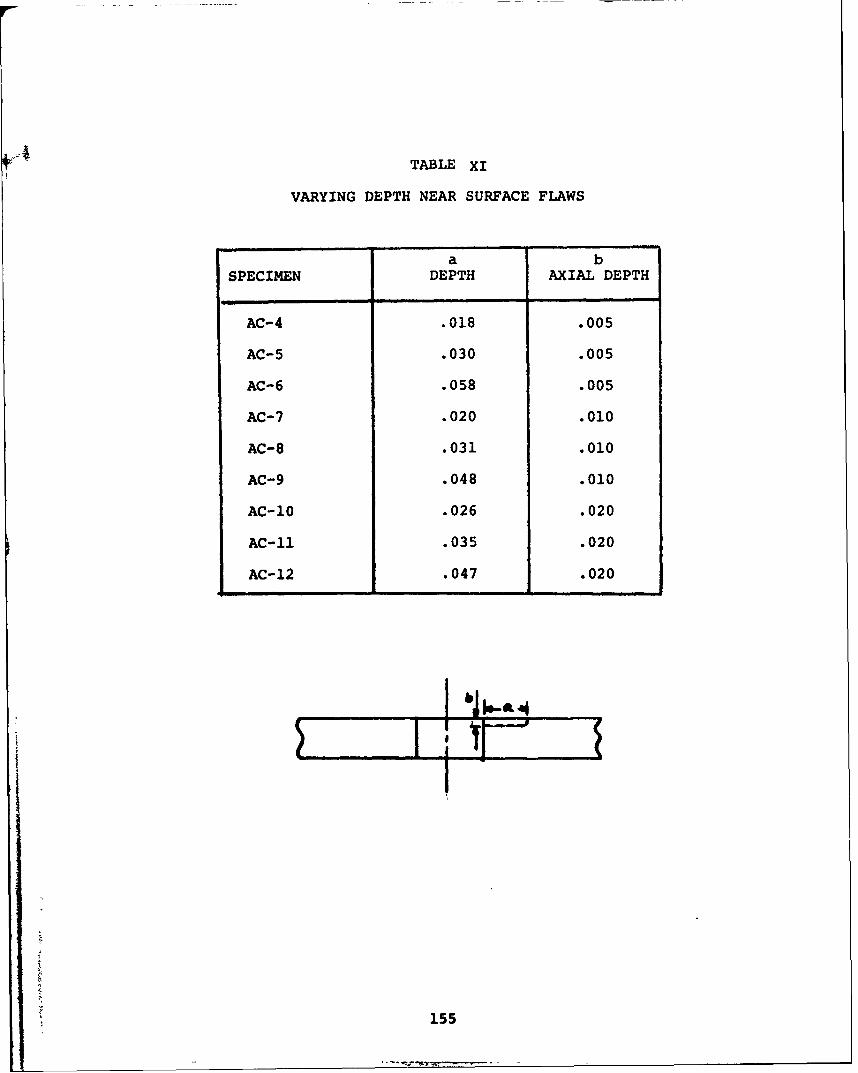
TABLE XI
VARYING DEPTH NEAR SURFACE FLAWS
a bSPECIMEN DEPTH AXIAL DEPTH
AC-4 .018 .005
AC-5 .030 .005
AC-6 .058 .005
AC-7 .020 .010
AC-8 .031 .010
AC-9 .048 .010
AC-10 .026 .020
AC-11 .035 .020
AC-12 .047 .020
I
S~155


![trtr trn tru tr[] ujosephschwartzdermatology.com/wp-content/uploads/... · trtr UEI trtr E] utr E] Y-ES tr tr B D tr tr tr tr tr NO tr EI tr u u u EI E tr OlherSystemic: Diobetes](https://static.fdocuments.in/doc/165x107/5f655dabeca5702d4204d061/trtr-trn-tru-tr-ujosep-trtr-uei-trtr-e-utr-e-y-es-tr-tr-b-d-tr-tr-tr-tr-tr-no.jpg)