Volume 1: Main Report - waterfootprint.org · the green, blue and grey water footprint of farm...
50
Value of Water Research Report Series No. 48 The green, blue and grey water footprint of farm animals and animal products Volume 1: Main Report Value of Water M.M. Mekonnen A.Y. Hoekstra December 2010
Transcript of Volume 1: Main Report - waterfootprint.org · the green, blue and grey water footprint of farm...

Value of Water Research Report Series No. 48
The green, blue and grey
water footprint of farm
animals and animal products
Volume 1: Main Report
Value of Water
M.M. Mekonnen
A.Y. Hoekstra
December 2010


THE GREEN, BLUE AND GREY WATER FOOTPRINT
OF FARM ANIMALS AND ANIMAL PRODUCTS
VOLUME 1: MAIN REPORT
M.M. MEKONNEN1
A.Y. HOEKSTRA1,2
DECEMBER 2010
VALUE OF WATER RESEARCH REPORT SERIES NO. 48
1 Twente Water Centre, University of Twente, Enschede, The Netherlands
2 Contact author: Arjen Hoekstra, [email protected]
© 2010 M.M. Mekonnen and A.Y. Hoekstra.
Published by:
UNESCO-IHE Institute for Water Education
P.O. Box 3015
2601 DA Delft
The Netherlands
The Value of Water Research Report Series is published by UNESCO-IHE Institute for Water Education, in
collaboration with University of Twente, Enschede, and Delft University of Technology, Delft.
All rights reserved. No part of this publication may be reproduced, stored in a retrieval system, or transmitted, in
any form or by any means, electronic, mechanical, photocopying, recording or otherwise, without the prior
permission of the authors. Printing the electronic version for personal use is allowed.
Please cite this publication as follows:
Mekonnen, M.M. and Hoekstra, A.Y. (2010) The green, blue and grey water footprint of farm animals and
animal products, Value of Water Research Report Series No. 48, UNESCO-IHE, Delft, the Netherlands.

Contents
Summary .................................................................................................................................................................. 5
1. Introduction ........................................................................................................................................................ 7
2. Method and data ................................................................................................................................................. 9
2.1 Method ....................................................................................................................................................... 9
2.2 Data .......................................................................................................................................................... 14
3. Results .............................................................................................................................................................. 19
3.1 Quantity and composition of animal feed ................................................................................................ 19
3.2 The water footprint of animal feed ........................................................................................................... 21
3.3 The water footprint of live animals at the end of their lifetime and animal products per ton .................. 21
3.4 Water footprint of animal versus crop products per unit of nutritional value .......................................... 28
3.5 The total water footprint of animal production ........................................................................................ 29
4. Discussion ........................................................................................................................................................ 35
5. Conclusion ........................................................................................................................................................ 39
References .............................................................................................................................................................. 41

Summary
The projected increase in the production and consumption of animal products is likely to put further pressure on
the globe’s freshwater resources. The size and characteristics of the water footprint vary across animal types and
production systems. The current study provides a comprehensive account of the global green, blue and grey
water footprints of different sorts of farm animals and animal products, distinguishing between different
production systems and considering the conditions in all countries of the world separately. The following animal
categories were considered: beef cattle, dairy cattle, pig, sheep, goat, broiler chicken, layer chicken and horses.
The study shows that the water footprint of meat from beef cattle (15400 m3/ton as a global average) is much
larger than the footprints of meat from sheep (10400 m3/ton), pig (6000 m3/ton), goat (5500 m3/ton) or chicken
(4300 m3/ton). The global average water footprint of chicken egg is 3300 m3/ton, while the water footprint of
cow milk amounts to 1000 m3/ton. Per ton of product, animal products generally have a larger water footprint
than crop products. The same is true when we look at the water footprint per calorie. The average water footprint
per calorie for beef is twenty times larger than for cereals and starchy roots. When we look at the water
requirements for protein, we find that the water footprint per gram of protein for milk, eggs and chicken meat is
about 1.5 times larger than for pulses. For beef, the water footprint per gram of protein is 6 times larger than for
pulses. In the case of fat, we find that butter has a relatively small water footprint per gram of fat, even lower
than for oil crops. All other animal products, however, have larger water footprints per gram of fat when
compared to oil crops. The study shows that from a freshwater resource perspective, it is more efficient to obtain
calories, protein and fat through crop products than animal products.
Global animal production requires about 2422 Gm3 of water per year (87.2% green, 6.2% blue, 6.6% grey
water). One third of this volume is for the beef cattle sector; another 19% for the dairy cattle sector. Most of the
total volume of water (98%) refers to the water footprint of the feed for the animals. Drinking water for the
animals, service water and feed mixing water account only for 1.1%, 0.8% and 0.03%, respectively.
The water footprints of animal products can be understood from three main factors: feed conversion efficiency of
the animal, feed composition, and origin of the feed. The type of production system (grazing, mixed, industrial)
is important because it influences all three factors. A first explanatory factor in the water footprints of animal
products is the feed conversion efficiency. The more feed is required per unit of animal product, the more water
is necessary (to produce the feed). The unfavourable feed conversion efficiency for beef cattle is largely
responsible for the relatively large water footprint of beef. Sheep and goats have an unfavourable feed
conversion efficiency as well, although better than cattle. A second factor is the feed composition, in particular
the ratio of concentrates versus roughages and the percentage of valuable crop components versus crop residues
in the concentrate. Chicken and pig have relatively large fractions of cereals and oil meal in their feed, which
results in relatively large water footprints of their feed and abolishes the effect of the favourable feed conversion
efficiencies. A third factor that influences the water footprint of an animal product is the origin of the feed. The
water footprint of a specific animal product varies across countries due to differences in climate and agricultural
practice in the regions from where the various feed components are obtained. Since sometimes a relatively large

6 / The water footprint of farm animals and animal products
fraction of the feed is imported while at other times feed is mostly obtained locally, not only the size but also the
spatial dimension of the water footprint depends on the sourcing of the feed.
It is relevant to consider from which type of production system an animal product is obtained: from a grazing,
mixed or industrial system. Animal products from industrial production systems generally have a smaller total
water footprint per unit of product than products from grazing systems, with an exception for dairy products
(where there is little difference). However, products from industrial systems always have a larger blue and grey
water footprint per ton of product when compared to grazing systems, this time with an exception for chicken
products. It is the lower green water footprint in industrial systems that explains the smaller total footprint. Given
the fact that freshwater problems generally relate to blue water scarcity and water pollution and to a lesser extent
to competition over green water, this means that grazing systems are preferable over industrial production
systems from a water resources point of view. In the case of cattle, pigs, sheep and goats, the total water
footprints per ton of product are larger for grazing systems because of the worse feed conversion efficiencies, but
the fact that these systems depend more strongly on roughages (which are less irrigated and less fertilised than
the feed crops contained in concentrate feed) makes that the blue and grey water footprints of products from
grazing systems are smaller. This compensation through the feed composition does not occur for the case of
chicken. The reason is that chicken strongly rely on concentrate feed in all production systems. Mixed production
systems generally take a position in between industrial and grazing systems. Not accounted for in this study is
that industrialized animal production often produces large amounts of animal waste that cannot be fully recycled
in the nearby land. Such large amounts of waste produced in a concentrated place are known to pollute
freshwater resources if not handled properly.
By focusing on freshwater appropriation, the study obviously excludes many other relevant issues in farm animal
production, such as micro- and macro-cost of production, livelihood of smallholder farmers, animal welfare,
public health and environmental issues other than freshwater.
1. Introduction
In the last few decades the world has seen a significant shift in food consumption patterns towards more animal
products such as meat, milk and egg, mainly due to growing economies and rising individual incomes. In
developing countries, in particular, consumption of meat, milk and dairy products has been growing the last few
decades at 5-6 percent and 3.4-3.8 percent annually respectively (Bruinsma, 2003). The shift in consumption
patterns coupled with high population growth and rapid urbanization in most developing countries is driving the
total demand for animal products upward.
The global meat production has nearly doubled between 1980 and 2004, with the largest share of growth in
developing countries (FAO, 2005). Related to the increased production there is a shift away from grazing
systems. Although the traditional pastoral system plays a role, most of the increase in meat and milk production
in the last three decades was achieved through production increase in the mixed and industrial production
systems (Bouwman et al., 2005). The shift to more intensive production systems influences the composition of
animal feed. Traditionally, animals have relied on locally available feed, such as grass, crop residues and wastes
from human food. The more intensive production systems depend on concentrate feeds that are traded locally
and internationally. In many countries, there is a tendency towards decreasing reliance on grazing and increasing
dependence on concentrate feeds. Intensive animal production systems, in which animals are raised in
confinement, currently account for 74 percent of the world’s total poultry production, 40 percent of pig meat and
more than two-thirds of egg production (Seré and Steinfeld, 1996). If this trend continues in the future, its
implication will be far-reaching for both land and water resources requirements.
Animal production requires large volumes of water for feed production, drinking water and servicing animals.
By far the largest water demand in animal production is the water needed to produce animal feed. Because of
the increasing demand for animal products and the growing sector of industrial farming, the demand for
feedstuffs grows as well, including cereals, starchy roots, fodder crops, oilseeds and oil meals. Such high
demand for feed in turn causes a rising demand for water. Besides, intensification of animal production systems
will lead to surface and ground water pollution, both from the use of fertilizers in feed crops production and
improper storage and application of manures.
The global meat trade is projected to rise by more than 50 percent over the next 25 years (Bruinsma, 2003). Also
international trade in feed is growing. As a result of the increasing global trade in feed crops and animal
products and the growth of meat preservation over longer periods, many consumers have no longer any idea
about the natural resource use and environmental impacts associated with the products they consume.
Consumers of animal products are spatially disconnected from the processes necessary to produce the products
(Naylor et al., 2005; Hoekstra, 2010). The concept of ‘water footprint’ provides an appropriate framework of
analysis to find the link between the consumption of animal products and the use of the global water resources.
The water footprint is defined as the total volume of freshwater that is used to produce the goods and services
consumed by an individual or community (Hoekstra and Chapagain, 2008).

8 / The water footprint of farm animals and animal products
There are a few earlier publications on water use in animal production. The first and most comprehensive
assessment of the water footprint of farm animals and animal products was carried out by Chapagain and
Hoekstra (2003) and later updated by the same authors in their water footprint of nation’s publication
(Chapagain and Hoekstra, 2004). A study by FAO has quantified the global blue water use for feed production,
animal drinking and servicing (Steinfeld et al., 2006). De Fraiture et al. (2007) have estimated the global water
use for animal feed production, both green and blue but not distinguishing between the two. They considered
water use for two lumped categories: feed crops and grazing. Zimmer and Renault (2003) made a rough
estimation of the global water consumption for producing meat and other animal products, not showing details
per country, animal category or product. Galloway et al. (2007) produced a study on the water consumption for
chicken and pig for four countries: the USA, Japan, Brazil and the Netherlands. Peden et al. (2007) made an
estimate of the global water consumption for producing the feed for farm animals. In addition to the studies
mentioned there have been a few more specific studies for the Nile River Basin (Van Breugel et al., 2010) and
for the USA (Renault and Wallender, 2000; Pimentel et al., 2004).
With the exception of Chapagain and Hoekstra (2003, 2004), none of the studies have estimated the water
footprint of animal products by product and country at a global level. Although Chapagain and Hoekstra (2003,
2004) were able to estimate the water footprint of farm animals and animal products per country, they have
taken a very crude assumption on the composition and amount of feed consumed by the different animals.
Besides, the water footprints of feed crops were estimated based on national average climatic data. We have
tried to improve the estimation of feed composition and feed amount per animal category and have used better
estimates for the water footprints of feed crops.
The objective of the study is to assess the water footprint of farm animals and the various derived animal
products for the period 1996-2005. We consider eight animal categories: beef and dairy cattle, pig, sheep, goat,
broiler and layer chicken and horses. The main differences with Chapagain and Hoekstra (2003, 2004) are:
We have estimated the amount of feed consumed per animal category, per production system and per
country based on estimates of feed conversion efficiencies and statistics on the annual production of animal
products. Chapagain and Hoekstra (2003, 2004) have taken rough assumptions on the quantities of feed
consumed per animal category based on incidental data.
We reckon with the relative occurrence of the three production systems (grazing, mixed and industrial) in
each country, using the studies of Seré and Steinfeld (1996) and Wint and Robinson (2007). In Chapagain
and Hoekstra (2003, 2004), for each country the dominant animal production system was selected, after
which further calculations for this country were based on data for that specific production system.
We have estimated the green, blue and grey water footprints of the feed crops using a spatially explicit crop
water use model able to estimate actual crop water use (Mekonnen and Hoekstra, 2010a, 2010b). In the
previous studies the potential rather than the actual crop water use was used. In addition, the estimate was
based on country average climatic data which could lead to errors in large countries. Furthermore the earlier
studies did not explicitly distinguish between the green and blue water footprint components and did not
include the grey water footprint component at all.

2. Method and data
2.1 Method
We follow the water footprint definitions and methodology as set out in Hoekstra et al. (2009). The blue water
footprint refers to consumption of blue water resources (surface and groundwater) along the supply chain of a
product. ‘Consumption’ refers to loss of water from the available ground-surface water body in a catchment area.
Losses occur when water evaporates, returns to another catchment area or the sea or is incorporated into a
product. The green water footprint refers to consumption of green water resources (rainwater in so far as it does
not become run-off). The grey water footprint refers to pollution and is defined as the volume of freshwater that
is required to assimilate the load of pollutants given natural background concentrations and existing ambient
water quality standards.
We consider eight farm animal categories: beef and dairy cattle, pig, sheep, goat, broiler and layer chicken and
horses. When estimating total feed amounts and total water footprints per category, we include ‘buffaloes’ in the
category of ‘beef cattle’ and ‘asses and mules’ in the category of ‘horses’.
The water footprint of a live animal consists of different components: the indirect water footprint of the feed and
the direct water footprint related to the drinking water and service water consumed (Chapagain and Hoekstra,
2003, 2004). The water footprint of an animal is expressed as:
],,[],,[],,[],,[ scaWFscaWFscaWFscaWF servdrinkfeed (1)
where WFfeed[a,c,s], WFdrink[a,c,s] and WFserv[a,c,s] represent the water footprint of an animal for animal
category a in country c in production systems s related to feed, drinking water and service water consumption,
respectively. Service water refers to the water used to clean the farmyard, wash the animal and carry out other
services necessary to maintain the environment. The water footprint of an animal and its three components can
be expressed in terms of m3/yr/animal, or, when summed over the lifetime of the animal, in terms of m3/animal.
For beef cattle, pig, sheep, goat and broiler chicken – animals that provide their products after they have been
slaughtered – it is most useful to look at the water footprint of the animal at the end of its lifetime, because it is
this total that will be allocated to the various products (e.g. meat, leather). For dairy cattle and layer chicken, it is
most straightforward to look at the water footprint of the animal per year (averaged over its lifetime), because
one can easily relate this annual animal water footprint to its average annual production (milk, eggs).
The water footprint of an animal related to the feed consumed consists of two parts: the water footprint of the
various feed ingredients and the water that is used to mix the feed:
],,[
],,[][],,,[
],,[ 1
scaPop
scaWFpWFpscaFeed
scaWF
n
pmixingprod
feed
(2)

10 / The water footprint of farm animals and animal products
Feed[a,c,s,p] represents the annual amount of feed ingredient p consumed by animal category a in country c and
production system s (ton/yr), ]p[WFprod the water footprint of feed ingredient p (m3/ton), WFmixing[a,c,s] the
volume of water consumed for mixing the feed for animal category a in country c and production system s
(m3/yr/animal) and Pop*[a,c,s] the number of slaughtered animals per year or the number of milk or egg
producing animals in a year for animal category a in country c and production system s.
The water footprint of feed ingredients
The water footprints of the different crops, roughages and crop by-products ( ][ pWFprod , m3/ton) that are eaten
by the various farm animals have been calculated following the methodology developed by Hoekstra and
Chapagain (2008) and Hoekstra et al. (2009). The water footprints of feed crops were estimated using a crop
water use model that estimates crop water footprints at a 5 by 5 arc minute spatial resolution globally (Mekonnen
and Hoekstra, 2010a, 2010b). Grey water footprints were estimated by looking at leaching and runoff of nitrogen
fertilisers only, following Mekonnen and Hoekstra (2010a,b). Since animal feed in a country originates from
domestic production and imported products, for the calculation of the water footprint of animal feed in a country,
we have taken a weighted average water footprint according to the relative volumes of domestic production and
import:
e
e
nei
neprodeiprod
prod,pnTpP
,pnWF,pnTpWFpP
pWF][][
][][][][
][ (3)
in which P[p] is the production quantity of feed product p in a country (ton/yr), Ti[ne,p] the imported quantity of
feed product p from exporting nation ne (ton/yr), WFprod[p] the water footprint of feed product p when produced
in the nation considered (m3/ton) and WFprod[ne,p] the water footprint of feed product p as in the exporting nation
ne (m3/ton). The water footprint of crop residues such as bran, straw, chaff and leaves and tops from sugar beet
have already been accounted for in the main product, therefore their water footprint was set equal to zero.
Volume and composition of feed
The volume and composition of the feed consumed vary depending on the type of animal, the production system
and the country. The amount of feed consumed is estimated following the approach of Hendy et al. (1995), in
which the total annual feed consumption (including both concentrates and roughages) is calculated based on
annual production of animal products and feed conversion efficiencies. Only for horses we have used the
approach as in Chapagain and Hoekstra (2003), which means that we multiplied the estimated feed consumption
per animal by the number of animals, thus arriving at an estimate of the total feed consumed by horses.
The steps followed to calculate the volumes and composition of feed are schematically shown in Figure 1. The
total feed per production system for both ruminants and non-ruminants animals is calculated as follows:
],,[],,[],,[ scaPscaFCEscaFeed (4)
The water footprint of farm animals and animal products / 11
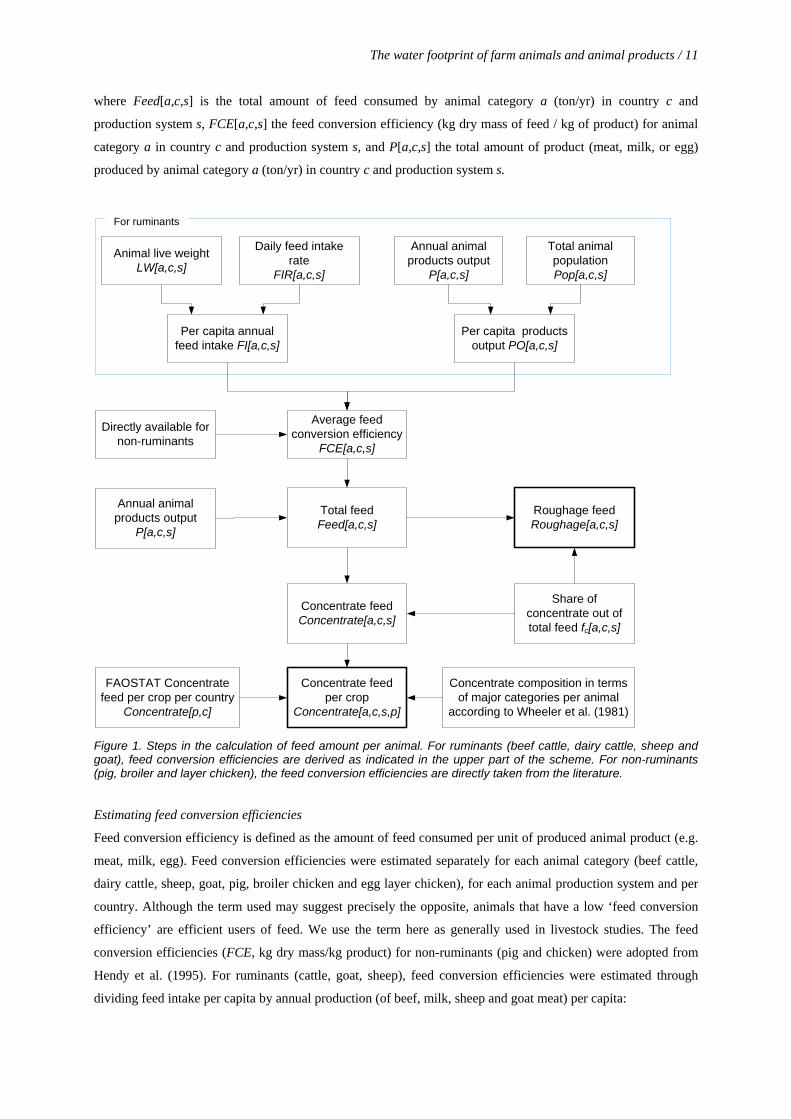
where Feed[a,c,s] is the total amount of feed consumed by animal category a (ton/yr) in country c and
production system s, FCE[a,c,s] the feed conversion efficiency (kg dry mass of feed / kg of product) for animal
category a in country c and production system s, and P[a,c,s] the total amount of product (meat, milk, or egg)
produced by animal category a (ton/yr) in country c and production system s.
Daily feed intake rate
FIR[a,c,s]
Animal live weight LW[a,c,s]
Per capita annual feed intake FI[a,c,s]
Per capita products output PO[a,c,s]
Average feed conversion efficiency
FCE[a,c,s]
Annual animal products output
P[a,c,s]
Total feed Feed[a,c,s]
Share of concentrate out of total feed fc[a,c,s]
Concentrate feed Concentrate[a,c,s]
Roughage feed Roughage[a,c,s]
FAOSTAT Concentrate feed per crop per country
Concentrate[p,c]
Concentrate composition in terms of major categories per animal
according to Wheeler et al. (1981)
Concentrate feed per crop
Concentrate[a,c,s,p]
Directly available for non-ruminants
For ruminants
Annual animal products output
P[a,c,s]
Total animal population Pop[a,c,s]
Figure 1. Steps in the calculation of feed amount per animal. For ruminants (beef cattle, dairy cattle, sheep and goat), feed conversion efficiencies are derived as indicated in the upper part of the scheme. For non-ruminants (pig, broiler and layer chicken), the feed conversion efficiencies are directly taken from the literature.
Estimating feed conversion efficiencies
Feed conversion efficiency is defined as the amount of feed consumed per unit of produced animal product (e.g.
meat, milk, egg). Feed conversion efficiencies were estimated separately for each animal category (beef cattle,
dairy cattle, sheep, goat, pig, broiler chicken and egg layer chicken), for each animal production system and per
country. Although the term used may suggest precisely the opposite, animals that have a low ‘feed conversion
efficiency’ are efficient users of feed. We use the term here as generally used in livestock studies. The feed
conversion efficiencies (FCE, kg dry mass/kg product) for non-ruminants (pig and chicken) were adopted from
Hendy et al. (1995). For ruminants (cattle, goat, sheep), feed conversion efficiencies were estimated through
dividing feed intake per capita by annual production (of beef, milk, sheep and goat meat) per capita:
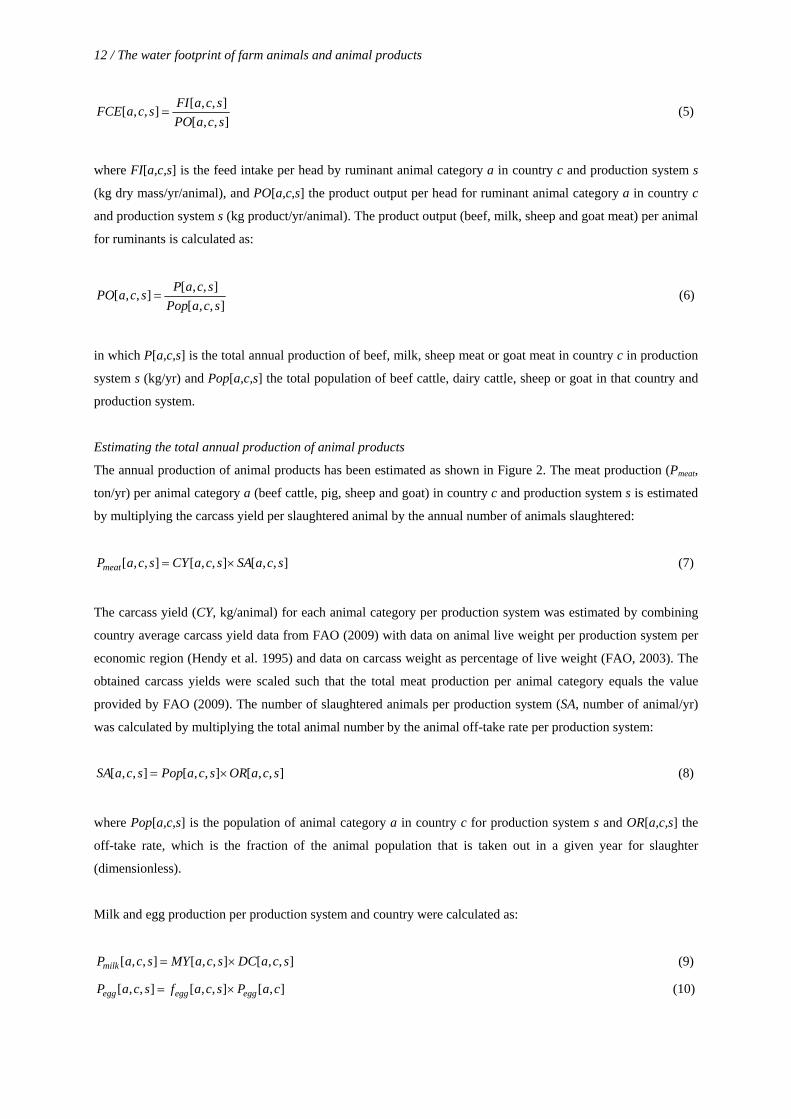
12 / The water footprint of farm animals and animal products
],,[
],,[],,[
scaPO
scaFIscaFCE (5)
where FI[a,c,s] is the feed intake per head by ruminant animal category a in country c and production system s
(kg dry mass/yr/animal), and PO[a,c,s] the product output per head for ruminant animal category a in country c
and production system s (kg product/yr/animal). The product output (beef, milk, sheep and goat meat) per animal
for ruminants is calculated as:
],,[
],,[],,[
scaPop
scaPscaPO (6)
in which P[a,c,s] is the total annual production of beef, milk, sheep meat or goat meat in country c in production
system s (kg/yr) and Pop[a,c,s] the total population of beef cattle, dairy cattle, sheep or goat in that country and
production system.
Estimating the total annual production of animal products
The annual production of animal products has been estimated as shown in Figure 2. The meat production (Pmeat,
ton/yr) per animal category a (beef cattle, pig, sheep and goat) in country c and production system s is estimated
by multiplying the carcass yield per slaughtered animal by the annual number of animals slaughtered:
],,[],,[],,[ scaSAscaCYscaPmeat (7)
The carcass yield (CY, kg/animal) for each animal category per production system was estimated by combining
country average carcass yield data from FAO (2009) with data on animal live weight per production system per
economic region (Hendy et al. 1995) and data on carcass weight as percentage of live weight (FAO, 2003). The
obtained carcass yields were scaled such that the total meat production per animal category equals the value
provided by FAO (2009). The number of slaughtered animals per production system (SA, number of animal/yr)
was calculated by multiplying the total animal number by the animal off-take rate per production system:
],,[],,[],,[ scaORscaPopscaSA (8)
where Pop[a,c,s] is the population of animal category a in country c for production system s and OR[a,c,s] the
off-take rate, which is the fraction of the animal population that is taken out in a given year for slaughter
(dimensionless).
Milk and egg production per production system and country were calculated as:
],,[],,[],,[ scaDCscaMYscaPmilk (9)
],[],,[],,[ caPscafscaP eggeggegg (10)

The water footprint of farm animals and animal products / 13
where Pmilk[a,c,s] and Pegg[a,c,s] represent production of milk and egg in country c and production system s
respectively (ton/yr), MY[a,c,s] milk yield per dairy cow in country c and production system s (ton/dairy cow),
DC[a,c,s] the number of dairy cows in country c and production system s, fegg[a,c,s] the fraction of egg produced
in country c and production system s and Pegg[a,c] the total amount of egg produced in country c (ton/yr).
Fraction of animal per country per production
system fa[a,c,s]
Animal per country Pop[a,c]
Animal per country per production system
Pop[a,c,s]
Animal off-take rate per country
OR[a,c]
Animal off-take rate per country per production
system OR[a,c,s]
Number of slaughtered animal per country SA[a,c]
Number of slaughtered animals per country per
production systemSA[a,c,s]
Carcass yield per country CY[a,c]
Carcass yield per country per production
system CY[a,c,s]
National average meat production per country
Pmeat[a,c]
Meat production per production system per
country Pmeat[a,c,s]
Egg production per country per
system Pegg[a,c,s]
Fraction of egg produced per
system fegg[a,s]
Egg production per country
Pegg[a,c]
(b) Milk production and yield per country per production system (c) Egg production per country and per production system
Animal live weight per country per production
system LW[a,c,s]
Carcass weight as percent of live weight per
country fcw[a,c]
(a) Meat production per production system and per country
Milk yield per production
system MY[a,s]
Milk yield per country per
production system MY[a,c,s]
Milk production per country per
production system Pmilk[a,c,s]
Fraction of milk produced per
production system fmilk[a,s]
Dairy cow number per country Popdiary[a,c]
Dairy cow number per country per
system Popdiary[a,c,s]
Milk production per country
Pmilk[a,c]
Milk yield per country MY[a,c]
Figure 2. Steps in the calculation of: (a) annual meat production (beef cattle, pig, sheep, goat, broiler chicken); (b) annual milk production (dairy cattle); and (c) annual egg production (layer chicken). Broken arrows indicate iteration and adjustment to fit to values of FAO (2009).
Estimating the feed composition
Animal feeds are generally divided into ‘concentrates’ and ‘roughages’ (Box 2.1). The volume of concentrate
feed has been estimated per animal category and per production system as:
],,[],,[],,[ scafscaFeedscaeConcentrat c (11)
where Concentrate[a,c,s] is the volume of concentrate feed consumed by animal category a in country c and
production system s (ton/yr) and fc[a,c,s] the fraction of concentrate in the total feed for animal category a in
country c and production system s. For the latter variable, data have been obtained from Hendy et al. (1995) and
Bouwman et al. (2005).
14 / The water footprint of farm animals and animal products
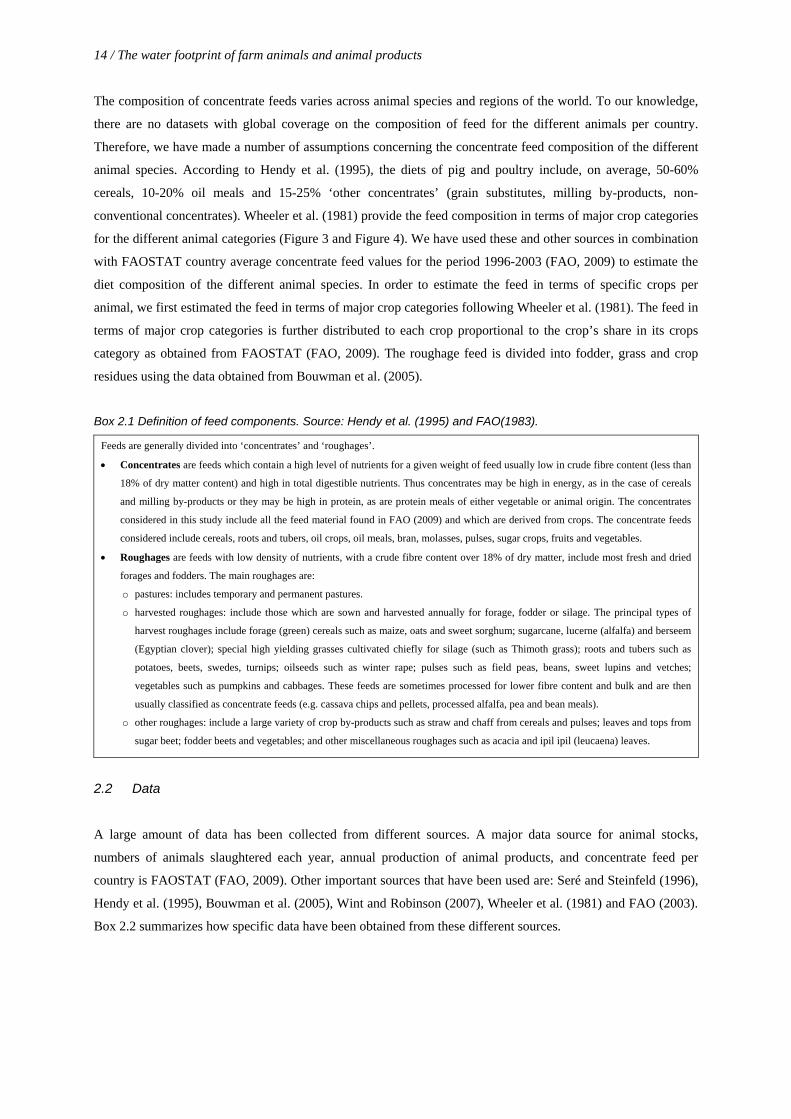
The composition of concentrate feeds varies across animal species and regions of the world. To our knowledge,
there are no datasets with global coverage on the composition of feed for the different animals per country.
Therefore, we have made a number of assumptions concerning the concentrate feed composition of the different
animal species. According to Hendy et al. (1995), the diets of pig and poultry include, on average, 50-60%
cereals, 10-20% oil meals and 15-25% ‘other concentrates’ (grain substitutes, milling by-products, non-
conventional concentrates). Wheeler et al. (1981) provide the feed composition in terms of major crop categories
for the different animal categories (Figure 3 and Figure 4). We have used these and other sources in combination
with FAOSTAT country average concentrate feed values for the period 1996-2003 (FAO, 2009) to estimate the
diet composition of the different animal species. In order to estimate the feed in terms of specific crops per
animal, we first estimated the feed in terms of major crop categories following Wheeler et al. (1981). The feed in
terms of major crop categories is further distributed to each crop proportional to the crop’s share in its crops
category as obtained from FAOSTAT (FAO, 2009). The roughage feed is divided into fodder, grass and crop
residues using the data obtained from Bouwman et al. (2005).
Box 2.1 Definition of feed components. Source: Hendy et al. (1995) and FAO(1983).
Feeds are generally divided into ‘concentrates’ and ‘roughages’.
Concentrates are feeds which contain a high level of nutrients for a given weight of feed usually low in crude fibre content (less than
18% of dry matter content) and high in total digestible nutrients. Thus concentrates may be high in energy, as in the case of cereals
and milling by-products or they may be high in protein, as are protein meals of either vegetable or animal origin. The concentrates
considered in this study include all the feed material found in FAO (2009) and which are derived from crops. The concentrate feeds
considered include cereals, roots and tubers, oil crops, oil meals, bran, molasses, pulses, sugar crops, fruits and vegetables.
Roughages are feeds with low density of nutrients, with a crude fibre content over 18% of dry matter, include most fresh and dried
forages and fodders. The main roughages are:
o pastures: includes temporary and permanent pastures.
o harvested roughages: include those which are sown and harvested annually for forage, fodder or silage. The principal types of
harvest roughages include forage (green) cereals such as maize, oats and sweet sorghum; sugarcane, lucerne (alfalfa) and berseem
(Egyptian clover); special high yielding grasses cultivated chiefly for silage (such as Thimoth grass); roots and tubers such as
potatoes, beets, swedes, turnips; oilseeds such as winter rape; pulses such as field peas, beans, sweet lupins and vetches;
vegetables such as pumpkins and cabbages. These feeds are sometimes processed for lower fibre content and bulk and are then
usually classified as concentrate feeds (e.g. cassava chips and pellets, processed alfalfa, pea and bean meals).
o other roughages: include a large variety of crop by-products such as straw and chaff from cereals and pulses; leaves and tops from
sugar beet; fodder beets and vegetables; and other miscellaneous roughages such as acacia and ipil ipil (leucaena) leaves.
2.2 Data
A large amount of data has been collected from different sources. A major data source for animal stocks,
numbers of animals slaughtered each year, annual production of animal products, and concentrate feed per
country is FAOSTAT (FAO, 2009). Other important sources that have been used are: Seré and Steinfeld (1996),
Hendy et al. (1995), Bouwman et al. (2005), Wint and Robinson (2007), Wheeler et al. (1981) and FAO (2003).
Box 2.2 summarizes how specific data have been obtained from these different sources.

The water footprint of farm animals and animal products / 15
Box 2.2. Overview of data sources.
Animal production systems: Seré and Steinfeld (1996) have developed a classification of animal production systems based on agro-
ecology, the distinction between pastoral, mixed and landless systems and on the presence of irrigation or not. They distinguish
eleven animal production systems grouped under three headings: grazing (extensive), mixed and industrial (intensive). In this study
we use the schematization into these three production systems.
Feed conversion efficiencies: For ruminants, the feed conversion efficiencies were estimated as explained in Section 2.1. For non-
ruminants (pig, broiler and egg laying chicken), feed conversion efficiencies per animal category, per production system and per
economic region were obtained from Hendy et al. (1995). For both ruminants and non-ruminants, the feed conversion efficiency data
were scaled such that at the level of world regions they match the efficiencies as reported in Bouwman et al. (2005).
Annual production of animal products: Data on the annual production of animal products (beef, pig meat, sheep meat, goat meat,
chicken meat, milk and egg) per production system for different economic regions were obtained from Seré and Steinfeld (1996).
Production data per product and country for the period 1996-2005 were obtained from FAOSTAT (FAO, 2009). The two data
sources have been combined to derive production data per animal category, production system and per country for the period 1996-
2005. We scaled the production data per production system such that at national level, the production aggregated over the different
production systems equals the production as reported in FAO (2009) for the period 1996-2005.
Number of animals: Seré and Steinfeld (1996) provide the total animal population for the different production systems for the year
1995 for a number of geographic regions in the world. Wint and Robinson (2007) provide the total animal population for the year
2005 for the different production systems for developing countries. We have combined the two sources to obtain number of animals
per animal category, per production system and per country. We scaled the numbers such that at national level, the number of animals
aggregated over the different production systems equal the numbers as reported in FAO (2009) for the period 1996-2005.
Number of slaughtered animals and animal off-take rates: The annual number of slaughtered animals for beef cattle, pig, sheep,
goat and broiler chicken per country have been taken from FAO (2009). The animal off-take rates at national level have been derived
from the same source by dividing the annual number of slaughtered animals by the total population. The off-take rate for the grazing
system was assumed to be 90% of the national average off-take rate for the animal category considered (Bouwman, et al., 2005). Per
country, the off-take rate for the mixed and industrial production systems were scaled until the total number of slaughtered animals
per animal category equalled the value provided by FAO (2009).
Animal live weight: Hendy et al. (1995) provide live weight of ruminant animals (beef cattle, dairy cattle, sheep and goat) by
production system and economic region. FAO (2003) give animal live weight for cattle, pig, sheep, goat and chicken. We combined
these two sources, taking advantage of the fact that Hendy et al. (1995) specify data per production system (but not per country) and
FAO (2003) provides data per country (but not per system).
Carcass weight as percentage of live weight: FAO (2003) provides carcass weight as percentage of live weight for the different
animal categories per country.
Ruminant animals daily feed intake rate: Daily feed intake rate for ruminant animals (beef cattle, dairy cattle, sheep and goat) was
obtained from Hendy et al. (1995).
Share of concentrate feed in total animal feed: The contribution of concentrate feeds such as cereals, oil-meals, roots and other
crop products in the total feed composition was obtained from Hendy et al. (1995) and Bouwman et al. (2005).
Composition of the concentrate feed: The composition of concentrate feed per animal category was estimated following mainly
Wheeler et al. (1981) (Figure 3-4). In addition, we used Steinfeld et al. (2006) for data on the relative composition of poultry and pig
feed for major countries (Figure 5-6). The data available in Wheeler et al. (1981) and Steinfeld et al. (2006) are not sufficient to
specify the feed composition at the level of specific crops or crop products. In order to come to that level of detail we use the Supply
and Utilization Accounts of FAOSTAT (FAO, 2009), which provide the total concentrate feed utilization per country per crop and
crop product.
Composition of the roughage feed: We used Bouwman et al. (2005) to estimate the composition of the roughage feed (grass, fodder
crops, crop residues).
Water use for drinking and animal servicing: Data were obtained from Chapagain and Hoekstra (2003). See Appendix IV.
Water use for mixing feed: Following Chapagain and Hoekstra (2003), the water use for feed mixing is assumed to be 50% of total
concentrate feed intake (or 0.5 litre per kg of concentrate feed intake).

16 / The water footprint of farm animals and animal products
0
20
40
60
80
Cereals Oilmeals Other concentrates Roughages Total feed
Ave
rag
e fe
ed
util
iza
tion
(%)
Cattle and buffaloes Sheep and goats Pigs Poultry Other
Figure 3. World average utilization of feeds by different animal species in metabolisable energy equivalents Source: Wheeler et al. (1981).
0
20
40
60
80
100
Cattle and buffaloes
Sheep and goats Pigs Poultry Others
Co
mp
osi
tion
of d
iet (
%)
Cereals Oilmeals Other concentrates Roughages
Figure 4. Aggregate world composition of diets for different species of animal in metabolisable energy equivalents Source: Wheeler et al. (1981).

The water footprint of farm animals and animal products / 17
0
10
20
30
40
50
60
70
80
90
100F
eed
co
mp
osi
tion
(%)
Barley Maize Sorghum Wheat Peas Soybean Cake Other oilmeals Fish meal Others
Figure 5. Relative composition of poultry feed basket in selected countries (by weight). Source: Steinfeld et al. (2006).
0
10
20
30
40
50
60
70
80
90
100
Fee
d c
om
po
sitio
n (%
)
Barley Maize Rice Rye Sorghum Wheat Peas Soybean Cake Rapeseed Cake Fish meal Others
Figure 6. Relative composition of pig feed basket in selected countries (by weight). Source: Steinfeld et al. (2006).


3. Results
3.1 Quantity and composition of animal feed
Table 1 provides global average feed conversion efficiencies for different animal categories and production
systems. Region-specific feed conversion efficiencies are presented in Appendix I. Ruminants (cattle, sheep,
goat) are less efficient in converting feed into meat than non-ruminants (pig, chicken), amongst other due to the
lower quality of feed they consume. Particularly meat production from cattle costs a lot of feed per unit of
product obtained. Although ruminants need more feed, their feed largely consists of forage and other materials
that humans cannot eat, while non-ruminants consume large amounts of concentrate feed that could be used for
human consumption. Non-ruminants thus most obviously compete with humans for food, but in an indirect way
ruminants also compete for food with humans. In some cases the roughages eaten by ruminants are produced
with land and water resources that cannot alternatively be allocated to crop production for human consumption
(e.g. in the case of grazing in dry or wetlands), but often the land and water resources used for roughages supply
can alternatively be used for crop growth for human consumption, so that ruminants compete with humans for
food also through consumption of roughages.
Table 1. Global average feed conversion efficiency per animal category and production system.
Animal category Feed conversion efficiency (kg dry mass feed/kg output)
Grazing Mixed Industrial Overall
Beef cattle 70.1 51.8 19.2 46.9
Dairy cattle 3.5 1.6 1.1 1.9
Broiler chicken 9.0 4.9 2.8 4.2
Layer chicken 9.3 4.4 2.3 3.1
Pig 11.3 6.5 3.9 5.8
Sheep and goat 49.6 25.8 13.3 30.2
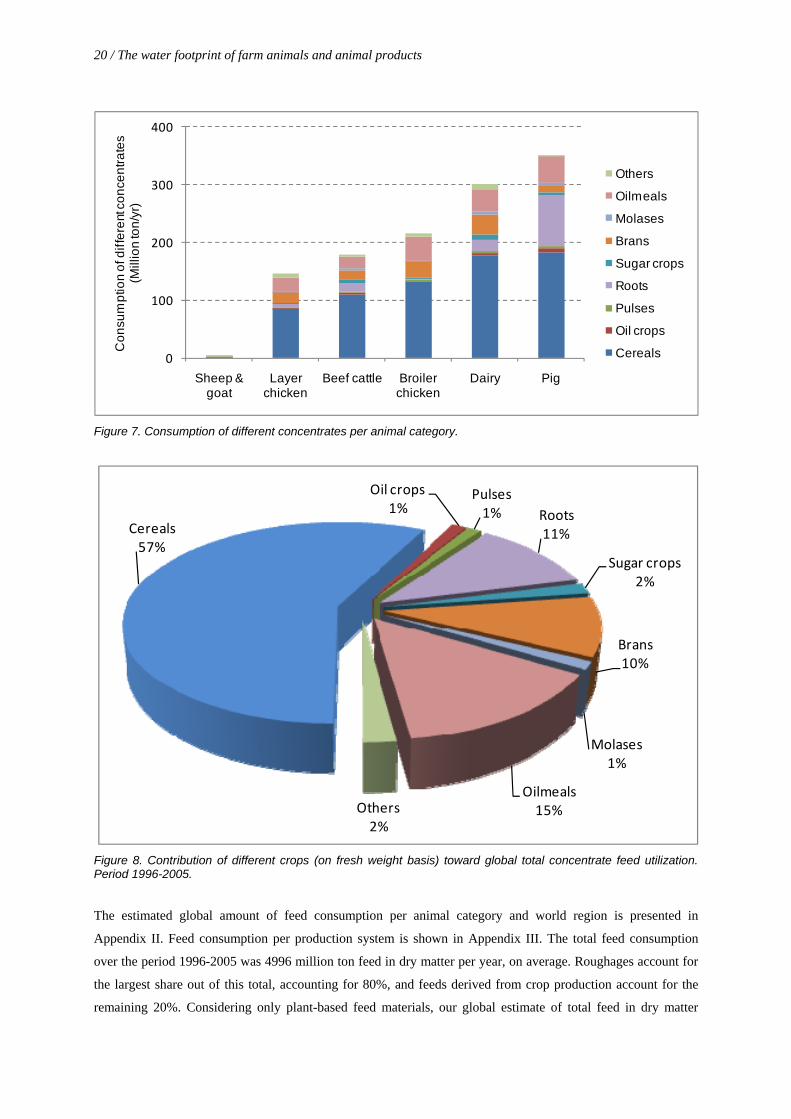
Non-ruminants are responsible for 60% of the global consumption of concentrate feeds; ruminants account for
40%. Figure 7 shows the consumption of different concentrates by different animal categories. Chickens take the
largest share in total concentrate feed consumption (30%). Three fifth of the concentrate feed consumption by
chicken in the world is for broiler chicken and two fifth for layer chicken. Pig meat production takes nearly the
same share (29%) in global concentrate feed consumption, while dairy cattle are responsible for 25% and beef
cattle 14%. Our estimated shares of different animal categories in the total concentrate feed consumption is very
close to the estimates made by Hendy et al. (1995).
Annual concentrate feed consumption averaged over the period 1996-2005 expressed in commodity fresh weight
amounted to 1195 million tons per year. This value is very close to the feed data provided by FAO (2009) for the
period 1996-2003 (1229 million ton/yr). The feed data analysed and presented here focus on commodities
derived from crop production. Figure 8 presents a summary of the global total feed utilization of cereals, oil
meals and cakes, roots and tubers, bran and others. Cereals make up the largest percentage of the total
concentrate feed use (57%), followed by oil meals (15%), roots (11%) and brans (10%).
20 / The water footprint of farm animals and animal products
0
100
200
300
400
Sheep & goat
Layer chicken
Beef cattle Broiler chicken
Dairy Pig
Co
nsu
mp
tion
of d
iffe
rent
co
nce
ntr
ate
s (M
illio
n to
n/y
r)
Others
Oilmeals
Molases
Brans
Sugar crops
Roots
Pulses
Oil crops
Cereals
Figure 7. Consumption of different concentrates per animal category.
Cereals57%
Oil crops1%
Pulses1% Roots
11%
Sugar crops2%
Brans10%
Molases1%
Oilmeals15%Others
2%
Figure 8. Contribution of different crops (on fresh weight basis) toward global total concentrate feed utilization. Period 1996-2005.
The estimated global amount of feed consumption per animal category and world region is presented in
Appendix II. Feed consumption per production system is shown in Appendix III. The total feed consumption
over the period 1996-2005 was 4996 million ton feed in dry matter per year, on average. Roughages account for
the largest share out of this total, accounting for 80%, and feeds derived from crop production account for the
remaining 20%. Considering only plant-based feed materials, our global estimate of total feed in dry matter

The water footprint of farm animals and animal products / 21
(4996 Mton dry mass/yr) is about 6% lower than the estimate of Wirsenius (2000) (5300 Mton dry mass/yr) and
8% more than the estimate of Bouwman et al. (2005) for 1995 (4637 Mton dry mass/yr). Our estimate of global
utilization of roughages (4010 Mton dry mass/yr), which includes pasture, forages, straws, sugar crops tops and
leaves, oil crops stalks and husks is 15% lower than the estimate of Wirsenius (2000) (4740 Mton dry mass/yr)
and 5% larger than the estimate of Bouwman et al. (2005) for 1995 (3832 Mton dry mass/yr).
3.2 The water footprint of animal feed
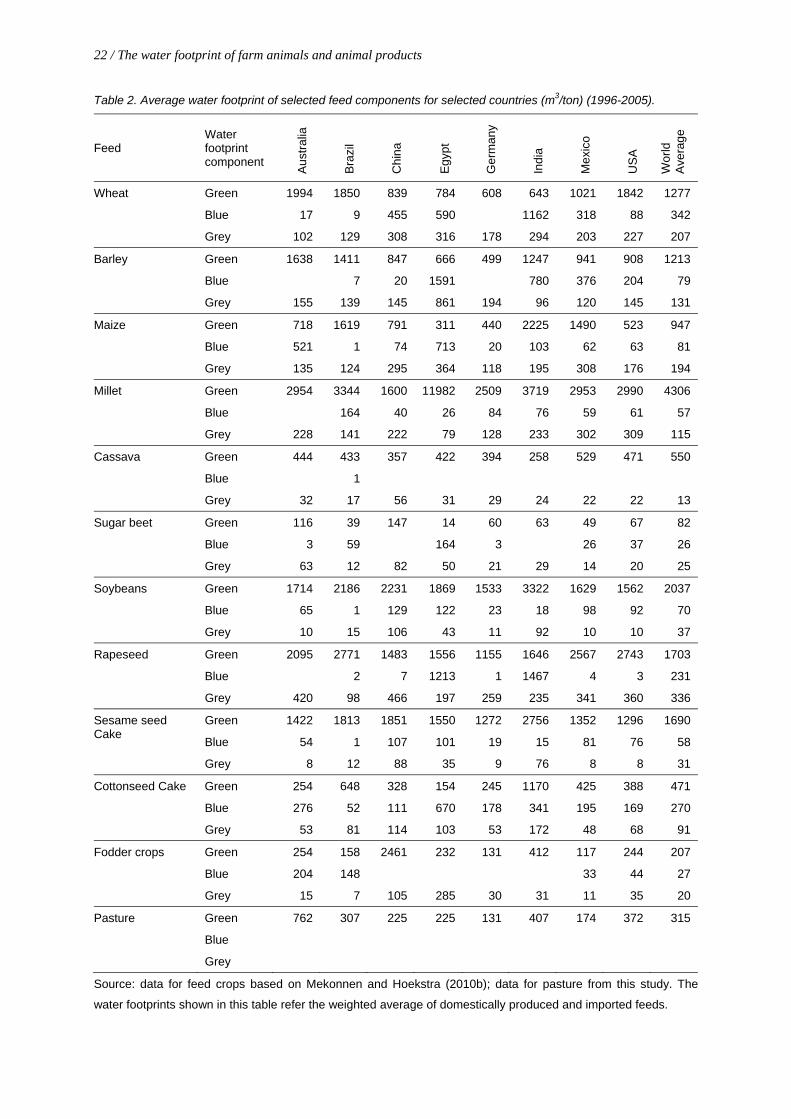
The water footprint per ton of feed differs among crops and across countries. Since the most significant part of
the animal water footprint comes from the feed they consume, the water footprint per unit of feed is an important
factor in the determination of the water footprint of animals and their associated derived products. Table 2 shows
the average water footprint of selected feed ingredients for selected countries. Crop residues and by-products
such as bran, straw, chaff and leaves and tops from sugar beet have a water footprint of about zero, because the
water footprint of crop growing is mainly attributed to the main crop products, not the low-value residues or by-
products. As a result they provide an opportunity to reduce the water footprint of animal production. Huge
reduction in the water footprint of animals can also be obtained by using crops with a relatively low water
footprint per ton such as sugar beet. Therefore, careful selection of feeds that meet the nutrient requirement of the
animals and at the same time have a smaller water footprint per ton could significantly reduce the indirect use of
freshwater resources associated with animal production.
3.3 The water footprint of live animals at the end of their lifetime and animal products per ton
Table 3 shows, for each animal category, the average water footprint of an animal at the end of its life time and
the annual water footprint of an animal. Dairy cows have the largest annual water footprint (2056 m3/yr/animal),
which is more than the average human being. Broiler chicken have the smallest footprint (26 m3/yr/animal).
Table 4 presents the green, blue and grey water footprints of some selected animal products per production
system for selected countries. Appendix V presents the full result of our analysis: green, blue and grey water
footprints of all farm animals and animal products considered, per production system and per country. The water
footprints of animals and animal products vary greatly across countries and production systems. When we look at
global averages, however, we see that the water footprint of meat increases from chicken meat (4300 m3/ton),
goat meat (5500 m3/ton), pig meat (6000 m3/ton), sheep meat (10400 m3/ton) to beef (15400 m3/ton). The
differences can be partly explained from the different feed conversion efficiencies of the animals. Beef
production, for example, requires eight times more feed (in dry matter) per kilogram of meat compared to
producing pig meat, and eleven times if compared to the case of chicken meat. This is not the only factor,
however, that can explain the differences. Another important factor is the feed composition. Particularly the
fraction of concentrate feed in the total feed is important, because concentrate feed generally has a larger water
footprint than roughages. Chicken, which are efficient from a total feed point of view, are no longer that efficient
when we look at the fraction of concentrates in their feed. This fraction is 73% for broiler chicken (global
average), while it is only 5% for beef cattle.
22 / The water footprint of farm animals and animal products
Table 2. Average water footprint of selected feed components for selected countries (m3/ton) (1996-2005).
Feed Water footprint component
Aus
tral
ia
Bra
zil
Chi
na
Egy
pt
Ger
man
y
Indi
a
Mex
ico
US
A
Wor
ld
Ave
rag
e
Wheat Green 1994 1850 839 784 608 643 1021 1842 1277
Blue 17 9 455 590 1162 318 88 342
Grey 102 129 308 316 178 294 203 227 207
Barley Green 1638 1411 847 666 499 1247 941 908 1213
Blue 7 20 1591 780 376 204 79
Grey 155 139 145 861 194 96 120 145 131
Maize Green 718 1619 791 311 440 2225 1490 523 947
Blue 521 1 74 713 20 103 62 63 81
Grey 135 124 295 364 118 195 308 176 194
Millet Green 2954 3344 1600 11982 2509 3719 2953 2990 4306
Blue 164 40 26 84 76 59 61 57
Grey 228 141 222 79 128 233 302 309 115
Cassava Green 444 433 357 422 394 258 529 471 550
Blue 1
Grey 32 17 56 31 29 24 22 22 13
Sugar beet Green 116 39 147 14 60 63 49 67 82
Blue 3 59 164 3 26 37 26
Grey 63 12 82 50 21 29 14 20 25
Soybeans Green 1714 2186 2231 1869 1533 3322 1629 1562 2037
Blue 65 1 129 122 23 18 98 92 70
Grey 10 15 106 43 11 92 10 10 37
Rapeseed Green 2095 2771 1483 1556 1155 1646 2567 2743 1703
Blue 2 7 1213 1 1467 4 3 231
Grey 420 98 466 197 259 235 341 360 336
Sesame seed Cake
Green 1422 1813 1851 1550 1272 2756 1352 1296 1690
Blue 54 1 107 101 19 15 81 76 58
Grey 8 12 88 35 9 76 8 8 31
Cottonseed Cake Green 254 648 328 154 245 1170 425 388 471
Blue 276 52 111 670 178 341 195 169 270
Grey 53 81 114 103 53 172 48 68 91
Fodder crops Green 254 158 2461 232 131 412 117 244 207
Blue 204 148 33 44 27
Grey 15 7 105 285 30 31 11 35 20
Pasture Green 762 307 225 225 131 407 174 372 315
Blue
Grey
Source: data for feed crops based on Mekonnen and Hoekstra (2010b); data for pasture from this study. The
water footprints shown in this table refer the weighted average of domestically produced and imported feeds.

The water footprint of farm animals and animal products / 23
Table 3. Average annual water footprint of one animal, per animal category (1996-2005).
Animal category
Water footprint of live animal at end of life time
(m3/ton)
Average animal weight at end of
life time (kg)
Average water footprint at end of
life time (m3/animal)
Average life time (yr)
Average annual water footprint of one animal (m3/yr/animal)
Dairy cattle 20558 10 2056
Horse 40612 473 19189 12 1599
Beef cattle 7477 253 1889 3.0 630
Pig 3831 102 390 0.75 520
Sheep 4519 31.3 141 2.1 68
Layer chicken 47 1.4 33
Goat 3079 24.6 76 2.3 32
Broiler chicken 3364 1.90 6 0.25 26
Total water footprint per ton of product
For all farm animal products, except dairy products, the total water footprint per unit of product declines from the
grazing to the mixed production system and then again from the mixed to the industrial production system. The
reason is that, when moving from grazing to industrial production systems, feed conversion efficiencies become
better. Per unit of product, about three to four times more feed is required for grazing systems when compared to
industrial systems (see Table 1). More feed implies that more water is needed to produce the feed. However, the
fact that feed conversion efficiencies in grazing and industrial production systems differ by a factor 3 to 4 does
not mean that the water footprints of animal products are 3 to 4 times larger when derived from a grazing instead
of an industrial system. This is because the feed composition of animals raised in grazing systems is generally
more favourable from a water resources point of view. For all animal categories, the fraction of concentrate feed
in the total feed is larger for industrial systems if compared to mixed production systems and larger for mixed
systems if compared to grazing systems. The water footprint per kg of concentrate feed is generally larger than
for roughages, so that this works to the disadvantage of the total water footprint of animals raised in industrial
systems and to the advantage of the total water footprint of animals raised in grazing systems. This effect,
however, does not fully compensate for the unfavourable feed conversion efficiencies in grazing systems. An
exception is in dairy farming, where the total water footprint per unit of product is comparable in all three
production systems. For dairy products, the water footprint happens to be smallest when they are derived from a
mixed system and a bit larger but comparable when obtained from a grazing or industrial system.
Blue and grey water footprints per ton of product
All the above is about comparing the total water footprints of animal products. The picture changes when we
focus on the blue and grey water footprint components. With the exception of chicken products, blue and grey
water footprints always increase from grazing to industrial production systems. Figure 9 illustrates this by
showing the blue water footprint of a number of animal products across the three productions systems. For the
grey water footprint similar pictures can be obtained. The larger blue and grey water footprints for products
obtained from industrial production systems are caused by the fact that concentrate feed takes a larger share in
the total feed in industrial systems when compared to grazing systems. For beef cattle in grazing systems, the

24 / The water footprint of farm animals and animal products
global average share of concentrate feed in total feed is 2%, while in industrial systems it is 21%. Mixed systems
are generally somewhere in between. Although the feed crops that are contained in the concentrate feed are often
to a great extent based on green water, there is a blue water footprint component as well, and the larger the
consumption of feed crops compared to roughages, the larger the total amount of blue water consumed. This
explains the larger blue water footprint per ton of product in industrial production systems for beef, milk, cheese,
and pig, sheep and goat meat. The application and leaching of fertilizers and other agro-chemicals in feed crop
production results in the fact that the grey water footprint of animal products from industrial systems, where the
dependence on feed crops is greatest, is larger than for grazing systems. Given the fact that freshwater problems
generally relate to blue water scarcity and water pollution and to a lesser extent to competition over green water,
this means that – from a water resources point of view – grazing systems are preferable over industrial
production systems for cattle, pig, sheep and goat.
In the case of chicken products (chicken meat and egg), the industrial production system has, on average, a
smaller blue and grey water footprint per ton of product compared to the other two production systems. The
reason is that chicken strongly rely on concentrate feed in all production systems, intensive or extensive. Broiler
chicken in extensive systems have a share of concentrate feed in total feed of 63%, while this is 81% in intensive
industrial systems. There is still a difference, but the differences in feed composition for both broiler and layer
chicken is less outspoken if compared to the other animal categories. As a result, the relatively unfavourable feed
conversion efficiency in extensive systems is not compensated by a more favourable composition of the feed as
is the case in the other animal categories.
Country differences
In general terms, one can say that the type of production system is highly relevant for the size, composition and
geographic spread of the water footprint of an animal product, because the type of production system determines
feed conversion efficiency, feed composition and origin of feed. Similarly we observe that the country of
production influences the water footprint of animal products in general terms as well. The Netherlands, for
example, shows lower total water footprints for most animal products if compared to the USA. The USA, in turn,
generally shows lower total water footprints for animal products than India. These crude general differences
between countries are related to existing country differences in feed conversion efficiencies, but also to the fact
that water footprints of feed crops vary across countries as a function of differences in climate and agricultural
practice.
Water footprint components - example for beef
For all animal products, the water footprint related to the animal feed takes by far the largest share in the total
water footprint. Further one can say that the green water footprint is always much larger than the blue and grey
water footprints. As an example, Table 5 shows in detail the components of the water footprint of producing a
kilogram of beef. The water footprint is dominantly green water (94%) and the largest share comes from the feed
the cattle consume (99%). Drinking and service water contribute only 1% toward the total water footprint, but
30% to the blue water footprint. The major fraction (83%) of the water footprint of a beef cow is attributed to the
derived beef, but smaller fractions go to the other products: offal, leather and semen.

Table 4. The green, blue and grey water footprint of selected animal products for selected countries (m3/ton).
Animal products
Farming system Australia Brazil China India Netherlands Russia USA Global average
Green Blue Grey Green Blue Grey Green Blue Grey Green Blue Grey Green Blue Grey Green Blue Grey Green Blue Grey Green Blue Grey
Beef Grazing 18056 745 55 23729 150 16 16140 0 0 25913 0 0 15182 411 200 19102 525 590 21121 465 243 Mixed 14455 623 61 20604 187 61 13227 339 103 16192 533 144 10319 761 664 11615 451 204 12726 546 768 14803 508 401 Industrial 4730 304 96 8421 147 244 10922 933 1234 12412 1471 866 3934 349 225 23591 1002 871 2949 356 551 8849 683 712 Weighted average 14507 613 62 19228 178 82 12795 495 398 15537 722 288 5684 484 345 16264 585 372 12933 525 733 14414 550 451 Sheep meat Grazing 13236 438 9 19440 372 1 9606 0 0 11441 0 0 14236 351 3 11910 312 18 15870 421 20 Mixed 6554 427 22 10649 421 9 5337 454 14 7528 582 316 8248 422 35 7176 379 7 9842 318 74 7784 484 67 Industrial 4747 445 12 2366 451 22 4523 593 484 3044 469 9 0 0 0 4607 800 216 Weighted average 10151 434 15 11772 421 7 5347 452 14 7416 582 314 8248 422 35 9284 395 5 10948 315 44 9813 522 76 Goat meat Grazing 4809 245 0 15860 328 0 5073 0 0 8081 0 0 7086 219 0 9277 285 0 Mixed 2435 233 0 8745 349 0 2765 283 0 4544 381 9 2443 453 4 3615 247 0 4691 313 4 Industrial 3754 406 0 1187 437 0 2046 436 30 1546 322 1 2431 413 18 Weighted average 3733 240 0 8144 372 0 2958 312 0 4194 393 13 2443 454 4 4432 266 0 5185 330 6 Pig meat Grazing 4299 3721 247 5482 1689 318 11134 205 738 3732 391 325 4048 479 587 7176 357 282 5118 870 890 7660 431 632 Mixed 2056 1909 118 5109 828 316 5401 356 542 4068 893 390 3653 306 451 7212 472 289 4953 743 916 5210 435 582 Industrial 7908 651 656 8184 215 525 3477 538 925 9236 2014 1021 3776 236 427 5165 397 207 3404 563 634 4050 487 687 Weighted average 5284 1226 414 6080 749 379 5050 405 648 5415 1191 554 3723 268 438 6937 429 276 4102 645 761 4907 459 622 Chicken meat
Grazing 4862 276 336 6363 35 364 4695 448 1414 11993 1536 1369 2535 113 271 8854 334 321 2836 294 497 7919 734 718 Mixed 2893 173 200 4073 32 233 3005 297 905 7676 995 876 1509 76 161 5259 210 190 1688 183 296 4065 348 574 Industrial 2968 176 205 3723 24 213 1940 195 584 3787 496 432 1548 77 165 2976 124 108 1731 187 303 2337 210 325 Weighted average 2962 176 205 4204 30 240 2836 281 854 6726 873 768 1545 77 165 6036 235 219 1728 187 303 3545 313 467
Egg Grazing 2243 146 173 432 24 25 3952 375 1189 10604 1360 1176 1695 76 161 1740 183 331 6781 418 446 Mixed 1435 99 111 257 24 15 2351 230 708 6309 815 699 1085 51 103 4617 170 168 1113 121 212 3006 312 545 Industrial 1570 107 121 3625 28 213 2086 206 628 3611 472 400 1187 55 113 4455 164 162 1218 132 232 2298 205 369 Weighted average 1555 106 120 2737 27 161 2211 217 666 4888 635 542 1175 55 111 4511 166 164 1206 130 230 2592 244 429 Milk Grazing 780 74 20 1046 22 7 1580 106 128 1185 105 34 572 50 32 0 0 0 1106 69 89 1087 56 49 Mixed 700 64 35 1254 42 36 897 147 213 863 132 65 431 40 23 1143 60 39 582 59 88 790 90 76 Industrial 517 48 43 500 43 25 1488 76 56 444 61 100 1027 98 82 Weighted average 704 63 33 1149 33 22 927 145 210 885 130 63 462 41 25 1273 65 45 647 60 89 863 86 72 Butter Grazing 4246 400 107 5691 122 39 8600 577 696 6448 572 188 3111 272 176 6022 373 482 5913 305 265 Mixed 3808 347 192 6822 230 196 4880 799 1161 4697 716 352 2345 218 123 6221 324 213 3169 321 478 4297 492 415 Industrial 2814 261 231 0 0 0 0 0 0 0 0 0 2720 233 136 8098 415 302 2417 330 543 5591 532 448 Weighted average 3829 344 178 6254 179 117 5044 789 1141 4819 706 341 2513 224 134 6927 355 247 3519 324 483 4695 465 393 Milk powder Grazing 3628 342 91 4862 104 34 7348 493 595 5510 489 160 2658 232 151 0 0 0 5145 319 412 5052 261 227 Mixed 3253 296 164 5829 197 167 4169 683 992 4013 612 301 2003 186 105 5315 277 182 2708 274 409 3671 421 354 Industrial 2405 223 198 0 0 0 0 0 0 0 0 0 2324 199 116 6920 355 258 2065 282 464 4777 455 382 Weighted average 3271 294 152 5344 153 100 4309 674 975 4117 603 291 2147 191 114 5919 303 211 3007 277 413 4011 398 336 Cheese Grazing 3857 380 97 5169 126 36 7812 540 633 5857 535 171 2826 263 160 5470 355 438 5371 293 241 Mixed 3459 331 174 6197 225 178 4432 742 1055 4267 666 320 2130 214 111 5651 310 194 2878 307 435 3903 463 377 Industrial 2556 253 210 2471 227 124 7356 393 275 2196 315 493 5078 500 406 Weighted average 3478 328 162 5681 178 107 4581 732 1036 4377 657 310 2283 219 121 6292 338 224 3196 310 439 4264 439 357
Leather (bovine)
Grazing 17601 801 54 22821 219 15 14300 0 0 25195 0 0 16922 529 223 21290 657 658 20905 535 240 Mixed 14090 682 59 19815 255 59 11719 377 91 15743 593 140 11883 947 765 12946 574 228 14185 681 856 16701 644 453 Industrial 4610 407 93 8099 217 235 9677 904 1093 12068 1505 842 4530 513 259 26295 1189 971 3287 497 614 9487 805 763 Weighted average 14150 673 60 18445 246 79 11323 515 352 15103 777 280 6067 589 369 18093 723 414 14450 658 819 15916 679 498

26 / The water footprint of farm animals and animal products
0
150
300
450
600
750
Grazing Mixed Industrial Weighted average
Blu
e w
ate
r fo
otp
rin
t (m
3 /to
n)
Animal production systems
Beef
0
30
60
90
120
Grazing Mixed Industrial Weighted average
Blu
e w
ate
r fo
otp
rin
t (m
3 /to
n)
Animal production systems
Milk
0
200
400
600
800
1000
Grazing Mixed Industrial Weighted average
Blu
e w
ate
r fo
otp
rin
t (m
3 /to
n)
Animal production systems
Sheep meat
0
100
200
300
400
500
Grazing Mixed Industrial Weighted average
Blu
e w
ate
r fo
otp
rin
t (m
3 /to
n)
Animal production systems
Goat meat
0
200
400
600
Grazing Mixed Industrial Weighted average
Blu
e w
ate
r fo
otp
rin
t (m
3 /to
n)
Animal production systems
Egg
0
100
200
300
400
500
600
Grazing Mixed Industrial Weighted average
Blu
e w
ate
r fo
otp
rin
t (m
3 /to
n)
Animal production systems
Pork
0
100
200
300
400
500
600
Grazing Mixed Industrial Weighted average
Blu
e w
ate
r fo
otp
rin
t (m
3 /to
n)
Animal production systems
Cheese
0
200
400
600
800
Grazing Mixed Industrial Weighted average
Blu
e w
ate
r fo
otp
rin
t (m
3 /to
n)
Animal production systems
Chicken meat
Figure 9. Global average blue water footprint per production system for selected animal products (1996-2005).

The water footprint of farm animals and animal products / 27
Table 5. The components of the water footprint of a beef cow and its derived products.
Feed crop*
Feed amount (kg/kg
carcass)
Weighted average water footprint of feed (litre/kg)
Water footprint (litre/kg carcass)
Green Blue Grey Green Blue Grey Total
Maize 1.0102 695 111 181 702 112 182 996
Wheat 0.2441 1322 77 140 323 18.8 34.0 375
Barley 0.2657 1143 59 126 304 15.6 33.4 353
Soya bean cake 0.1858 1451 72 19 270 13.4 3.6 286
Sorghum 0.1028 1228 130 92 126 13.4 9.5 149
Oats 0.0603 1457 212 125 87.8 12.8 7.6 108
Rice, paddy 0.0754 997 259 165 75.1 19.6 12.4 107
Cassava 0.1451 498 0 12 72.3 0.0 1.8 74.1
Oilseed cakes, other 0.0275 2158 37 50 59.4 1.0 1.4 61.7
Rape and mustard cake 0.0479 977 132 151 46.8 6.3 7.2 60.4
Rye 0.0233 1573 38 109 36.7 0.9 2.5 40.1
Millet 0.0107 2718 130 172 29.0 1.4 1.8 32.2
Cereals, not specified 0.0308 874 66 41 26.9 2.0 1.3 30.2
Sunflower seed cake 0.0249 968 63 98 24.1 1.6 2.4 28.1
Pulses, not specified 0.0132 1133 307 618 15.0 4.1 8.2 27.2
Molasses 0.0597 311 110 29 18.6 6.6 1.7 26.9
Groundnut cake 0.0171 1265 121 106 21.7 2.1 1.8 25.6
Soybeans 0.0140 1744 41 24 24.5 0.6 0.3 25.4
Potatoes 0.0796 254 10 48 20.2 0.8 3.8 24.9
Cottonseed cake 0.0280 481 259 86 13.5 7.3 2.4 23.1
Cottonseed 0.0181 618 353 124 11.2 6.4 2.2 19.8
Peas, dry 0.0126 1149 21 336 14.4 0.3 4.2 18.9
Sunflower seed 0.0054 2744 144 234 14.8 0.8 1.3 16.9
Sugar cane 0.0698 171 35 16 11.9 2.5 1.1 15.5
Plantains 0.0091 1392 27 3 12.7 0.2 0.0 13.0
Beans, dry 0.0029 3270 48 575 9.4 0.1 1.6 11.1
Rapeseed 0.0049 1877 3 305 9.3 0.0 1.5 10.8
Vegetables fresh not specified 0.0369 152 49 69 5.6 1.8 2.5 10.0
Copra cake 0.0046 1567 2 10 7.2 0.0 0.0 7.2
Sweet potatoes 0.0170 285 7 57 4.8 0.1 1.0 5.9
Yams 0.0166 326 0 1 5.4 0.0 0.0 5.5
Palm kernel cake 0.0075 659 0 27 4.9 0.0 0.2 5.2
Dates 0.0009 2397 2074 97 2.1 1.8 0.1 4.0
Sesame seed cake 0.0015 2111 53 53 3.1 0.1 0.1 3.3
Sugar beet 0.0165 154 16 30 2.5 0.3 0.5 3.3
Oilseeds, not specified 0.0024 802 94 35 2.0 0.2 0.1 2.3
Other minor feed crops 0.0122 325 66 40 3.9 0.8 0.5 5.2
continued on next page

28 / The water footprint of farm animals and animal products
Feed crop*
Feed amount (kg/kg
carcass)
Weighted average water footprint of feed (litre/kg)
Water footprint (litre/kg carcass)
Green Blue Grey Green Blue Grey Total
Crop residues 21.943 0 0 0 0.0 0.0 0.0 0.0
Fodder crops 2.4632 168 29 21 415 71.8 50.7 537
Pasture (grass) 31.525 303 0 0 9556 0.0 0.0 9556
Water for feed mixing 1.5 1.5
Water footprint related to feed 12391 314 388 13107
Drinking water 110 110
Service water 29 29
Total water footprint of beef cattle (litre/kg carcass) 12391 453 388 13246
Total water footprint of a 253 kg beef cow (in litre)
(assuming a total carcass weight of 143 kg) 1769000 64600 55300 1889000
… of which 83% is attributed to the 101 kg of resultant beef, so that
the water footprint of beef** (litre/kg beef) amounts to: 14400 550 450 15400
… of which 10% is attributed to the 18 kg of resultant offal, so that
the water footprint of offal** (litre/kg offal) amounts to: 10400 400 330 11200
… of which 5% is attributed to the 6.1 kg of resultant leather, so that
the water footprint of leather** (litre/kg leather) amounts to: 15900 680 500 17100
… of which 2% is attributed to the 0.03 kg of resultant semen, so that
the water footprint of semen** (litre/kg semen) amounts to: 1069000 40600 33400 1143000
* The feed amounts included here represent the global average feed intake of beef cattle. Obviously, the feed composition of individual cows will deviate based on the production system and composition of the concentrate feed applied.
** The percentage of the total water footprint of a beef cow attributed to each product refers to the ‘value fraction’ for that product (Appendix V). The amount of a certain product (in kg) coming from the total animal is based on the ‘product fraction’ for that product (Appendix V). In the blue water footprint, we added the water footprint of processing the slaughtered cow into the derived products.
3.4 Water footprint of animal versus crop products per unit of nutritional value
As a general picture we find that animal products have a larger water footprint per ton of product than crop
products. As we see from Table 6, the global average water footprint per ton of crop increases from sugar crops
(roughly 200 m3/ton) and vegetables (~300 m3/ton) to pulses (~4000 m3/ton) and nuts (~9000 m3/ton). For
animal products, the water footprint increases from milk (~1000 m3/ton) and egg (~3300 m3/ton) to beef (~15400
m3/ton). Also when viewed from a caloric standpoint, the water footprint of animal products is larger than for
crop products. The average water footprint per calorie for beef is twenty times larger than for cereals and starchy
roots. When we look at the water requirements for protein, we find that the water footprint per gram of protein
for milk, eggs and chicken meat is about 1.5 times larger than for pulses. For beef, the water footprint per gram
of protein is 6 times larger than for pulses. In the case of fat, we find that butter has a relatively small water
footprint per gram of fat, even lower than for oil crops. All other animal products, however, have larger water
footprints per gram of fat when compared to oil crops. The general conclusion is that from a freshwater resource
perspective, it is more efficient to obtain calories, protein and fat through crop products than animal products. A
note should be made here, however, that types of proteins and fats differ across the different products.

The water footprint of farm animals and animal products / 29
Table 6. The water footprint of some selected food products from vegetable and animal origin.
Food item
Water footprint per ton (m3/ton) Nutritional content Water footprint per unit of
nutritional value
Green Blue Grey TotalCalorie
(kcal/kg)Protein
(g/kg)Fat
(g/kg)Calorie
(litre/kcal)
Protein (litre/g
protein)
Fat (litre/g
fat)
Sugar crops 130 52 15 197 285 0.0 0.0 0.69 0.0 0.0
Vegetables 194 43 85 322 240 12 2.1 1.34 26 154
Starchy roots 327 16 43 387 827 13 1.7 0.47 31 226
Fruits 726 147 89 962 460 5.3 2.8 2.09 180 348
Cereals 1232 228 184 1644 3208 80 15 0.51 21 112
Oil crops 2023 220 121 2364 2908 146 209 0.81 16 11
Pulses 3180 141 734 4055 3412 215 23 1.19 19 180
Nuts 7016 1367 680 9063 2500 65 193 3.63 139 47
Milk 863 86 72 1020 560 33 31 1.82 31 33
Eggs 2592 244 429 3265 1425 111 100 2.29 29 33
Chicken meat 3545 313 467 4325 1440 127 100 3.00 34 43
Butter 4695 465 393 5553 7692 0.0 872 0.72 0.0 6.4
Pig meat 4907 459 622 5988 2786 105 259 2.15 57 23
Sheep/goat meat 8253 457 53 8763 2059 139 163 4.25 63 54
Bovine meat 14414 550 451 15415 1513 138 101 10.19 112 153
In order to reduce the pressure on the world’s water resource associated with their consumption pattern,
individuals have the option of shifting from a meat-rich to a vegetarian diet. The water footprint of an individual
consumer depends to a large extent on the type of diet of the individual. Meat-based diets have a larger water
footprint compared to a vegetarian diet. The average USA citizen consumes almost four times the amount of
protein compared to the global average (FAO, 2009). About 63% of the daily protein intake comes from animal
based products. This high level of consumption of animal-based products is directly reflected in the relative large
water footprint of the average American citizen (Hoekstra and Chapagain, 2007). Replacing 50% of all animal
products by an equivalent amount of high nutritious crop products such as pulses, groundnuts and potatoes will
result a 30% reduction of the food-related water footprint. A vegetarian diet compared with the average current
per capita food intake in the USA can reduce the water footprint of an individual by as much as 58%.
3.5 The total water footprint of animal production
During the period 1996-2005, the total water footprint for global animal production was 2422 Gm3/yr (87.2%
green, 6.2% blue and 6.6% grey water). The different components of the global water footprint of animal
production are shown in Table 7. The largest water footprint for the animal production comes from the feed they
consume, which accounts for 98% of the total water footprint. Drinking water, service water and feed mixing
water further account only for 1.1%, 0.8% and 0.03% of the total water footprint, respectively. The estimate of
drinking and service water is in line with Peden et al. (2007). Grazing accounts for the largest share (38%),
followed by maize (17%) and fodder crops (8%).

30 / The water footprint of farm animals and animal products
The global water footprint of feed production is 2376 Gm3/yr, of which 1463 Gm3/yr refers to crops and the
remainder to grazing (Table 8). The total water footprint of feed crops amounts to 20% of the water footprint of
total crop production in the world, which is 7404 Gm3/yr (Mekonnen and Hoekstra, 2010b). The globally
aggregated blue water footprint of feed crop production is 105 Gm3/yr, which is 12% of the blue water footprint
of total crop production in the world (Mekonnen and Hoekstra, 2010b). This means that an estimated 12% of the
global consumption of groundwater and surface water for irrigation is for feed, not for food, fibres or other crop
products. Globally, the total water footprint of animal production (2422 Gm3/yr) constitutes 29% of the water
footprint of total agricultural production.
When we consider the total water footprint per animal category (Table 9), we find that beef cattle have the
largest contribution (33%) to the global water footprint of farm animal production, followed by dairy cattle
(19%), pig (19%) and broiler chicken (11%). The green, blue and grey water footprints per animal category and
production system are shown in Table 10. Altogether, mixed production systems account for the largest share
(57.4%) in the total water footprint of animal production. Grazing and industrial production systems account for
20.3% and 22.3%, respectively. In the grazing system, over 97% of the water footprint related to feed comes
from grazing and fodder crops and the water footprint is dominantly (94%) green. In the mixed and industrial
production systems, the green water footprint forms 87% and 82% of the total footprint, respectively. The blue
water footprint in the grazing system accounts for 3.6% of the total water footprint and about 33% of this comes
from the drinking and service water use. In the industrial system, the blue water footprint accounts for 8% of the
total water footprint.
Table 7. Global water footprint of animal production by component.
Feed crop Total water footprint (Mm3/yr)
Green Blue Grey Total Share (%)
Grazing 912816 0.0 0.0 912816 37.7
Maize 302595 33581 74960 411136 17.0
Fodder crops 167896 9900 10903 188699 7.79
Soybean cake 168221 6559 3178 177958 7.35
Wheat 122934 8345 16214 147493 6.09
Barley 116844 6778 14410 138031 5.70
Oats 48508 10370 4753 63631 2.63
Sorghum 40781 3376 2798 46954 1.94
Rice, paddy 24699 7497 4863 37059 1.53
Oilseed cakes, other 22159 409 525 23093 0.95
Rape and mustard cake 16841 2457 3134 22432 0.93
Cassava 17630 8.6 849 18488 0.76
Cereals, not else specified 15683 881 979 17543 0.72
Sweet potatoes 12927 210 2781 15918 0.66
Rye 13628 249 1057 14934 0.62
Pulses, not else specified 7829 1242 4300 13371 0.55
continued on next page

The water footprint of farm animals and animal products / 31
Feed crop Total water footprint (Mm3/yr)
Green Blue Grey Total Share (%)
Sunflower seed cake 11279 626 905 12809 0.53
Potatoes 9602 369 2500 12471 0.51
Millet 9617 607 458 10682 0.44
Soybeans 9786 374 212 10372 0.43
Groundnut cake 8874 658 575 10107 0.42
Peas, dry 6666 144 1736 8546 0.35
Cottonseed cake 4851 2889 775 8514 0.35
Molasses 4214 1808 410 6432 0.27
Cottonseed 3252 2480 618 6350 0.26
Vegetables fresh not else specified 3665 703 1977 6345 0.26
Beans, dry 4003 54 922 4979 0.21
Sunflower seed 4045 200 314 4560 0.19
Rapeseed 3338 11 763 4111 0.17
Copra cake 3581 3.5 23 3608 0.15
Sugar cane 2148 590 217 2955 0.12
Palm kernel Cake 2519 0.7 93 2612 0.11
Sesame seed cake 2111 53 46 2210 0.09
Plantains 2078 52 4 2134 0.09
Sugar beet 1070 70 285 1425 0.06
Oilseeds, not else specified 990 150 50 1191 0.05
Bananas 761 53 41 855 0.04
Yams 767 0.5 3.3 771 0.03
Dates 244 279 15 538 0.02
Apples 326 118 38 483 0.02
Tomatoes 102 93 39 234 0.01
Roots and tubers, not else specified 177 4.1 27 208 0.01
Fruits, other 116 25 9 150 0.01
Groundnuts 70 8 5 83 0.00
Coconuts 38 0.0 0.1 38 0.00
Cocoa beans 16 0.0 0.2 16 0.00
Onions 0.7 1.6 0.2 2.5 0.00
Sesame seed 1.8 0.3 0.2 2.2 0.00
Palm-kernels 0.8 0.0 0.0 0.8 0.00
Mixing water for feed preparation 0.0 610 0.0 610 0.03
Drinking water 27099 27099 1.12
Service water 18213 18213 0.75
Total water footprint 2112301 150660 158762 2421722 100.00

32 / The water footprint of farm animals and animal products
Table 8. The global water footprint of animal production compared to the global water footprint of total agricultural production for the period 1996-2005 (Gm3/yr).
Green Blue Grey Total
Water footprint of total agricultural production
Water footprint of crop production* 5771 899 733 7404
Water footprint of grazing 913 - - 913
Direct water footprint of livestock** - 46 - 46
Total 6684 899 733 8317
Water footprint of animal production
Water footprint of feed crop production 1199 105 159 1463
Water footprint of grazing 913 - - 913
Direct water footprint of livestock** - 46 - 46
Total 2112 151 159 2422
Water footprint of animal production as a percentage of the total water footprint in agricultural production
32% 17% 22% 29%
* Source: Mekonnen and Hoekstra (2010b). ** Water footprint of drinking, servicing and feed mixing.
A substantial part of the water footprint of an animal product produced in one country often resides outside that
country. This is most in particular the case for products originating from industrial production systems, because
those systems use the largest fraction of concentrate feed. Feed crops are often imported rather than produced
domestically. Soybean cake, for example, which is an important feed ingredient in industrial livestock raising, is
often imported. In the period 1996-2005, 49% of global soybean production was exported, either in the form of
soybean or in the form of soybean cake (FAO, 2009).
Table 9. The total water footprint per animal category (1996-2005).
Animal category Global total number
of animals* (millions) Average annual water footprint per animal** (m3/yr per animal)
Annual water footprint of animal category (Gm3/yr)
%
Beef cattle 1267 630 798 33
Dairy cattle 228 2056 469 19
Pig 880 520 458 19
Broiler chicken 9923 26 255 11
Horse 112 1599 180 7
Layer Chicken 5046 33 167 7
Sheep 1052 68 71 3
Goat 750 32 24 1
Total 19258 2422 100
* Source: FAO (2009).
** See Table 3.
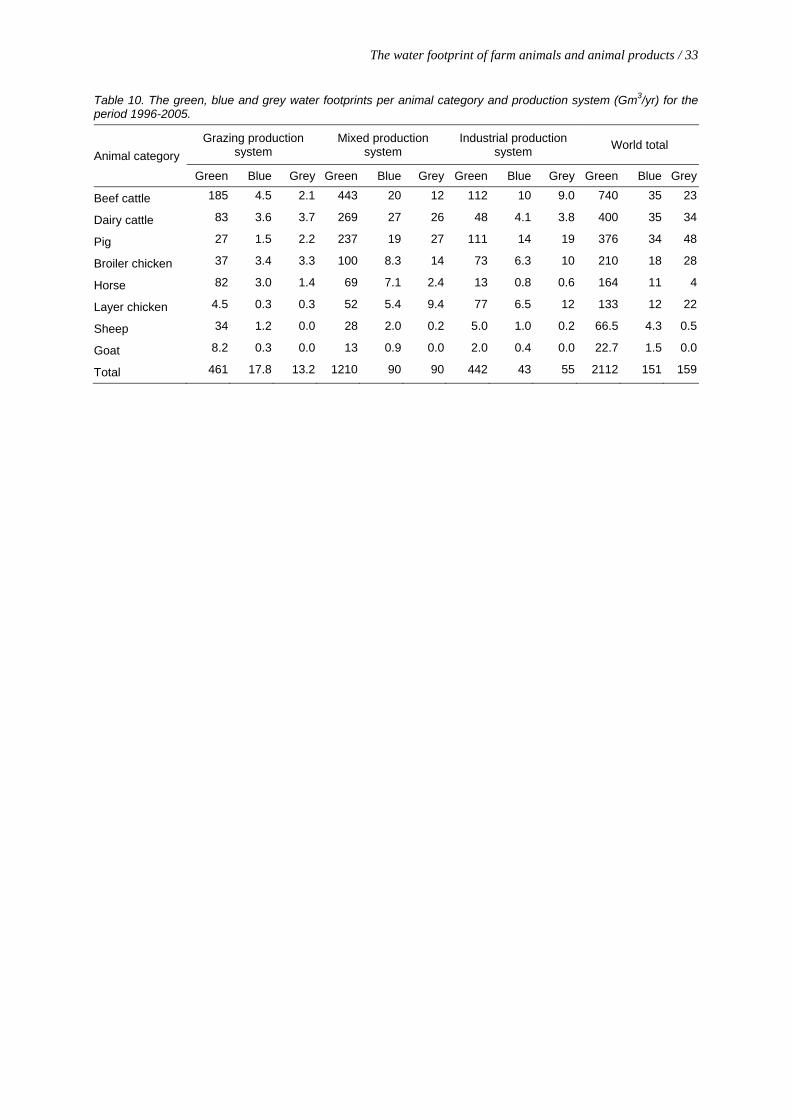
The water footprint of farm animals and animal products / 33
Table 10. The green, blue and grey water footprints per animal category and production system (Gm3/yr) for the period 1996-2005.
Animal category
Grazing production system
Mixed production system
Industrial production system
World total
Green Blue Grey Green Blue Grey Green Blue Grey Green Blue Grey
Beef cattle 185 4.5 2.1 443 20 12 112 10 9.0 740 35 23
Dairy cattle 83 3.6 3.7 269 27 26 48 4.1 3.8 400 35 34
Pig 27 1.5 2.2 237 19 27 111 14 19 376 34 48
Broiler chicken 37 3.4 3.3 100 8.3 14 73 6.3 10 210 18 28
Horse 82 3.0 1.4 69 7.1 2.4 13 0.8 0.6 164 11 4
Layer chicken 4.5 0.3 0.3 52 5.4 9.4 77 6.5 12 133 12 22
Sheep 34 1.2 0.0 28 2.0 0.2 5.0 1.0 0.2 66.5 4.3 0.5
Goat 8.2 0.3 0.0 13 0.9 0.0 2.0 0.4 0.0 22.7 1.5 0.0
Total 461 17.8 13.2 1210 90 90 442 43 55 2112 151 159

4. Discussion
The result of the current study can be compared with results from earlier studies. However, only a few other
studies on the water footprint per unit of animal product and the total water footprint of animal production are
available. We will first compare our estimates of the water footprints per ton of animal product with two earlier
studies and subsequently we will compare the total water footprint related to animal feed production with five
earlier studies.
The rough estimates made by Pimentel et al. (2004) for the water footprints of beef and meat from sheep, pig and
chicken are partly very close to our global estimates but partly also quite different. They report a water footprint
of chicken meat of 3500 m3/ton, which is only a bit lower than our global average estimate of 4300 m3/ton, and
even closer if we subtract the grey water footprint component from our estimate (which is not included in
Pimentel’s studies). They report a water footprint of pig meat of 6000 m3/ton, which happens to coincide with
our global average estimate (but our estimate includes the grey water footprint component). For sheep meat, they
report a water footprint of 51000 m3/ton and for beef 43000 m3/ton, values that are very high when compared to
our estimates (10,400 m3/ton for sheep meat and 15400 m3/ton for beef). We consider the values reported by
Pimentel as crude first estimates, for which the underlying assumptions have not been spelled out, so that it is
difficult to explain differences with our estimates.
The study of Chapagain and Hoekstra (2004) is the only publication with global estimates of the water footprint
of animal products with specifications by country. At a global level, the estimated water footprints per ton of
animal and animal product compare very well with the estimates from Chapagain and Hoekstra (2004), with an r2
of 0.88 (Figure 10a). The good agreement at the global level between the two studies is probably that the global
average water footprints for various feed ingredients are very close in the two studies. The trend line in Figure
10a is slightly above 1, which is caused by our higher estimates for the water footprints of sheep and goat meat.
For most other animal products, the current study gives a bit lower estimates than the earlier study.
When we compare our estimates with Chapagain and Hoekstra (2004) at a country level, more differences are
found (Figure 10b-f). The two studies show a relatively good agreement for pig meat, chicken meat and egg –
although for egg the earlier study systematically gives higher numbers – but little agreement for beef and dairy
products. In general we find that Chapagain and Hoekstra (2004) underestimated the water footprints for African
countries and overestimated the water footprints for OECD countries. As already pointed out in the introductory
chapter, there are three main reasons why the estimates from the current study can differ from the 2004-study
and are considered more accurate. First, the current study is based on better data for the estimation of the
quantity and composition of animal feed. Second, the current study reckons with the relative presence of the
three production systems per country and accounts for the differences between those systems. Third, we have
estimated the water footprints of the various feed ingredients more accurately by using a high-resolution grid-
based crop water use model, including the effect of water deficits where they occur, making explicit distinction
between the green and blue water footprint components and including the grey water footprint component.
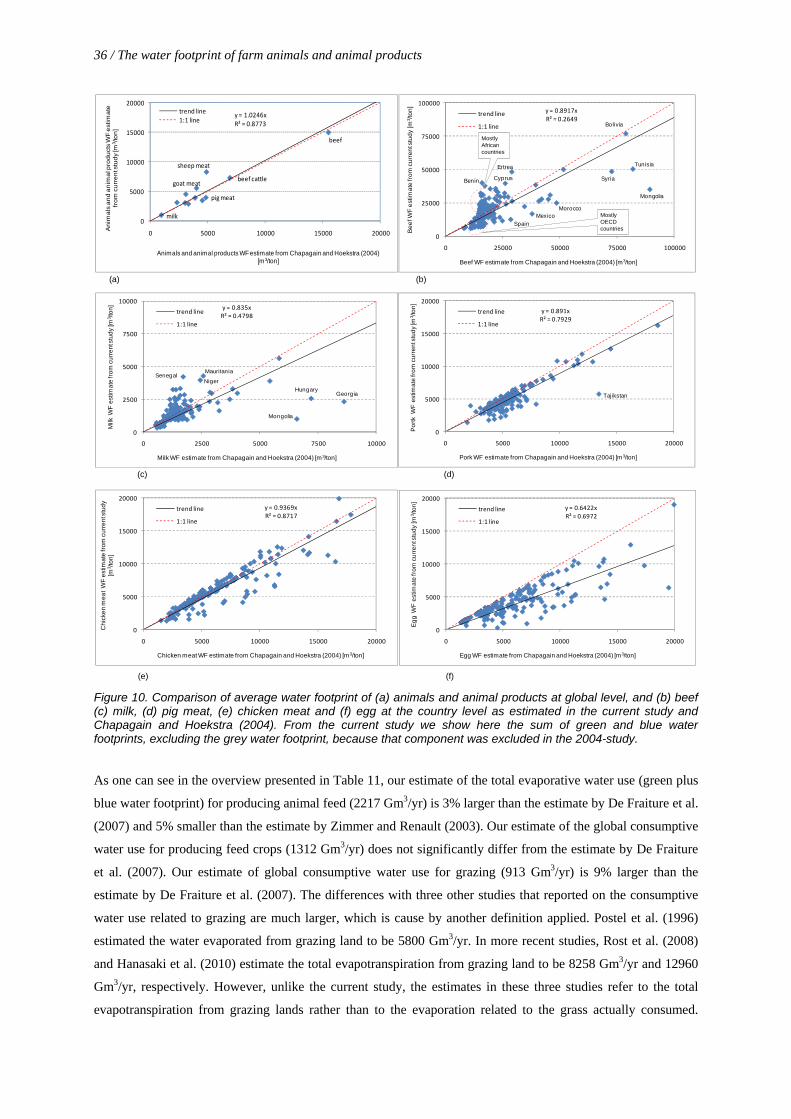
36 / The water footprint of farm animals and animal products
y = 0.8917xR² = 0.2649
0
25000
50000
75000
100000
0 25000 50000 75000 100000
Be
ef W
F e
stim
ate
fro
m c
urr
en
t stu
dy
[m3 /
ton
]
Beef WF estimate from Chapagain and Hoekstra (2004) [m3/ton]
trend line
1:1 line
Tunisia
Syria
Ertrea
Mexico
Cyprus
Mongolia
Bolivia
Spain
Benin
Morocco
Mostly African countries
Mostly OECD countries
(a) (b)
(c) (d)
(e) (f)
milk
goat meat
pig meat
sheep meat
beef cattle
beef
y = 1.0246xR² = 0.8773
0
5000
10000
15000
20000
0 5000 10000 15000 20000
An
ima
ls a
nd
an
ima
l pro
du
cts
WF
est
ima
te
fro
m c
urr
en
t stu
dy
[m3 /
ton
]
Animals and animal products WF estimate from Chapagain and Hoekstra (2004) [m3/ton]
trend line1:1 line
y = 0.835xR² = 0.4798
0
2500
5000
7500
10000
0 2500 5000 7500 10000
Milk
WF
est
ima
te fr
om
cu
rre
nt s
tud
y [m
3 /to
n]
Milk WF estimate from Chapagain and Hoekstra (2004) [m3/ton]
trend line
1:1 line
Mongolia
HungaryGeorgia
SenegalMauritania
Niger
y = 0.891xR² = 0.7929
0
5000
10000
15000
20000
0 5000 10000 15000 20000
Po
rtk
WF
est
ima
te fr
om
cu
rre
nt s
tud
y [m
3 /to
n]
Pork WF estimate from Chapagain and Hoekstra (2004) [m3/ton]
trend line
1:1 line
Tajikstan
y = 0.9369xR² = 0.8717
0
5000
10000
15000
20000
0 5000 10000 15000 20000
Ch
icke
n m
ea
t W
F e
stim
ate
fro
m c
urr
en
t stu
dy
[m3 /
ton
]
Chicken meat WF estimate from Chapagain and Hoekstra (2004) [m3/ton]
trend line
1:1 line
y = 0.6422xR² = 0.6972
0
5000
10000
15000
20000
0 5000 10000 15000 20000
Eg
g W
F e
stim
ate
fro
m c
urr
en
t stu
dy
[m3 /
ton
]
Egg WF estimate from Chapagain and Hoekstra (2004) [m3/ton]
trend line
1:1 line
Figure 10. Comparison of average water footprint of (a) animals and animal products at global level, and (b) beef (c) milk, (d) pig meat, (e) chicken meat and (f) egg at the country level as estimated in the current study and Chapagain and Hoekstra (2004). From the current study we show here the sum of green and blue water footprints, excluding the grey water footprint, because that component was excluded in the 2004-study.
As one can see in the overview presented in Table 11, our estimate of the total evaporative water use (green plus
blue water footprint) for producing animal feed (2217 Gm3/yr) is 3% larger than the estimate by De Fraiture et al.
(2007) and 5% smaller than the estimate by Zimmer and Renault (2003). Our estimate of the global consumptive
water use for producing feed crops (1312 Gm3/yr) does not significantly differ from the estimate by De Fraiture
et al. (2007). Our estimate of global consumptive water use for grazing (913 Gm3/yr) is 9% larger than the
estimate by De Fraiture et al. (2007). The differences with three other studies that reported on the consumptive
water use related to grazing are much larger, which is cause by another definition applied. Postel et al. (1996)
estimated the water evaporated from grazing land to be 5800 Gm3/yr. In more recent studies, Rost et al. (2008)
and Hanasaki et al. (2010) estimate the total evapotranspiration from grazing land to be 8258 Gm3/yr and 12960
Gm3/yr, respectively. However, unlike the current study, the estimates in these three studies refer to the total
evapotranspiration from grazing lands rather than to the evaporation related to the grass actually consumed.
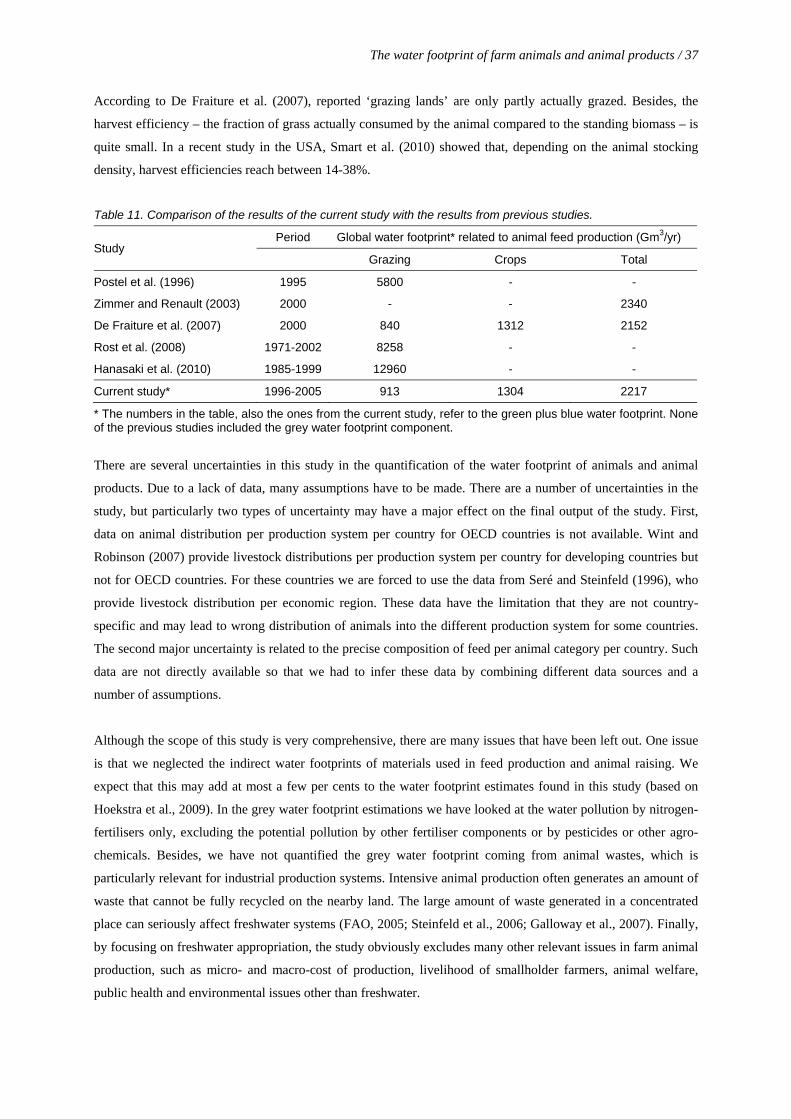
The water footprint of farm animals and animal products / 37
According to De Fraiture et al. (2007), reported ‘grazing lands’ are only partly actually grazed. Besides, the
harvest efficiency – the fraction of grass actually consumed by the animal compared to the standing biomass – is
quite small. In a recent study in the USA, Smart et al. (2010) showed that, depending on the animal stocking
density, harvest efficiencies reach between 14-38%.
Table 11. Comparison of the results of the current study with the results from previous studies.
Study Period Global water footprint* related to animal feed production (Gm3/yr)
Grazing Crops Total
Postel et al. (1996) 1995 5800 - -
Zimmer and Renault (2003) 2000 - - 2340
De Fraiture et al. (2007) 2000 840 1312 2152
Rost et al. (2008) 1971-2002 8258 - -
Hanasaki et al. (2010) 1985-1999 12960 - -
Current study* 1996-2005 913 1304 2217
* The numbers in the table, also the ones from the current study, refer to the green plus blue water footprint. None of the previous studies included the grey water footprint component.
There are several uncertainties in this study in the quantification of the water footprint of animals and animal
products. Due to a lack of data, many assumptions have to be made. There are a number of uncertainties in the
study, but particularly two types of uncertainty may have a major effect on the final output of the study. First,
data on animal distribution per production system per country for OECD countries is not available. Wint and
Robinson (2007) provide livestock distributions per production system per country for developing countries but
not for OECD countries. For these countries we are forced to use the data from Seré and Steinfeld (1996), who
provide livestock distribution per economic region. These data have the limitation that they are not country-
specific and may lead to wrong distribution of animals into the different production system for some countries.
The second major uncertainty is related to the precise composition of feed per animal category per country. Such
data are not directly available so that we had to infer these data by combining different data sources and a
number of assumptions.
Although the scope of this study is very comprehensive, there are many issues that have been left out. One issue
is that we neglected the indirect water footprints of materials used in feed production and animal raising. We
expect that this may add at most a few per cents to the water footprint estimates found in this study (based on
Hoekstra et al., 2009). In the grey water footprint estimations we have looked at the water pollution by nitrogen-
fertilisers only, excluding the potential pollution by other fertiliser components or by pesticides or other agro-
chemicals. Besides, we have not quantified the grey water footprint coming from animal wastes, which is
particularly relevant for industrial production systems. Intensive animal production often generates an amount of
waste that cannot be fully recycled on the nearby land. The large amount of waste generated in a concentrated
place can seriously affect freshwater systems (FAO, 2005; Steinfeld et al., 2006; Galloway et al., 2007). Finally,
by focusing on freshwater appropriation, the study obviously excludes many other relevant issues in farm animal
production, such as micro- and macro-cost of production, livelihood of smallholder farmers, animal welfare,
public health and environmental issues other than freshwater.


5. Conclusion
The present study estimates the water footprint of farm animals and animal products per production system and
per country. The results show that:
Although beef cattle, sheep and goat require much more feed per unit of meat produced than pig and broiler
chicken, the fraction of concentrate feed in the total feed is much larger for the latter (Section 3.1). Since
concentrate feed has a larger water footprint per unit of weight than roughages (Section 3.2), the water
footprints of the different sorts of meat are closer than one would expect on the basis of feed conversion
efficiencies alone (Section 3.3).
The total water footprint of an animal product is generally larger when obtained from a grazing system than
when produced from an industrial system, because of a larger green water footprint component. The blue and
grey water footprints of animal products are largest for industrial systems (with an exception for chicken
products). From a freshwater perspective, animal products from grazing systems are therefore to be preferred
above products from industrial systems (Section 3.3).
The water footprint of any animal product is larger than the water footprint of a wisely chosen crop product
with equivalent nutritional value (Section 3.4).
29% of the total water footprint of the agricultural sector in the world is related to the production of animal
products. One third of the global water footprint of animal production is related to beef cattle (Section 3.5).
The global meat production has almost doubled in the period 1980-2004 (FAO, 2005) and this trend is likely to
continue given the projected doubling of meat production in the period 2000-2050 (Steinfeld et al., 2006). To
meet this rising demand for animal products, the on-going shift from traditional extensive and mixed farming to
industrial farming systems is likely to continue. Because of the larger dependence on concentrate feed in
industrial systems, this intensification of animal production systems will result in increasing blue and grey water
footprints per unit of animal product. The pressure on the global freshwater resources will thus increase both
because of the increasing meat consumption and the increasing blue and grey water footprint per unit of meat
consumed.
Managing the demand for animal products by promoting a dietary shift away from a meat-rich diet will be an
inevitable component in the environmental policy of governments. In countries where the consumption of animal
products is still quickly rising, one should critically look how this growing demand can be moderated. On the
production side, it would be wise to include freshwater implications in the development of animal farming
policies, which means that particularly feed composition, feed water requirements and feed origin need to receive
attention. Animal farming puts the lowest pressure on freshwater systems when dominantly based on crop
residues, waste and roughages. Policies aimed to influence either the consumption or production side of farm
animal products will generally entail various sorts of socio-economic and environmental trade-offs (Herrero et
al., 2009; Pelletier and Tyedmers, 2010). Therefore, policies aimed at reducing the negative impacts of animal
production and consumption should be able to address these potential tradeoffs. Policies should not affect the

40 / The water footprint of farm animals and animal products
required increase in food security in less developed countries neither the livelihood of the rural poor should be
put in danger through intensification of animal farming.
This study provides a rich data source for further studies on the factors that determine how animal products put
pressure on the global water resources. The reported incidents of groundwater depletion, rivers running dry and
increasing levels of pollution form an indication of the growing water scarcity (UNESCO, 2009; Postel, 2000;
Gleick, 1993). Since animal production and consumption play an important role in depleting and polluting the
world’s scarce freshwater resources, information on the water footprint of animal products will help us
understand how we can sustain the scarce freshwater resources.

References
Bouwman, A.F., Van der Hoek, K.W., Eickhout, B. and Soenario, I. (2005) Exploring changes in world
ruminant production systems, Agricultural Systems 84: 121-153.
Bruinsma, J. (2003) World agriculture: towards 2015/2030: an FAO perspective, Earthscan, London, UK.
Chapagain, A.K. and Hoekstra, A.Y. (2003) Virtual water flows between nations in relation to trade in livestock
and livestock products, Value of Water Research Report Series No. 13, UNESCO-IHE, Delft, the
Netherlands, www.waterfootprint.org/Reports/Report13.pdf.
Chapagain, A.K. and Hoekstra, A.Y. (2004) Water footprints of nations, Value of Water Research Report Series
No. 16, UNESCO-IHE, Delft, the Netherlands, www.waterfootprint.org/Reports/Report16Vol1.pdf.
De Fraiture, C., Wichelns, D., Rockström, J., Kemp-Benedict, E., Eriyagama, N., Gordon, L.J., Hanjra, M.A.,
Hoogeveen, J., Huber-Lee, A. and Karlberg, L. (2007) Looking ahead to 2050: scenarios of alternative
investment approaches, In: Molden, D. (ed.) Water for food, water for life: a comprehensive assessment of
water management in agriculture, International Water Management Institute, Colombo, Earthscan,
London: pp. 91–145.
FAO (1983) Changing patterns and trends in feed utilization, FAO Economic and Social Development Paper 37,
Food and Agriculture Organization, Rome, Italy.
FAO (2003) Technical conversion factors for agricultural commodities, Food and Agriculture Organization,
Rome, Italy, www.fao.org/fileadmin/templates/ess/documents/methodology/tcf.pdf.
FAO (2005) Livestock policy brief 02, Food and Agriculture Organization, Rome, Italy.
FAO (2009) FAOSTAT database, Food and Agriculture Organization, Rome, Italy, http://faostat.fao.org.
Galloway, J., Burke, M., Bradford, G. E., Naylor, R., Falcon, W., Chapagain, A.K., Gaskell, J.C., McCullough,
E., Mooney, H.A., Oleson, K.L.L., Steinfeld, H., Wassenaar, T., Smil, V. (2007) International trade in
meat: The tip of the pork chop, Ambio 36: 622–629.
Gleick, P.H. (ed.) (1993) Water in crisis: A guide to the world’s fresh water resources, Oxford University Press,
Oxford, UK.
Hanasaki, N., Inuzuka, T., Kanae, S. and Oki, T. (2010) An estimation of global virtual water flow and sources
of water withdrawal for major crops and livestock products using a global hydrological model, Journal of
Hydrology, 384: 232-244.
Hendy, C.R.C, Kleih, U., Crawshaw, R., Phillips, M. (1995) Livestock and the environment finding a balance:
Interactions between livestock production systems and the environment, Impact Domain: concentrate feed
demand, Food and Agriculture Organization, Rome, Italy,
www.fao.org/wairdocs/lead/x6123e/x6123e00.htm#Contents
Herrero, M., Thornton, P. K., Gerber, P. and Reid, R. S. (2009) Livestock, livelihoods and the environment:
understanding the trade-offs, Current Opinion in Environmental Sustainability 1(2): 111-120.
Hoekstra, A.Y. (2010) The water footprint of animal products, In: D'Silva, J. and Webster, J. (eds.) The meat
crisis: Developing more sustainable production and consumption, Earthscan, London, UK, pp. 22-33.
Hoekstra, A.Y. and Chapagain, A.K. (2007) Water footprints of nations: water use by people as a function of
their consumption pattern, Water Resources Management, 21(1): 35-48.

42 / The water footprint of farm animals and animal products
Hoekstra, A.Y. and Chapagain, A.K. (2008) Globalization of water: Sharing the planet’s freshwater resources,
Blackwell Publishing, Oxford, UK.
Hoekstra, A.Y., Chapagain, A.K., Aldaya, M.M., Mekonnen, M.M. (2009) Water footprint manual: state of the
art 2009, Water Footprint Network, Enschede, The Netherlands.
Mekonnen, M.M. and Hoekstra, A.Y. (2010a) A global and high-resolution assessment of the green, blue and
grey water footprint of wheat, Hydrology and Earth System Sciences 14(7), 1259–1276.
Mekonnen, M.M. and Hoekstra, A.Y. (2010b) The green, blue and grey water footprint of crops and derived
crop products, Value of Water Research Report Series No. 47, UNESCO-IHE, Delft, the Netherlands,
www.waterfootprint.org/Reports/Report47-WaterFootprintCrops-Vol1.pdf.
Naylor, R., Steinfeld, H., Falcon, W., Galloway, J., Smil, V., Bradford, E., Alder, J. and Mooney, H. (2005)
Agriculture: Losing the links between livestock and land, Science 310(5754): 1621-1622.
Peden, D., Tadesse, G., Misra, A.K., Ahmed, F.A., Astatke, A., Ayalneh, W., Herrero, M., Kiwuwa, G., Kumsa,
T., Mati, B., Mpairwe, D., Wassenaar, T. and Yimegnuhal, A. (2007) Water and livestock for human
development, In: Molden, D. (ed.) Water for food, water for life: a comprehensive assessment of water
management in agriculture, International Water Management Institute, Colombo, Earthscan, London: pp.
485–514.
Pelletier, N. and Tyedmers, P. (2010) Forecasting potential global environmental costs of livestock production
2000-2050, Proceedings of the National Academy of Sciences 107 (43): 18371-18374.
Pimentel, D., Berger, B., Filiberto, D., Newton, M., Wolfe, B., Karabinakis, E., Clark, S., Poon, E., Abbett, E.
and Nandagopal, S. (2004) Water resources: agricultural and environmental issues, BioScience 54(10):
909-918.
Postel, S.L., Daily, G.C. and Ehrlich, P.R. (1996) Human appropriation of renewable freshwater, Science 271
(5250), 785–788.
Postel, S.L. (2000) Entering an era of water scarcity: The challenges ahead, Ecological Applications 10(4): 941-
948.
Renault, D. and Wallender, W.W. (2000) Nutritional water productivity and diets, Agricultural Water
Management 45: 275-296.
Rost, S., Gerten, D., Bondeau, A., Lucht, W., Rohwer, J., Schaphoff, S. (2008) Agricultural green and blue
water consumption and its influence on the global water system, Water Resources Research 44, W09405.
Seré, C. and Steinfeld, H. (1996) World livestock production systems: current status, issues and trends, Animal
Production and Health Paper 127, Food and Agriculture Organization, Rome, Italy.
www.fao.org/WAIRDOCS/LEAD/X6101E/X6101E00.HTM
Smart, A. J., Derner, J. D., Hendrickson, J. R., Gillen, R. L., Dunn, B. H., Mousel, E. M., Johnson, P. S., Gates,
R. N., Sedivec, K. K., Harmoney, K. R., Volesky, J. D. and Olson, K. C. (2010) Effects of grazing pressure
on efficiency of grazing on North American great plains rangelands, Rangeland Ecology & Management
63(4): 397-406.
Steinfeld, H., Gerber, P., Wassenaar, T., Castel, V., Rosales, M., de Haan, C. (2006) Livestock’s long shadow:
environmental issues and options, Food and Agriculture Organization, Rome, Italy,
ftp://ftp.fao.org/docrep/fao/010/a0701e/A0701E.pdf.

The water footprint of farm animals and animal products / 43
UNESCO (2009) Water in a changing world: The United Nations World Water Development Report 3,
UNESCO Publishing, Paris / Earthscan, London.
Van Breugel, P., Herrero, M., Van De Steeg, J. and Peden, D. (2010) Livestock water use and productivity in
the Nile Basin, Ecosystems 13(2): 205-221.
Wheeler, R.O., Cramer, G.L., Young, K.B., Ospina, E. (1981) The world livestock product, feedstuff, and food
grain system, an analysis and evaluation of system interactions throughout the world, with projections to
1985, Winrock International, Little Rock, AK, USA.
Wint, G.R.W. and Robinson, T.P. ( 2007) Gridded livestock of the world 2007, Food and Agriculture
Organization, Rome, Italy, www.fao.org/docrep/010/a1259e/a1259e00.htm.
Wirsenius, S. (2000) Human use of land and organic materials: Modelling the turnover of biomass in the global
food system, PhD thesis, Chalmers University of Technology and Göteborg University, Göteborg, Sweden,
available at: http://frt.fy.chalmers.se/PDF-docs/SWI_Thesis.pdf.
Zimmer, D. and Renault, D. (2003) Virtual water in food production and global trade: review of methodological
issues and preliminary results, In: Hoekstra, A.Y. (ed.) Virtual water trade: Proceedings of the
International Expert Meeting on Virtual Water Trade, Value of Water Research Report Series No.12,
UNESCO-IHE, Delft, The Netherlands, pp. 93-109.


Value of Water Research Report Series
Editorial board: Arjen Y. Hoekstra – University of Twente, [email protected] Hubert H.G. Savenije – Delft University of Technology, [email protected] Pieter van der Zaag – UNESCO-IHE Institute for Water Education, [email protected] 1. Exploring methods to assess the value of water: A case study on the Zambezi basin. A.K. Chapagain February 2000 2. Water value flows: A case study on the Zambezi basin. A.Y. Hoekstra, H.H.G. Savenije and A.K. Chapagain March 2000 3. The water value-flow concept. I.M. Seyam and A.Y. Hoekstra December 2000 4. The value of irrigation water in Nyanyadzi smallholder irrigation scheme, Zimbabwe. G.T. Pazvakawambwa and P. van der Zaag – January 2001 5. The economic valuation of water: Principles and methods J.I. Agudelo – August 2001 6. The economic valuation of water for agriculture: A simple method applied to the eight Zambezi basin countries J.I. Agudelo and A.Y. Hoekstra – August 2001 7. The value of freshwater wetlands in the Zambezi basin I.M. Seyam, A.Y. Hoekstra, G.S. Ngabirano and H.H.G. Savenije – August 2001 8. ‘Demand management’ and ‘Water as an economic good’: Paradigms with pitfalls H.H.G. Savenije and P. van der Zaag – October 2001 9. Why water is not an ordinary economic good H.H.G. Savenije – October 2001 10. Calculation methods to assess the value of upstream water flows and storage as a function of downstream benefits I.M. Seyam, A.Y. Hoekstra and H.H.G. Savenije – October 2001 11. Virtual water trade: A quantification of virtual water flows between nations in relation to international crop trade A.Y. Hoekstra and P.Q. Hung – September 2002 12. Virtual water trade: Proceedings of the international expert meeting on virtual water trade
A.Y. Hoekstra (ed.) – February 2003 13. Virtual water flows between nations in relation to trade in livestock and livestock products A.K. Chapagain and A.Y. Hoekstra – July 2003 14. The water needed to have the Dutch drink coffee A.K. Chapagain and A.Y. Hoekstra – August 2003 15. The water needed to have the Dutch drink tea A.K. Chapagain and A.Y. Hoekstra – August 2003 16. Water footprints of nations, Volume 1: Main Report, Volume 2: Appendices A.K. Chapagain and A.Y. Hoekstra – November 2004 17. Saving water through global trade A.K. Chapagain, A.Y. Hoekstra and H.H.G. Savenije – September 2005 18. The water footprint of cotton consumption A.K. Chapagain, A.Y. Hoekstra, H.H.G. Savenije and R. Gautam – September 2005 19. Water as an economic good: the value of pricing and the failure of markets P. van der Zaag and H.H.G. Savenije – July 2006 20. The global dimension of water governance: Nine reasons for global arrangements in order to cope with local water problems A.Y. Hoekstra – July 2006 21. The water footprints of Morocco and the Netherlands A.Y. Hoekstra and A.K. Chapagain – July 2006 22. Water’s vulnerable value in Africa P. van der Zaag – July 2006 23. Human appropriation of natural capital: Comparing ecological footprint and water footprint analysis A.Y. Hoekstra – July 2007 24. A river basin as a common-pool resource: A case study for the Jaguaribe basin in Brazil P.R. van Oel, M.S. Krol and A.Y. Hoekstra – July 2007 25. Strategic importance of green water in international crop trade M.M. Aldaya, A.Y. Hoekstra and J.A. Allan – March 2008

26. Global water governance: Conceptual design of global institutional arrangements M.P. Verkerk, A.Y. Hoekstra and P.W. Gerbens-Leenes – March 2008 27. Business water footprint accounting: A tool to assess how production of goods and services impact on freshwater
resources worldwide P.W. Gerbens-Leenes and A.Y. Hoekstra – March 2008 28. Water neutral: reducing and offsetting the impacts of water footprints A.Y. Hoekstra – March 2008 29. Water footprint of bio-energy and other primary energy carriers P.W. Gerbens-Leenes, A.Y. Hoekstra and Th.H. van der Meer – March 2008 30. Food consumption patterns and their effect on water requirement in China J. Liu and H.H.G. Savenije – March 2008 31. Going against the flow: A critical analysis of virtual water trade in the context of India’s National River Linking
Programme S. Verma, D.A. Kampman, P. van der Zaag and A.Y. Hoekstra – March 2008 32. The water footprint of India D.A. Kampman, A.Y. Hoekstra and M.S. Krol – May 2008 33. The external water footprint of the Netherlands: Quantification and impact assessment P.R. van Oel, M.M. Mekonnen and A.Y. Hoekstra – May 2008 34. The water footprint of bio-energy: Global water use for bio-ethanol, bio-diesel, heat and electricity P.W. Gerbens-Leenes, A.Y. Hoekstra and Th.H. van der Meer – August 2008 35. Water footprint analysis for the Guadiana river basin M.M. Aldaya and M.R. Llamas – November 2008 36. The water needed to have Italians eat pasta and pizza M.M. Aldaya and A.Y. Hoekstra – May 2009 37. The water footprint of Indonesian provinces related to the consumption of crop products F. Bulsink, A.Y. Hoekstra and M.J. Booij – May 2009 38. The water footprint of sweeteners and bio-ethanol from sugar cane, sugar beet and maize P.W. Gerbens-Leenes and A.Y. Hoekstra – November 2009 39. A pilot in corporate water footprint accounting and impact assessment: The water footprint of a sugar-containing
carbonated beverage A.E. Ercin, M.M. Aldaya and A.Y. Hoekstra – November 2009 40. The blue, green and grey water footprint of rice from both a production and consumption perspective A.K. Chapagain and A.Y. Hoekstra – March 2010 41. Water footprint of cotton, wheat and rice production in Central Asia M.M. Aldaya, G. Muñoz and A.Y. Hoekstra – March 2010 42. A global and high-resolution assessment of the green, blue and grey water footprint of wheat M.M. Mekonnen and A.Y. Hoekstra – April 2010 43. Biofuel scenarios in a water perspective: The global blue and green water footprint of road transport in 2030 A.R. van Lienden, P.W. Gerbens-Leenes, A.Y. Hoekstra and Th.H. van der Meer – April 2010 44. Burning water: The water footprint of biofuel-based transport P.W. Gerbens-Leenes and A.Y. Hoekstra – June 2010 45. Mitigating the water footprint of export cut flowers from the Lake Naivasha Basin, Kenya M.M. Mekonnen and A.Y. Hoekstra – June 2010 46. The green and blue water footprint of paper products: methodological considerations and quantification P.R. van Oel and A.Y. Hoekstra – July 2010 47. The green, blue and grey water footprint of crops and derived crop products M.M. Mekonnen and A.Y. Hoekstra – December 2010 48. The green, blue and grey water footprint of farm animals and animal products M.M. Mekonnen and A.Y. Hoekstra – December 2010 Reports can be downloaded from: www.waterfootprint.org www.unesco-ihe.org/value-of-water-research-report-series


UNESCO-IHEP.O. Box 30152601 DA DelftThe Netherlands
Website www.unesco-ihe.orgPhone +31 15 2151715
University of Twente
Delft University of Technology