ALUE OF ATER RESEARCH REPORT . 61 - water...
46
WATER FOOTPRINT OF TUNISIA FROM AN ECONOMIC PERSPECTIVE H. CHOUCHANE A.Y. HOEKSTRA M.S. K ROL M.M. MEKONNEN NOVEMBER 2013 V ALUE OF WATER RESEARCH REPORT SERIES NO. 61
Transcript of ALUE OF ATER RESEARCH REPORT . 61 - water...

WATER FOOTPRINT OF TUNISIA
FROM AN ECONOMIC PERSPECTIVE
H. CHOUCHANE
A.Y. HOEKSTRA
M.S. KROL
M.M. MEKONNEN
NOVEMBER 2013
VALUE OF WATER RESEARCH REPORT SERIES NO. 61


WATER FOOTPRINT OF TUNISIA FROM AN
ECONOMIC PERSPECTIVE
H. CHOUCHANE1
A.Y. HOEKSTRA1,*
M.S. KROL1
M.M. MEKONNEN1
NOVEMBER 2013
VALUE OF WATER RESEARCH REPORT SERIES NO. 61
1 Twente Water Centre, University of Twente, Enschede, The Netherlands
* Contact author: Arjen Y. Hoekstra, [email protected]

© 2013 The authors
Published by:
UNESCO-IHE Institute for Water Education
P.O. Box 3015
2601 DA Delft
The Netherlands
The Value of Water Research Report Series is published by UNESCO-IHE Institute for Water Education, in
collaboration with University of Twente, Enschede, and Delft University of Technology, Delft.
All rights reserved. No part of this publication may be reproduced, stored in a retrieval system, or transmitted, in
any form or by any means, electronic, mechanical, photocopying, recording or otherwise, without the prior
permission of the authors. Printing the electronic version for personal use is allowed.
Please cite this publication as follows:
Chouchane, H., Hoekstra, A.Y., Krol, M.S. and Mekonnen, M.M. (2013) Water footprint of Tunisia from an
economic perspective, Value of Water Research Report Series No. 61, UNESCO-IHE, Delft, the Netherlands.

Contents
Summary................................................................................................................................................................. 5
1. Introduction ....................................................................................................................................................... 7
2. Methods and data .............................................................................................................................................. 9
3. Results ............................................................................................................................................................. 13
3.1. Water footprint of national production ................................................................................................... 13
3.2. Water footprint of crop production at sub-national level ........................................................................ 14
3.3. Blue water footprint of crop production in the context of blue water availability .................................. 17
3.4. Economic water and land productivity at national level ......................................................................... 18
3.5. Economic water and land productivity at sub-national level .................................................................. 20
3.6. Virtual water flows related to trade in agricultural and industrial products............................................ 23
3.6.1. Tunisian virtual water import ..................................................................................................... 23
3.6.2. Tunisian virtual water export ...................................................................................................... 25
3.7. Water saving through virtual water trade ............................................................................................... 27
3.8. The water footprint of consumption ....................................................................................................... 28
4. Conclusions ..................................................................................................................................................... 29
References ............................................................................................................................................................ 31


Summary
In a country where freshwater resources are scarce and unevenly distributed, the choice of cropping patterns and
the import of food products can be important means to meet the need for food and lessen the pressure on
domestic water resources. This paper quantifies and analyses the water footprint of Tunisia at national and sub-
national level, assessing green, blue and grey water footprints for the period 1996-2005. It also assesses
economic water and land productivities related to crop production for irrigated and rain-fed agriculture and the
economic earnings related to export and the economic costs related to import per unit of water virtually traded.
The total water footprint of production in Tunisia was, on average, 19 Gm3/yr in the period 1996-2005. The
water footprint of crop production gave the largest contribution (87%). North Tunisia has the biggest share in
the total water footprint of crop production (70%), followed by Central (26%) and South Tunisia (4%). At
national level, tomatoes and potatoes were the main crops with relatively high economic water productivity,
with a Tunisian average of 1.08 and 0.87 US$/m3 respectively, while olives and barley were the main crops with
relatively low productivity, of 0.03 and 0.04 US$/m3 respectively. In terms of economic land productivity,
oranges had the highest productivity, with 4040 US$/ha, and barley the lowest, with 130 US$/ha. South Tunisia
has the lowest economic water and land productivities.
The total blue water footprint of crop production represents 31% of the total renewable blue water resources,
which means that Tunisia as a whole experiences significant water scarcity. The blue water footprint resting on
groundwater represents 62% of the total renewable groundwater resources, which means that the country is
facing a severe water scarcity related to groundwater. Considering surface and groundwater together, the highest
scarcity occurs in South Tunisia (severe water scarcity of 78%), followed by Central Tunisia (significant water
scarcity of 32%) and finally North Tunisia (moderate water scarcity of 23%). In terms of groundwater, all
regions of the country experience severe water scarcity, with a scarcity level of 47% for both North and Central
Tunisia, while the situation in South Tunisia is even more severe, with a blue WF resting on groundwater
exceeding the renewable groundwater resources.
The total water footprint of Tunisian consumption was 21 Gm3/yr, which is 2200 m
3/yr per citizen. The latter
figure is 60% larger than the world average. Consumption of agricultural products largely determines the total
water footprint related to consumption, contributing 98% to the total water footprint. The study shows that the
external water footprint of Tunisian consumption is 32% of its total water footprint, mainly due to food imports
from Europe.


1. Introduction
As one of the most arid countries in the Mediterranean, Tunisia suffers from high water scarcity. The shortage
of water resources is a limiting factor to food production. Not only a deliberate management of available
resources and choices in agricultural production, but also import of water in virtual form through international
trade, seems to be a way to fill the water deficit.
The concept of virtual water (Allan, 1993) is defined as the amount of water embedded in traded products.
Water-poor countries can save water by importing water-intensive commodities instead of producing them
domestically. International trade in agricultural commodities mainly depends on factors such as availability of
land, labour, technology, the costs of engaging in trade, national food policies and international trade
agreements (Hoekstra and Chapagain, 2008). Closely linked to the concept of virtual water is the concept of
water footprint (WF). The water footprint, introduced by Hoekstra in 2002, is an indicator of fresh water use of
a consumer or producer (Hoekstra et al., 2011). The WF informs not only about the level of water consumption
but also about where this water is used. The WF of a product is the volume of fresh water used to produce the
product, measured over the full supply chain (Hoekstra et al., 2011).
The WF has three components: blue, green and grey. The blue WF refers to consumption of blue water
resources (surface and groundwater) in the production process and along the supply chain of a product. The
green WF refers to consumption of green water resources (rainwater). The grey WF relates to pollution and is
defined as the volume of freshwater that is required to assimilate the load of pollutants given natural background
concentrations and existing ambient water quality standards (Hoekstra et al., 2011).
The WF of a crop is generally expressed in terms of m3/ton or litre/kg, but can also be expressed in terms of m
3
per monetary unit (Hoekstra et al., 2011). Garrido et al. (2009) show the usefulness of doing so in a case study
for Spain. They show that water scarcity affects water productivity; users become more efficient in their blue
water use as water becomes scarcer, but this behavioural adaptation only occurs in regions where water is scarce
and where blue water is the main contribution to total crop water use.
A concept closely related to water footprint is water productivity (WP). The increasing scarcity of freshwater
and the important role that water plays in food production imposes the need to optimise water use in all human
activities, particularly in agriculture, the main water-using sector worldwide. There is no common definition of
the term WP (Rodrigues and Pereira, 2009), but in all definitions, WP refers to the ratio of the net benefits from
crop, forestry, fishery, livestock or mixed agriculture systems to the amount of water used to produce those
benefits. Physical WP can be defined as the ratio of agricultural output to the amount of water consumed (‘crop
per drop’), which is mostly expressed in either blue water withdrawal or total (green plus blue) water
consumption (Kijne et al., 2003; Zwart and Bastiaanssen, 2004, 2007; Playan and Matoes, 2006; Molden, 2007).
Expressing WP in physical terms does not give insight in the economic benefit of water use; therefore it is also
useful to consider economic water productivity (‘dollar per drop’) (Cook et al., 2006; Pereira et al., 2009).
8 / Water footprint of Tunisia from an economic perspective
Economic water productivity (EWP) is defined as the value derived per unit of water used (Igbadun et al., 2006;
Palanisami et al., 2006; Teixeira et al., 2008; Vazifedoust et al., 2008; Garrido et al., 2009). This definition has
also been used to relate water use in agriculture to nutrition, jobs, welfare and environment, where the socio-
economic value added of water use can be expressed in terms of ‘nutrition per drop’, ‘job per drop’, etc. The
scope for increasing the value per unit of water used in agriculture is often bigger than the scope for increasing
physical water productivity (Molden et al., 2010). According to Molden et al. (2010), much of the potential for
increasing the harvest for common grains was met during the green revolution. The areas with still a high
potential for gains in physical water productivity are those with very low yields, such as sub-Saharan Africa and
South Asia. Strategies for increasing the net value of water used in agriculture include: increasing yield, re-
allocating water from low to higher valued crops or uses, lowering the cost of inputs and increasing the value of
ecological services of agriculture and obtaining multiple benefits per unit of water (Molden et al., 2010).
In this report we quantify and analyse the green, blue and grey water footprint within Tunisia, analyse the blue
water footprint into the context of blue water availability, assess economic water and land productivities related
to crop production for irrigated and rain-fed agriculture, estimate the economic earnings related to export and
the economic costs related to import per unit of water virtually traded, and estimate the external water footprint
and water dependency of Tunisian consumption. The period of analysis is 1996-2005. The study follows the
methodology described in The Water Footprint Assessment Manual (Hoekstra et al., 2011). The study adds to
earlier studies of water footprint and virtual water trade for Tunisia (Chapagain and Hoekstra, 2004; Chahed et
al., 2008; Chahed et al., 2011; Mekonnen and Hoekstra, 2011a) by adding the economic dimension in a
comprehensive national Water Footprint Assessment (WFA).

2. Methods and data
This study follows the terminology and methodology as set out in The Water Footprint Assessment Manual
(Hoekstra et al., 2011), which contains the global standard for Water Footprint Assessment (WFA) developed
by the Water Footprint Network. The national water footprint accounting scheme shows the various balances
that hold for the water footprint related to national consumption, the water footprint within the area of the
nation, the virtual water export and the virtual water import (Figure 1).
Figure 1. The national water footprint accounting scheme. Source: Hoekstra et al. (2011).
The WF within a nation is defined as the total freshwater volume consumed or polluted within the territory of
the nation as a result of different economic activities. The WF of national consumption is defined as the total
volume of freshwater that is used to produce the goods and services consumed by the inhabitants of the nation.
It consists of two components: the internal and external WF of national consumption. The internal WF is
defined as the use of domestic water resources to produce goods and services consumed by the nation’s
population. It is the sum of the WF within the nation minus the volume of virtual-water export to other nations
related to the export of products produced with domestic water resources. The external WF is defined as the
volume of water resources used in other nations to produce goods and services consumed by the population in
the nation under consideration. It is equal to the virtual-water import into the nation minus the volume of virtual-
water export to other nations as a result of re-export of imported products. The virtual-water export from a
nation consists of exported water of domestic origin and re-exported water of foreign origin. The virtual-water
import into a nation will partly be consumed, thus constituting the external WF of national consumption, and
may partly be re-exported. The sum of the virtual water import into a country and the WF within the area of the
nation is equal to the sum of the virtual water export from the nation and the WF of national consumption. This
sum is called the virtual-water budget of a nation. The national water saving associated with import can be
estimated by multiplying the imported product volume by the volume of water that would have been required to
produce the product domestically.
= + Internal
water
footprint
Water footpr.
of national
consumption
External
water
footprint
Virtual water
budget =
=
+
+ + +
= =
= + Virtual
water
export
Water use
for export
Virtual water import for re-
export
Water
footprint
within nation
Virtual
water
import

10 / Water footprint of Tunisia from an economic perspective
We will put the blue WF in the context of renewable blue water resources (blue water availability) in order to
assess water scarcity. Vörösmarty et al. (2000) and Oki and Kanae (2006) consider a country to be severely
water stressed if the ratio of blue water withdrawal to renewable blue water resources is higher than 40%. In our
case, we will relate water scarcity to the blue WF rather than to blue water withdrawal, which according to
Hoekstra et al. (2012) is a more meaningful basis to show water scarcity, since a significant share of withdrawn
water returns to rivers and aquifers and becomes available for reuse. The blue WF measures the consumptive
use of blue water resources. Following Hoekstra et al. (2012), we compare the blue WF to renewable blue water
resources. Table 1 shows the water scarcity thresholds used in this study, equivalent to the thresholds used by
Hoekstra et al. (2012).
Table 1. Water scarcity thresholds.
Blue water scarcity levels * Water scarcity thresholds
Low blue water scarcity < 20%
Moderate blue water scarcity 20-30%
Significant blue water scarcity 30-40%
Severe water scarcity > 40%
* Water scarcity defined as blue water footprint / renewable blue water resources.
We calculate overall water scarcity on annual basis as the ratio of total blue WF to total renewable blue water
resources, and groundwater scarcity as the ratio of the blue WF from groundwater sources to renewable
groundwater resources.
In calculating water productivities, we make a distinction between rain-fed and irrigated agriculture. In the
former case, the only water source is rainwater, so that we can speak about green water productivity. In the case
of irrigated agriculture, we distinguish between green and blue water productivity, because both rainwater and
irrigation water are consumed. In irrigated agriculture, green water productivity is defined as the yield that
would be obtained based on rain only (assuming that there is no irrigation) divided by the volume of green water
consumed. Blue water productivity is defined as the additional yield obtained through irrigation divided by the
blue water (irrigation water) evapotranspiration (Hoekstra, 2013).
The yield obtained from rain only is estimated based on the equation proposed by Doorenbos and Kassam
(1979):
(
)
(1)
where Ky is a yield response factor (water stress coefficient), Ya the actual yield (kg/ha), Ym the maximum yield,
obtained under optimal water supply conditions (kg/ha), ETa the actual crop evapotranspiration (mm/period) and
CWR the crop water requirement (mm/period). Following this equation, the green-water based yield (Ygreen, irrig)
in irrigated agriculture can be calculated from:

Water footprint of Tunisia from an economic perspective / 11
(
)
(2)
whereby Y tot,irrig is the yield occurring under full irrigation (rain + irrigation water), which is equal to the
maximum yield Ym; ETgreen is the evapotranspiration of green water that would have occurred without irrigation;
ETblue is the evapotranspiration of blue water. Data on Y tot,irrig, ETgreen, ETblue and Ky are obtained for all irrigated
crop areas from the grid-based study of Mekonnen and Hoekstra (2010).
The additional yield through irrigation is calculated as the total yield in irrigated agriculture (Y tot,irrig) minus the
yield that would have hypothetically occurred if there were no irrigation (Ygreen,irrig).
Figure 2 shows the relation between yield and evapotranspiration during the growing period and visualizes
green and blue water productivity through two subsequent slopes. The first (green) slope represents the green
water productivity, while the second (blue) slope represents the blue water productivity.
Figure 2. The relation between yield and evapotranspiration from a crop field. Green and blue water productivity
appear as the slopes of each of the two line segments drawn in the graph.
Economic water productivities (US$/m3) are calculated by multiplying physical water productivities (kg/m
3) by
crop value (US$/kg). For a farmer, economic blue water productivity may be a relevant variable for production
decisions, as blue water use goes along with direct production costs or blue water availability may be limiting
production. Land productivity may influence decisions on crop choices if land availability is most limiting for a
farmer.
The cost per unit of virtual water imported (US$/m3) is calculated by dividing the total value of imported crop
by its total WF. In a similar way, the earning per unit of virtual water exported (US$/m3) is calculated by
dividing the total value of exported crop by its total WF.
0
0,5
1
1,5
2
2,5
3
3,5
0 200 400 600 800 1000
Yil
ed
(k
g/h
a)
Crop evapotranspiration ET (mm)
Ygreen
Yblue
ETgreen ETblue
Ymax
CWR

12 / Water footprint of Tunisia from an economic perspective
The study is based on data for the period of 1996-2005. Table 2 gives an overview of all variables and sources
used in this study. We divided the country into three regions based on climate: North, Central and South (Figure
3). North has a Mediterranean climate, South has a Sahara climate, while Central has a climate in between. Each
region consists of governorates, administrative sub-units.
Table 2. Overview of input variables and sources used.
Input variable Source
Water footprint of crop production Mekonnen and Hoekstra (2010, 2011b)
Water footprint in other sectors Mekonnen and Hoekstra (2011a)
Yields and evapotranspiration in rain-fed and irrigated systems Mekonnen and Hoekstra (2010)
Water resources availability and water withdrawal at national level Ministry of Environment (2009)
Surface water availability and withdrawal at regional level Ministry of Agriculture (2005a)
Groundwater availability and withdrawal at regional level Ministry of Agriculture (2005b)
Crop values (producer prices) FAOSTAT (FAO, 2009)
Virtual water flows Hoekstra and Mekonnen (2012)
Economic values of imports and exports ITC (2007)
Water footprint of national consumption Hoekstra and Mekonnen (2012)
Figure 3. Bioclimatic map of Tunisia. Source: Chelbi et al. (2009).

3. Results
3.1. Water footprint of national production
The total water footprint (WF) of Tunisian production was about 19 Gm3/yr (89% green, 8% blue, 3% grey; see
Table 3) over the period 1996-2005. The WF of crop production gave the largest contribution to the total WF of
production (87%), followed by grazing (11%). The remaining part (2%) represents domestic water supply,
livestock production and industrial activities.
Table 3. The national water footprint of Tunisia and its components (Mm3/yr). Period 1996-2005.
Water footprint
of crop production
Water footprint of
grazing
Water footprint of
animal water supply
Water footprint of industrial production
Water footprint of domestic
water supply
Total water footprint
Green 14820 2000 - - - 16820
Blue 1330 - 60 10 40 1440
Grey 450 - - 50 220 720
Total 16600 2000 60 60 260 19000
Source: Mekonnen and Hoekstra (2011a).
Considering the WF of crops per unit of weight (m3/ton), pistachios had the largest WF, about 98000 m
3/ton,
which is much more than the global average of 11000 m3/ton. The smallest WF of crops was found for lettuce
and chicory, about 80 m3/ton, which is less than the world global average (200 m
3/ton) (Appendix I).
The WFs of the main crops in terms of total national production are listed in Table 4. The listed crops represent
86% of the total blue WF of crop production. Among these crops, almonds have the largest WF per unit of
weight, about 20820 m3/ton, which is more than twice the global average WF for almonds. Tunisian almonds
use about four times more green water compared to the global average, while they consume about the global
average amount of blue water. Tomatoes have the smallest WF with 120 m3/ton, which is below the global
average (210 m3/ton). Dates, almonds, figs and grapes are the biggest blue water users with 3270, 1950, 1740
and 1080 m3/ton respectively. These figures are higher than the global average, especially for grapes, which uses
ten times the global average amount of blue water.
Olives alone account for about 46% of the total WF of crop production in Tunisia. About 79% of the total green
WF is due to the production of olives (7270 Mm3/yr), wheat (3170 Mm
3/yr) and barley (1220 Mm
3/yr)
(Appendix II). The total blue WF is dominated by dates and olives (together 47%) and, to a lesser extent grapes,
wheat and almonds.

14 / Water footprint of Tunisia from an economic perspective
Table 4. The average green, blue and grey water footprint of main crops in Tunisia (1996-2005).
Crop
Total water footprint (Mm
3/yr)
Water footprint per ton of crop (m
3/ton)
Global average water footprint (m
3/ton)
Green Blue Grey Total Green Blue Grey Total Green Blue Grey Total
Almonds 790 90 50 930 17760 1950 1110 20820 4630 1910 1510 8050
Barley 1220 30 60 1310 3560 80 180 3820 1210 80 130 1420
Carrots 10 30 2 40 260 530 30 820 110 30 60 200
Dates 110 350 10 470 1030 3270 80 4390 930 1250 100 2280
Figs 70 40 4 120 2810 1740 170 4720 1500 1540 280 3280
Grapes 70 130 10 200 550 1080 60 1690 430 100 90 610
Olives 7270 270 30 7570 8790 330 40 9150 2470 500 50 3010
Oranges 40 20 2 70 370 230 20 620 400 110 50 560
Potatoes 40 40 10 80 110 120 20 260 190 30 60 290
Tomatoes 50 40 10 100 60 50 10 120 110 60 40 210
Wheat 3170 100 150 3420 2380 70 110 2560 1280 340 210 1830
Source: Mekonnen and Hoekstra (2011a). Note that ton refers to metric ton.
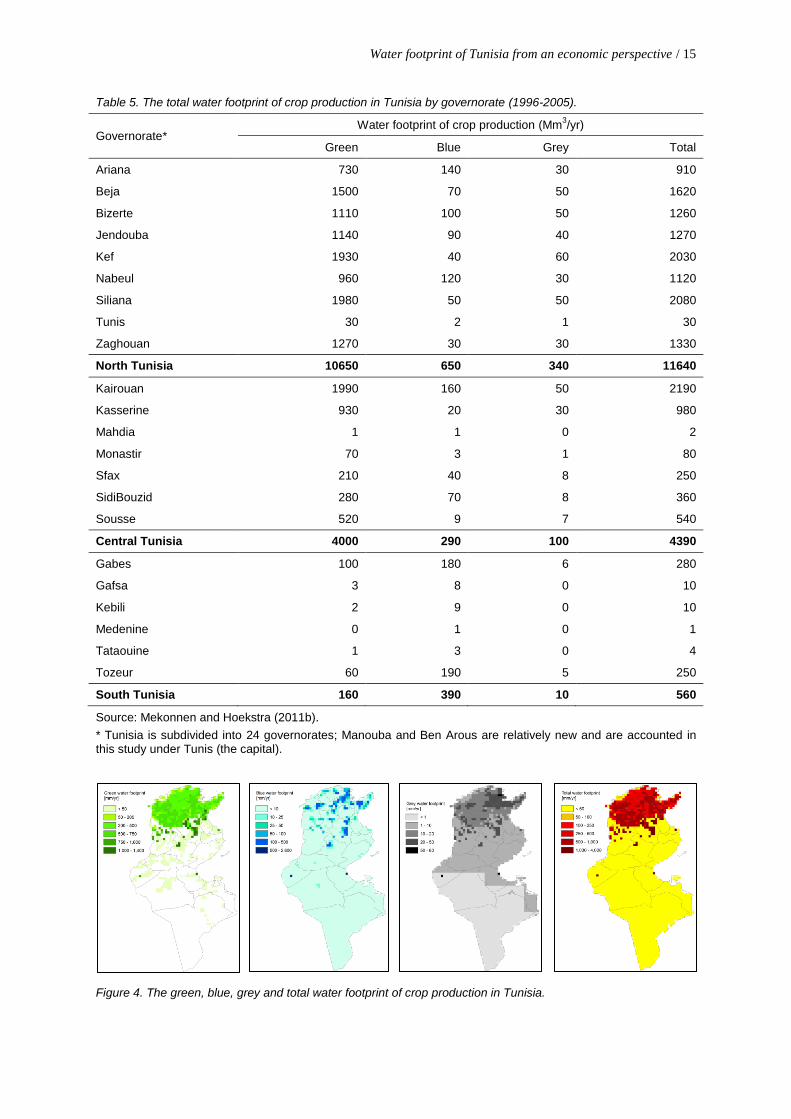
3.2. Water footprint of crop production at sub-national level
The total water footprint of crop production in Tunisia is about 16.6 Gm3/yr. In this total, green water takes the
biggest share (89%), while the blue and grey components contribute 8% and 3% respectively. North Tunisia
takes the biggest share in the total WF of crop production (70%), followed by Central (26%) and South (4%)
(Table 5; Figure 4). Kairouan in Central Tunisia is the governorate with the largest crop-related WF, with 2.2
Gm3/yr, which represents 13% of the crop-related WF in the whole country and half of the Central Tunisian
WF. The governorates in the surroundings of the river basin Medjerda, such as Beja, Jandouba, Kef and Siliana,
had the largest WF in the North of the country and together account for almost 7 Gm3/yr, which represent 43%
of the total WF of crop production in Tunisia. Regarding blue water, North Tunisia has the biggest share in the
total blue WF, with 650 Mm3/yr, which represent 49% of the total blue WF of crop production in the country.
South and Central Tunisia follow with 28% and 23% respectively. In South Tunisia, the driest part of the
country, the total WF of crop production is dominated by blue water (with a contribution of 68%). The
governorates Gabes and Tozeur have the biggest blue WF, mainly because of the production of dates.
Table 6 shows the WF per unit of weight for the most important crops, averaged over the regions North, Central
and South. There is a clear difference in WFs and crop water requirements between the three regions. While the
difference between North and Central is not so big, results for North and South differ considerably, especially
for olives, wheat, almonds, figs and barley. In terms of the blue WF, a unit of wheat or barley grown in South
Tunisia uses almost 12 times more blue water than the same crop grown in North, largely because irrigation is
the dominant production system in South, whereas rain-fed production is dominant in Central and North.
Almond and figs grown in Central Tunisia use less blue water than in the other regions, while tomatoes and
carrots grown in South Tunisia have the smallest blue WF per ton.
Water footprint of Tunisia from an economic perspective / 15
Table 5. The total water footprint of crop production in Tunisia by governorate (1996-2005).
Governorate* Water footprint of crop production (Mm
3/yr)
Green Blue Grey Total
Ariana 730 140 30 910
Beja 1500 70 50 1620
Bizerte 1110 100 50 1260
Jendouba 1140 90 40 1270
Kef 1930 40 60 2030
Nabeul 960 120 30 1120
Siliana 1980 50 50 2080
Tunis 30 2 1 30
Zaghouan 1270 30 30 1330
North Tunisia 10650 650 340 11640
Kairouan 1990 160 50 2190
Kasserine 930 20 30 980
Mahdia 1 1 0 2
Monastir 70 3 1 80
Sfax 210 40 8 250
SidiBouzid 280 70 8 360
Sousse 520 9 7 540
Central Tunisia 4000 290 100 4390
Gabes 100 180 6 280
Gafsa 3 8 0 10
Kebili 2 9 0 10
Medenine 0 1 0 1
Tataouine 1 3 0 4
Tozeur 60 190 5 250
South Tunisia 160 390 10 560
Source: Mekonnen and Hoekstra (2011b).
* Tunisia is subdivided into 24 governorates; Manouba and Ben Arous are relatively new and are accounted in this study under Tunis (the capital).
Figure 4. The green, blue, grey and total water footprint of crop production in Tunisia.

16 / Water footprint of Tunisia from an economic perspective
Table 6. The average green, blue and grey water footprint and crop water requirement of main crops in Tunisia per region (1996-2005).
Crop
Water footprint per ton of crop (m3/ton) Total water footprint (Mm
3/yr) Crop water
requirement
(m3/ha) Green Blue Grey Total Green Blue Grey Total
No
rth
Almonds 16590 2480 1010 20090 380 60 20 460 9220
Barley 3520 90 180 3790 930 10 50 990 4570
Carrots 290 500 40 820 10 20 1 30 6340
Dates - - - - - - - - -
Figs 2840 1680 170 4690 60 40 4 110 7780
Grapes 780 1120 70 1970 30 40 3 70 7160
Olives 8650 400 40 9080 4660 170 20 4850 8150
Oranges 370 220 20 610 40 20 2 60 7780
Potatoes 130 110 20 260 30 40 10 70 3550
Tomatoes 70 40 10 120 40 30 10 70 3510
Wheat 2360 90 110 2550 2820 70 130 3020 4980
Cen
tral
Almonds 18290 1490 1200 20980 410 30 30 470 9550
Barley 3470 240 200 3910 290 10 20 320 4710
Carrots 490 380 70 940 3 7 0 10 6650
Dates - - - - - - - - -
Figs 3460 1200 220 4880 10 10 1 10 8030
Grapes 700 1300 70 2060 30 50 3 90 7510
Olives 8840 470 40 9350 2580 100 10 2690 8420
Oranges 370 240 20 630 3 3 0 10 8020
Potatoes 110 130 20 270 10 20 0 40 3660
Tomatoes 80 40 10 120 10 10 2 20 3640
Wheat 2350 230 120 2710 350 20 20 390 5120
Sou
th
Almonds 20810 2330 2080 25220 10 1 1 10 11780
Barley 3770 1050 310 5130 2 1 0 3 6070
Carrots 670 30 150 860 0 0 0 0 7760
Dates 1040 3290 80 4390 110 350 10 470 13350
Figs 4940 820 500 6260 0 0 0 0 9920
Grapes 450 1870 70 2380 10 30 1 40 8730
Olives 10750 930 80 11760 30 3 0 40 10390
Oranges 210 510 30 750 0 0 0 0 9480
Potatoes 70 210 30 310 0 0 0 0 4310
Tomatoes 150 1 20 170 0 0 0 0 4500
Wheat 2780 1230 210 4220 3 1 0 4 6610
Source: Mekonnen and Hoekstra (2011b).
Water footprint of Tunisia from an economic perspective / 17
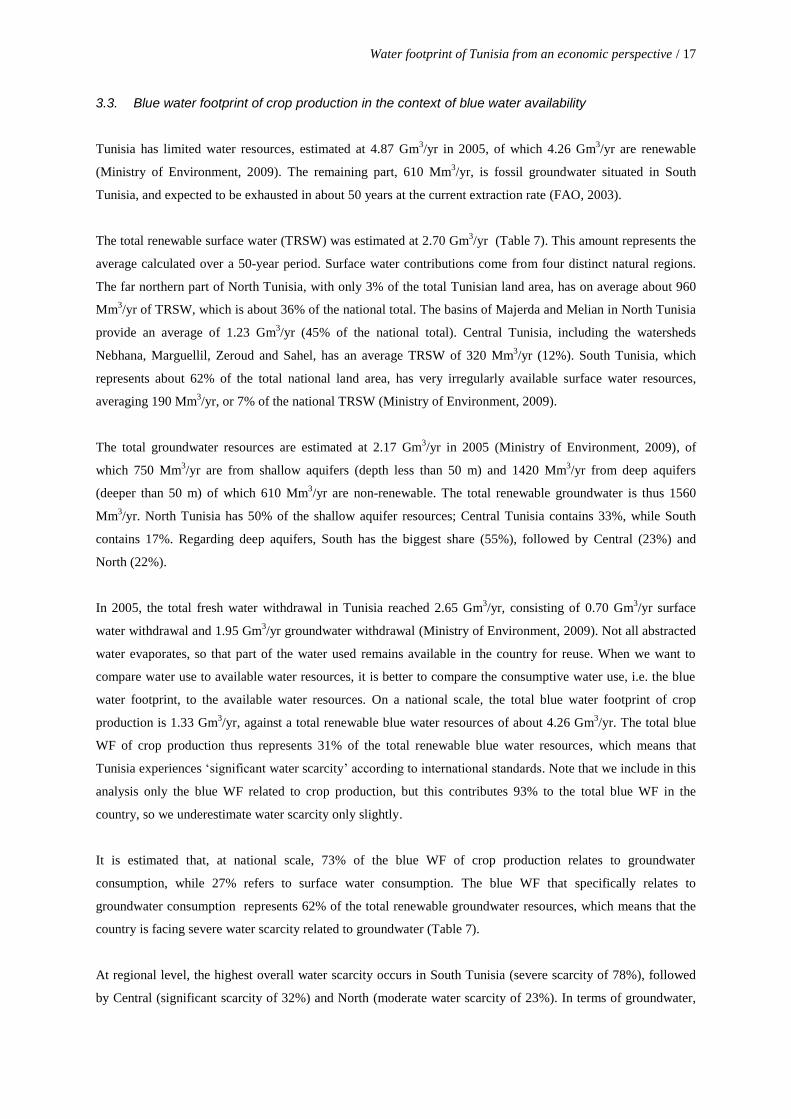
3.3. Blue water footprint of crop production in the context of blue water availability
Tunisia has limited water resources, estimated at 4.87 Gm3/yr in 2005, of which 4.26 Gm
3/yr are renewable
(Ministry of Environment, 2009). The remaining part, 610 Mm3/yr, is fossil groundwater situated in South
Tunisia, and expected to be exhausted in about 50 years at the current extraction rate (FAO, 2003).
The total renewable surface water (TRSW) was estimated at 2.70 Gm3/yr (Table 7). This amount represents the
average calculated over a 50-year period. Surface water contributions come from four distinct natural regions.
The far northern part of North Tunisia, with only 3% of the total Tunisian land area, has on average about 960
Mm3/yr of TRSW, which is about 36% of the national total. The basins of Majerda and Melian in North Tunisia
provide an average of 1.23 Gm3/yr (45% of the national total). Central Tunisia, including the watersheds
Nebhana, Marguellil, Zeroud and Sahel, has an average TRSW of 320 Mm3/yr (12%). South Tunisia, which
represents about 62% of the total national land area, has very irregularly available surface water resources,
averaging 190 Mm3/yr, or 7% of the national TRSW (Ministry of Environment, 2009).
The total groundwater resources are estimated at 2.17 Gm3/yr in 2005 (Ministry of Environment, 2009), of
which 750 Mm3/yr are from shallow aquifers (depth less than 50 m) and 1420 Mm
3/yr from deep aquifers
(deeper than 50 m) of which 610 Mm3/yr are non-renewable. The total renewable groundwater is thus 1560
Mm3/yr. North Tunisia has 50% of the shallow aquifer resources; Central Tunisia contains 33%, while South
contains 17%. Regarding deep aquifers, South has the biggest share (55%), followed by Central (23%) and
North (22%).
In 2005, the total fresh water withdrawal in Tunisia reached 2.65 Gm3/yr, consisting of 0.70 Gm
3/yr surface
water withdrawal and 1.95 Gm3/yr groundwater withdrawal (Ministry of Environment, 2009). Not all abstracted
water evaporates, so that part of the water used remains available in the country for reuse. When we want to
compare water use to available water resources, it is better to compare the consumptive water use, i.e. the blue
water footprint, to the available water resources. On a national scale, the total blue water footprint of crop
production is 1.33 Gm3/yr, against a total renewable blue water resources of about 4.26 Gm
3/yr. The total blue
WF of crop production thus represents 31% of the total renewable blue water resources, which means that
Tunisia experiences ‘significant water scarcity’ according to international standards. Note that we include in this
analysis only the blue WF related to crop production, but this contributes 93% to the total blue WF in the
country, so we underestimate water scarcity only slightly.
It is estimated that, at national scale, 73% of the blue WF of crop production relates to groundwater
consumption, while 27% refers to surface water consumption. The blue WF that specifically relates to
groundwater consumption represents 62% of the total renewable groundwater resources, which means that the
country is facing severe water scarcity related to groundwater (Table 7).
At regional level, the highest overall water scarcity occurs in South Tunisia (severe scarcity of 78%), followed
by Central (significant scarcity of 32%) and North (moderate water scarcity of 23%). In terms of groundwater,

18 / Water footprint of Tunisia from an economic perspective
all regions of the country experience severe water scarcity, with a scarcity of 47% in both North and Central and
123% in South Tunisia. The latter means that consumptive use of groundwater exceeds the renewable
groundwater available in this region.
It is to be observed that the water scarcity figures presented here are calculated on an annual rather than a
monthly basis. As noted by Hoekstra et al. (2012), this may lead to an underestimation of scarcity as
experienced in the drier parts of the year, particularly because of the variability in available surface water
resources within the year. For estimating groundwater scarcity, the annual approach will generally suffice
because of the relatively long residence time and buffering capacity of groundwater systems. Groundwater
scarcity figures are possibly underestimated, though, because return flows in groundwater-based irrigation are
here assumed to return to the groundwater system from which abstraction took place, while part of the return
flow may be surface runoff.
Table 7. Blue water footprint of crop production in the context of blue water availability.
Blue water footprint (Mm
3/yr)
Blue water resources (Mm3/yr)
Water scarcity (%) e
Renewable blue water resources
Fossil d Total
Ground-water
a
Surface water
a Total
b
Ground-water
d
Surface water
c Total
Ground-water
Overall
North 320 330 650 680 2190 2870 2870 47 23
Central 270 20 290 570 320 890 890 47 32
South 380 10 390 310 190 500 610 1110 123 78
Total 970 360 1330 1560 2700 4260 610 4870 62 31
Sources: a
Based on WF data from Mekonnen and Hoekstra (2011b) and ratios of surface water withdrawal to groundwater withdrawal per region from Ministry of Agriculture (2005a,b). Using the surface/groundwater ratios for withdrawals for estimating the surface/groundwater ratios for blue WFs implicitly assumes that the fractions of return flow are similar for surface and groundwater abstractions.
b Mekonnen and Hoekstra (2011b)
c Ministry of Environment (2009)
d Ministry of Agriculture (2005b)
e Own elaboration
3.4. Economic water and land productivity at national level
An analysis of water management in a Mediterranean country must have a focus on irrigated agriculture
(Garrido et al., 2009). Although irrigated land accounts to only 7% of the total cultivated land in Tunisia
(Chahed et al., 2008), it contributes to more than 35% of the total production of the agricultural sector and
accounts for more than 80% of the total water withdrawal in the country (Ministry of Environment, 2009).
Based on producer prices, Table 8 presents the economic water productivity (EWP) of main crops in Tunisia, for
both rain-fed and irrigated agriculture. In the case of irrigated agriculture, we distinguish between green and
blue EWP. For the listed crops, the average EWP in Tunisian crop production is around 0.32 US$/m3, which is
slightly less than the figure found in a study for Spain by Garrido et al. (2009), who found an average value of
around 0.25 €/m3, which is equivalent to about 0.35 US$/m
3. The average EWP in Tunisian rain-fed agriculture
(0.35 US$/m3) was a bit higher than for irrigated agriculture (0.32 US$/m
3). For several of the selected crops,

Water footprint of Tunisia from an economic perspective / 19
EWP in rain-fed and irrigated production systems are found to be very similar. In the case of carrots and
potatoes, however, total EWP is larger in irrigated agriculture than in rain-fed agriculture. For dates and
tomatoes, we found the reverse.
In irrigated agriculture, the blue water applied is not always more productive than the green water. For carrots,
potatoes and tomatoes the blue EWP in irrigated agriculture was found to be higher than the green EWP, but for
dates and grapes the reverse was found. While most of the blue water in Tunisia is consumed in dates, grapes,
olives and wheat production (Table 4), the blue EWP of these crops is low when compared to potatoes and
tomatoes, which have the highest blue EWPs, with 0.97 and 1.13 US$/m3 respectively.
Table 8. Physical and economic water productivity of main crops in Tunisia at national level (1996-2005).
Crop
Physical water productivity (kg/m3)a
Producer price
(US$/kg)b
Economic water productivity (US$/m3)c
Total (green) WP in
rain-fed agric.
Green WP in
irrigated agric.
Blue WP in
irrigated agric.
Total WP in
irrigated agric.
Average WP in
irrigated & rain-fed
agric.
Total (green) EWP in rain-fed agric.
Green EWP in irrigated
agric.
Blue EWP in irrigated
agric.
Total EWP in irrigated
agric.
Average EWP in irrigated
& rain-fed agric.
Almonds 0.05 0.05 0.05 0.05 0.05 1.70 0.09 0.09 0.09 0.09 0.09
Barley 0.28 0.24 0.31 0.27 0.28 0.14 0.04 0.03 0.04 0.04 0.04
Carrots 1.04 1.00 1.40 1.27 1.27 0.13 0.14 0.13 0.19 0.17 0.17
Dates 0.40 0.61 0.11 0.23 0.23 1.01 0.40 0.62 0.11 0.23 0.23
Figs 0.22 0.22 0.22 0.22 0.22 0.47 0.10 0.10 0.10 0.10 0.10
Grapes - 0.79 0.52 0.61 0.61 0.32 - 0.25 0.17 0.20 0.20
Olives 0.11 0.11 0.11 0.11 0.11 0.32 0.03 0.03 0.03 0.03 0.03
Oranges 1.69 1.68 1.68 1.68 1.68 0.34 0.58 0.58 0.58 0.58 0.58
Potatoes 3.86 3.75 4.72 4.27 4.24 0.21 0.80 0.77 0.97 0.88 0.87
Tomatoes 10.75 8.77 9.62 9.17 9.24 0.12 1.26 1.03 1.13 1.07 1.08
Wheat 0.41 0.40 0.50 0.44 0.41 0.24 0.10 0.09 0.12 0.10 0.10
Sources: a Own elaboration based on data from Mekonnen and Hoekstra (2010)
b FAOSTAT (FAO, 2009)
c Own elaboration
Table 9 presents economic land productivity (ELP), again distinguishing between rain-fed and irrigated
agriculture. In terms of total ELP, oranges, tomatoes and dates had the highest ELPs, with 4040, 3770 and 3080
US$/ha respectively, while barley and olives had the lowest ELPs, with 130 and 170 US$/ha respectively.
Economic land productivity is higher in irrigated agriculture than in rain-fed agriculture for all selected crops.
Given the fact that, on average, economic water productivities in irrigated agriculture are not higher than in rain-
fed agriculture, one can conclude that irrigation water is generally not applied to increase water productivity
(US$/m3) but rather to increase land productivity (US$/ha). Enlarging the irrigated area for the listed crops will
increase land productivity. But, since water is a limiting factor in production, it may be most beneficial to
increase irrigated areas only for crops with high economic water productivity and for which the difference
between ELP in rain-fed and irrigated agriculture is considerable, like for example potatoes.
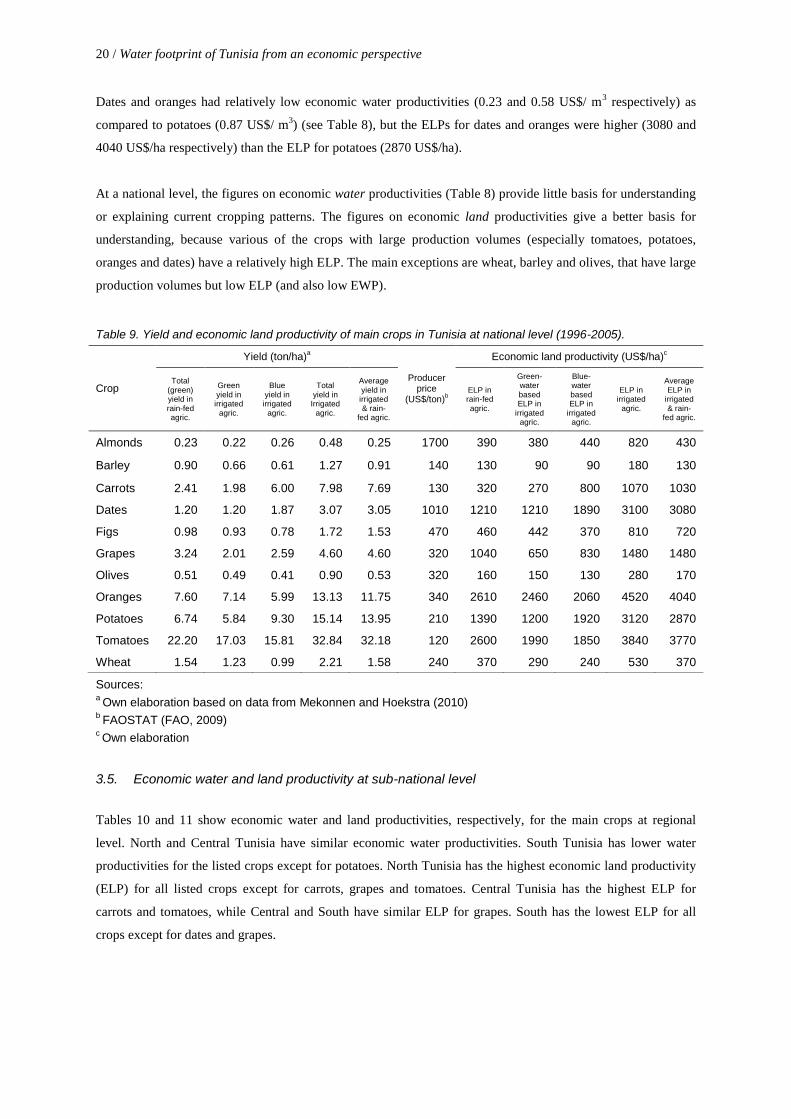
20 / Water footprint of Tunisia from an economic perspective
Dates and oranges had relatively low economic water productivities (0.23 and 0.58 US$/ m3 respectively) as
compared to potatoes (0.87 US$/ m3) (see Table 8), but the ELPs for dates and oranges were higher (3080 and
4040 US$/ha respectively) than the ELP for potatoes (2870 US$/ha).
At a national level, the figures on economic water productivities (Table 8) provide little basis for understanding
or explaining current cropping patterns. The figures on economic land productivities give a better basis for
understanding, because various of the crops with large production volumes (especially tomatoes, potatoes,
oranges and dates) have a relatively high ELP. The main exceptions are wheat, barley and olives, that have large
production volumes but low ELP (and also low EWP).
Table 9. Yield and economic land productivity of main crops in Tunisia at national level (1996-2005).
Sources: a
Own elaboration based on data from Mekonnen and Hoekstra (2010) b
FAOSTAT (FAO, 2009) c Own elaboration
3.5. Economic water and land productivity at sub-national level
Tables 10 and 11 show economic water and land productivities, respectively, for the main crops at regional
level. North and Central Tunisia have similar economic water productivities. South Tunisia has lower water
productivities for the listed crops except for potatoes. North Tunisia has the highest economic land productivity
(ELP) for all listed crops except for carrots, grapes and tomatoes. Central Tunisia has the highest ELP for
carrots and tomatoes, while Central and South have similar ELP for grapes. South has the lowest ELP for all
crops except for dates and grapes.
Crop
Yield (ton/ha)a
Producer price
(US$/ton)b
Economic land productivity (US$/ha)c
Total (green) yield in rain-fed agric.
Green yield in irrigated
agric.
Blue yield in irrigated
agric.
Total yield in
Irrigated agric.
Average yield in irrigated & rain-
fed agric.
ELP in rain-fed agric.
Green-water based ELP in
irrigated agric.
Blue-water based ELP in
irrigated agric.
ELP in irrigated
agric.
Average ELP in
irrigated & rain-
fed agric.
Almonds 0.23 0.22 0.26 0.48 0.25 1700 390 380 440 820 430
Barley 0.90 0.66 0.61 1.27 0.91 140 130 90 90 180 130
Carrots 2.41 1.98 6.00 7.98 7.69 130 320 270 800 1070 1030
Dates 1.20 1.20 1.87 3.07 3.05 1010 1210 1210 1890 3100 3080
Figs 0.98 0.93 0.78 1.72 1.53 470 460 442 370 810 720
Grapes 3.24 2.01 2.59 4.60 4.60 320 1040 650 830 1480 1480
Olives 0.51 0.49 0.41 0.90 0.53 320 160 150 130 280 170
Oranges 7.60 7.14 5.99 13.13 11.75 340 2610 2460 2060 4520 4040
Potatoes 6.74 5.84 9.30 15.14 13.95 210 1390 1200 1920 3120 2870
Tomatoes 22.20 17.03 15.81 32.84 32.18 120 2600 1990 1850 3840 3770
Wheat 1.54 1.23 0.99 2.21 1.58 240 370 290 240 530 370

Water footprint of Tunisia from an economic perspective / 21
Table 10. Physical and economic water productivity of main crops in Tunisia at regional level (1996-2005).
Crop
Physical water productivity (m3/kg)
a
Producer
price b
(US$/kg)
Economic water productivity (US$/m3)c
Total (green) WP in
rain-fed agric.
Green WP in irrigated
agric.
Blue WP in irrigated
agric.
Total WP in
irrigated agric.
Average WP in
irrigated & rain-fed
agric.
Total (green) EWP in rain-fed agric.
Green EWP in irrigated
agric.
Blue EWP in irrigated
agric.
Total EWP in irrigated
agric.
Average EWP in irrigated
& rain-fed agric.
Nort
h
Almonds 0.05 0.05 0.05 0.05 0.05 1.70 0.09 0.09 0.09 0.09 0.09
Barley 0.28 0.23 0.36 0.28 0.28 0.14 0.04 0.03 0.05 0.04 0.04
Carrots 1.04 1.02 1.41 1.28 1.28 0.13 0.14 0.14 0.19 0.17 0.17
Date - - - - - - - - - - -
Figs 0.22 0.22 0.22 0.22 0.22 0.47 0.10 0.10 0.10 0.10 0.10
Grapes - 0.81 0.56 0.66 0.66 0.32 - 0.26 0.18 0.21 0.21
Olives 0.11 0.11 0.11 0.11 0.11 0.32 0.03 0.03 0.03 0.03 0.03
Oranges 1.69 1.68 1.68 1.68 1.68 0.34 0.58 0.58 0.58 0.58 0.58
Potatoes 3.86 3.75 4.71 4.28 4.25 0.21 0.80 0.77 0.97 0.88 0.88
Tomatoes 10.72 8.84 9.67 9.21 9.29 0.12 1.25 1.03 1.13 1.08 1.09
Wheat 0.41 0.40 0.51 0.44 0.41 0.24 0.10 0.10 0.12 0.10 0.10
Centr
al
Almonds 0.05 0.05 0.05 0.05 0.05 1.70 0.08 0.09 0.09 0.09 0.09
Barley 0.26 0.24 0.31 0.27 0.26 0.14 0.04 0.03 0.04 0.04 0.04
Carrots 1.00 0.94 1.36 1.24 1.24 0.13 0.13 0.13 0.18 0.17 0.17
Dates - - - - - - - - - - -
Figs 0.21 0.22 0.22 0.22 0.22 0.47 0.10 0.10 0.10 0.10 0.10
Grapes - 0.77 0.52 0.61 0.61 0.32 - 0.25 0.17 0.19 0.19
Olives 0.11 0.11 0.11 0.11 0.11 0.32 0.03 0.03 0.03 0.03 0.03
Oranges 1.67 1.68 1.68 1.68 1.68 0.34 0.58 0.58 0.58 0.58 0.58
Potatoes 3.86 3.57 4.69 4.28 4.26 0.21 0.80 0.73 0.97 0.88 0.88
Tomatoes 10.98 8.70 9.62 9.21 9.22 0.12 1.28 1.02 1.13 1.08 1.08
Wheat 0.38 0.38 0.50 0.43 0.39 0.24 0.09 0.09 0.12 0.10 0.09
South
Almonds 0.04 0.04 0.04 0.04 0.04 1.70 0.07 0.07 0.07 0.07 0.07
Barley 0.21 0.43 0.12 0.21 0.21 0.14 0.03 0.06 0.02 0.03 0.03
Carrots 1.02 1.03 1.43 1.30 1.29 0.13 0.14 0.14 0.19 0.17 0.17
Dates 0.40 0.61 0.11 0.23 0.23 1.01 0.40 0.62 0.11 0.23 0.23
Figs 0.17 0.17 0.17 0.17 0.17 0.47 0.08 0.08 0.08 0.08 0.08
Grapes - 1.14 0.39 0.54 - 0.32 - 0.37 0.13 0.17 0.17
Olives 0.09 0.09 0.09 0.09 0.09 0.32 0.03 0.03 0.03 0.03 0.03
Oranges 1.45 1.39 1.39 1.39 1.40 0.34 0.50 0.48 0.48 0.48 0.48
Potatoes 3.96 3.74 4.86 4.42 4.34 0.21 0.81 0.77 1.00 0.91 0.89
Tomatoes 8.62 6.00 7.59 7.23 8.61 0.12 1.01 0.70 0.89 0.85 1.01
Wheat 0.19 0.20 0.39 0.34 0.28 0.24 0.04 0.05 0.09 0.08 0.07
Sources: a Own elaboration based on data from Mekonnen and Hoekstra (2010)
b FAOSTAT (FAO, 2009)
c Own elaboration

22 / Water footprint of Tunisia from an economic perspective
Table 11. Yield and economic land productivity of main crops in Tunisia at regional level (1996-2005).
Crop
Yield (ton/ha)a
Producer price
(US$/ton)b
Economic land productivity (US$/ha)c
Total (green) yield in rain-fed agric.
Green yield in irrigated
agric.
Blue yield in irrigated
agric.
Total yield in Irrigated
agric.
Average yield in irrigated & rain-
fed agric.
ELP in rain-fed agric.
Green-water based ELP in
irrigated agric.
Blue-water based ELP in
irrigated agric.
ELP in irrigated
agric.
Average ELP in
irrigated & rain-
fed agric.
No
rth
Almonds 0.24 0.23 0.25 0.48 0.36 1700 410 390 420 810 460
Barley 0.90 0.63 0.63 1.27 1.08 140 130 90 90 180 130
Carrots 2.35 2.05 5.92 7.96 5.16 130 320 270 790 1070 1020
Dates - - - - - - - - - - -
Figs 0.99 0.95 0.77 1.72 1.35 470 470 450 360 810 740
Grapes 3.24 2.20 2.38 4.58 3.91 320 1040 710 760 1470 1470
Olives 0.52 0.50 0.39 0.90 0.71 320 160 160 120 280 170
Oranges 7.50 7.23 5.89 13.12 10.31 340 2580 2490 2030 4510 4090
Potatoes 6.95 5.92 9.23 15.14 11.05 210 1430 1220 1900 3120 2910
Tomatoes 23.47 17.55 15.30 32.85 28.16 120 2750 2050 1790 3840 3750
Wheat 1.51 1.28 0.94 2.22 1.86 240 360 300 220 530 380
Cen
tra
l
Almonds 0.22 0.21 0.27 0.48 0.35 1700 370 350 470 820 410
Barley 0.81 0.60 0.66 1.27 1.04 140 110 80 90 180 120
Carrots 2.14 1.77 6.24 8.02 5.08 130 290 240 840 1070 1060
Dates - - - - - - - - - - -
Figs 0.91 0.84 0.88 1.72 1.31 470 430 400 420 810 670
Grapes - 2.10 2.51 4.62 4.62 320 - 680 810 1480 1480
Olives 0.48 0.46 0.44 0.90 0.69 320 150 150 140 280 160
Oranges 6.96 6.40 6.76 13.16 10.06 340 2390 2200 2330 4530 4040
Potatoes 6.21 4.79 10.30 15.09 10.65 210 1280 990 2120 3110 2870
Tomatoes 23.16 15.52 17.31 32.83 28.00 120 2710 1820 2030 3840 3830
Wheat 1.30 1.07 1.14 2.21 1.76 240 310 250 270 520 340
So
uth
Almonds 0.12 0.11 0.37 0.48 0.30 1700 210 190 630 820 230
Barley 0.43 0.72 0.53 1.25 0.84 140 60 100 70 170 80
Carrots 1.64 2.07 5.99 8.06 4.85 130 220 280 800 1080 970
Dates 1.20 1.20 1.87 3.07 3.05 1010 1210 1210 1890 3100 3080
Figs 0.44 0.40 1.32 1.72 1.08 470 210 190 620 810 240
Grapes - 1.93 2.68 4.61 4.61 320 - 620 860 1480 1480
Olives 0.23 0.24 0.66 0.90 0.57 320 70 80 210 280 80
Oranges 3.23 2.91 10.23 13.14 8.19 340 1110 1000 3520 4520 3360
Potatoes 3.06 5.07 10.07 15.15 9.10 210 630 1050 2080 3120 2510
Tomatoes 11.36 6.16 26.51 32.67 22.02 120 1330 720 3100 3820 1330
Wheat 0.44 0.37 1.84 2.21 1.32 240 100 90 440 520 190
Sources: a Own elaboration based on data from Mekonnen & Hoekstra (2010)
b FAOSTAT (FAO, 2009)
c Own elaboration

Water footprint of Tunisia from an economic perspective / 23
When comparing rain-fed and irrigated agriculture, we find that the ELP of irrigated lands is much higher than
the ELP of rain-fed lands for all listed crops. In South Tunisia, which is much drier than North and Central, the
blue-water based ELP in irrigated agriculture is higher for all crops than in North and Central, which illustrates
the greater importance of irrigation water to yields in the South.
The same conclusion that we have drawn at the national level is valid at regional level: enlarging the irrigation
areas will generally increase ELPs, particularly in the South. But primarily in the South, water availability is the
key limiting factor in production, not land availability, so that optimizing EWP will be more advisable than
optimizing ELP.
For South Tunisia it is especially attractive to grow dates, because the climate and growing conditions are very
suitable for this crop; dates are not grown in North and Central. The ELP for dates is high as well, but the EWP
is not. From the perspective of a most economic use of scarce freshwater resources in South, it is more attractive
to grow potatoes, tomatoes and oranges than to grow dates.
The study of economic water and land productivity has a number of limitations that are mostly due to a lack of
data. First, we assumed the producer price of crops to be the same for the Tunisian regions, where differences
can somewhat affect the results at regional level. Second, we did not distinguish between prices for rain-fed and
irrigated crops. Irrigated crops may have a higher price due to better control of the production process, which
would translate into a higher economic water and land productivity in irrigated agriculture. Third, we calculate
economic water and land productivity by multiplying physical productivity and price, while it is better to look at
the value added per unit of production. Finally, we assumed full irrigation in irrigated agriculture, while in
reality irrigation may (deliberately or involuntarily) be limited.
3.6. Virtual water flows related to trade in agricultural and industrial products
3.6.1. Tunisian virtual water import
The total gross virtual water import in the period 1996-2005 was 8100 Mm3/yr (71% blue, 18% green and 11%
grey, Table 12). The largest contribution (94%) related to import of crop products. Imports of animal products
and industrial products contributed with 2% and 4% respectively. The economic value of imports was 10330
million US$/yr, of which 80% related to import of industrial products, 18% to import of crop products and 2%
to import of animal products. The average cost of imported commodities per unit of virtual water imported was
1.28 US$/m3.
Crops responsible for relatively large virtual water imports are cotton, wheat, soybean, maize, sugar and barley.
The import of cotton products (mainly from France, Belgium and Italy) and wheat (mainly from Canada, France
and Spain) were responsible for 2200 and 1850 Mm3/yr, respectively (Table 13), which together represents 53%
of the total virtual water imported. The total economic value of crop products imported by Tunisia was 1840

24 / Water footprint of Tunisia from an economic perspective
million US$/yr. About 51% of the total cost is related to import of cotton products and 16% to import of sugar
products. The average cost of imported crops per unit of virtual water imported was 0.24 US$/m3.
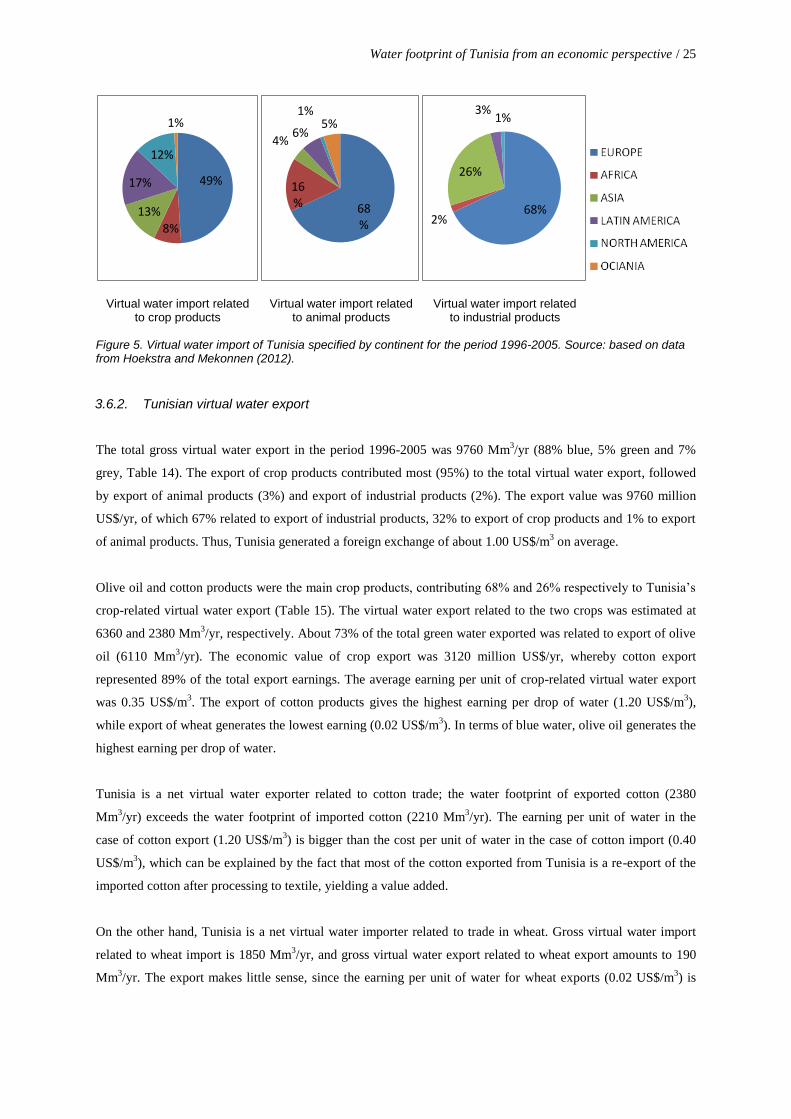
About 49% of the crop-related virtual water imports of Tunisia comes from Europe (Figure 5), mainly from
France, Italy, Germany and Belgium; 17% comes from Latin America, 13% from Asia, 12% from North
America and 1 % from Oceania. For animal products and industrial products, the biggest part of the virtual
water imported, about 68% comes from Europe, mainly from France and Germany for animal products and from
France and Italy for industrial products. Figure 5 summarizes the results per continent, where Latin America
includes Mexico, and Europe includes Turkey and the Russian Federation.
Table 12. Tunisia’s virtual water import and economic value of imports. Period: 1996-2005.
Related to crop
products Related to animal
products Related to
industrial products Total virtual water
imported
Green (Mm3/yr)
a 5610 140 - 5750
Blue (Mm3/yr)
a 1400 20 30 1450
Grey (Mm3/yr)
a 600 10 280 890
Total (Mm3/yr)
a 7610 170 310 8100
Economic value of imports (million US$/yr)
b
1840 150 8330 10330
Value per unit of imported virtual water (US$/m
3)c
0.24 0.85 27.00 1.28
Sources: a Hoekstra and Mekonnen (2012)
b ITC (2007)
c Own elaboration
Table 13. Imported crops with a large volume of virtual water. Period: 1996-2005.
Crop
% of the total
virtual water
imported a
Virtual water import (Mm3/yr)
b Economic
value (million US$/yr)
c
Value per unit of imported water
(US$/m3) a Green Blue Grey Total
Cotton 29% 1250 760 200 2210 940 0.40
Wheat 24% 1650 60 150 1850 200 0.10
Soybeans 15% 840 280 20 1140 140 0.10
Maize 8% 500 40 100 640 100 0.20
Sugar 7% 380 110 30 520 290 0.60
Barley 4% 300 10 30 340 40 0.10
Coffee 2% 180 1 2 190 10 0.10
Other 11% 520 140 70 730 130 0.20
Total 100% 5610 1400 600 7610 1840 0.25
Sources: a Own elaboration
b Hoekstra and Mekonnen (2012)
c ITC (2007)
Water footprint of Tunisia from an economic perspective / 25
Virtual water import related to crop products
Virtual water import related to animal products
Virtual water import related to industrial products
Figure 5. Virtual water import of Tunisia specified by continent for the period 1996-2005. Source: based on data from Hoekstra and Mekonnen (2012).
3.6.2. Tunisian virtual water export
The total gross virtual water export in the period 1996-2005 was 9760 Mm3/yr (88% blue, 5% green and 7%
grey, Table 14). The export of crop products contributed most (95%) to the total virtual water export, followed
by export of animal products (3%) and export of industrial products (2%). The export value was 9760 million
US$/yr, of which 67% related to export of industrial products, 32% to export of crop products and 1% to export
of animal products. Thus, Tunisia generated a foreign exchange of about 1.00 US$/m3 on average.
Olive oil and cotton products were the main crop products, contributing 68% and 26% respectively to Tunisia’s
crop-related virtual water export (Table 15). The virtual water export related to the two crops was estimated at
6360 and 2380 Mm3/yr, respectively. About 73% of the total green water exported was related to export of olive
oil (6110 Mm3/yr). The economic value of crop export was 3120 million US$/yr, whereby cotton export
represented 89% of the total export earnings. The average earning per unit of crop-related virtual water export
was 0.35 US$/m3. The export of cotton products gives the highest earning per drop of water (1.20 US$/m
3),
while export of wheat generates the lowest earning (0.02 US$/m3). In terms of blue water, olive oil generates the
highest earning per drop of water.
Tunisia is a net virtual water exporter related to cotton trade; the water footprint of exported cotton (2380
Mm3/yr) exceeds the water footprint of imported cotton (2210 Mm
3/yr). The earning per unit of water in the
case of cotton export (1.20 US$/m3) is bigger than the cost per unit of water in the case of cotton import (0.40
US$/m3), which can be explained by the fact that most of the cotton exported from Tunisia is a re-export of the
imported cotton after processing to textile, yielding a value added.
On the other hand, Tunisia is a net virtual water importer related to trade in wheat. Gross virtual water import
related to wheat import is 1850 Mm3/yr, and gross virtual water export related to wheat export amounts to 190
Mm3/yr. The export makes little sense, since the earning per unit of water for wheat exports (0.02 US$/m
3) is
49%
8%
13%
17%
12%
1%
68%
16%
4% 6%
1% 5%
68% 2%
26%
3% 1%

26 / Water footprint of Tunisia from an economic perspective
very low compared to other crops and also much lower than the cost per unit of water for imported wheat (0.10
US$/m3).
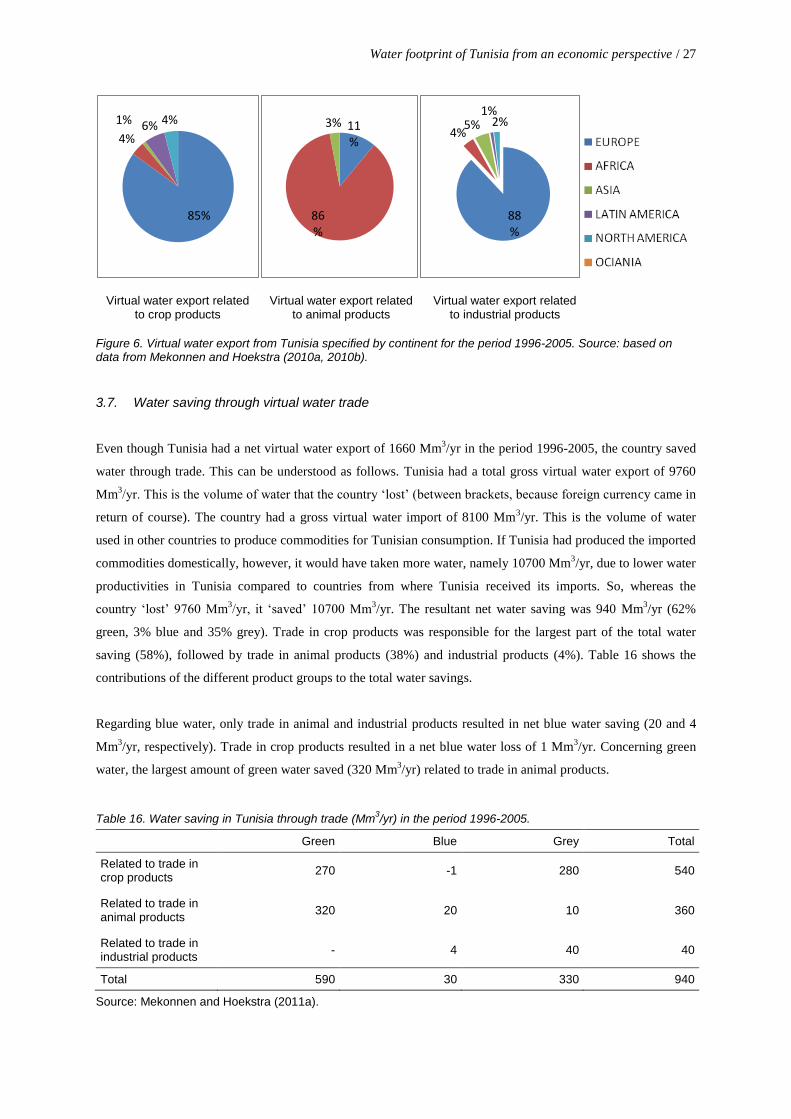
About 85% of the crop-related virtual water export goes to Europe (Figure 6), mainly to Italy, Spain and France;
6% goes to Latin America, 4% to North America, 4% to Africa, and 1% to Asia. For animal products the biggest
part goes to Africa (86%), mainly Libya, while for industrial products the biggest part is exported to Europe
(88%), mainly to France, Italy and Germany.
Table 14. Tunisia’s virtual water export and economic value of exports. Period: 1996-2005.
Related to crop products
Related to animal products
Related to industrial products
Total virtual water exported
Greena (Mm
3/yr) 8320 260 - 8580
Bluea
(Mm3/yr) 400 40 10 460
Grey a (Mm
3/yr) 570 20 130 730
Total (Mm3/yr) 9300 320 150 9760
Economic value of exports (million US$/yr)
b
3120 20 6620 9760
Value per unit of exported water (US$/m
3)c
0.35 0.05 50 1.00
Sources: a Hoekstra and Mekonnen (2012)
b ITC (2007)
c Own elaboration
Table 15. Exported crops with a large volume of virtual water. Period: 1996-2005.
Crop % of the total virtual water exported
a
Virtual water export (Mm3/yr)
b Economic
value (million US$/yr)
c
Value per unit of exported water
(US$/m
3)a
Green Blue Grey Total Green Blue Total
Olive oil 68% 6110 230 30 6360 230 0.03 1.00 0.04
Cotton 26% 1860 0 520 2380 2780 1.50 - 1.20
Wheat 2% 170 10 10 190 4 0.02 0.70 0.02
Dates 2% 40 120 3 160 70 1.80 0.60 0.40
Other 2% 140 60 20 220 50 0.30 0.90 0.20
Total 100% 8320 400 570 9300 3120 0.40 0.90 0.30
Sources: a
Own elaboration b
Hoekstra and Mekonnen (2012) c ITC (2007)
Water footprint of Tunisia from an economic perspective / 27
Virtual water export related to crop products
Virtual water export related to animal products
Virtual water export related to industrial products
Figure 6. Virtual water export from Tunisia specified by continent for the period 1996-2005. Source: based on data from Mekonnen and Hoekstra (2010a, 2010b).
3.7. Water saving through virtual water trade
Even though Tunisia had a net virtual water export of 1660 Mm3/yr in the period 1996-2005, the country saved
water through trade. This can be understood as follows. Tunisia had a total gross virtual water export of 9760
Mm3/yr. This is the volume of water that the country ‘lost’ (between brackets, because foreign currency came in
return of course). The country had a gross virtual water import of 8100 Mm3/yr. This is the volume of water
used in other countries to produce commodities for Tunisian consumption. If Tunisia had produced the imported
commodities domestically, however, it would have taken more water, namely 10700 Mm3/yr, due to lower water
productivities in Tunisia compared to countries from where Tunisia received its imports. So, whereas the
country ‘lost’ 9760 Mm3/yr, it ‘saved’ 10700 Mm
3/yr. The resultant net water saving was 940 Mm
3/yr (62%
green, 3% blue and 35% grey). Trade in crop products was responsible for the largest part of the total water
saving (58%), followed by trade in animal products (38%) and industrial products (4%). Table 16 shows the
contributions of the different product groups to the total water savings.
Regarding blue water, only trade in animal and industrial products resulted in net blue water saving (20 and 4
Mm3/yr, respectively). Trade in crop products resulted in a net blue water loss of 1 Mm
3/yr. Concerning green
water, the largest amount of green water saved (320 Mm3/yr) related to trade in animal products.
Table 16. Water saving in Tunisia through trade (Mm3/yr) in the period 1996-2005.
Green Blue Grey Total
Related to trade in crop products
270 -1 280 540
Related to trade in animal products
320 20 10 360
Related to trade in industrial products
- 4 40 40
Total 590 30 330 940
Source: Mekonnen and Hoekstra (2011a).
85%
4%
1% 6% 4% 11%
86%
3%
88%
4% 5%
1% 2%

28 / Water footprint of Tunisia from an economic perspective
3.8. The water footprint of consumption
The water footprint (WF) of Tunisian consumption was 2200 m3/yr per capita over the period 1996-2005, which
is about 60% larger than the world average of 1390 m3/yr (Hoekstra and Mekonnen, 2012). Consumption of
agricultural products largely determines the total WF related to consumption, contributing 98% to the total WF.
Consumption of industrial products and domestic water supply contribute only 1% each.
In total terms, the WF of Tunisian consumption was 21 Gm3/yr (81% green, 12% blue and 7% grey). Wheat was
the product with the single largest contribution, with 480 m3/yr per capita (91% green, 3% blue, 6% grey). Table
17 shows the top-five of products with the largest contribution to the WF of Tunisian consumption. The external
component of the WF consumption was 6810 Mm3/yr (70% green, 19% blue, 11% grey), which represents 32%
of the total WF, while the internal component was 14220 Mm3/yr (87% green, 8% blue, 5% grey) (Figure 7). In
terms of its water needs, Tunisia has a particular dependency on Europe; the largest part of the country’s virtual
water imports come from Italy, France and Germany.
Table 17. Top-five of products with the largest contribution to the water footprint of Tunisian consumption.
Product Water footprint (m
3/yr/capita)
Green Blue Grey Total
Wheat 440 10 30 480
Bovine meat 280 20 10 320
Olive oil 210 10 0 220
Meat, other 140 60 10 200
Milk and its products, excluding butter 130 20 10 160
Source: Mekonnen and Hoekstra (2011a).
Figure 7. Composition of the water footprint of Tunisian consumption in the period 1996-2005. Source: based on data from Mekonnen and Hoekstra (2011a).
Agricultural products
66%
Industrial products 0.15%
Domestic water supply 1.75%
Agricultural products
31%
Industrial products 1%
External water footprint
32%
Internal water footprint
68%

4. Conclusions
The water footprint (WF) of Tunisian production was 19 Gm3/yr in the period 1996-2005. Green water had the
biggest contribution (89%), but there are regional differences. Crops in South generally have a larger total WF
and larger blue water fraction than in Central and North Tunisia, caused by differences in climate. South is an
arid region, which explains why the WF in this region is dominantly blue.
The country suffers significant water scarcity, with a national blue WF of crop production amounting to 31% of
the country’s renewable blue water resources. South Tunisia experiences severe water scarcity, Central Tunisia
significant scarcity and North Tunisia moderate scarcity. For groundwater in particular, all three regions
experience severe water scarcity, with the worst situation in South, where the blue WF resting on groundwater
exceeds renewable groundwater resources by an estimated 23%.
The overview of water productivities of different crops shows that 91% of the total blue WF of crop production
in the country relates to crops produced at blue water productivities of less than 0.20 US$/m3. Only tomatoes,
potatoes and oranges show larger blue water productivities. The smallest blue water productivity is found for
olives (0.03 US$/m3), one of the major export products of the country.
Among the major crops grown in Tunisia, oranges, tomatoes and potatoes have relatively large economic water
and land productivities. The same, but to a lesser extent, is true for dates, which are grown in South only.
Relatively low economic water and land productivities are found for wheat, barley, almonds, olives and figs. It is
further found that irrigation generally increases economic land productivity (US$/ha), but not water productivity
(US$/m3). The contribution of blue water to economic land productivity is largest in the dry South.
Relatively large virtual water imports relate to imports of cotton, sugar and cereal crops, mainly from Europe.
Olive oil and cotton are the crop products contributing most to virtual water export. The average cost of imported
crops per unit of virtual water imported was 0.24 US$/m3, while the earning of exported crops per unit of virtual
water exported was 0.34 US$/m3. Gross virtual water export from Tunisia exceeds gross virtual water import,
but at least the benefit per drop of water used for making export products is larger than the cost per drop of water
in import products.
Tunisia is not water self-sufficient with 32% of its total WF of consumption outside its borders, mostly in
Europe. Given the water scarcity in the country it is unlikely that the country will be able to decrease its
dependency on external water resources.
The results of this study show that the scarce Tunisian water resources have mainly been allocated to uses with
low economic productivity; this could be the result of the agricultural policy followed by the Tunisian
government. Over the last forty years, Tunisia’s agricultural policy focussed on ensuring food security. by
encouraging the production of staple crops such as wheat, barley and olive oil and livestock products such as
milk and meat. This policy intended to ensure a lower price for those products than the international market price

30 / Water footprint of Tunisia from an economic perspective
(Ministry of Agriculture, 2002). However, in the last few years, Tunisian authorities have started to re-think the
country’s agricultural policy and integrate it with the management of its scarce water resources. By the end of
1999, Tunisia signed a free trade agreement with the EU, encouraging imports in the agricultural sector
(Ministry of Agriculture, 2002). Where market conditions exist and staple foods may be supplied from other
sources, farmers can be encouraged to shift from low-value to high-value crops and increase the economic
productivity of water in agriculture (FAO, 2012).
References
Allan, J.A. (1993) Fortunately there are substitutes for water otherwise our hydro-political futures would be
impossible, In: ODA, Priorities for water resources allocation and management, ODA, London, pp. 13-
26.
Chahed, J., Hamdane, A. and Besbes, M. (2008) A comprehensive water balance of Tunisia: blue water, green
water and virtual water, Water International, 33(4): 415-424.
Chahed, J., Besbes, M. and Hamdane, A. (2011) Alleviating water scarcity by optimizing "Green Virtual-
Water": the case of Tunisia, In: Hoekstra, A.Y., Aldaya, M.M. and Avril, B. (eds.) Proceedings of the
ESF Strategic Workshop on accounting for water scarcity and pollution in the rules of international trade,
Amsterdam, 25-26 November 2010, Value of Water Research Report Series No. 54, UNESCO-IHE,
Delft, the Netherlands, pp. 99-113.
Chapagain, A.K. and Hoekstra, A.Y. (2004) Water footprints of nations, Value of Water Research Report Series
No.16, UNESCO-IHE. Delft, The Netherlands.
Chelbi, I. Kaabi, B. Béjaoui, M. Derbali, M. and Zhioua E. (2009) Spatial Correlation Between
PhlebotomuspapatasiScopoli (Diptera: Psychodidae) and Incidence of Zoonotic Cutaneous Leishmaniasis
in Tunisia, Journal of Medical Entomology 46(2): 400-402.
Cook, S., Gichuki, F. and Turral, H. (2006) Water productivity: estimation at plot, farm and basin scale. Basin
Focal Project Working Paper No. 2, GGIAR Challenge Program on Water and Food.
Doorenbos, J. and Kassam, A.H. (1979) Yield response to water, FAO Drainage and Irrigation Paper 33, Food
and Agriculture Organization, Rome, Italy.
FAO (2003). Review of world water resources by country, FAO water report No.23, Food and Agriculture
Organization, Rome, Italy.
FAO (2009) FAOSTAT on-line database, Food and Agriculture Organization, Rome, Italy, http://faostat.fao.org
FAO (2012) Cropping with water scarcity, FAO water report No. 38, Food and Agriculture Organization, Rome,
Italy.
Garrido A., Llamas, R. Varela-Ortega, C. Novo, P. Rodríguez-Casado, R. and Aldaya, M. M. (2010) Water
footprint and virtual water trade in Spain: Policy implications, Springer, New York, USA.
Hoekstra, A. Y. (2013) The water footprint of modern consumer society, Routledge, London, UK.
Hoekstra, A.Y. and Chapagain, A.K. (2008) Globalization of water: Sharing the planet’s freshwater resources,
Blackwell Publishing, Oxford, UK.
Hoekstra, A.Y. and Mekonnen, M.M. (2012) The water footprint of humanity, Proceedings of the National
Academy of Sciences, 109(9): 3232–3237.
Hoekstra, A.Y., Chapagain, A.K., Aldaya, M.M. and Mekonnen, M.M. (2011) The water footprint assessment
manual: Setting the global standard, Earthscan, London, UK.
Hoekstra, A.Y., Mekonnen, M.M., Chapagain, A.K., Mathews, R.E. and Richter, B.D. (2012) Global monthly
water scarcity: Blue water footprints versus blue water availability, PLoS ONE 7(2): e32688.
Igbadun, H.E, Mahoo, H.F, Tarimo, A.K.P.R and Salim, B.A (2006) Crop water productivity of an irrigated
maize crop in Mkoji sub-catchment of the great Ruaha River Basin, Tanzania, Agricultural Water
Management, 85: 141-150.

32 / Water footprint of Tunisia from an economic perspective
ITC (2007) SITA version 1996-2005 in SITC, [DVD-ROM], International trade centre, Geneva, Switzerland.
Kijne, J.W., Barker, R. and Molden, D. (2003) Water productivity in agriculture: limits and opportunities for
development, IWMI and CABI Publisher, Wallingford, UK.
Mekonnen, M.M. and Hoekstra, A.Y. (2010) The green, blue and grey water footprint of crops and derived crop
products, Value of Water Research Report Series No. 47, UNESCO-IHE, Delft, The Netherlands,
ww.waterfootprint.org/Reports/Report47-WaterFootprintCrops-Vol1.pdf.
Mekonnen, M.M. and Hoekstra, A.Y. (2011a) National water footprint accounts: the green, blue and grey water
footprint of production and consumption, Value of Water Research Report Series No. 50, UNESCO-IHE,
Delft, The Netherlands, http://www.waterfootprint.org/Reports/Report50-NationalWaterFootprints-
Vol1.pdf.
Mekonnen, M.M. and Hoekstra, A.Y. (2011b) The green, blue and grey water footprint of crops and derived
crop products, Hydrology and Earth System Sciences, 15(5): 1577-1600.
Ministry of Agriculture (2002) Ninth plan of development (1997-2001) (French), Tunis, Tunisia.
Ministry of Agriculture (2005a) Yearbook of surface water resources (French), General Directorate of Water
Resources, Tunis, Tunisia.
Ministry of Agriculture (2005b) Yearbook of groundwater resources (French), General Directorate of Water
Resources, Tunis, Tunisia.
Ministry of Environment (2009) Indicators for sustainable management of water resources (French), Tunis,
Tunisia.
Molden, D. (2007) Water for food, Water for life: a comprehensive Assessment of Water Management in
Agriculture, Earthscan London, UK, and IWMI, Colombo, Sri Lanka.
Molden, D., Oweis, T., Steduto, P., Bindraban, P., Hanjra, M.A. and Kijne, J. (2010) Improving agricultural
Water productivity: Between optimism and caution, Agricultural Water Management, 97:528-535.
Oki T, Kanae S. (2006) Global hydrological cycles and world water resources, Science 313(5790): 1068–1072.
Palanisami, K ., Senthilvel, S., Ranganathan, C.R. , Ramesh, T. (2006) Water productivity at different scales
under canal, tank and well irrigation systems, Centre for Agricultural and Rural Development Studies,
Tamil Nadu Agricultural University, Coimbatore, India.
Pereira L.S., Cordery I., Iacovides I. (2009) Coping with water scarcity: Addressing the challenges, Springer,
Dordrecht, the Netherlands.
Playan, E., Matoes, L. (2006) Modernization and optimization of irrigation systems to increase water
productivity, Agricultural Water Management, 80: 100-116.
Rodrigues, G.C., Pereira, L.S. (2009) Assessing economic impacts of deficit irrigation as related to water
productivity and water costs, Biosystems Engeneering, 103: 536-551.
Teixeira, A.H. de C., Bastiaanssen, W.G.M., Moura, M.S.B., Soares, J.M., Ahmad, M.D. and Bos, M.G. (2008)
Energy and water balance measurement for water productivity analysis in irrigated mango trees,
Northeast Brazil, Agricultural and Forest Meterology, 148: 1524-1537.
Vazifedoust, M., Van Dam, J.C., Feddes, R.A. and Feizi, M. (2008) Increasing water productivity of irrigated
crops under limited water supply at field scale, Agricultural Water Management, 95: 89-102.
Vörösmarty, C.J., Green, P., Salisbury, J., and Lammers, R.B. (2000) Global water resources: vulnerability from
climate change and population growth, Science 289: 284–288.

Zwart, S.J., Bastiaanssen, W.G.M. (2004) Review of measured crop water productivity values for irrigated
wheat, rice, cotton and maize, Agricultural Water Management, 69: 115-133.
Zwart, S.J., Bastiaanssen, W.G.M. (2007) SEBAL for detecting spatial variation of water productivity and scope
for improvement in eight irrigated wheat systems, Agricultural Water Management, 89: 287-296.

Appendix I: The average water footprint per ton of crop at regional and national level (m
3/ton)
Period 1996-2005
Product code
(FAOSAT)
Product description (FAOSTAT)
North Central South Tunisia average World average
Green Blue Grey Total Green Blue Grey Total Green Blue Grey Total Green Blue Grey Total Green Blue Grey Total
15 wheat 2357 85 110 2552 2351 231 123 2705 2781 1227 211 4219 2375 72 109 2556 1277 342 207 1826
44 Barley 3519 86 180 3785 3469 241 197 3907 3774 1047 306 5127 3561 75 181 3817 1213 79 131 1423
75 Oats 26739 11325 1511 39575 27846 11058 1688 40592 40976 193 3437 44606 24687 13776 1458 39921 1479 181 128 1788
83 Sorghum 10068 3520 506 14094 8048 5338 482 13868 10693 4158 833 15684 9708 3958 493 14159 2857 103 87 3047
97 Triticale 801 0 90 891 793 3 90 886 984 0 97 1081 803 1 89 893 826 38 89 953
108 Cereals,nes 227 2278 0 2505 2640 1983 0 4623 4636 23 0 4659 1907 2676 0 4583 3316 115 9 3440
116 Potatoes 125 112 21 258 110 134 22 266 65 213 28 306 114 122 20 256 191 33 63 287
157 Sugar beet 52 49 28 129 44 50 28 122 0 0 0 0 54 47 28 129 82 26 25 133
176 Beans, dry 2524 97 465 3086 2242 194 457 2893 1422 318 454 2194 2510 102 455 3067 3945 125 983 5053
181 Broad beans, horse
1961 85 378 2424 1722 232 377 2331 1128 226 433 1787 1978 64 372 2414 1317 205 496 2018
187 Peas, dry 2868 65 426 3359 3175 88 526 3789 2770 606 724 4100 2899 55 424 3378 1453 33 493 1979
191 Chick peas 2962 25 456 3443 3074 143 548 3765 3455 1158 924 5537 2941 15 458 3414 2972 224 981 4177
201 Lentils 5860 254 736 6850 5701 267 780 6748 2758 1145 699 4602 5915 224 725 6864 4324 489 1060 5873
205 Vetches 2620 60 404 3084 2833 163 494 3490 2171 367 624 3162 2613 60 396 3069 2031 109 213 2353
211 Pulses nes 1682 50 264 1996 1850 65 324 2239 1226 345 353 1924 1697 43 262 2002 2217 250 650 3117
221 Almonds, with shell
16598 2484 1005 20087 18290 1488 1201 20979 20813 2330 2079 25222 17763 1950 1105 20818 4632 1908 1507 8047
223 Pistachios 69228 27982 4876 102086 73679 15743 5599 95021 58373 8713 7827 74913 80863 12022 5480 98365 3095 7602 666 11363
260 Olives 8652 396 36 9084 8839 467 39 9345 10752 928 76 11756 8790 325 37 9152 2470 499 45 3014
267 Sunflower seed 3069 0 23 3092 3091 0 24 3115 3212 0 40 3252 3093 0 23 3116 3017 148 201 3366
270 Rapeseed 4127 0 30 4157 4183 0 32 4215 4111 0 51 4162 4173 0 30 4203 1703 231 336 2270
328 Seed cotton 2505 0 738 3243 395 0 129 524 0 0 0 0 2515 0 736 3251 2282 1306 440 4028
333 Linseed 1359 15 0 1374 1337 44 0 1381 1500 2 0 1502 1349 25 0 1374 4730 268 170 5168
358 Cabbages and other brassicas
185 185 21 391 232 143 27 402 359 10 79 448 175 200 20 395 181 26 73 280
366 Artichokes 625 87 37 749 540 200 36 776 353 397 53 803 614 106 36 756 478 242 98 818
372 Lettuce and chicory
59 4 11 74 57 7 12 76 73 0 22 95 58 6 11 75 133 28 77 238
373 Spinash 114 12 22 148 110 16 23 149 144 0 45 189 110 17 21 148 118 14 160 292

Product
code (FAOSAT)
Product description (FAOSTAT)
North Central South Tunisia average World average
Green Blue Grey Total Green Blue Grey Total Green Blue Grey Total Green Blue Grey Total Green Blue Grey Total
388 Tomatoes 69 39 8 116 76 36 9 121 149 1 23 173 60 48 8 116 108 63 43 214
393 Cauliflowes and brocolli
82 4 15 101 79 7 15 101 99 0 28 127 80 6 15 101 189 21 75 285
394 Pumpkins squash and
grouds
153 2 31 186 151 4 31 186 152 37 33 222 153 2 31 186 228 24 84 336
397 Cumcumbers and gherkins
92 95 13 200 125 73 18 216 252 7 53 312 87 102 12 201 206 42 105 353
399 Eggplants (aubergines)
134 4 18 156 131 6 18 155 174 1 27 202 133 5 18 156 234 33 95 362
401 Chillies and peppers, green
158 5 22 185 156 7 23 186 214 0 40 254 157 7 22 186 240 42 97 379
402 Onions (inc. shallots), green
62 12 12 86 62 13 13 88 106 0 34 140 59 15 12 86 176 44 51 271
403 Onions, dry 199 66 17 282 214 62 21 297 422 8 77 507 189 77 17 283 192 88 65 345
406 Garlic 1110 407 104 1621 1201 374 123 1698 2371 61 462 2894 1054 469 102 1625 337 81 170 588
414 Beans, green 187 2 41 230 181 9 42 232 252 0 75 327 186 5 42 233 320 54 188 562
417 Peas, green 309 4 54 367 295 16 55 366 411 1 90 502 304 9 54 367 382 63 150 595
426 Carrots and turnips
285 500 35 820 487 384 65 936 674 29 152 855 260 529 33 822 106 28 61 195
463 Vegetables fresh nes
147 6 21 174 143 9 22 174 205 1 46 252 144 9 21 174 205 33 101 339
490 Oranges 373 218 22 613 374 235 24 633 214 506 26 746 367 228 22 617 401 110 49 560
495 Tangerines, mandarins, clem.
551 322 33 906 553 348 36 937 317 748 38 1103 543 337 32 912 479 118 152 749
497 Lemons and limes
305 178 18 501 306 192 20 518 175 414 21 610 311 193 18 522 432 152 58 642
507 Grapefruit (inc.pomelos)
233 136 14 383 235 147 15 397 133 315 16 464 229 142 14 385 367 85 54 506
512 Citrus fruit, nes 456 260 27 743 459 280 29 768 264 610 32 906 445 276 26 747 1145 62 35 1242
515 Apples 1224 0 65 1289 1265 0 73 1338 1551 0 138 1689 1278 0 67 1345 561 133 127 821
521 Pears 1154 0 61 1215 1193 0 69 1262 0 0 0 0 1194 0 63 1257 645 94 183 922
526 Apricots 1720 0 93 1813 1785 0 105 1890 2191 0 198 2389 1761 0 98 1859 694 502 92 1288
531 Cherries 285 0 8 293 109 0 6 115 128 0 12 140 107 0 6 113 961 531 112 1604
534 Peaches and nectarines
1110 0 60 1170 1149 0 68 1217 1410 0 127 1537 1120 0 63 1183 583 188 139 910

Product
code (FAOSAT)
Product description (FAOSTAT)
North Central South Tunisia average World average
Green Blue Grey Total Green Blue Grey Total Green Blue Grey Total Green Blue Grey Total Green Blue Grey Total
536 Plums and sloes 1347 0 71 1418 1392 0 80 1472 1634 0 156 1790 1389 0 73 1462 1570 188 422 2180
541 Stone fruit, nes 935 0 50 985 956 0 56 1012 1122 0 108 1230 930 0 50 980 868 1049 136 2053
544 Strawberries 77 161 11 249 71 178 11 260 31 266 12 309 88 176 12 276 201 109 37 347
554 Cranberries 234 0 44 278 259 0 53 312 148 0 65 213 232 0 43 275 91 108 77 276
560 Grapes 781 1119 68 1968 706 1290 68 2064 447 1868 68 2383 554 1082 55 1691 425 97 87 609
567 Watermelons 226 11 19 256 236 10 21 267 345 0 38 383 226 13 19 258 150 25 63 238
568 Other melons (inc.cantaloupes)
123 2 24 149 121 3 24 148 154 0 29 183 124 2 24 150 125 29 67 221
569 Figs 2838 1677 171 4686 3455 1204 219 4878 4936 820 503 6259 2810 1744 167 4721 1504 1544 227 3275
572 Avocados 474 49 29 552 423 118 28 569 320 260 45 625 468 58 28 554 849 237 87 1173
577 Dates 0 0 0 0 0 0 0 0 1036 3285 84 4405 1032 3271 84 4387 930 1250 98 2278
592 Kiwi fruit 693 95 43 831 615 195 43 853 374 351 50 775 673 116 42 831 307 168 38 513
603 Fruit, tropical fresh nes
648 0 34 682 670 0 39 709 642 0 69 711 652 0 34 686 1455 200 172 1827
619 Fruit Fresh Nes 382 0 20 402 394 0 23 417 463 0 44 507 833 0 44 877 1199 201 112 1512
689 Chillies and peppers, dry
1820 242 117 2179 1629 501 117 2247 888 909 134 1931 1775 295 112 2182 5869 1125 371 7365
711 Anise, badian, fennel, corian.
2327 134 353 2814 2267 196 365 2828 3241 6 644 3891 2278 189 350 2817 5369 1865 1046 8280
723 Spices, nes 1977 127 262 2366 1894 219 278 2391 2957 8 698 3663 1913 198 260 2371 2735 242 390 3367
826 Tobacco, unmanufactured
2150 522 306 2978 2010 761 309 3080 1325 2161 312 3798 2096 593 306 2995 2021 205 700 2926
Source: Mekonnen and Hoekstra (2011)
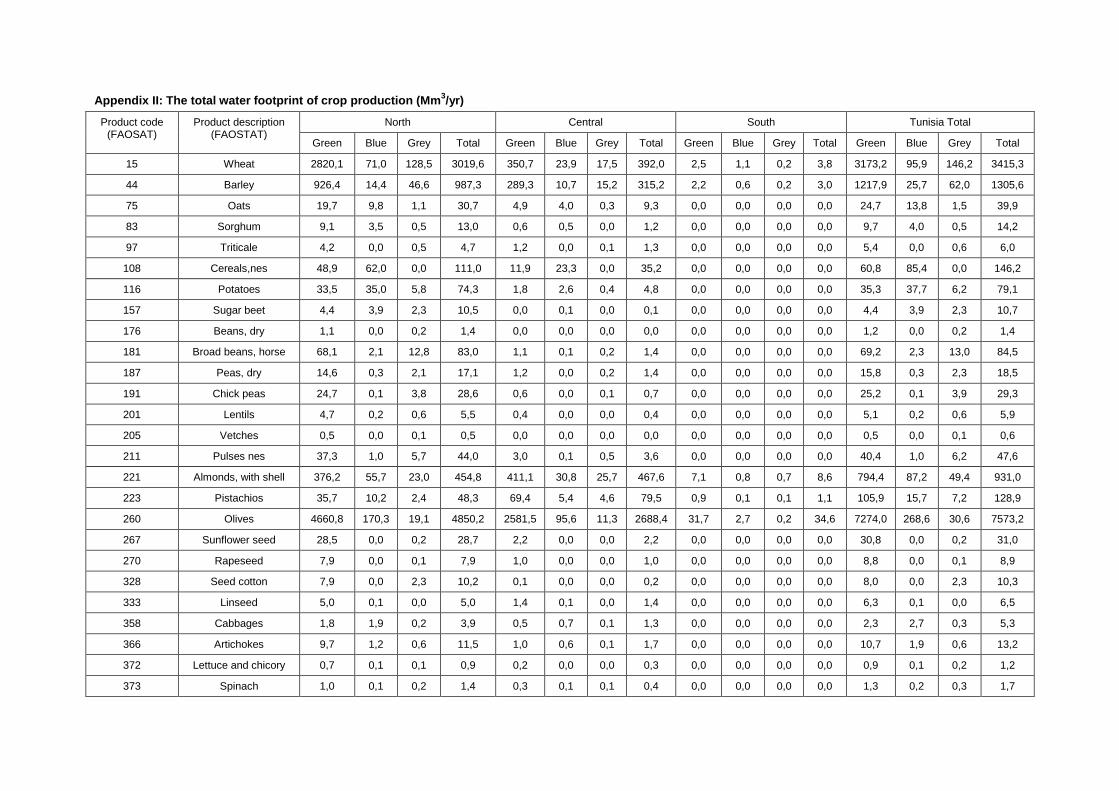
Appendix II: The total water footprint of crop production (Mm3/yr)
Product code (FAOSAT)
Product description (FAOSTAT)
North Central South Tunisia Total
Green Blue Grey Total Green Blue Grey Total Green Blue Grey Total Green Blue Grey Total
15 Wheat 2820,1 71,0 128,5 3019,6 350,7 23,9 17,5 392,0 2,5 1,1 0,2 3,8 3173,2 95,9 146,2 3415,3
44 Barley 926,4 14,4 46,6 987,3 289,3 10,7 15,2 315,2 2,2 0,6 0,2 3,0 1217,9 25,7 62,0 1305,6
75 Oats 19,7 9,8 1,1 30,7 4,9 4,0 0,3 9,3 0,0 0,0 0,0 0,0 24,7 13,8 1,5 39,9
83 Sorghum 9,1 3,5 0,5 13,0 0,6 0,5 0,0 1,2 0,0 0,0 0,0 0,0 9,7 4,0 0,5 14,2
97 Triticale 4,2 0,0 0,5 4,7 1,2 0,0 0,1 1,3 0,0 0,0 0,0 0,0 5,4 0,0 0,6 6,0
108 Cereals,nes 48,9 62,0 0,0 111,0 11,9 23,3 0,0 35,2 0,0 0,0 0,0 0,0 60,8 85,4 0,0 146,2
116 Potatoes 33,5 35,0 5,8 74,3 1,8 2,6 0,4 4,8 0,0 0,0 0,0 0,0 35,3 37,7 6,2 79,1
157 Sugar beet 4,4 3,9 2,3 10,5 0,0 0,1 0,0 0,1 0,0 0,0 0,0 0,0 4,4 3,9 2,3 10,7
176 Beans, dry 1,1 0,0 0,2 1,4 0,0 0,0 0,0 0,0 0,0 0,0 0,0 0,0 1,2 0,0 0,2 1,4
181 Broad beans, horse 68,1 2,1 12,8 83,0 1,1 0,1 0,2 1,4 0,0 0,0 0,0 0,0 69,2 2,3 13,0 84,5
187 Peas, dry 14,6 0,3 2,1 17,1 1,2 0,0 0,2 1,4 0,0 0,0 0,0 0,0 15,8 0,3 2,3 18,5
191 Chick peas 24,7 0,1 3,8 28,6 0,6 0,0 0,1 0,7 0,0 0,0 0,0 0,0 25,2 0,1 3,9 29,3
201 Lentils 4,7 0,2 0,6 5,5 0,4 0,0 0,0 0,4 0,0 0,0 0,0 0,0 5,1 0,2 0,6 5,9
205 Vetches 0,5 0,0 0,1 0,5 0,0 0,0 0,0 0,0 0,0 0,0 0,0 0,0 0,5 0,0 0,1 0,6
211 Pulses nes 37,3 1,0 5,7 44,0 3,0 0,1 0,5 3,6 0,0 0,0 0,0 0,0 40,4 1,0 6,2 47,6
221 Almonds, with shell 376,2 55,7 23,0 454,8 411,1 30,8 25,7 467,6 7,1 0,8 0,7 8,6 794,4 87,2 49,4 931,0
223 Pistachios 35,7 10,2 2,4 48,3 69,4 5,4 4,6 79,5 0,9 0,1 0,1 1,1 105,9 15,7 7,2 128,9
260 Olives 4660,8 170,3 19,1 4850,2 2581,5 95,6 11,3 2688,4 31,7 2,7 0,2 34,6 7274,0 268,6 30,6 7573,2
267 Sunflower seed 28,5 0,0 0,2 28,7 2,2 0,0 0,0 2,2 0,0 0,0 0,0 0,0 30,8 0,0 0,2 31,0
270 Rapeseed 7,9 0,0 0,1 7,9 1,0 0,0 0,0 1,0 0,0 0,0 0,0 0,0 8,8 0,0 0,1 8,9
328 Seed cotton 7,9 0,0 2,3 10,2 0,1 0,0 0,0 0,2 0,0 0,0 0,0 0,0 8,0 0,0 2,3 10,3
333 Linseed 5,0 0,1 0,0 5,0 1,4 0,1 0,0 1,4 0,0 0,0 0,0 0,0 6,3 0,1 0,0 6,5
358 Cabbages 1,8 1,9 0,2 3,9 0,5 0,7 0,1 1,3 0,0 0,0 0,0 0,0 2,3 2,7 0,3 5,3
366 Artichokes 9,7 1,2 0,6 11,5 1,0 0,6 0,1 1,7 0,0 0,0 0,0 0,0 10,7 1,9 0,6 13,2
372 Lettuce and chicory 0,7 0,1 0,1 0,9 0,2 0,0 0,0 0,3 0,0 0,0 0,0 0,0 0,9 0,1 0,2 1,2
373 Spinach 1,0 0,1 0,2 1,4 0,3 0,1 0,1 0,4 0,0 0,0 0,0 0,0 1,3 0,2 0,3 1,7

Product code (FAOSAT)
Product description (FAOSTAT)
North Central South Tunisia Total
Green Blue Grey Total Green Blue Grey Total Green Blue Grey Total Green Blue Grey Total
388 Tomatoes 39,9 29,1 5,1 74,1 11,2 11,3 1,6 24,1 0,0 0,0 0,0 0,0 51,1 40,4 6,7 98,3
393 Cauliflowers and broccoli 0,5 0,0 0,1 0,6 0,1 0,0 0,0 0,2 0,0 0,0 0,0 0,0 0,6 0,0 0,1 0,7
394 Pumpkins 4,7 0,1 0,9 5,6 0,6 0,0 0,1 0,8 0,0 0,0 0,0 0,0 5,3 0,1 1,1 6,5
397 Cucumbers 2,0 2,2 0,3 4,5 0,6 0,8 0,1 1,5 0,0 0,0 0,0 0,0 2,6 3,0 0,4 6,0
399 Eggplants (aubergines) 0,0 0,0 0,0 0,0 0,0 0,0 0,0 0,0 0,0 0,0 0,0 0,0 0,0 0,0 0,0 0,0
401 Chillies and peppers, green 25,7 0,9 3,6 30,1 8,1 0,7 1,2 10,0 0,0 0,0 0,0 0,0 33,7 1,5 4,8 40,1
402 Onions (incl. shallots), green 6,0 1,3 1,2 8,5 1,5 0,6 0,3 2,5 0,0 0,0 0,0 0,0 7,5 2,0 1,5 11,0
403 Onions, dry 17,3 6,3 1,5 25,0 5,0 2,8 0,5 8,2 0,0 0,0 0,0 0,0 22,2 9,0 2,0 33,3
406 Garlic 5,1 2,0 0,5 7,6 1,5 0,9 0,2 2,5 0,0 0,0 0,0 0,0 6,6 2,9 0,6 10,1
414 Beans, green 0,4 0,0 0,1 0,4 0,1 0,0 0,0 0,1 0,0 0,0 0,0 0,0 0,5 0,0 0,1 0,6
417 Peas, green 3,9 0,1 0,7 4,6 1,0 0,1 0,2 1,3 0,0 0,0 0,0 0,0 4,9 0,1 0,9 5,9
426 Carrots and turnips 9,2 17,8 1,1 28,2 2,8 6,7 0,4 9,9 0,0 0,0 0,0 0,0 12,1 24,5 1,5 38,1
461 Carobs 0,0 0,0 0,0 0,0 3,6 0,1 0,1 3,8 0,0 0,0 0,0 0,0 3,6 0,1 0,1 3,8
463 Vegetables fresh nes 8,4 0,4 1,2 9,9 2,5 0,3 0,4 3,1 0,0 0,0 0,0 0,0 10,8 0,7 1,6 13,1
490 Oranges 35,9 21,6 2,1 59,5 3,3 2,7 0,2 6,3 0,0 0,1 0,0 0,1 39,2 24,3 2,3 65,9
495 Tangerines, mandarins 18,2 11,0 1,1 30,3 1,7 1,4 0,1 3,2 0,0 0,0 0,0 0,0 20,0 12,4 1,2 33,5
497 Lemons and limes 5,6 3,4 0,3 9,3 0,5 0,4 0,0 1,0 0,0 0,0 0,0 0,0 6,1 3,8 0,4 10,3
507 Grapefruit 12,6 7,6 0,7 21,0 1,2 1,0 0,1 2,2 0,0 0,0 0,0 0,0 13,8 8,6 0,8 23,2
512 Citrus fruit, nes 25,1 15,0 1,5 41,5 2,3 1,9 0,1 4,3 0,0 0,0 0,0 0,1 27,4 16,9 1,6 45,9
515 Apples 105,8 0,0 5,5 111,3 21,1 0,0 1,2 22,3 0,3 0,0 0,0 0,3 127,2 0,0 6,7 133,9
521 Pears 55,1 0,0 2,9 58,0 11,0 0,0 0,6 11,6 0,0 0,0 0,0 0,0 66,1 0,0 3,5 69,6
526 Apricots 17,4 0,0 0,9 18,4 30,0 0,0 1,7 31,7 0,1 0,0 0,0 0,1 47,5 0,0 2,6 50,1
534 Peaches and nectarines 68,6 0,0 3,8 72,3 18,4 0,0 1,1 19,5 0,1 0,0 0,0 0,1 87,0 0,0 4,9 91,9

Product code (FAOSAT)
Product description (FAOSTAT)
North Central South Tunisia Total
Green Blue Grey Total Green Blue Grey Total Green Blue Grey Total Green Blue Grey Total
536 Plums and sloes 15,8 0,0 0,8 16,6 3,1 0,0 0,2 3,3 0,0 0,0 0,0 0,0 19,0 0,0 1,0 20,0
541 Stone fruit, nes 2,6 0,0 0,1 2,7 0,2 0,0 0,0 0,2 0,0 0,0 0,0 0,0 2,8 0,0 0,1 2,9
544 Strawberries 0,6 1,2 0,1 1,8 0,0 0,1 0,0 0,2 0,0 0,0 0,0 0,0 0,6 1,3 0,1 2,0
554 Cranberries 0,0 0,0 0,0 0,0 0,0 0,0 0,0 0,0 0,0 0,0 0,0 0,0 0,0 0,0 0,0 0,0
560 Grapes 27,7 43,4 2,6 73,6 30,6 54,5 2,9 87,9 7,6 30,9 1,2 39,7 65,9 128,7 6,6 201,2
567 Watermelons 59,0 3,0 5,0 66,9 17,2 1,4 1,6 20,2 0,2 0,0 0,0 0,2 76,3 4,5 6,6 87,4
568 Other melons 8,6 0,1 1,6 10,3 2,6 0,1 0,5 3,2 0,0 0,0 0,0 0,0 11,2 0,2 2,2 13,6
569 Figs 61,8 38,7 3,6 104,1 8,2 4,9 0,5 13,6 0,3 0,0 0,0 0,3 70,3 43,6 4,2 118,0
572 Avocados 0,1 0,0 0,0 0,1 0,0 0,0 0,0 0,0 0,0 0,0 0,0 0,0 0,1 0,0 0,0 0,1
577 Dates 0,0 0,0 0,0 0,0 0,0 0,0 0,0 0,0 109,9 348,5 8,9 467,4 109,9 348,5 8,9 467,4
592 Kiwi fruit 0,0 0,0 0,0 0,0 0,0 0,0 0,0 0,0 0,0 0,0 0,0 0,0 0,0 0,0 0,0 0,0
603 Fruit, tropical fresh nes 45,4 0,0 2,3 47,7 3,7 0,0 0,2 3,9 0,0 0,0 0,0 0,0 49,1 0,0 2,5 51,6
619 Fruit Fresh Nes 45,1 0,0 2,3 47,5 9,0 0,0 0,5 9,5 0,1 0,0 0,0 0,1 54,3 0,0 2,9 57,1
689 Chillies and peppers, dry 11,2 1,3 0,7 13,3 1,2 0,7 0,1 2,0 0,0 0,0 0,0 0,0 12,4 2,1 0,8 15,3
711 Anise, badian, fennel 17,6 1,1 2,6 21,4 4,5 0,7 0,8 6,0 0,0 0,0 0,0 0,0 22,2 1,8 3,4 27,4
723 Spices, nes 3,4 0,2 0,4 4,0 0,8 0,2 0,1 1,1 0,0 0,0 0,0 0,0 4,2 0,4 0,6 5,2
826 Tobacco 4,6 1,2 0,7 6,5 1,5 0,6 0,2 2,3 0,0 0,0 0,0 0,0 6,1 1,7 0,9 8,7
900 Fodder crops 728,6 0,0 20,9 749,5 57,2 0,0 1,8 59,0 0,6 0,0 0,0 0,6 786,4 0,0 22,8 809,1
Total WF (Mm3/yr) 10651,8 651,7 337,5 11641,1 4003,4 293,5 96,4 4393,2 163,9 385,0 11,7 560,6 14819 1330 446 16595
Source: Mekonnen and Hoekstra (2011)


Value of Water Research Report Series
Editorial board: A.Y. Hoekstra, University of Twente; H.H.G. Savenije, Delft University of Technology; P. van der Zaag, UNESCO-IHE.
1. Exploring methods to assess the value of water: A case study on the Zambezi basin
A.K. Chapagain February 2000
2. Water value flows: A case study on the Zambezi basin.
A.Y. Hoekstra, H.H.G. Savenije and A.K. Chapagain March 2000
3. The water value-flow concept
I.M. Seyam and A.Y. Hoekstra December 2000
4. The value of irrigation water in Nyanyadzi smallholder irrigation scheme, Zimbabwe
G.T. Pazvakawambwa and P. van der Zaag – January 2001
5. The economic valuation of water: Principles and methods
J.I. Agudelo – August 2001
6. The economic valuation of water for agriculture: A simple method applied to the eight Zambezi basin countries
J.I. Agudelo and A.Y. Hoekstra – August 2001
7. The value of freshwater wetlands in the Zambezi basin
I.M. Seyam, A.Y. Hoekstra, G.S. Ngabirano and H.H.G. Savenije – August 2001
8. ‘Demand management’ and ‘Water as an economic good’: Paradigms with pitfalls
H.H.G. Savenije and P. van der Zaag – October 2001
9. Why water is not an ordinary economic good
H.H.G. Savenije – October 2001
10. Calculation methods to assess the value of upstream water flows and storage as a function of downstream benefits
I.M. Seyam, A.Y. Hoekstra and H.H.G. Savenije – October 2001
11. Virtual water trade: A quantification of virtual water flows between nations in relation to international crop trade
A.Y. Hoekstra and P.Q. Hung – September 2002
12. Virtual water trade: Proceedings of the international expert meeting on virtual water trade
A.Y. Hoekstra (ed.) – February 2003
13. Virtual water flows between nations in relation to trade in livestock and livestock products
A.K. Chapagain and A.Y. Hoekstra – July 2003
14. The water needed to have the Dutch drink coffee
A.K. Chapagain and A.Y. Hoekstra – August 2003
15. The water needed to have the Dutch drink tea
A.K. Chapagain and A.Y. Hoekstra – August 2003
16. Water footprints of nations, Volume 1: Main Report, Volume 2: Appendices
A.K. Chapagain and A.Y. Hoekstra – November 2004
17. Saving water through global trade
A.K. Chapagain, A.Y. Hoekstra and H.H.G. Savenije – September 2005
18. The water footprint of cotton consumption
A.K. Chapagain, A.Y. Hoekstra, H.H.G. Savenije and R. Gautam – September 2005
19. Water as an economic good: the value of pricing and the failure of markets
P. van der Zaag and H.H.G. Savenije – July 2006
20. The global dimension of water governance: Nine reasons for global arrangements in order to cope with local water problems
A.Y. Hoekstra – July 2006
21. The water footprints of Morocco and the Netherlands
A.Y. Hoekstra and A.K. Chapagain – July 2006
22. Water’s vulnerable value in Africa
P. van der Zaag – July 2006
23. Human appropriation of natural capital: Comparing ecological footprint and water footprint analysis
A.Y. Hoekstra – July 2007
24. A river basin as a common-pool resource: A case study for the Jaguaribe basin in Brazil
P.R. van Oel, M.S. Krol and A.Y. Hoekstra – July 2007
25. Strategic importance of green water in international crop trade
M.M. Aldaya, A.Y. Hoekstra and J.A. Allan – March 2008
26. Global water governance: Conceptual design of global institutional arrangements
M.P. Verkerk, A.Y. Hoekstra and P.W. Gerbens-Leenes – March 2008
27. Business water footprint accounting: A tool to assess how production of goods and services impact on freshwater resources worldwide
P.W. Gerbens-Leenes and A.Y. Hoekstra – March 2008
28. Water neutral: reducing and offsetting the impacts of water footprints
A.Y. Hoekstra – March 2008
29. Water footprint of bio-energy and other primary energy carriers
P.W. Gerbens-Leenes, A.Y. Hoekstra and Th.H. van der Meer – March 2008
30. Food consumption patterns and their effect on water requirement in China
J. Liu and H.H.G. Savenije – March 2008
31. Going against the flow: A critical analysis of virtual water trade in the context of India’s National River Linking Programme
S. Verma, D.A. Kampman, P. van der Zaag and A.Y. Hoekstra – March 2008
32. The water footprint of India
D.A. Kampman, A.Y. Hoekstra and M.S. Krol – May 2008

33. The external water footprint of the Netherlands: Quantification and impact assessment
P.R. van Oel, M.M. Mekonnen and A.Y. Hoekstra – May 2008
34. The water footprint of bio-energy: Global water use for bio-ethanol, bio-diesel, heat and electricity
P.W. Gerbens-Leenes, A.Y. Hoekstra and Th.H. van der Meer – August 2008
35. Water footprint analysis for the Guadiana river basin
M.M. Aldaya and M.R. Llamas – November 2008
36. The water needed to have Italians eat pasta and pizza
M.M. Aldaya and A.Y. Hoekstra – May 2009
37. The water footprint of Indonesian provinces related to the consumption of crop products
F. Bulsink, A.Y. Hoekstra and M.J. Booij – May 2009
38. The water footprint of sweeteners and bio-ethanol from sugar cane, sugar beet and maize
P.W. Gerbens-Leenes and A.Y. Hoekstra – November 2009
39. A pilot in corporate water footprint accounting and impact assessment: The water footprint of a sugar-containing carbonated beverage
A.E. Ercin, M.M. Aldaya and A.Y. Hoekstra – November 2009
40. The blue, green and grey water footprint of rice from both a production and consumption perspective
A.K. Chapagain and A.Y. Hoekstra – March 2010
41. Water footprint of cotton, wheat and rice production in Central Asia
M.M. Aldaya, G. Muñoz and A.Y. Hoekstra – March 2010
42. A global and high-resolution assessment of the green, blue and grey water footprint of wheat
M.M. Mekonnen and A.Y. Hoekstra – April 2010
43. Biofuel scenarios in a water perspective: The global blue and green water footprint of road transport in 2030
A.R. van Lienden, P.W. Gerbens-Leenes, A.Y. Hoekstra and Th.H. van der Meer – April 2010
44. Burning water: The water footprint of biofuel-based transport
P.W. Gerbens-Leenes and A.Y. Hoekstra – June 2010
45. Mitigating the water footprint of export cut flowers from the Lake Naivasha Basin, Kenya
M.M. Mekonnen and A.Y. Hoekstra – June 2010
46. The green and blue water footprint of paper products: methodological considerations and quantification
P.R. van Oel and A.Y. Hoekstra – July 2010
47. The green, blue and grey water footprint of crops and derived crop products
M.M. Mekonnen and A.Y. Hoekstra – December 2010
48. The green, blue and grey water footprint of animals and derived animal products
M.M. Mekonnen and A.Y. Hoekstra – December 2010
49. The water footprint of soy milk and soy burger and equivalent animal products
A.E. Ercin, M.M. Aldaya and A.Y. Hoekstra – February 2011
50. National water footprint accounts: The green, blue and grey water footprint of production and consumption
M.M. Mekonnen and A.Y. Hoekstra – May 2011
51. The water footprint of electricity from hydropower
M.M. Mekonnen and A.Y. Hoekstra – June 2011
52. The relation between national water management and international trade: a case study from Kenya
M.M. Mekonnen and A.Y. Hoekstra – June 2011
53. Global water scarcity: The monthly blue water footprint compared to blue water availability for the world’s major river basins
A.Y. Hoekstra and M.M. Mekonnen – September 2011
54. Proceedings of the ESF Strategic Workshop on accounting for water scarcity and pollution in the rules of international trade
A.Y. Hoekstra, M.M. Aldaya and B. Avril (eds.) – October 2011
55. A comparative study on the water footprint of poultry, pork and beef in different countries and production systems
P.W. Gerbens-Leenes, M.M. Mekonnen and A.Y. Hoekstra – December 2011
56. The water footprint of France
A.E. Ercin, M.M. Mekonnen and A.Y. Hoekstra – March 2012
57. The water footprint of Switzerland
A.E. Ercin, M.M. Mekonnen and A.Y. Hoekstra – March 2012
58. Blue water footprint of agriculture, industry, households and water management in the Netherlands
A.Y. Hoekstra, M.J. Booij, J.C Hunink and K.S. Meijer – June 2012
59. Water footprint scenarios for 2050: A global analysis and case study for Europe
A.E. Ercin and A.Y. Hoekstra – September 2012
60. Proceedings of the session "Solving the Water Crisis: Common Action Toward a Sustainable Water Footprint", Planet under Pressure
Conference, London, 26 March 2012
G.P. Zhang, A.Y. Hoekstra and D. Tickner (eds.) – October 2012
61. Water footprint of Tunisia from an economic perspective
H. Chouchane, A.Y. Hoekstra, M.S. Krol and M.M. Mekonnen – November 2013
Reports can be downloaded from:
www.waterfootprint.org
www.unesco-ihe.org/value-of-water-research-report-series


UNESCO-IHEP.O. Box 30152601 DA DelftThe Netherlands
Website www.unesco-ihe.orgPhone +31 15 2151715
University of Twente
Delft University of Technology